Contrast Sensitivity Impairment in Diabetic Retinopathy: Clinical and Structural Correlates
 , , , ,
  and
and
Abstract
1. Introduction
2. Materials and Methods
3. Pathophysiology of Visual Dysfunction in Diabetic Retinopathy
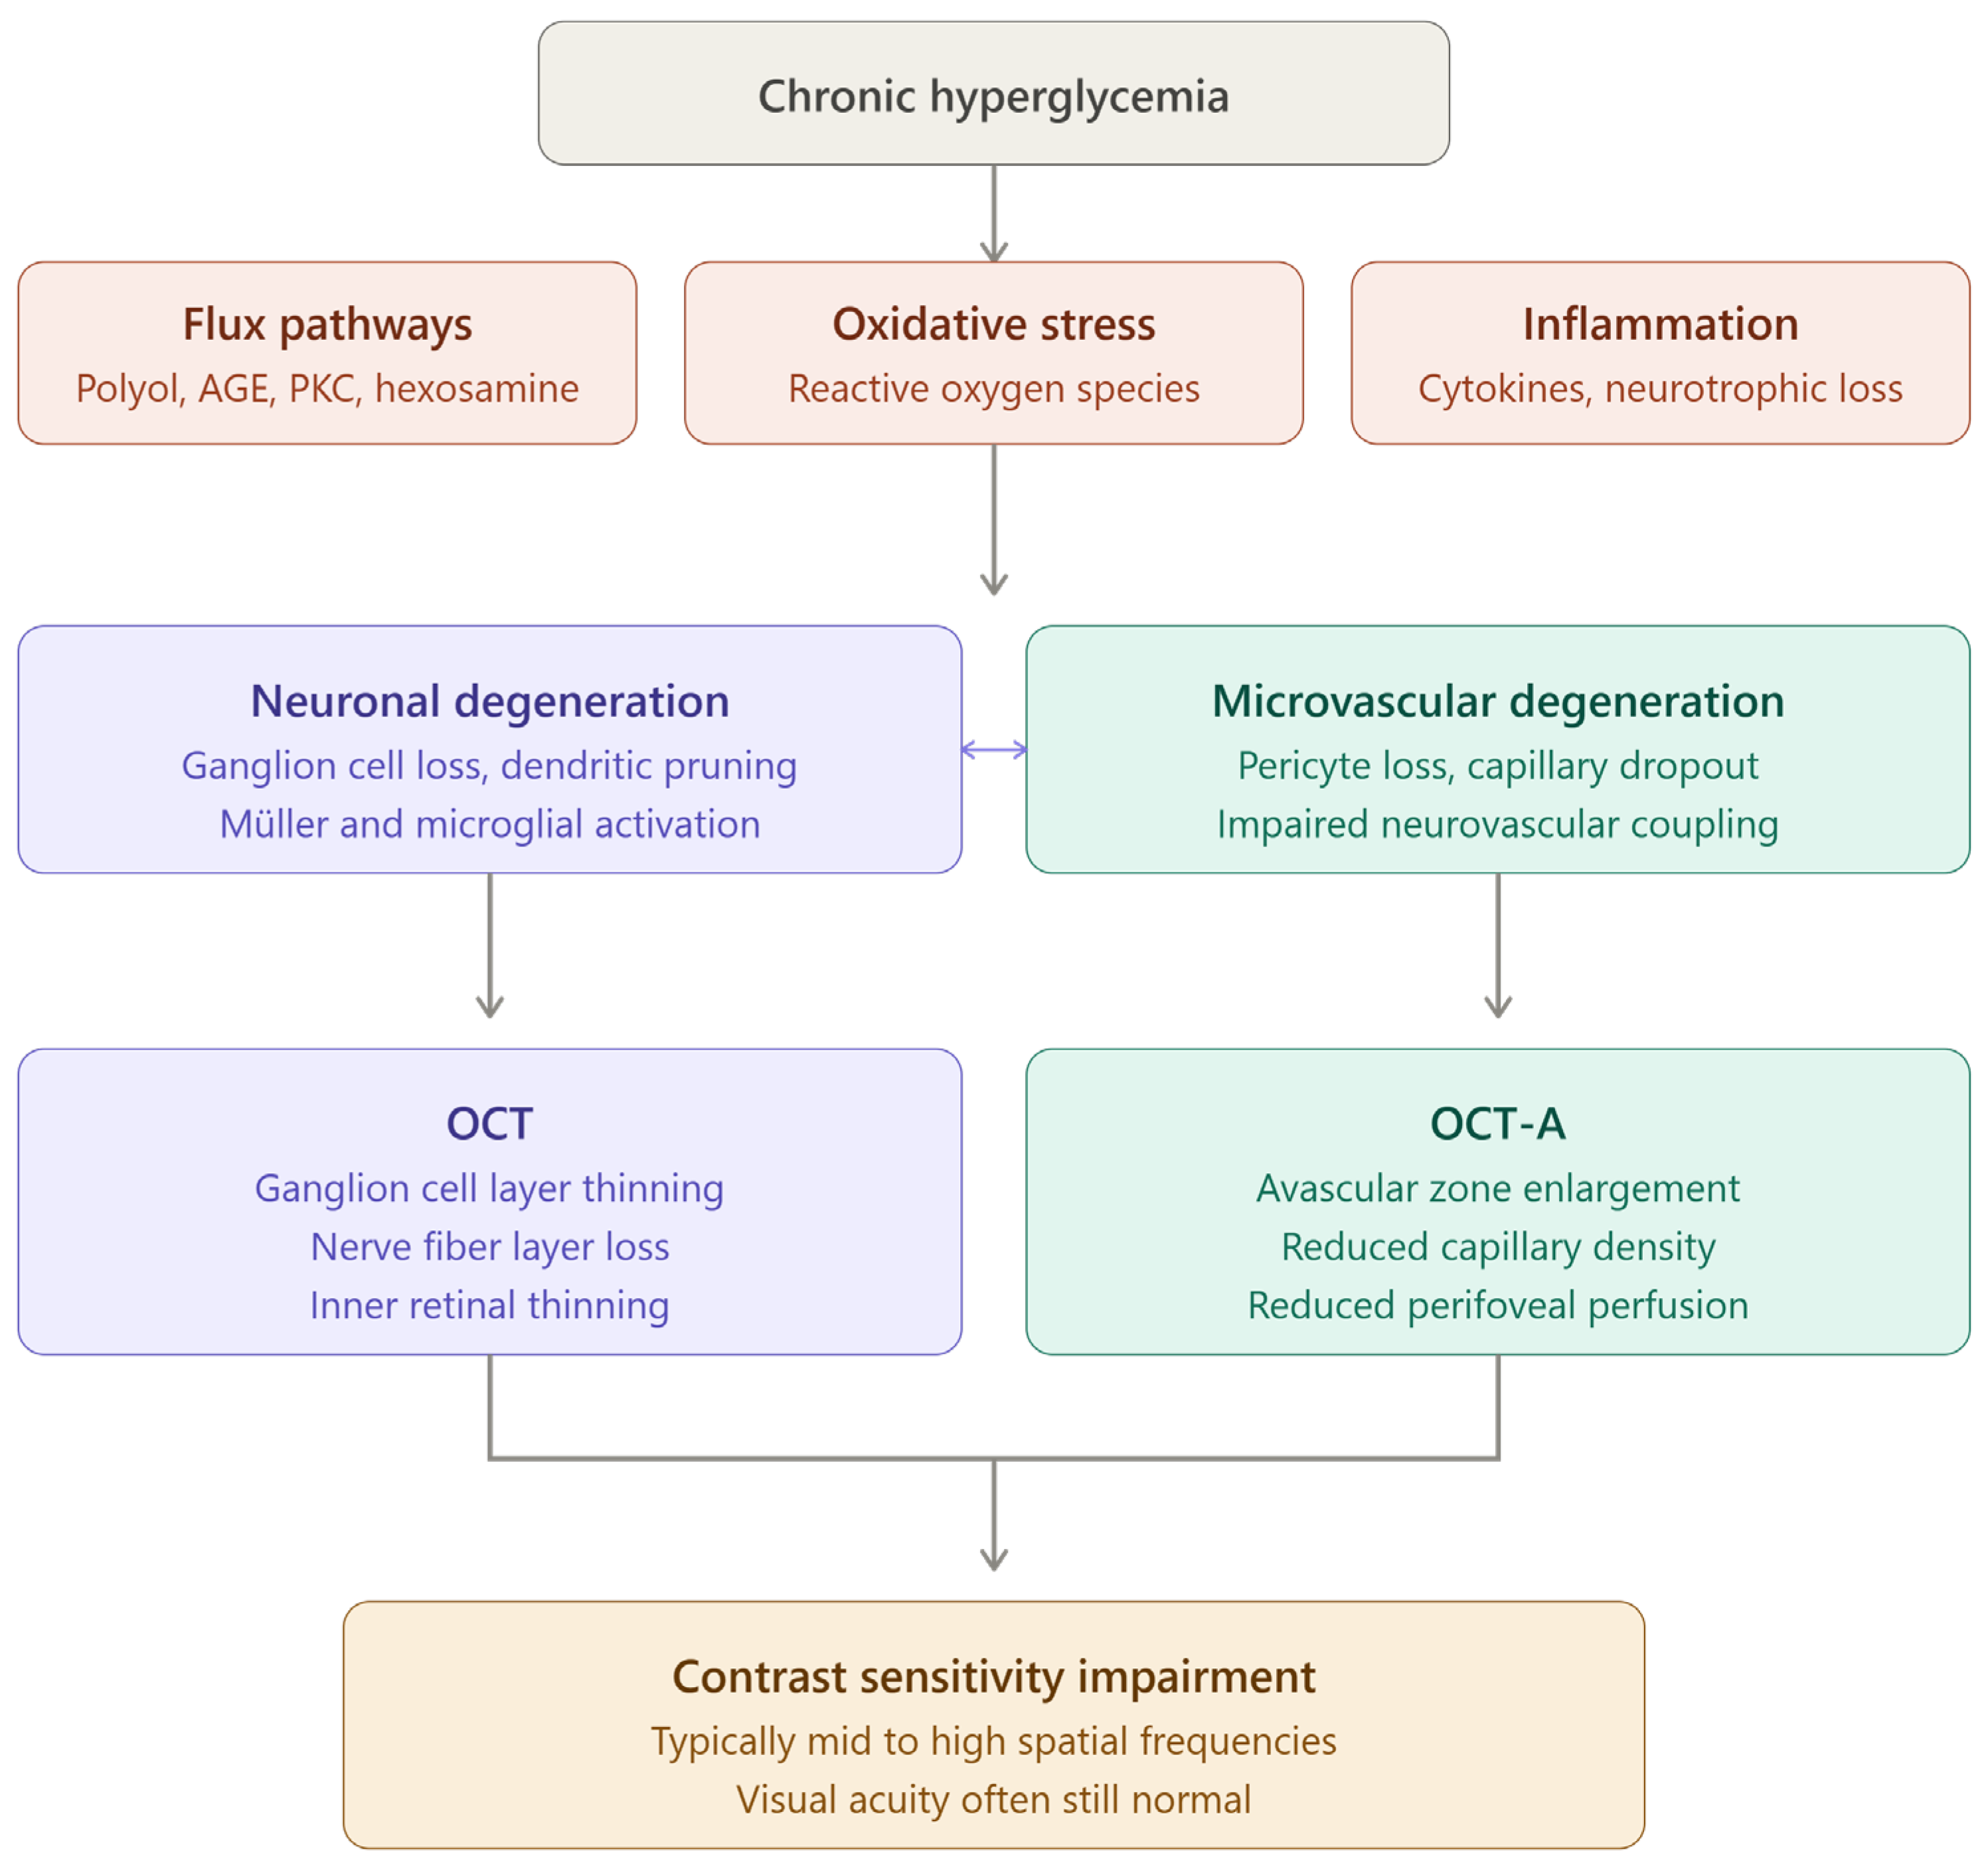
3.1. Hyperglycemia-Induced Metabolic Pathways
3.2. Retinal Neurodegeneration
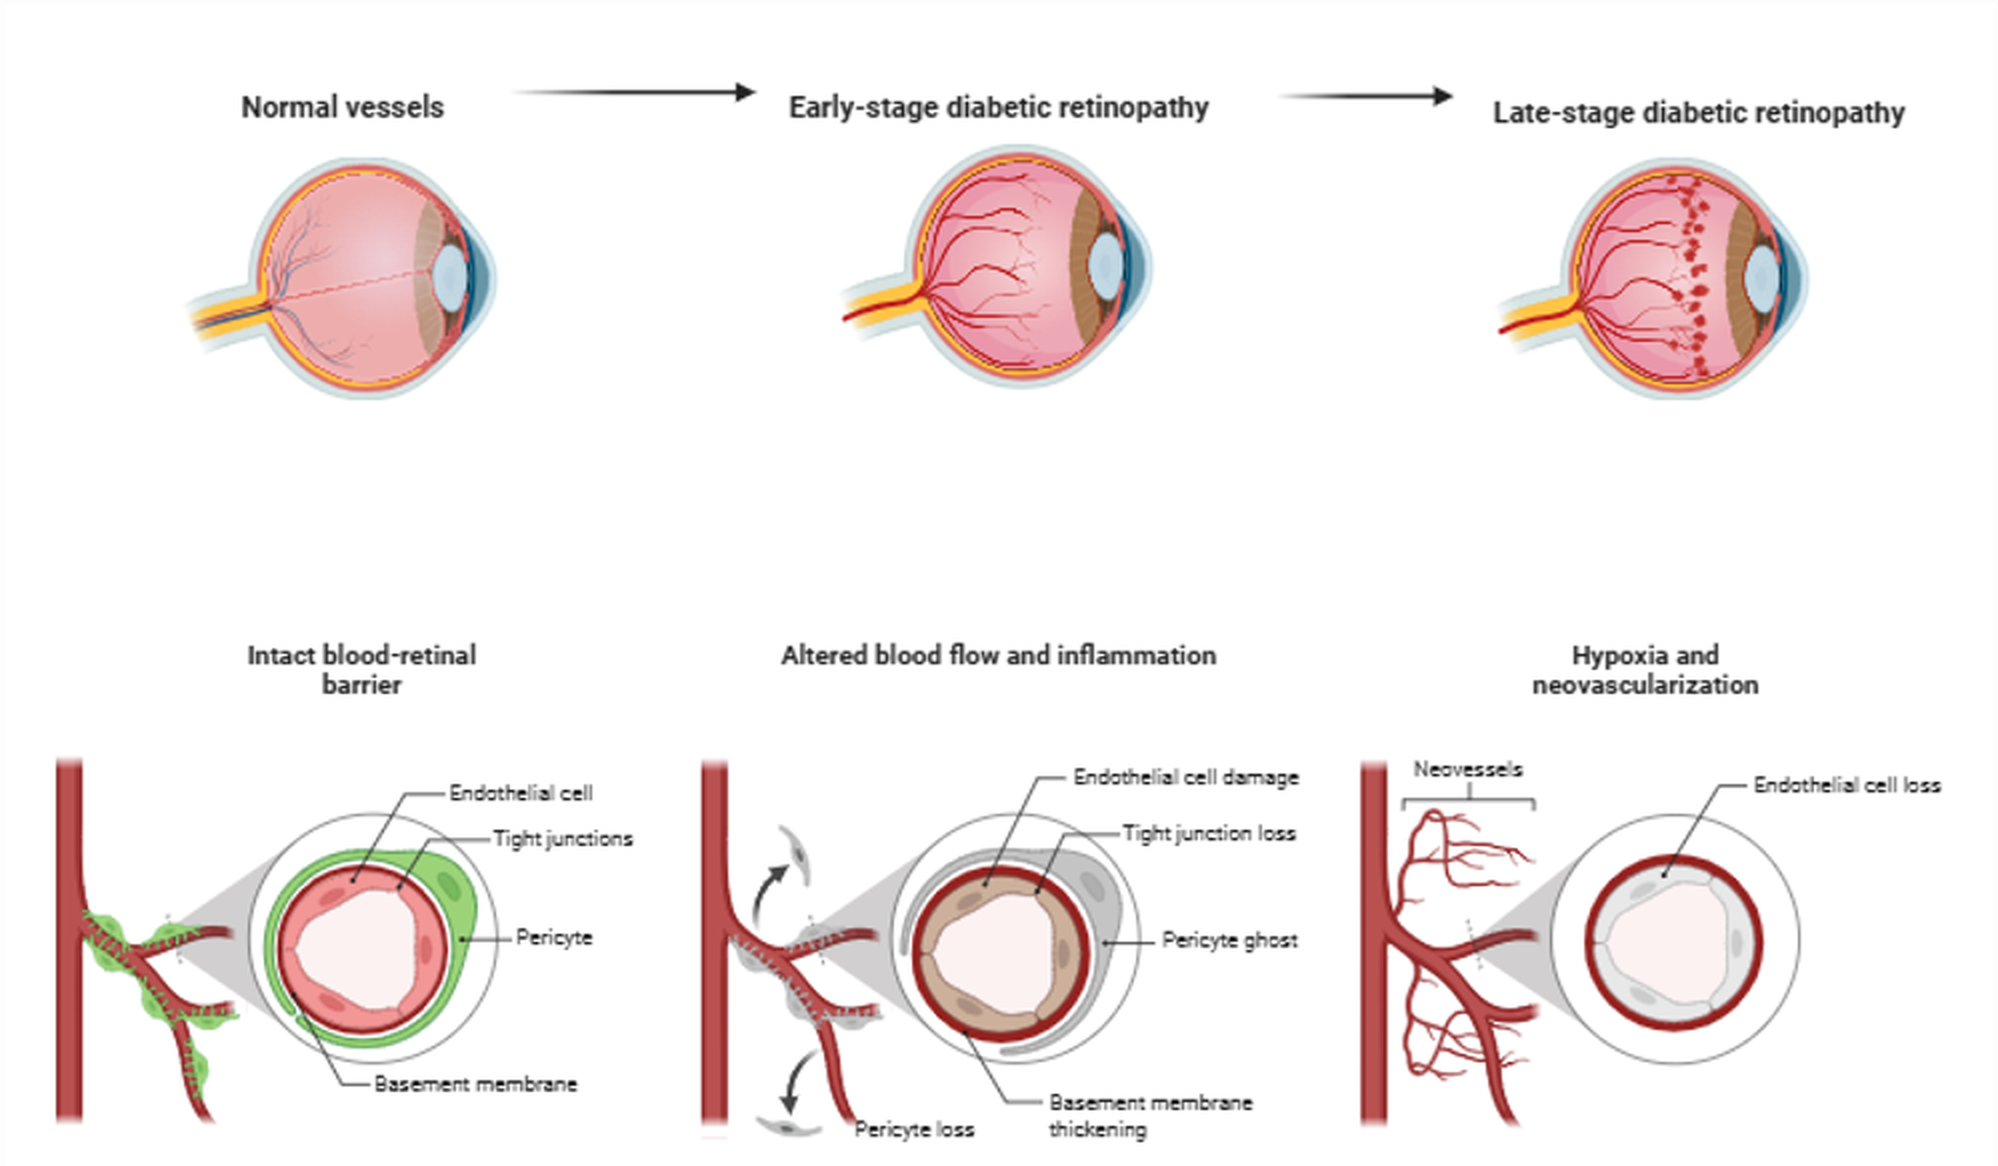
3.3. Microvascular Alterations
4. Contrast Sensitivity: Principles and Methods of Assessment

| Method | Spatial Frequency Coverage | Feasibility | Reproducibility | Clinical Applicability | Limitations |
|---|---|---|---|---|---|
| Pelli–Robson chart | Single, low spatial frequency | Quick (2–3 min), minimal training, inexpensive | Good test–retest reliability | Widely used in routine ophthalmologic practice | Cannot capture the full CSF; insensitive to frequency-specific deficits |
| CSV-1000 | 4 discrete frequencies (3, 6, 12, 18 cpd) | Backlit chart, fixed distance, few minutes per eye | Discrete contrast steps limit precision; systematic disagreement with other sine-wave grating devices, especially at low spatial frequencies | Feasible in clinic and research; more informative than single-frequency charts | Inter-device variability (even among similar sine-wave instruments) limits cross-study comparability |
| FACT (Functional Acuity Contrast Test) | 5 frequencies (1.5, 3, 6, 12, 18 cpd), sine-wave gratings | Chart-based, similar format to CSV-1000 | Better test–retest agreement than its predecessor (Vistech), but repeatability declines at higher spatial frequencies | Mainly research and specialized/refractive surgery settings; no studies using FACT were identified among the diabetic-retinopathy evidence reviewed | Reduced repeatability at higher frequencies; ceiling effects reported in some populations |
| Low-contrast visual acuity (LCVA, Sloan charts) | Not frequency-specific (letter-acuity based, at fixed reduced contrast levels) | Integrates directly into existing ETDRS-style workflows | Good reproducibility | Practical, easy to add to standard acuity testing | Remains influenced by visual acuity; does not isolate CS as a distinct functional measure |
| Computerized Gabor patch testing (photopic/mesopic) | Wide, continuous range; can test under multiple luminance conditions | Requires calibrated monitor, controlled room lighting, longer session (dark adaptation) | Reliable within-study, but luminance and testing protocols vary substantially between studies | Mainly research; valuable for detecting mesopic-specific deficits | Equipment-dependent; luminance not standardized across studies |
| Quantitative CSF (qCSF) | Full CSF estimated across a wide frequency and contrast range | Specialized software/hardware (Sentio platform, tablet-based), trained operator | High precision; strong test–retest reliability | Currently limited to research or specialized clinics; not yet practical for large-scale screening | Cost and equipment access are the main barriers to routine adoption |
5. Contrast Sensitivity Impairment in Diabetic Patients
5.1. Contrast Sensitivity in Diabetic Patients Without Clinically Visible Retinopathy
5.2. Contrast Sensitivity in Non-Proliferative Diabetic Retinopathy
5.3. Contrast Sensitivity in Diabetic Macular Edema
| Authors, Year | Study Type | Population (Sample Size) | CS Method | Testing Conditions | Imaging Method | Main Findings | Limitations |
|---|---|---|---|---|---|---|---|
| Georgakopoulos et al., 2011 [90] | Case–control | 60 children and adolescents with type 1 diabetes without DR versus 45 age- and gender-matched healthy controls | CSV-1000 contrast sensitivity testing at multiple spatial frequencies | photopic, monocular, 2.5 m | None | Significant reduction in CS at all spatial frequencies despite absence of clinically visible diabetic retinopathy; HbA1c inversely correlated with CS | No structural/imaging correlation performed |
| Katz et al., 2010 [82] | Case–control | 9 type 2 diabetic patients (17 eyes) without DR, and 7 healthy controls (14 eyes) | Computerized Gabor-target 4-AFC test (staircase method), SF 3–12 cpd | Photopic (20 cd/m2, dark room) and mesopic (0.9 cd/m2, neutral density filter); monocular, natural pupils, viewing distance 150 cm | OCT (Stratus, Carl Zeiss Meditec)—foveal avascular zone height and adjacent retinal maximal height | Mesopic CS was significantly reduced in diabetic patients despite normal OCT, normal fundus findings, and preserved visual acuity | Small, relatively homogeneous sample; no correlation found with HbA1c or duration, possibly due to sample size |
| Joltikov et al., 2018 [81] | Case–control | 57 diabetic patients without DR, mild NPDR, and moderate NPDR, and 18 healthy controls | Quick Contrast Sensitivity, AST Sentio Platform; AULCSF integrated 1.5–18 cpd | Monocular, tested after BCVA measurement, untested eye patched | SD-OCT (Spectralis HRA+OCT) | CS abnormalities detected earlier than visual acuity changes; OCT showed ganglion cell and inner plexiform layer thinning | Modest sample size; sex distribution imbalance across groups; lower-density SD-OCT scans may have limited DRIL detection sensitivity; larger 6 mm measurement ring limits comparability with prior studies (1–3 mm rings). |
| Lupión Durán et al., 2021 [94] | Cross-sectional | 196 diabetic patients without DR, 114 diabetic patients with NPDR, and 58 healthy controls | Pelli–Robson contrast sensitivity test and low-contrast visual acuity charts (1.25%, 2.5%, and 5%) | Pelli–Robson at 1 m, illumination 90–120 cd/m2; Sloan test at 2 m; ETDRS high-contrast VA at 4 m | none | Patients with NPDR demonstrated significantly worse contrast sensitivity and low-contrast visual acuity despite preserved high-contrast visual acuity | Sample size still limited for subgroup analysis; ambient lighting/brightness difficult to fully standardize across exams |
| Pramanik et al., 2020 [15] | Cross-sectional | 30 diabetic patients without DR, 43 diabetic patients with mild NPDR, and 35 healthy controls | Rabin contrast sensitivity test (log CS, 8 contrast levels, 0.25 log CS steps/row) | Illuminator cabinet, luminance 170 cd/m2; monocular, best correction, dark room, viewing distance 4 m; worse eye value used | SD-OCT (Heidelberg Spectralis) | Significant reduction in CS in diabetic groups despite no significant differences in central macular thickness or visual acuity | Relatively small sample size per subgroup; only VA and CS assessed (no color vision, dark adaptation, or other psychophysical tests) |
| Safi et al., 2017 [28] | Cross-sectional | 46 type 2/2 type 1 diabetic patients without DR and 46 healthy controls | CSV-1000 backlit chart, 4 spatial frequencies (3, 6, 12, and 18 cpd) | Monocular, BCVA correction, 2.5 m; two lighting conditions: moderate and dim (25 min dark adaptation); luminance 85 cd/m2 | None | Diabetic subjects showed significant CS reduction at nearly all spatial frequencies under both lighting conditions, despite absence of retinopathy; combined photopic and mesopic testing achieved good discriminative accuracy | Limited number of type 1 diabetes subjects prevented analysis by diabetes type; no OCT performed to exclude subclinical DME; MPOD not measured, limiting mechanistic interpretation |
6. Structure–Function Relationship
7. Discussion
8. Future Directions
9. Conclusions
Author Contributions
Funding
Institutional Review Board Statement
Informed Consent Statement
Data Availability Statement
Conflicts of Interest
References
- Hossain, M.J.; Al-Mamun, M.; Islam, M.R. Diabetes Mellitus, the Fastest Growing Global Public Health Concern: Early Detection Should Be Focused. Health Sci. Rep. 2024, 7, e2004. [Google Scholar] [CrossRef] [Scilit]
- Kropp, M.; Golubnitschaja, O.; Mazurakova, A.; Koklesova, L.; Sargheini, N.; Vo, T.-T.K.S.; De Clerck, E.; Polivka, J.; Potuznik, P.; Polivka, J.; et al. Diabetic Retinopathy as the Leading Cause of Blindness and Early Predictor of Cascading Complications—Risks and Mitigation. EPMA J. 2023, 14, 21–42. [Google Scholar] [CrossRef] [Scilit] [PubMed]
- Zhang, J.; Wang, M.; Chen, L.; Radke, N. Diabetic Blindness Remains a Big Challenge Despite All Recent Advancements in Diagnostics and Treatments. Asia-Pac. J. Ophthalmol. 2024, 13, 100105. [Google Scholar] [CrossRef] [Scilit] [PubMed]
- Zhang, Z.; Deng, C.; Paulus, Y.M. Advances in Structural and Functional Retinal Imaging and Biomarkers for Early Detection of Diabetic Retinopathy. Biomedicines 2024, 12, 1405. [Google Scholar] [CrossRef] [Scilit] [PubMed]
- Elsharkawy, M.; Elrazzaz, M.; Sharafeldeen, A.; Alhalabi, M.; Khalifa, F.; Soliman, A.; Elnakib, A.; Mahmoud, A.; Ghazal, M.; El-Daydamony, E.; et al. The Role of Different Retinal Imaging Modalities in Predicting Progression of Diabetic Retinopathy: A Survey. Sensors 2022, 22, 3490. [Google Scholar] [CrossRef] [Scilit] [PubMed]
- Erkan, E.; Dündar, S.; Akyüz Ünsal, A.İ. Clinical Examination and Fundus Photography in Diabetic Retinopathy Screening. J. Surg. Med. 2021, 5, 444–448. [Google Scholar] [CrossRef] [Scilit]
- Ponce-García, V.; Silva-Viguera, M.; García-Romera, M.; Guerra-Sancho, Y.; Heredia-Ríos, N.; Bautista-Llamas, M. Validation and Evaluation of Visual Acuity and Contrast Sensitivity with a New Digital Device: OPTOTAB®+. Ophthalmic Physiol. Opt. 2025, 45, 1302–1316. [Google Scholar] [CrossRef] [Scilit] [PubMed]
- Bagga, D.K.; Padmanabhan, A.A.G.; Jayaraman, D.; Raghuram, A.; Shirodker, S.S.S.; Idhayavannan, I.P.; Christy, B. Contrast Sensitivity and Low-Contrast Visual Acuity in Children With Low Vision. Investig. Ophthalmol. Vis. Sci. 2026, 67, 38. [Google Scholar] [CrossRef] [Scilit] [PubMed]
- Xiong, Y.-Z.; Kwon, M.; Bittner, A.K.; Virgili, G.; Giacomelli, G.; Legge, G.E. Relationship Between Acuity and Contrast Sensitivity: Differences Due to Eye Disease. Investig. Opthalmol. Vis. Sci. 2020, 61, 40. [Google Scholar] [CrossRef] [Scilit] [PubMed]
- Glassman, A.R.; Elmasry, M.A.; Baskin, D.E.; Brigell, M.; Chong, V.; Davis, Q.; Lesmes, L.; Levin, L.A.; Maddess, T.; Taylor, L.J.; et al. Visual Function Measurements in Eyes With Diabetic Retinopathy: An Expert Opinion on Available Measures. Ophthalmol. Sci. 2024, 4, 100519. [Google Scholar] [CrossRef] [Scilit] [PubMed]
- Lu, Z.-L.; Zhao, Y.; Lesmes, L.A.; Dorr, M. Quantifying the Functional Relationship Between Visual Acuity and Contrast Sensitivity Function. Investig. Ophthalmol. Vis. Sci. 2024, 65, 33. [Google Scholar] [CrossRef] [Scilit] [PubMed]
- Jones, P.R.; Ungewiss, J.; Eichinger, P.; Wörner, M.; Crabb, D.P.; Schiefer, U. Contrast Sensitivity and Night Driving in Older People: Quantifying the Relationship Between Visual Acuity, Contrast Sensitivity, and Hazard Detection Distance in a Night-Time Driving Simulator. Front. Hum. Neurosci. 2022, 16, 914459. [Google Scholar] [CrossRef] [Scilit] [PubMed]
- Norton, D.J.; McBain, R.K.; Murray, G.E.; Khang, J.; Zong, Z.; Bollacke, H.R.; Maher, S.; Levy, D.L.; Ongur, D.; Chen, Y. Normal Face Detection Over a Range of Luminance Contrasts in Adolescents With Autism Spectrum Disorder. Front. Psychol. 2021, 12, 667359. [Google Scholar] [CrossRef] [Scilit] [PubMed]
- Hashemi, H.; Nabovati, P.; Yekta, A.; Borojerdi, A.; Fallahkohan, H.; Rezvan, F.; Khabazkhoob, M. Abnormal Visual Function: An Under-Recognized Risk Factor of Road Traffic Injuries. J. Ophthalmic Vis. Res. 2022, 17, 529–535. [Google Scholar] [CrossRef] [Scilit] [PubMed]
- Pramanik, S.; Chowdhury, S.; Ganguly, U.; Banerjee, A.; Bhattacharya, B.; Mondal, L.K. Visual Contrast Sensitivity Could Be an Early Marker of Diabetic Retinopathy. Heliyon 2020, 6, e05336. [Google Scholar] [CrossRef] [Scilit] [PubMed]
- Silva-Viguera, M.-C.; García-Romera, M.-C.; López-Izquierdo, I.; De-Hita-Cantalejo, C.; Sánchez-González, M.C.; Bautista-Llamas, M.-J. Contrast Sensitivity Assessment in Early Diagnosis of Diabetic Retinopathy: A Systematic Review. Semin. Ophthalmol. 2023, 38, 319–332. [Google Scholar] [CrossRef] [Scilit] [PubMed]
- Oshitari, T. Diabetic Retinopathy: Neurovascular Disease Requiring Neuroprotective and Regenerative Therapies. Neural Regen. Res. 2022, 17, 795. [Google Scholar] [CrossRef] [Scilit] [PubMed]
- Nian, S.; Lo, A.C.Y.; Mi, Y.; Ren, K.; Yang, D. Neurovascular Unit in Diabetic Retinopathy: Pathophysiological Roles and Potential Therapeutical Targets. Eye Vis. 2021, 8, 15. [Google Scholar] [CrossRef] [Scilit] [PubMed]
- Aldosari, D.I.; Malik, A.; Alhomida, A.S.; Ola, M.S. Implications of Diabetes-Induced Altered Metabolites on Retinal Neurodegeneration. Front. Neurosci. 2022, 16, 938029. [Google Scholar] [CrossRef] [Scilit] [PubMed]
- Viganò, I.; Galbiati, S.; Aragona, E.; Gabellini, D.; Lattanzio, R.; Pedon, V.; Basile, G.; Arrigo, A.; Bandello, F.; Zerbini, G. Diabetes-Driven Retinal Neurodegeneration: Its Role in the Pathogenesis of Diabetic Retinopathy. Biomedicines 2025, 13, 1328. [Google Scholar] [CrossRef] [Scilit] [PubMed]
- He, W.; Tang, P.; Lv, H. Targeting Oxidative Stress in Diabetic Retinopathy: Mechanisms, Pathology, and Novel Treatment Approaches. Front. Immunol. 2025, 16, 1571576. [Google Scholar] [CrossRef] [Scilit] [PubMed]
- Toma, C.; Ferdeghini, D.; Ola Pour, M.M.; Venkatesan, S.; De Cillà, S.; Grossini, E. Oxidative Stress in Diabetic Retinopathy: Pathogenic Mechanisms, Biomarkers and Clinical Implications. Antioxidants 2026, 15, 425. [Google Scholar] [CrossRef] [Scilit] [PubMed]
- Tang, L.; Xu, G.-T.; Zhang, J.-F. Inflammation in Diabetic Retinopathy: Possible Roles in Pathogenesis and Potential Implications for Therapy. Neural Regen. Res. 2023, 18, 976. [Google Scholar] [CrossRef] [Scilit] [PubMed]
- Baldwin, G.; Vingopoulos, F.; Zeng, R.; Wescott, H.; Bannerman, A.; Koch, T.; Wang, K.; Garg, I.; Katz, R.; Kim, L.A.; et al. Association Between Contrast Sensitivity and Central Subfield Thickness in Center-Involving Diabetic Macular Edema. J. Vitreoretin. Dis. 2023, 7, 232–238. [Google Scholar] [CrossRef] [Scilit] [PubMed]
- Ha, S.K.; Ding, X.; Romano, F.; Overbey, K.M.; Vingopoulos, F.; Garg, I.; Bennett, C.F.; Stettler, I.; Ploumi, I.; Baldwin, G.; et al. Structure-Function Associations Between Quantitative Contrast Sensitivity Function and Peripapillary Optical Coherence Tomography Angiography in Diabetic Retinopathy. Investig. Ophthalmol. Vis. Sci. 2025, 66, 69. [Google Scholar] [CrossRef] [Scilit] [PubMed]
- Ostadimoghadam, H.; Helmi, T.; Yekta, A.; Shandiz, J.H.; Shafaei, H.; Moghadam, H.M.; Mahjoob, M. Optical Coherence Tomography and Contrast Sensitivity in Early Diabetic Retinopathy. Taiwan J. Ophthalmol. 2024, 14, 403–408. [Google Scholar] [CrossRef] [Scilit] [PubMed]
- Sakini, A.S.A.; Hamid, A.K.; Alkhuzaie, Z.A.; Al-Aish, S.T.; Al-Zubaidi, S.; Tayem, A.A.; Alobi, M.A.; Sakini, A.S.A.; Al-Aish, R.T.; Al-Shami, K.; et al. Diabetic Macular Edema (DME): Dissecting Pathogenesis, Prognostication, Diagnostic Modalities along with Current and Futuristic Therapeutic Insights. Int. J. Retin. Vitr. 2024, 10, 83. [Google Scholar] [CrossRef] [Scilit] [PubMed]
- Safi, S.; Rahimi, A.; Raeesi, A.; Safi, H.; Aghazadeh Amiri, M.; Malek, M.; Yaseri, M.; Haeri, M.; Middleton, F.A.; Solessio, E.; et al. Contrast Sensitivity to Spatial Gratings in Moderate and Dim Light Conditions in Patients with Diabetes in the Absence of Diabetic Retinopathy. BMJ Open Diabetes Res. Care 2017, 5, e000408. [Google Scholar] [CrossRef] [Scilit] [PubMed]
- Ismail, G.M.; Whitaker, D. Early Detection of Changes in Visual Function in Diabetes Mellitus. Ophthalmic Physiol. Opt. J. Br. Coll. Ophthalmic Opt. 1998, 18, 3–12. [Google Scholar] [CrossRef] [Scilit]
- Jones, L.; O’Connor, A.; Warburton, A. Evaluating the Use of Contrast Sensitivity Tests by Orthoptists in the UK. Br. Ir. Orthopt. J. 2024, 20, 48–56. [Google Scholar] [CrossRef] [Scilit] [PubMed]
- Hegde, P.G.; Rao, D.; Prudhvi, B.; Hegde, N. Digital Contrast Sensitivity Chart with Varying Visual Acuity: Development and Validation. Oman J. Ophthalmol. 2023, 16, 467–471. [Google Scholar] [CrossRef] [Scilit] [PubMed]
- De Fez, D.; García, C.; Luque-Cobija, M.J.; Mena-Guevara, K.J.; Daudén, P.; Piñero, D.P. Validation of a New Test for Measuring the Contrast Sensitivity Function (Optopad-CSF) at Near Vision. Diagnostics 2024, 14, 1377. [Google Scholar] [CrossRef] [Scilit] [PubMed]
- Sheppard, W.E.A.; Coats, R.O.; Wilkie, R.; Johansen, T.R.; Campagnoli, C.; Baraas, R.C. Evaluating Online Measures of Contrast Sensitivity and Visual Acuity. OSF 2024. [Google Scholar] [CrossRef] [Scilit]
- Dănilă, A.-I.; Ghenciu, L.A.; Stoicescu, E.R.; Bolintineanu, S.L.; Iacob, R.; Săndesc, M.-A.; Faur, A.C. Aldose Reductase as a Key Target in the Prevention and Treatment of Diabetic Retinopathy: A Comprehensive Review. Biomedicines 2024, 12, 747. [Google Scholar] [CrossRef] [Scilit] [PubMed]
- Pardina, E.; Tondo, M.; Escolà-Gil, J.C.; Rossell, J.; Julve, J. Molecular Mechanisms Involved in Hyperglycemia-Induced Cellular Damage. In Chronic Complications of Diabetes Mellitus; Elsevier: Amsterdam, The Netherlands, 2024; pp. 25–38. ISBN 978-0-323-88426-6. [Google Scholar]
- Hattori, T.; Matsubara, A.; Taniguchi, K.; Ogura, Y. Aldose Reductase Inhibitor Fidarestat Attenuates Leukocyte-Endothelial Interactions in Experimental Diabetic Rat Retina In Vivo. Curr. Eye Res. 2010, 35, 146–154. [Google Scholar] [CrossRef] [Scilit] [PubMed]
- Rao, M.; Huang, Y.-K.; Liu, C.-C.; Meadows, C.; Cheng, H.-C.; Zhou, M.; Chen, Y.-C.; Xia, X.; Goldberg, J.L.; Williams, A.M.; et al. Aldose Reductase Inhibition Decelerates Optic Nerve Degeneration by Alleviating Retinal Microglia Activation. Sci. Rep. 2023, 13, 5592. [Google Scholar] [CrossRef] [Scilit] [PubMed]
- Tang, J.; Du, Y.; Petrash, J.M.; Sheibani, N.; Kern, T.S. Deletion of Aldose Reductase from Mice Inhibits Diabetes-Induced Retinal Capillary Degeneration and Superoxide Generation. PLoS ONE 2013, 8, e62081. [Google Scholar] [CrossRef] [Scilit] [PubMed]
- Miwa, K.; Nakamura, J.; Hamada, Y.; Naruse, K.; Nakashima, E.; Kato, K.; Kasuya, Y.; Yasuda, Y.; Kamiya, H.; Hotta, N. The Role of Polyol Pathway in Glucose-Induced Apoptosis of Cultured Retinal Pericytes. Diabetes Res. Clin. Pract. 2003, 60, 1–9. [Google Scholar] [CrossRef] [Scilit] [PubMed]
- Pal, P.B.; Sonowal, H.; Shukla, K.; Srivastava, S.K.; Ramana, K.V. Aldose Reductase Regulates Hyperglycemia-Induced HUVEC Death via SIRT1/AMPK-A1/mTOR Pathway. J. Mol. Endocrinol. 2019, 63, 11–25. [Google Scholar] [CrossRef] [Scilit] [PubMed]
- Oshitari, T. Advanced Glycation End-Products and Diabetic Neuropathy of the Retina. Int. J. Mol. Sci. 2023, 24, 2927. [Google Scholar] [CrossRef] [Scilit] [PubMed]
- Strieder-Barboza, C.; Baker, N.A.; Flesher, C.G.; Karmakar, M.; Neeley, C.K.; Polsinelli, D.; Dimick, J.B.; Finks, J.F.; Ghaferi, A.A.; Varban, O.A.; et al. Advanced Glycation End-Products Regulate Extracellular Matrix-Adipocyte Metabolic Crosstalk in Diabetes. Sci. Rep. 2019, 9, 19748. [Google Scholar] [CrossRef] [Scilit] [PubMed]
- Kang, Q.; Dai, H.; Jiang, S.; Yu, L. Advanced Glycation End Products in Diabetic Retinopathy and Phytochemical Therapy. Front. Nutr. 2022, 9, 1037186. [Google Scholar] [CrossRef] [Scilit] [PubMed]
- Mathebula, S.D. Biochemical Changes in Diabetic Retinopathy Triggered by Hyperglycaemia: A Review. Afr. Vis. Eye Health 2018, 77, 1–7. [Google Scholar] [CrossRef] [Scilit]
- Kant, S.; Feng, J. Protein Kinase C and Endothelial Dysfunction in Select Vascular Diseases. Front. Cardiovasc. Med. 2025, 12, 1618343. [Google Scholar] [CrossRef] [Scilit] [PubMed]
- Sun, J.K.; King, G.L. The Role of Protein Kinase C in Diabetic Retinal Vascular Abnormalities. In Retinal and Choroidal Angiogenesis; Penn, J.S., Ed.; Springer: Dordrecht, The Netherlands, 2008; pp. 187–202. ISBN 978-1-4020-6779-2. [Google Scholar]
- Wang, W.; Lo, A.C.Y. Diabetic Retinopathy: Pathophysiology and Treatments. Int. J. Mol. Sci. 2018, 19, 1816. [Google Scholar] [CrossRef] [Scilit] [PubMed]
- Zafar, S.; Sachdeva, M.; Frankfort, B.J.; Channa, R. Retinal Neurodegeneration as an Early Manifestation of Diabetic Eye Disease and Potential Neuroprotective Therapies. Curr. Diabetes Rep. 2019, 19, 17. [Google Scholar] [CrossRef] [Scilit] [PubMed]
- Kowluru, R.A.; Chan, P.-S. Oxidative Stress and Diabetic Retinopathy. J. Diabetes Res. 2007, 2007, 043603. [Google Scholar] [CrossRef] [Scilit] [PubMed]
- Sohn, E.H.; Van Dijk, H.W.; Jiao, C.; Kok, P.H.B.; Jeong, W.; Demirkaya, N.; Garmager, A.; Wit, F.; Kucukevcilioglu, M.; Van Velthoven, M.E.J.; et al. Retinal Neurodegeneration May Precede Microvascular Changes Characteristic of Diabetic Retinopathy in Diabetes Mellitus. Proc. Natl. Acad. Sci. USA 2016, 113, E2655–E2664. [Google Scholar] [CrossRef] [Scilit] [PubMed]
- Bianco, L.; Arrigo, A.; Aragona, E.; Antropoli, A.; Berni, A.; Saladino, A.; Battaglia Parodi, M.; Bandello, F. Neuroinflammation and Neurodegeneration in Diabetic Retinopathy. Front. Aging Neurosci. 2022, 14, 937999. [Google Scholar] [CrossRef] [Scilit] [PubMed]
- Yang, Q.; Yasvoina, M.; Olvera-Barrios, A.; Mendes, J.; Zhu, M.; Egan, C.; Tufail, A.; Fruttiger, M. Disconnection Between Microvascular Damage and Neurodegeneration in Early Diabetic Retinopathy. bioRxiv 2024. [Google Scholar] [CrossRef] [Scilit]
- Durham, J.T.; Herman, I.M. Microvascular Modifications in Diabetic Retinopathy. Curr. Diabetes Rep. 2011, 11, 253–264. [Google Scholar] [CrossRef] [Scilit] [PubMed]
- Wright, W.S.; Eshaq, R.S.; Lee, M.; Kaur, G.; Harris, N.R. Retinal Physiology and Circulation: Effect of Diabetes. In Comprehensive Physiology; Terjung, R., Ed.; Wiley: New York, NY, USA, 2020; pp. 933–974. ISBN 978-0-470-65071-4. [Google Scholar]
- Wykoff, C.C.; Yu, H.J.; Avery, R.L.; Ehlers, J.P.; Tadayoni, R.; Sadda, S.R. Retinal Non-Perfusion in Diabetic Retinopathy. Eye 2022, 36, 249–256. [Google Scholar] [CrossRef] [Scilit] [PubMed]
- McGahon, M.K.; Dash, D.P.; Arora, A.; Wall, N.; Dawicki, J.; Simpson, D.A.; Scholfield, C.N.; McGeown, J.G.; Curtis, T.M. Diabetes Downregulates Large-Conductance Ca2+ -Activated Potassium Β1 Channel Subunit in Retinal Arteriolar Smooth Muscle. Circ. Res. 2007, 100, 703–711. [Google Scholar] [CrossRef] [Scilit] [PubMed]
- Barot, M.; Gokulgandhi, M.R.; Patel, S.; Mitra, A.K. Microvascular Complications and Diabetic Retinopathy: Recent Advances and Future Implications. Future Med. Chem. 2013, 5, 301–314. [Google Scholar] [CrossRef] [Scilit] [PubMed]
- D’Esposito, F.; Cappellani, F.; Visalli, F.; Capobianco, M.; Rapisarda, L.; Avitabile, A.; Cannizzaro, L.; Malaguarnera, R.; Gagliano, G.; Maniaci, A.; et al. Pericytes as Key Players in Retinal Diseases: A Comprehensive Narrative Review. Biology 2025, 14, 736. [Google Scholar] [CrossRef] [Scilit] [PubMed]
- Shirbaghaee, Z.; Sorenson, C.M.; Sheibani, N. Pericytes and Diabetic Microangiopathies: Tissue Resident Mesenchymal Stem Cells with High Plasticity and Regenerative Capacity. Int. J. Mol. Sci. 2025, 26, 5333. [Google Scholar] [CrossRef] [Scilit] [PubMed]
- Forrester, J.V.; Kuffova, L.; Delibegovic, M. The Role of Inflammation in Diabetic Retinopathy. Front. Immunol. 2020, 11, 583687. [Google Scholar] [CrossRef] [Scilit] [PubMed]
- Kovoor, E.; Chauhan, S.K.; Hajrasouliha, A. Role of Inflammatory Cells in Pathophysiology and Management of Diabetic Retinopathy. Surv. Ophthalmol. 2022, 67, 1563–1573. [Google Scholar] [CrossRef] [Scilit] [PubMed]
- Amin, N.; Fatima, N.; Shakoor Qaisrani, S.; Sahar, T.; Shabbir, H.; Bibi, I.; Saeed, A. Comparative Analysis of Retinal Microvascular Alterations in Type 1 vs. Type 2 Diabetes. In Diabetic Eye Disease-From Pathophysiology to Treatment; IntechOpen: Rijeka, Croatia, 2026. [Google Scholar]
- Callan, A.; Heckman, J.; Tah, G.; Lopez, S.; Valdez, L.; Tsin, A. VEGF in Diabetic Retinopathy and Age-Related Macular Degeneration. Int. J. Mol. Sci. 2025, 26, 4992. [Google Scholar] [CrossRef] [Scilit] [PubMed]
- Roy, S.; Cagliero, E.; Lorenzi, M. Fibronectin Overexpression in Retinal Microvessels of Patients with Diabetes. Investig. Ophthalmol. Vis. Sci. 1996, 37, 258–266. [Google Scholar] [CrossRef] [Scilit]
- Khadamy, J. Basement Membrane Alterations in Diabetic Retinopathy. In Diabetic Retinopathy—Advancement in Understanding the Pathophysiology and Management Strategies; Imtiaz Nawaz, M., Ed.; IntechOpen: Rijeka, Croatia, 2024; ISBN 978-0-85466-680-5. [Google Scholar]
- Stalin, A.; Dalton, K. Relationship of Contrast Sensitivity Measured Using Quick Contrast Sensitivity Function With Other Visual Functions in a Low Vision Population. Investig. Opthalmol. Vis. Sci. 2020, 61, 21. [Google Scholar] [CrossRef] [Scilit] [PubMed]
- Kaur, K.; Gurnani, B. Contrast Sensitivity. In StatPearls; StatPearls Publishing: Treasure Island, FL, USA, 2026. [Google Scholar]
- Chung, S.T.L.; Legge, G.E. Comparing the Shape of Contrast Sensitivity Functions for Normal and Low Vision. Investig. Opthalmol. Vis. Sci. 2016, 57, 198. [Google Scholar] [CrossRef] [Scilit] [PubMed]
- Bex, P.J.; Solomon, S.G.; Dakin, S.C. Contrast Sensitivity in Natural Scenes Depends on Edge as Well as Spatial Frequency Structure. J. Vis. 2009, 9, 1. [Google Scholar] [CrossRef] [Scilit] [PubMed]
- Ashraf, M.; Mantiuk, R.K.; Chapiro, A.; Wuerger, S. castleCSF—A Contrast Sensitivity Function of Color, Area, Spatiotemporal Frequency, Luminance and Eccentricity. J. Vis. 2024, 24, 5. [Google Scholar] [CrossRef] [Scilit] [PubMed]
- Ravello, C.R.; Perrinet, L.U.; Escobar, M.-J.; Palacios, A.G. Speed-Selectivity in Retinal Ganglion Cells Is Sharpened by Broad Spatial Frequency, Naturalistic Stimuli. Sci. Rep. 2019, 9, 456. [Google Scholar] [CrossRef] [Scilit] [PubMed]
- Njeru, S.M.; Osman, M.; Brown, A.M. The Effect of Test Distance on Visual Contrast Sensitivity Measured Using the Pelli-Robson Chart. Transl. Vis. Sci. Technol. 2021, 10, 32. [Google Scholar] [CrossRef] [Scilit] [PubMed]
- Gupta, L.; Cvintal, V.; Delvadia, R.; Sun, Y.; Erdem, E.; Zangalli, C.; Lu, L.; Wizov, S.S.; Richman, J.; Spaeth, E.; et al. SPARCS and Pelli–Robson Contrast Sensitivity Testing in Normal Controls and Patients with Cataract. Eye 2017, 31, 753–761. [Google Scholar] [CrossRef] [Scilit] [PubMed]
- Thatte, S.; Monga, A.; Sharma, H. A Clinical Study to Assess Pattern of Contrast Sensitivity Functions in Patients with Myopia. BOHR. Int. J. Curr. Res. Optom. Ophthalmol. 2022, 1, 67–73. [Google Scholar] [CrossRef] [Scilit]
- Vingopoulos, F.; Wai, K.M.; Katz, R.; Vavvas, D.G.; Kim, L.A.; Miller, J.B. Measuring the Contrast Sensitivity Function in Non-Neovascular and Neovascular Age-Related Macular Degeneration: The Quantitative Contrast Sensitivity Function Test. J. Clin. Med. 2021, 10, 2768. [Google Scholar] [CrossRef] [Scilit] [PubMed]
- Altinbay, D.; Sahli, E.; Idil, A. Comparison of Two Different Contrast Sensitivity Testing Methods in Patients with Low Vision. J. Curr. Ophthalmol. 2022, 34, 60–66. [Google Scholar] [CrossRef] [Scilit] [PubMed]
- Tahkor, A.; Heravian Shandiz, J.; Azimi Khorasani, A.; Ansari Moghadam, A. Comparison of CSV-1000 and Metrovision Contrast Sensitivity Tests in Normal Eyes. Med. Hypothesis Discov. Innov. Optom. 2021, 2, 63–70. [Google Scholar] [CrossRef] [Scilit]
- Dolcetti, E.; Buttari, F.; Bruno, A.; Azzolini, F.; Gilio, L.; Di Caprio, V.; Lauritano, G.; Borrelli, A.; Galifi, G.; Furlan, R.; et al. Low-Contrast Visual Acuity Test Is Associated with Central Inflammation and Predicts Disability Development in Newly Diagnosed Multiple Sclerosis Patients. Front. Neurol. 2024, 15, 1326506. [Google Scholar] [CrossRef] [Scilit] [PubMed]
- Reddingius, P.F.; Rathore, M.; Crabb, D.P.; Jones, P.R. Assessing the Resilience of Portable Vision Tests to an Uncontrolled Home Environment. PeerJ 2026, 14, e20657. [Google Scholar] [CrossRef] [Scilit] [PubMed]
- Dorr, M.; Lesmes, L.A.; Lu, Z.-L.; Bex, P.J. Rapid and Reliable Assessment of the Contrast Sensitivity Function on an iPad. Investig. Opthalmol. Vis. Sci. 2013, 54, 7266. [Google Scholar] [CrossRef] [Scilit] [PubMed]
- Joltikov, K.A.; Sesi, C.A.; De Castro, V.M.; Davila, J.R.; Anand, R.; Khan, S.M.; Farbman, N.; Jackson, G.R.; Johnson, C.A.; Gardner, T.W. Disorganization of Retinal Inner Layers (DRIL) and Neuroretinal Dysfunction in Early Diabetic Retinopathy. Investig. Opthalmol. Vis. Sci. 2018, 59, 5481. [Google Scholar] [CrossRef] [Scilit] [PubMed]
- Katz, G.; Levkovitch-Verbin, H.; Treister, G.; Belkin, M.; Ilany, J.; Polat, U. Mesopic Foveal Contrast Sensitivity Is Impaired in Diabetic Patients without Retinopathy. Graefes Arch. Clin. Exp. Ophthalmol. 2010, 248, 1699–1703. [Google Scholar] [CrossRef] [Scilit] [PubMed]
- Pesudovs, K.; Hazel, C.A.; Doran, R.M.L.; Elliott, D.B. The Usefulness of Vistech and FACT Contrast Sensitivity Charts for Cataract and Refractive Surgery Outcomes Research. Br. J. Ophthalmol. 2004, 88, 11–16. [Google Scholar] [CrossRef] [Scilit] [PubMed]
- Bianchi, E.; Reddingius, P.F.; Rathore, M.; Lindfield, D.; Crabb, D.P.; Jones, P.R. Pushing the Envelope: The Feasibility of Using a Mailed Contrast Sensitivity Test to Prioritise Cataract Waiting Lists. Eye 2024, 38, 2568–2574. [Google Scholar] [CrossRef] [Scilit] [PubMed]
- Dorr, M.; Elze, T.; Wang, H.; Lu, Z.-L.; Bex, P.J.; Lesmes, L.A. New Precision Metrics for Contrast Sensitivity Testing. IEEE J. Biomed. Health Inform. 2018, 22, 919–925. [Google Scholar] [CrossRef] [Scilit] [PubMed]
- Gella, L.; Raman, R.; Pal, S.S.; Ganesan, S.; Sharma, T. Contrast Sensitivity and Its Determinants in People with Diabetes: SN-DREAMS-II, Report No 6. Eye 2017, 31, 460–466. [Google Scholar] [CrossRef] [Scilit] [PubMed]
- Neriyanuri, S.; Pardhan, S.; Gella, L.; Pal, S.S.; Ganesan, S.; Sharma, T.; Raman, R. Retinal Sensitivity Changes Associated with Diabetic Neuropathy in the Absence of Diabetic Retinopathy. Br. J. Ophthalmol. 2017, 101, 1174–1178. [Google Scholar] [CrossRef] [Scilit] [PubMed]
- Chande, P.K.; Raman, R.; John, P.; Srinivasan, S. Contrast-Sensitivity Function and Photo Stress–Recovery Time in Prediabetes. Clin. Optom. 2020, 12, 151–155. [Google Scholar] [CrossRef] [Scilit] [PubMed]
- Shah, M.; Farooq, A.; Tariq, Y. Relationship Between Glycosylated Hemoglobin Levels and Contrast Sensitivity in People with Type 2 Diabetes Mellitus Without Diabetic Retinopathy. Turk. J. Ophthalmol. 2022, 52, 394–399. [Google Scholar] [CrossRef] [Scilit] [PubMed]
- Georgakopoulos, C.D.; Eliopoulou, M.I.; Exarchou, A.M.; Tzimis, V.; Pharmakakis, N.M.; Spiliotis, B.E. Decreased Contrast Sensitivity in Children and Adolescents with Type 1 Diabetes Mellitus. J. Pediatr. Ophthalmol. Strabismus 2011, 48, 92–97. [Google Scholar] [CrossRef] [Scilit] [PubMed]
- Bodduluri, L.; Dain, S.J.; Hameed, S.; Verge, C.F.; Boon, M.Y. Visual Function and Retinal Thickness in Children with Type 1 Diabetes Mellitus. Clin. Exp. Optom. 2024, 107, 739–747. [Google Scholar] [CrossRef] [Scilit] [PubMed]
- Tang, V.T.S.; Symons, R.C.A.; Fourlanos, S.; Guest, D.; McKendrick, A.M. Contrast Increment and Decrement Processing in Individuals With and Without Diabetes. Investig. Opthalmol. Vis. Sci. 2023, 64, 26. [Google Scholar] [CrossRef] [Scilit] [PubMed]
- McAnany, J.J.; Park, J.C. Reduced Contrast Sensitivity Is Associated With Elevated Equivalent Intrinsic Noise in Type 2 Diabetics Who Have Mild or No Retinopathy. Investig. Opthalmol. Vis. Sci. 2018, 59, 2652. [Google Scholar] [CrossRef] [Scilit] [PubMed]
- Lupión Durán, T.; García-Ben, A.; Rodríguez Méndez, V.; Gálvez Alcázar, L.; García-Ben, E.; García-Campos, J.M. Study of Visual Acuity and Contrast Sensitivity in Diabetic Patients with and without Non-Proliferative Diabetic Retinopathy. Int. Ophthalmol. 2021, 41, 3587–3592. [Google Scholar] [CrossRef] [Scilit] [PubMed]
- Tuli, N.; Moroz, H.; Jaffer, A.; Kulbay, M.; Tanya, S.M.; Aslan, F.S.; Ozdemir, D.; Ali, S.K.; Qian, C.X. The Central Role of Oxidative Stress in Diabetic Retinopathy: Advances in Pathogenesis, Diagnosis, and Therapy. Diagnostics 2026, 16, 392. [Google Scholar] [CrossRef] [Scilit] [PubMed]
- Singh, M.K.; Singh, V.P.; Bhushan, P.; Maurya, R.P.; Chaturvedi, P.K. Correlation of Visual Acuity and Contrast Sensitivity in Visually Disabled Patients of Moderate to Severe Diabetic Retinopathy. Indian J. Clin. Exp. Ophthalmol. 2020, 4, 56–59. [Google Scholar] [CrossRef] [Scilit]
- Mares, V.; Reiter, G.S.; Gumpinger, M.; Leigang, O.; Bogunovic, H.; Barthelmes, D.; Nehemy, M.B.; Schmidt-Erfurth, U. Correlation of Retinal Fluid and Photoreceptor and RPE Loss in Neovascular AMD by Automated Quantification, a Real-world FRB! Analysis. Acta Ophthalmol. 2025, 103, 295–303. [Google Scholar] [CrossRef] [Scilit] [PubMed]
- Baldwin, G.; Vingopoulos, F.; Garg, I.; Moon, J.Y.; Zeng, R.; Cui, Y.; Katz, R.; Le, R.; Lu, E.S.; Sayah, D.N.; et al. Structure–Function Associations between Contrast Sensitivity and Widefield Swept–Source Optical Coherence Tomography Angiography in Diabetic Macular Edema. Graefes Arch. Clin. Exp. Ophthalmol. 2023, 261, 3113–3124. [Google Scholar] [CrossRef] [Scilit] [PubMed]
- Dieke, S.; Wurche, S.; Ruebsam, A.; Wirbelauer, C.; Joussen, A.M.; Winterhalter, S. Impact of Intravitreal Injection Therapy on Contrast Sensitivity in Patients with nAMD and DME. Graefes Arch. Clin. Exp. Ophthalmol. 2023, 261, 1823–1833. [Google Scholar] [CrossRef] [Scilit] [PubMed]
- Nixon, D.R.; Flinn, N.A. Evaluation of Contrast Sensitivity and Other Visual Function Outcomes in Diabetic Macular Edema Patients Following Treatment Switch to Aflibercept from Ranibizumab. Clin. Ophthalmol. 2018, 12, 191–197. [Google Scholar] [CrossRef] [Scilit] [PubMed]
- Mehboob, M.A.; Amin, Z.A.; Islam, Q.U. Comparison of Retinal Nerve Fiber Layer Thickness between Normal Population and Patients with Diabetes Mellitus Using Optical Coherence Tomography: RNFL Thickness in Diabetes Mellitus. Pak. J. Med. Sci. 2019, 35, 29. [Google Scholar] [CrossRef] [Scilit] [PubMed]
- Van Dijk, H.W.; Verbraak, F.D.; Kok, P.H.B.; Garvin, M.K.; Sonka, M.; Lee, K.; DeVries, J.H.; Michels, R.P.J.; Van Velthoven, M.E.J.; Schlingemann, R.O.; et al. Decreased Retinal Ganglion Cell Layer Thickness in Patients with Type 1 Diabetes. Investig. Opthalmol. Vis. Sci. 2010, 51, 3660. [Google Scholar] [CrossRef] [Scilit] [PubMed]
- Sridhar, S.; Vystrčilová, M.; Khani, M.H.; Karamanlis, D.; Schreyer, H.M.; Ramakrishna, V.; Krüppel, S.; Zapp, S.J.; Mietsch, M.; Ecker, A.S.; et al. Modeling Spatial Contrast Sensitivity in Responses of Primate Retinal Ganglion Cells to Natural Movies. PLoS Comput. Biol. 2026, 22, e1014157. [Google Scholar] [CrossRef] [Scilit] [PubMed]
- Tripathi, A.; Gaur, S.; Agarwal, R.; Singh, N.; Singh, A.; Parveen, S.; Singh, N.; Rima, N. Disorganization of Retinal Inner Layers as an Optical Coherence Tomography Biomarker in Diabetic Retinopathy: A Review. Indian J. Ophthalmol. 2025, 73, 1245–1250. [Google Scholar] [CrossRef] [Scilit] [PubMed]
- Montesano, G.; Ometto, G.; Higgins, B.E.; Das, R.; Graham, K.W.; Chakravarthy, U.; McGuiness, B.; Young, I.S.; Kee, F.; Wright, D.M.; et al. Evidence for Structural and Functional Damage of the Inner Retina in Diabetes With No Diabetic Retinopathy. Investig. Opthalmol. Vis. Sci. 2021, 62, 35. [Google Scholar] [CrossRef] [Scilit] [PubMed]
- Aldakhil, S.; Challa, N.; Alhoshan, S.A.; Abohaimed, F.; Alnasser, B.N.; Almuhawas, H.A.; AlObaisi, S.; Alrasheed, S.H. Quantitative Analysis of Early Retinal Changes and OCT Parameters in Diabetic Subjects with and Without Retinopathy. Diagnostics 2025, 15, 451. [Google Scholar] [CrossRef] [Scilit] [PubMed]
- Vingopoulos, F.; Baldwin, G.; Katz, R.; Cui, Y.; Moon, J.Y.; Garg, I.; Zeng, R.; Patel, N.A.; Wu, D.; Husain, D.; et al. Associations of Quantitative Contrast Sensitivity with Vascular Metrics on Widefield Swept-Source OCT Angiography across Stages of Diabetic Retinopathy. Br. J. Ophthalmol. 2024, 108, 1708–1715. [Google Scholar] [CrossRef] [Scilit] [PubMed]
- Joltikov, K.A.; De Castro, V.M.; Davila, J.R.; Anand, R.; Khan, S.M.; Farbman, N.; Jackson, G.R.; Johnson, C.A.; Gardner, T.W. Multidimensional Functional and Structural Evaluation Reveals Neuroretinal Impairment in Early Diabetic Retinopathy. Investig. Opthalmol. Vis. Sci. 2017, 58, BIO277. [Google Scholar] [CrossRef] [Scilit] [PubMed]
- Tsai, L.-T.; Liao, K.-M.; Jang, Y.; Hu, F.-C.; Wu, W.-C. Detecting Visual Function Abnormality with a Contrast-Dependent Visual Test in Patients with Type 2 Diabetes. PLoS ONE 2016, 11, e0162383. [Google Scholar] [CrossRef] [Scilit] [PubMed]
- Chen, X.D.; Gardner, T.W. A Critical Review: Psychophysical Assessments of Diabetic Retinopathy. Surv. Ophthalmol. 2021, 66, 213–230. [Google Scholar] [CrossRef] [Scilit] [PubMed]
- Parede, T.R.R.; Torricelli, A.A.M.; Mukai, A.; Vieira Netto, M.; Bechara, S.J. Quality of Vision in Refractive and Cataract Surgery, Indirect Measurers: Review Article. Arq. Bras. Oftalmol. 2013, 76, 386–390. [Google Scholar] [CrossRef] [Scilit] [PubMed]
- Chen, Z.; Zhuang, Y.; Xu, Z.; Chan, L.Y.L.; Zhang, S.; Ye, Q.; Feng, L.; Lu, Z.-L.; Li, J. Sensitivity and Stability of Functional Vision Tests in Detecting Subtle Changes Under Multiple Simulated Conditions. Transl. Vis. Sci. Technol. 2021, 10, 7. [Google Scholar] [CrossRef] [Scilit] [PubMed]
- Zhuang, X.; Tran, T.; Jin, D.; Philip, R.; Wu, C. Aging Effects on Contrast Sensitivity in Visual Pathways: A Pilot Study on Flicker Adaptation. PLoS ONE 2021, 16, e0261927. [Google Scholar] [CrossRef] [Scilit] [PubMed]
- Seyhan Karatepe, A.; Köse, S.; Eğrilmez, S. Factors Affecting Contrast Sensitivity in Healthy Individuals: A Pilot Study. Türk Oftalmol. Derg. 2017, 47, 80–84. [Google Scholar] [CrossRef] [Scilit] [PubMed]
- Kamiya, K.; Fujimura, F.; Kawamorita, T.; Ando, W.; Iida, Y.; Shoji, N. Factors Influencing Contrast Sensitivity Function in Eyes with Mild Cataract. J. Clin. Med. 2021, 10, 1506. [Google Scholar] [CrossRef] [Scilit] [PubMed]
- Sadeghi, E.; Rahmanipour, E.; Valsecchi, N.; Kapoor, S.; Cicinelli, M.V.; Chhablani, J. An Update on Ocular Effects of Antidiabetic Medications. Surv. Ophthalmol. 2025, 70, 704–712. [Google Scholar] [CrossRef] [Scilit] [PubMed]
- Wright, D.M.; Chakravarthy, U.; Das, R.; Graham, K.W.; Naskas, T.T.; Perais, J.; Kee, F.; Peto, T.; Hogg, R.E. Identifying the Severity of Diabetic Retinopathy by Visual Function Measures Using Both Traditional Statistical Methods and Interpretable Machine Learning: A Cross-Sectional Study. Diabetologia 2023, 66, 2250–2260. [Google Scholar] [CrossRef] [Scilit] [PubMed]


Disclaimer/Publisher’s Note: The statements, opinions and data contained in all publications are solely those of the individual author(s) and contributor(s) and not of MDPI and/or the editor(s). MDPI and/or the editor(s) disclaim responsibility for any injury to people or property resulting from any ideas, methods, instructions or products referred to in the content. |
© 2026 by the authors. Licensee MDPI, Basel, Switzerland. This article is an open access article distributed under the terms and conditions of the Creative Commons Attribution (CC BY) license.
Share and Cite
Ghenciu, L.A.; Andrei, D.; Ioana, A.M.; Stoicescu, R.; Iacob, D.; Stoicescu, E.R.; Bolintineanu, S.L. Contrast Sensitivity Impairment in Diabetic Retinopathy: Clinical and Structural Correlates. Diagnostics 2026, 16, 2401. https://doi.org/10.3390/diagnostics16152401
Ghenciu LA, Andrei D, Ioana AM, Stoicescu R, Iacob D, Stoicescu ER, Bolintineanu SL. Contrast Sensitivity Impairment in Diabetic Retinopathy: Clinical and Structural Correlates. Diagnostics. 2026; 16(15):2401. https://doi.org/10.3390/diagnostics16152401
Chicago/Turabian StyleGhenciu, Laura Andreea, Diana Andrei, Alexandra Magdalena Ioana, Roxana Stoicescu, Daniela Iacob, Emil Robert Stoicescu, and Sorin Lucian Bolintineanu. 2026. "Contrast Sensitivity Impairment in Diabetic Retinopathy: Clinical and Structural Correlates" Diagnostics 16, no. 15: 2401. https://doi.org/10.3390/diagnostics16152401
APA StyleGhenciu, L. A., Andrei, D., Ioana, A. M., Stoicescu, R., Iacob, D., Stoicescu, E. R., & Bolintineanu, S. L. (2026). Contrast Sensitivity Impairment in Diabetic Retinopathy: Clinical and Structural Correlates. Diagnostics, 16(15), 2401. https://doi.org/10.3390/diagnostics16152401