1. Introduction
Skin cancer detection is a focal point in modern medical research due to the growing increase in dermatological disorders, especially malignant skin lesions. Melanoma is the most serious type of skin cancer because it grows rapidly and can spread to other parts of the body. An upsurge in incidence over the last decade has been reported in recent epidemiology studies, which are associated with factors including extended exposure to the ultraviolet rays of the sun, environmental changes, and aging populations [
1]. Early diagnosis is crucial as the prognosis and treatment options are limited if the lesions are diagnosed late, whereas prognosis is improved and treatment options are broader in the early stages of diagnosis [
2].
The current diagnostic methods, such as visual inspection and dermoscopic assessment, are highly dependent on the clinician’s experience and image interpretation. This frequently leads to intra- and inter-observer variability, particularly when diagnosing early-stage lesions with subtle visual features [
2]. Artificial Intelligence (AI)-based computer-aided diagnostic systems help reduce this subjectivity by providing objective and reproducible image analysis that is independent of the clinician’s level of experience. Moreover, deep learning, particularly hybrid feature fusion frameworks that integrate deep and handcrafted representations, can capture subtle texture, shape, and morphological variations that may not be readily distinguishable through visual assessment alone. Although AI systems remain challenged by difficult cases and should not replace clinical expertise, they can serve as valuable decision-support tools that improve diagnostic consistency and assist clinicians in skin cancer screening.
In addition to conventional dermoscopic imaging, emerging technologies such as Raster-Scan Optoacoustic Mesoscopy (RSOM), photoacoustic tomography, and Raman spectroscopy have shown promise for skin cancer diagnosis by providing vascular, structural, and biochemical tissue information [
3]. However, these modalities require specialized imaging equipment and clinical infrastructure, limiting their widespread adoption. In contrast, AI-based analysis of conventional RGB dermoscopic and clinical images offers a more practical, accessible, and cost-effective solution for routine computer-aided skin cancer screening and diagnosis.
Large-scale annotated datasets have played a vital role in recent times, in the field of automated skin cancer detection in this context. There is a vast amount of publicly available material, like the ISIC archive, which contains a wide range of dermoscopic images for a large number of different categories of lesions, which have greatly helped research by providing a wide variety of images to use for benchmarking and comparative analysis [
4]. Annotated high-quality images with well-defined classes of lesions have been provided by other datasets (PH
2, HAM10000), which allow for both segmentation and classification [
4]. Moreover, datasets such as PAD UFES 20 also contain clinical metadata, enabling multimodal analysis and enhancing a model’s generalization. However, these datasets are especially prone to class imbalance and have limited representation of rare malignancies and variations in imaging conditions, making the development of robust models difficult.
Initial computational methods relied on manually engineered features from these datasets, such as color, texture, and shape descriptors, as well as classic machine learning classifiers. Those methods offered a set of rules with a comprehensible interpretation, but were these constrained by the human work of feature engineering and by their sensitivity to changes in illumination and image quality [
4]. Deep learning, especially deep convolutional neural networks, has revolutionized the field of skin cancer detection, allowing for automatic feature learning directly from image data. These models have been shown to have high accuracy and, in some instances, performance similar to dermatologists [
5]. However, they are highly dependent on the availability of extensive and diverse datasets, and are prone to overfitting and bias if they are trained on small or imbalanced sets of data.
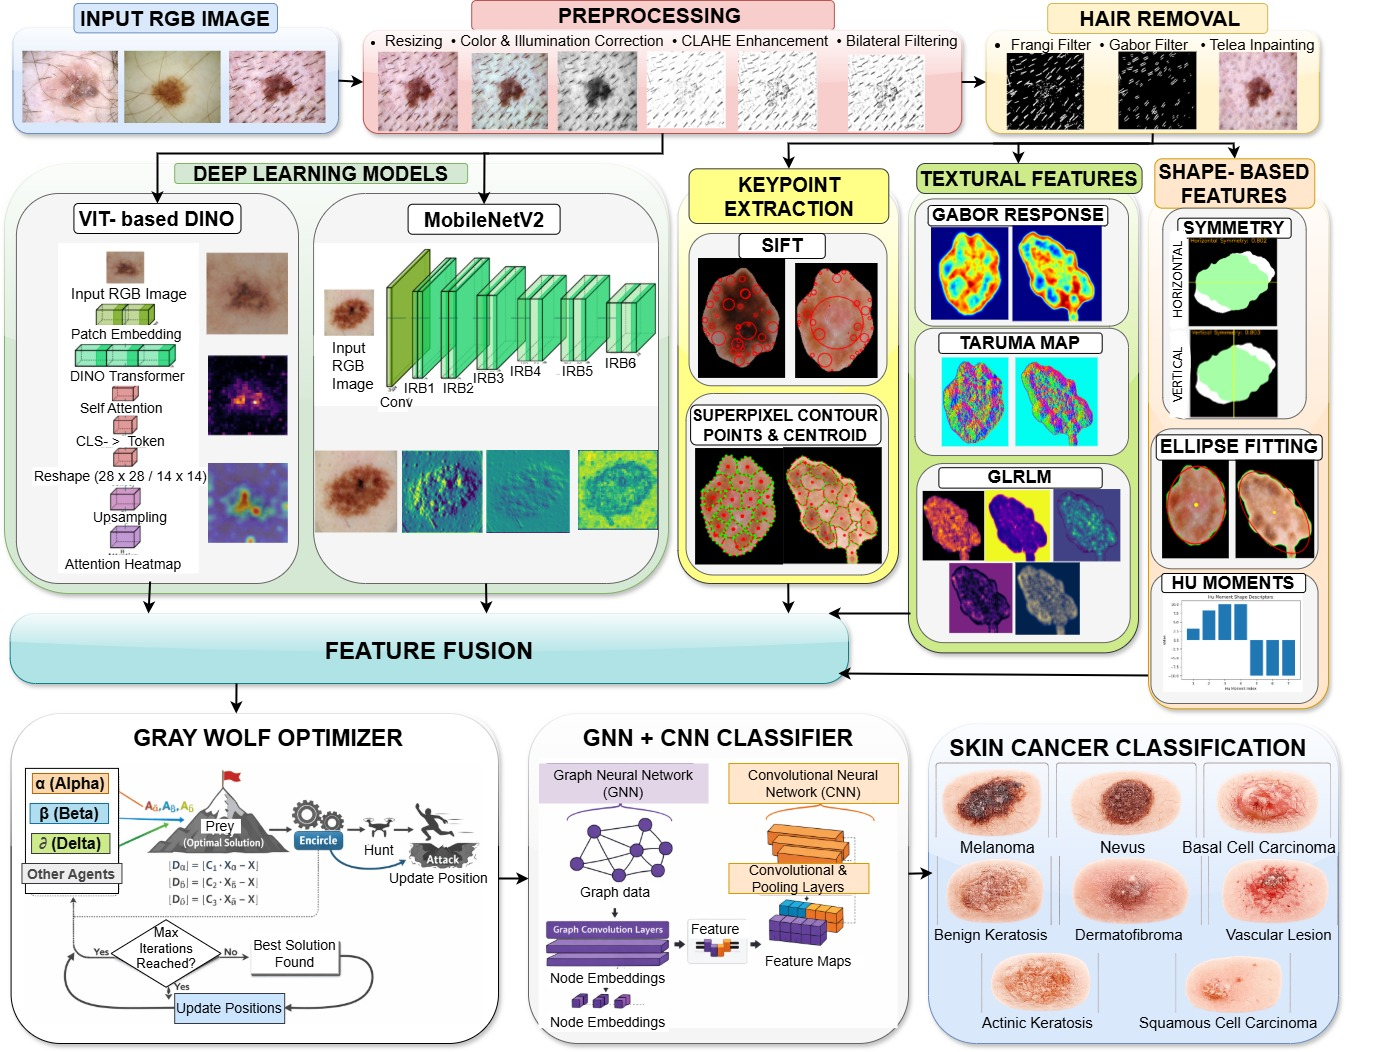
In this work, a unified skin lesion analysis framework is proposed that integrates preprocessing, deep learning, segmentation, feature extraction, optimization, and classification. Dermoscopic RGB images are first preprocessed, followed by iterative Frangi- and Gabor-based hair removal and Telea inpainting to enhance lesion visibility. The refined images are then used for deep feature extraction using a ViT-based DINO and MobileNetV2 to capture complementary global and local representations. In parallel, a novel segmentation model, CutisNet, generates precise RGB lesion masks, which are further used to extract handcrafted features, including SIFT keypoints, superpixel centroid and contour points, texture descriptors using Tamura features, GLRLM, and Gabor filters, along with structural features based on symmetry analysis, Hu moments, and ellipse fitting. Finally, all deep, texture, keypoint, and structural features are fused, optimized using Gray Wolf Optimization, and then classified using a hybrid GNN-CNN architecture for final skin cancer classification.
The key contributions of the proposed model are summarized as follows:
A unified hybrid framework for automated skin cancer classification is proposed, integrating preprocessing, novel lesion segmentation, hybrid deep and handcrafted feature representation, feature optimization, and hybrid classification within a single end-to-end architecture. Unlike conventional pipelines that treat these stages independently, the proposed framework enables complementary interaction among all modules, resulting in improved robustness, generalization, and multi-class classification performance.
A novel dermoscopic lesion segmentation network, termed CutisNet, is introduced to accurately delineate lesion boundaries through hierarchical feature encoding, multi-scale contextual aggregation, and coarse-to-fine decoding. By effectively preserving lesion morphology and boundary details under challenging imaging conditions, CutisNet achieves superior segmentation performance compared with established architectures, including U-Net, U-Net++, and DeepLabV3+.
A novel iterative hair artifact removal strategy is developed by integrating Frangi vesselness filtering, Gabor texture filtering, morphological refinement, and Telea inpainting. The complementary strengths of vessel enhancement and texture analysis enable effective suppression of both linear and curved hair artifacts while preserving lesion integrity and minimizing the loss of diagnostically relevant structures.
A unique hybrid representation learning strategy is proposed by integrating deep features extracted from MobileNetV2 and a self-supervised ViT-based DINO with uniquely selected handcrafted descriptors, including textural, geometric, symmetric, and keypoint-based features. The complementary fusion of local texture information, global contextual dependencies, structural characteristics, and clinically relevant handcrafted descriptors produces a more discriminative and robust feature representation than any individual feature extraction approach.
A novel hybrid GNN–CNN classification framework is proposed to jointly exploit graph-based relational learning and convolutional feature learning for multi-class skin lesion classification. The CNN effectively captures discriminative local lesion patterns, while the GNN models structural relationships among the optimized feature representations, enabling improved feature interaction, enhanced classifier generalization, and more accurate discrimination of visually similar skin lesion categories. Extensive experiments, comparative evaluations, and ablation studies on benchmark datasets, including International Skin Imaging Collaboration—ISIC, PAD-UFES-20, Derm7pt, BCN20000, and PH2, demonstrate the superior effectiveness, generalization capability, and contribution of the proposed framework over existing state-of-the-art methods.
2. Literature Review
Skin cancer has become one of the fastest growing cancers globally, with melanoma responsible for a large proportion of skin cancer related mortality due to its aggressive and metastatic nature. Epidemiological studies have reported a steady rise in incidence, particularly in populations with high ultraviolet exposure and aging demographics, emphasizing the increasing disease burden [
1]. The prevalence of late-stage diagnoses further underscore the necessity of early detection, as survival rates decrease significantly with disease progression [
2]. Consequently, automated diagnostic systems are being increasingly developed to assist clinicians, reduce subjectivity, and enable scalable screening.
Conventional diagnostic methods, such as dermoscopy and visual inspection, are highly dependent on clinician expertise, leading to variability in diagnosis. Early computational approaches addressed this by extracting handcrafted features including color distribution, asymmetry, border irregularity, texture, and shape descriptors, followed by classification using machine learning algorithms, such as support vector machines, k-nearest neighbors, and random forests. Although these methods provided interpretability and a structured framework, they were limited by low feature discriminative power, sensitivity to imaging conditions, and reliance on expert-designed features [
6].
Deep learning, particularly convolutional neural networks, significantly improved skin cancer detection by enabling automatic hierarchical feature learning from raw images. These models demonstrated high accuracy by capturing complex spatial and contextual patterns and have achieved performance comparable to dermatologists in certain tasks [
5]. Architectures such as ResNet and DenseNet further enhanced performance through improved gradient flow and feature reuse [
7]. However, their dependence on large, annotated datasets and susceptibility to overfitting in limited data scenarios remain key limitations.
Segmentation based methods have been employed to improve lesion localization prior to classification, reducing background noise and enhancing feature extraction. Encoder–decoder architectures, such as U Net and fully convolutional networks, have shown strong performance in delineating lesion boundaries under challenging conditions [
8]. Despite their effectiveness, segmentation errors due to low contrast, artifacts, or irregular lesion shapes can propagate and degrade classification accuracy. Hybrid and ensemble approaches have been proposed to improve robustness by combining multiple models or integrating handcrafted and deep features. Attention mechanisms and multi-scale feature fusion further enhance the focus on clinically relevant regions and improve feature representation across scales [
9]. While these methods achieve higher accuracies, they introduce increased computational complexity and reduced interpretability, limiting their practicality in real-world clinical settings.
Transformer-based architectures have recently gained attention due to their ability to model global dependencies and contextual relationships within images. Vision Transformers and hybrid CNN transformer models show promising performance in capturing global lesion characteristics [
10]. However, their high computational requirements and reliance on large-scale annotated datasets restrict their widespread application in medical imaging. Transfer learning has been widely adopted to mitigate data scarcity by leveraging pretrained models, improving convergence speed and classification performance [
11]. Nevertheless, domain mismatch between natural and medical images can limit feature relevance, requiring careful fine tuning for reliable results.
Despite these advancements, several challenges persist. Dataset imbalance, where malignant cases are underrepresented, leads to biased predictions and reduced sensitivity [
6]. Variations in imaging conditions, acquisition devices, and annotation standards hinder generalization across clinical settings [
12]. Additionally, limited interpretability of deep learning models raises concerns regarding trust and clinical adoption [
13]. In summary, while deep learning and advanced hybrid models have substantially improved skin cancer detection, the increasing disease burden highlights the need for robust, generalizable, and interpretable systems that can effectively operate in real-world clinical environments.
3. Materials and Methods
The proposed methodology presents a unified framework for skin lesion analysis by integrating preprocessing, segmentation, feature extraction, optimization, and classification into a single pipeline. It leverages both deep and handcrafted features to capture comprehensive lesion characteristics. The overall architecture of the proposed system is illustrated in
Figure 1.
3.1. Image Preprocessing and Enhancement
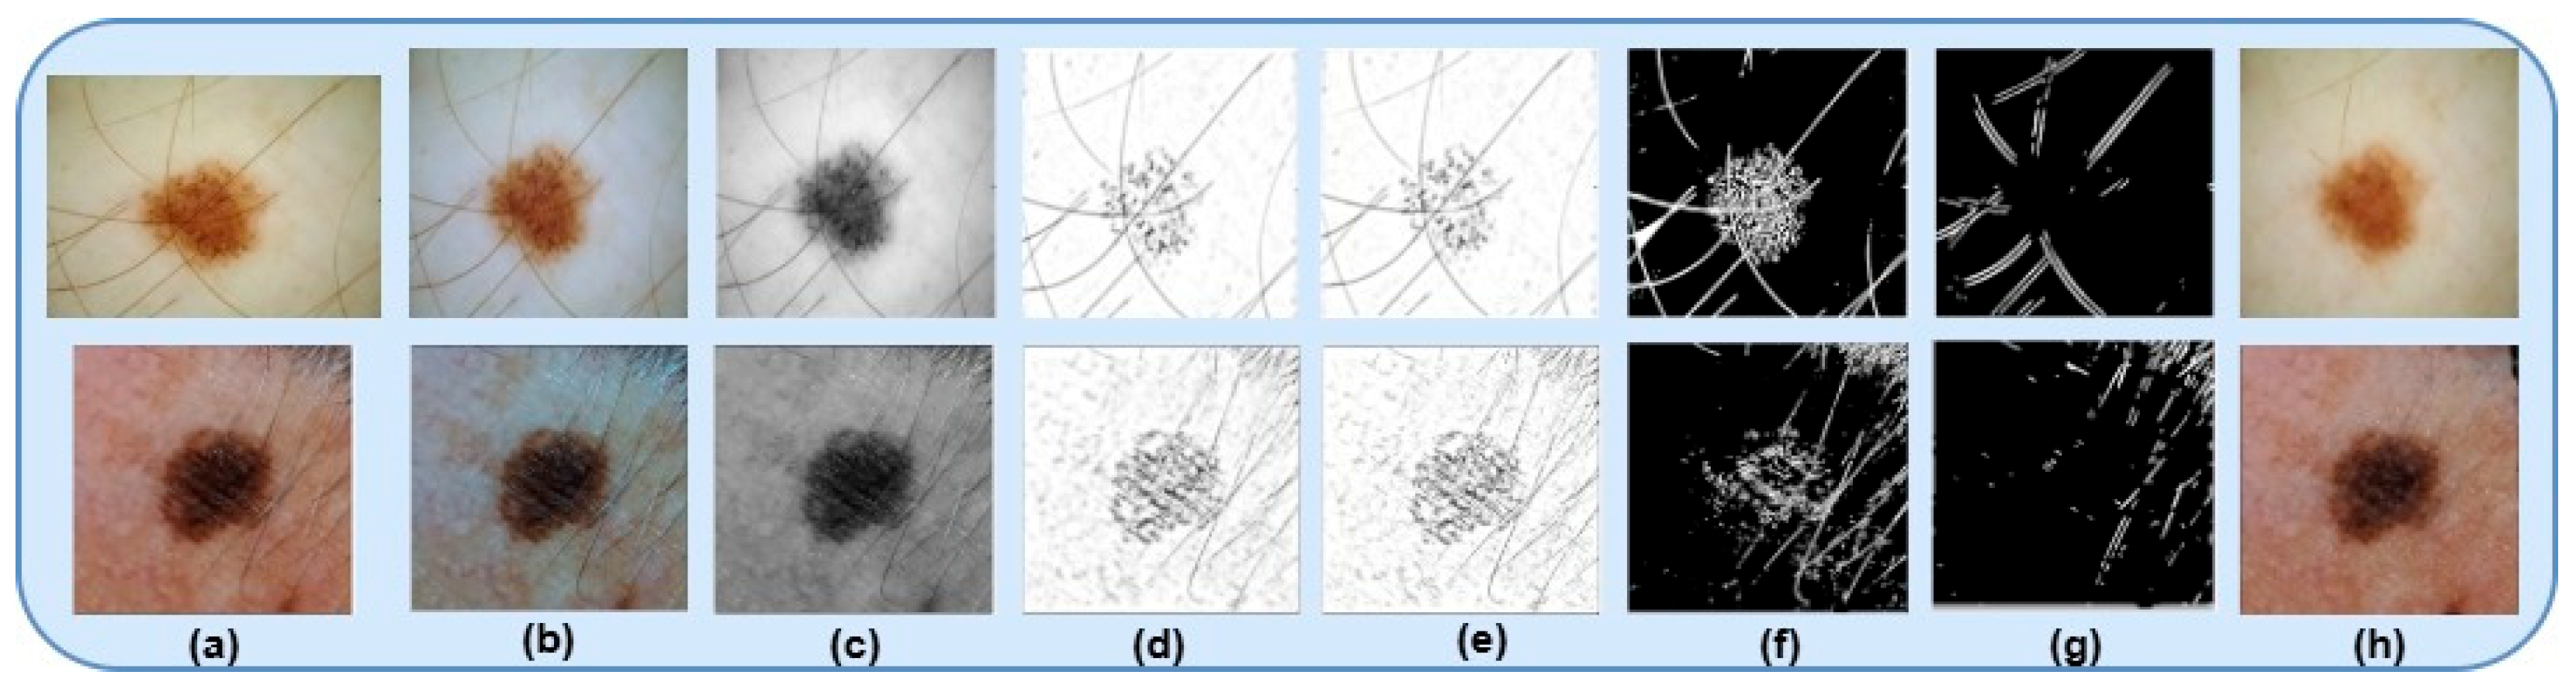
A multi-stage preprocessing pipeline was employed to enhance dermoscopic image quality and consistency, including color normalization, illumination correction, contrast enhancement, and noise reduction. Initially, gray world color normalization corrected color imbalance. We let
denote the RGB image, displayed in
Figure 2a, where
. The mean intensity of each channel is
, and the global gray average is
. Each channel is scaled to enforce color constancy, as expressed by Equation (1), producing
Figure 2b.
The normalized image was converted to grayscale
, as shown in
Figure 2c, followed by illumination correction to suppress uneven lighting effects. A smoothed illumination estimate
was obtained using Gaussian filtering as
and the corrected image was computed using homomorphic normalization with Equation (2)
Contrast was enhanced using CLAHE, yielding
Figure 2d. Finally, bilateral filtering performed edge-preserving smoothing. The filtered image
, as shown in
Figure 2e, is defined as Equation (3).
where
and
control spatial and intensity similarity, and
is a normalization factor. This pipeline ensures color constancy, corrects illumination, enhances contrast, and preserves structural details, enabling reliable feature extraction and skin cancer classification.
3.2. Hair Artifact Removal Using Frangi–Gabor Fusion and Iterative Inpainting
Hair artifacts were removed using an iterative multi-scale filtering framework combining Frangi vesselness filtering, Gabor texture filtering, morphological refinement, and image inpainting. We let the preprocessed grayscale image be denoted as
. Hair structures were enhanced using Frangi filtering, which detects tubular structures via eigenvalues of the Hessian matrix. The vesselness response is given as Equation (4)
where multiple scales of
capture both fine and thick hairs, with the mask shown in
Figure 2f. In parallel, Gabor filtering was applied to capture linear-oriented textures. The response for orientation
is given by Equation (5)
where
is a Gabor kernel. Multi-orientation responses were aggregated using a maximum operation,
, for
, producing the mask in
Figure 2g. Hair candidate regions were extracted via adaptive percentile thresholding as
and
, where
and
are dynamically computed. The final hair mask was obtained as
. To enhance spatial coherence, morphological closing and dilation were applied, as given by Equation (6)
Detected hair regions were removed using Navier–Stokes-based image inpainting (Telea method):
. This process was iteratively repeated to refine hair suppression while preserving lesion structure. The fusion of Frangi and Gabor responses enables robust detection of both curved and linear hair artifacts, producing cleaner lesion boundaries for downstream analysis, as shown in
Figure 2h. The proposed fusion-based hair artifact removal strategy contributes to the robustness of the overall framework by effectively eliminating both linear and curved hair artifacts while preserving diagnostically important lesion structures for subsequent analysis.
3.3. Proposed CutisNet for Lesion Segmentation
Despite many benefits of dermoscopy, accurate lesion segmentation of dermoscopic images is still a challenge because of the ill-defined boundaries of lesions, skin color differences, and artifacts like hairs, shadows, and illumination inconsistencies. Most of the current segmentation methods are unable to simultaneously maintain fine boundary details and high-level semantic context. More down-sampling will result in a loss of spatial precision and less up-sampling will result in a loss of robustness to real-world variations. Recent studies have also shown that performance deteriorates when a domain shift occurs, which further underscores the importance of developing solid, multi-scale architectures [
8].
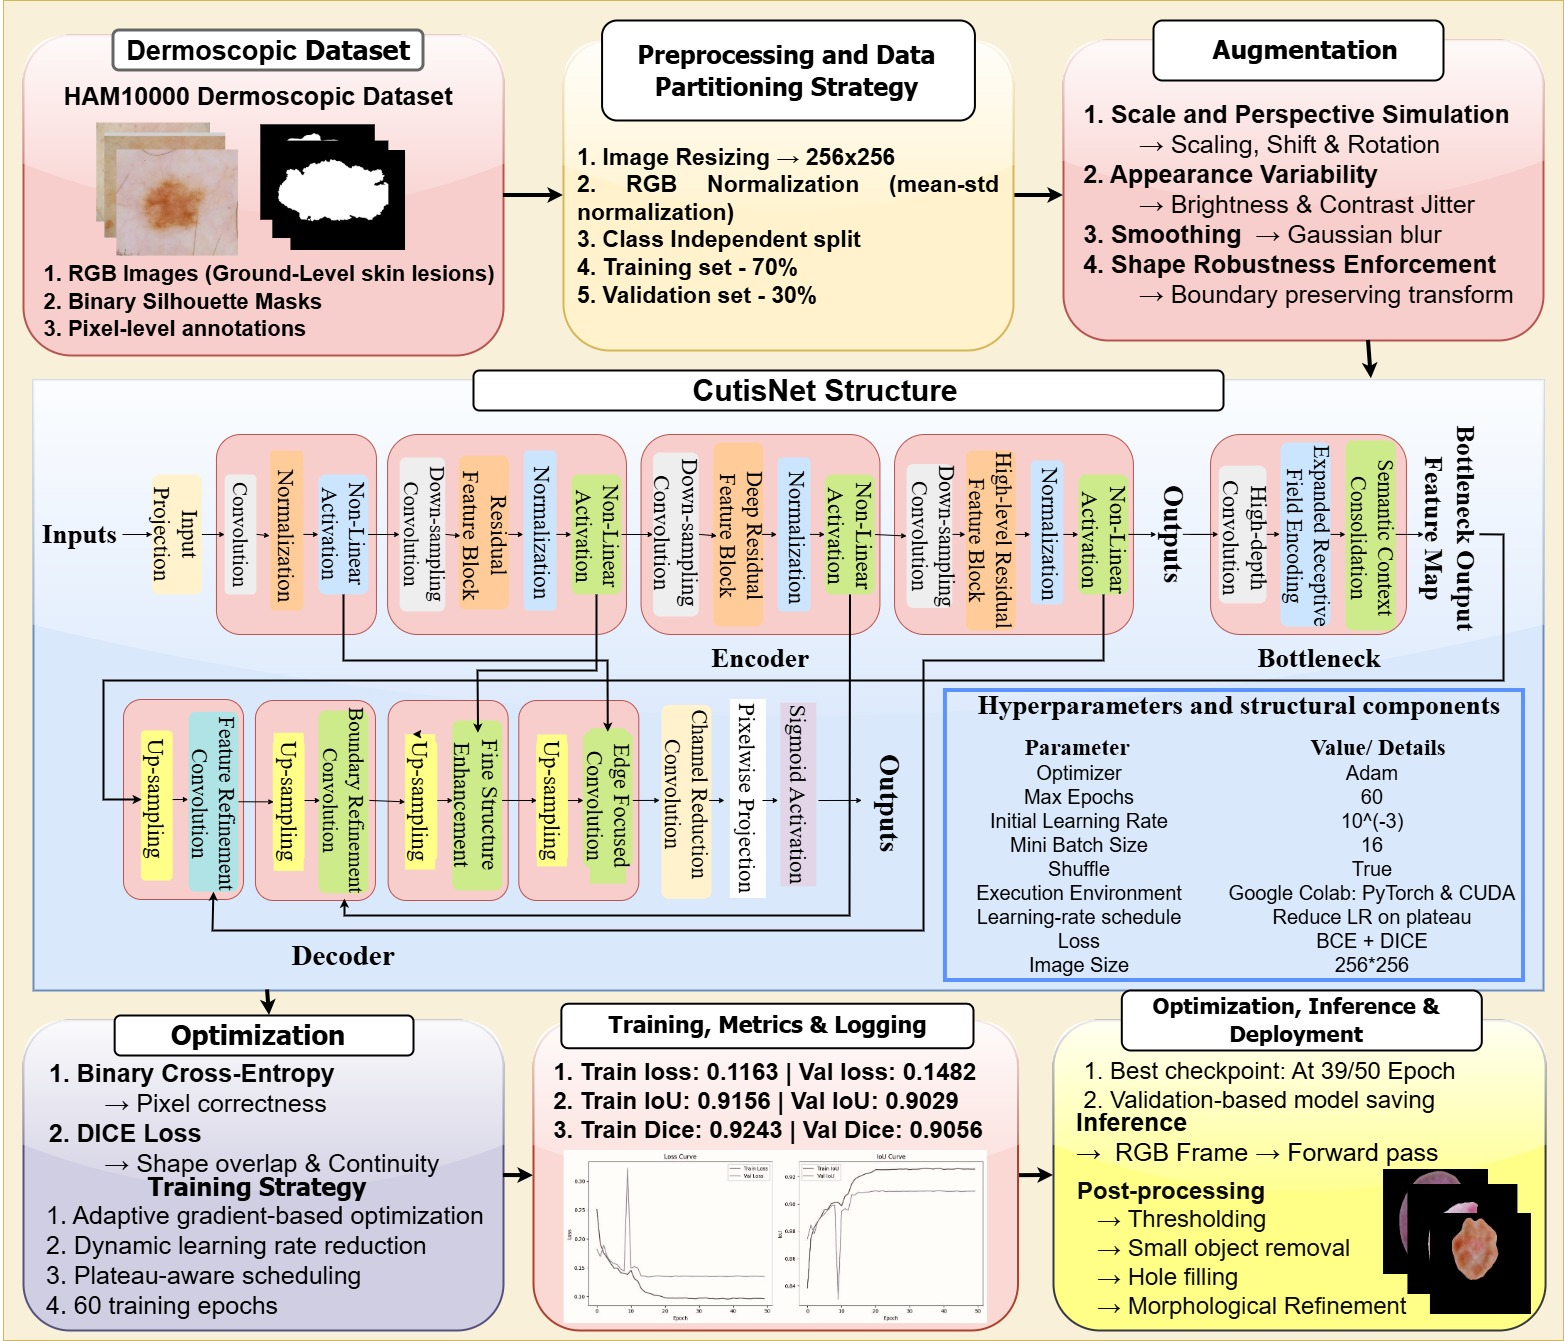
To address these limitations, we propose CutisNet, a specialized encoder–decoder network designed for dermoscopic lesion segmentation. The model is trained using extensive augmentation strategies to simulate real clinical conditions, improving generalization. The architecture is illustrated in
Figure 3 and detailed in
Table 1. When given an RGB dermoscopic image
, CutisNet learns a mapping, which is given as Equation (7)
The model is trained on the HAM10000 [
14] dataset, which contains dermoscopic RGB images and corresponding expert-annotated binary masks. The dataset is split into 70% training and 30% validation. To enhance robustness, each image–mask pair undergoes augmentation using Equation (8)
CutisNet follows an encoder–context–decoder structure. The encoder
extracts hierarchical features:
. A multi-scale context module
captures global dependencies using parallel dilated convolutions:
. Low-level features
are preserved for spatial refinement:
. The decoder
reconstructs the segmentation by fusing semantic and spatial features using Equation (9)
Training minimizes a hybrid loss by combining Binary Cross-Entropy and Dice loss
, while post-processing refines predictions through thresholding and morphological operations using Equation (10)
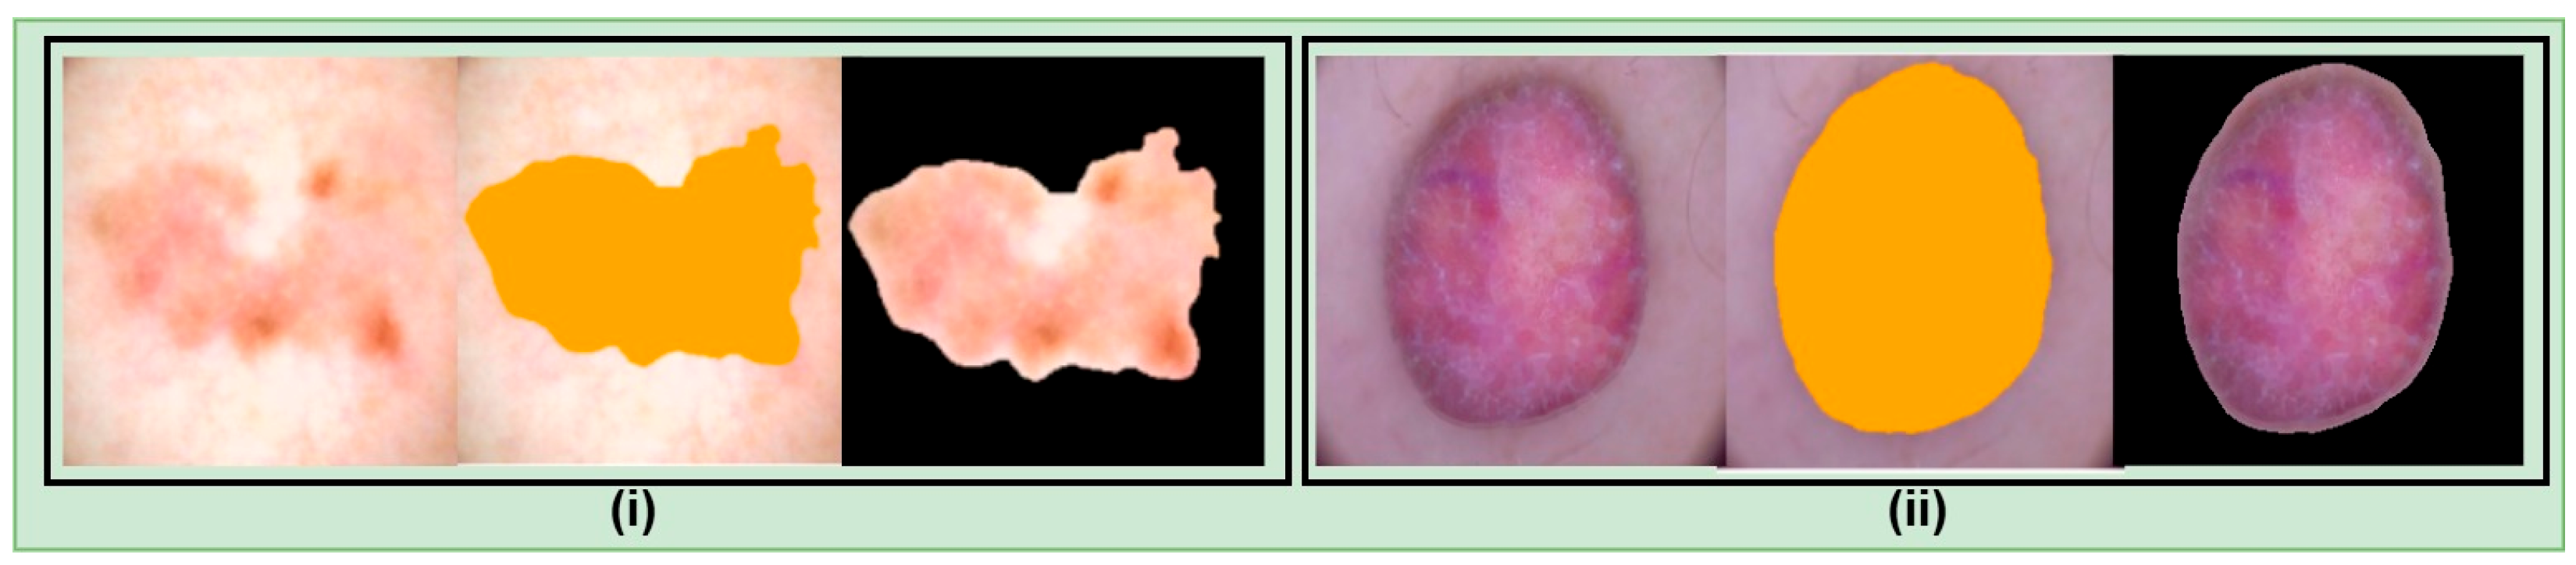
The architecture diagram is given in
Figure 3, and the segmentation results are presented in
Figure 4, demonstrating improved boundary preservation and structural consistency, while the detailed architecture is provided in
Table 1.
As shown in
Table 2, CutisNet achieves the highest Dice Score and IoU, outperforming the baseline models in segmentation accuracy. Although it has a comparable number of parameters to U-Net++, it delivers superior boundary delineation and robustness, particularly in challenging cases involving hair artifacts and low-contrast lesions. This improvement stems from the effective integration of the EfficientNet-B4 encoder with the DeepLabV3+ decoder, which provides richer multi-scale contextual information.
The proposed CutisNet enhances the robustness of the overall framework by providing accurate and reliable lesion boundary delineation, ensuring high-quality lesion masks for subsequent feature extraction and classification.
3.4. Multi-Model Deep Representation Learning
A hybrid deep feature extraction strategy is employed, where a CNN-based MobileNetV2 captures fine-grained local- and texture-level details, while a complementary ViT-based DINO learns global contextual representations. This combination enables robust and discriminative feature learning by effectively modeling both spatial details and long-range dependencies within skin lesions.
3.4.1. CNN-Based Deep Feature Extraction Using MobileNetV2
To learn high-level representations of skin lesions, a pretrained MobileNetV2 [
15] network was utilized. Each input image
was resized to
and normalized using Equation (11).
where
and
are channel-wise parameters. The normalized image was then passed through the network to extract hierarchical features. MobileNetV2 employs depthwise separable convolutions, where standard convolution is decomposed into depthwise and pointwise operations. The depthwise convolution is defined as Equation (12)
where
is the depthwise kernel. This is followed by a pointwise
convolution to combine channel information using Equation (13)
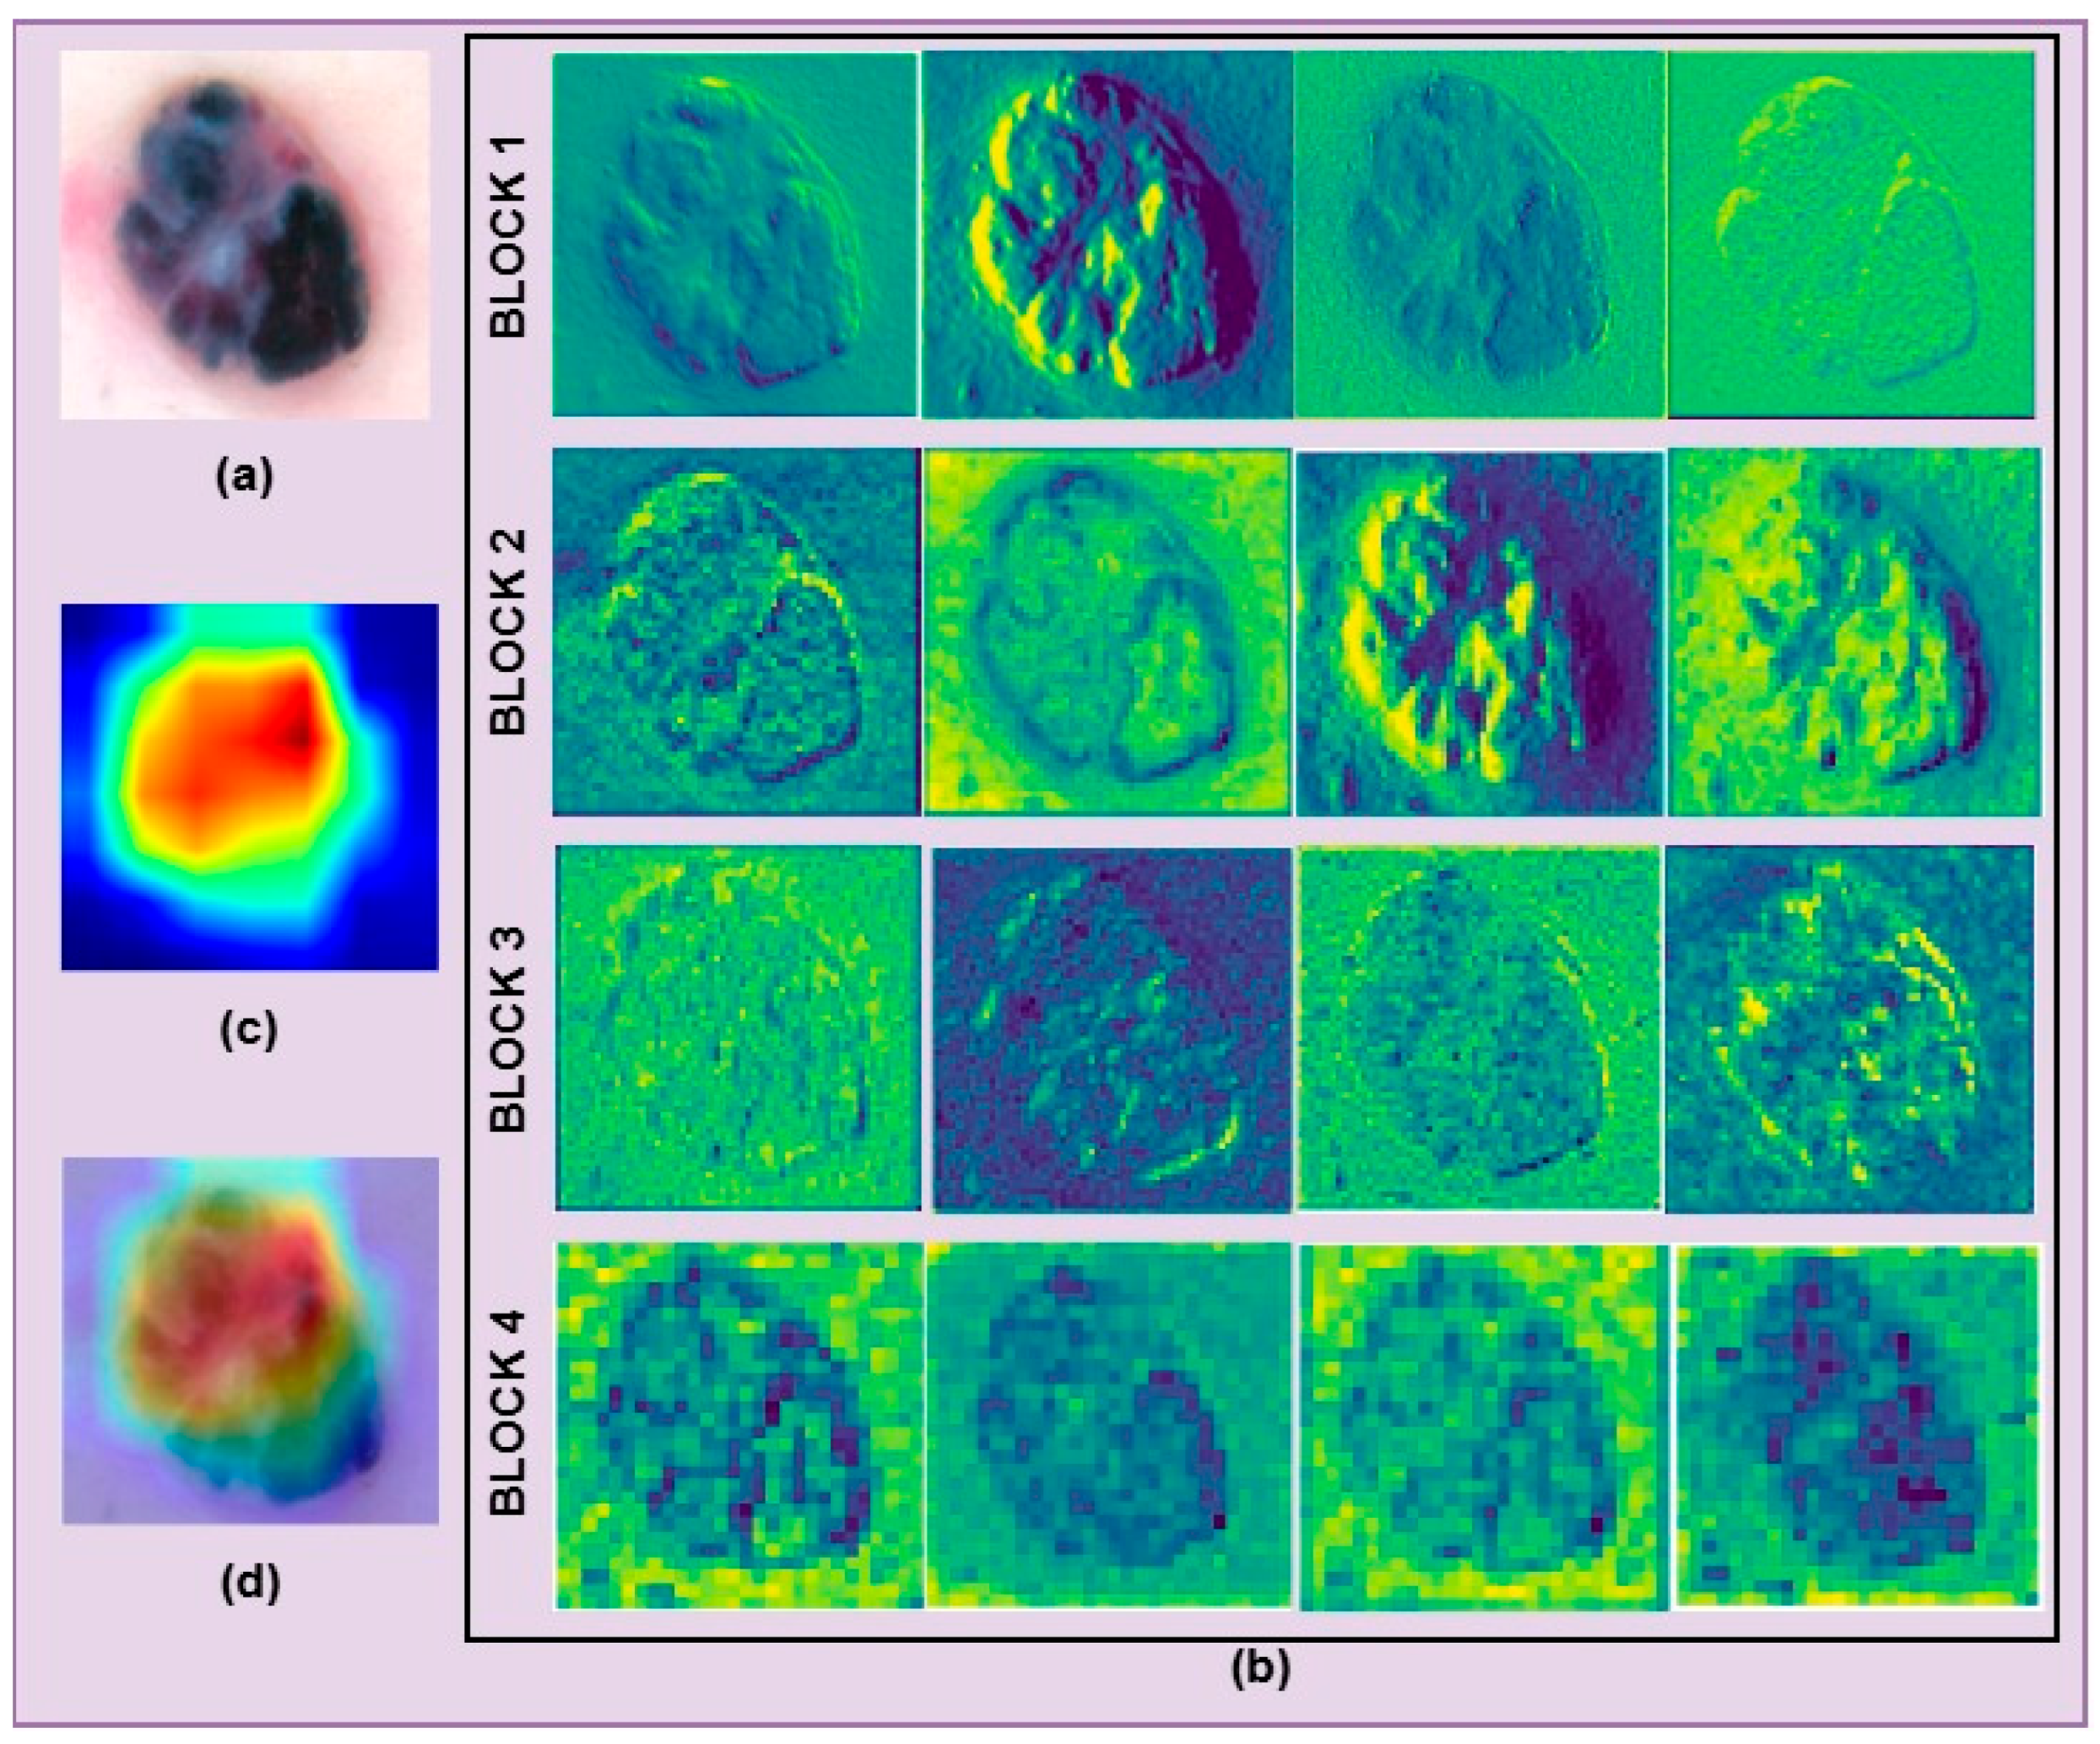
To capture multi-level representations, activations from the first six expansion blocks were extracted as
, where
denotes the non-linear transformation at layer
. For each activation tensor
, channel importance was computed using mean activation, as given by Equation (14)
The top
channels with the highest
were selected. Each feature map was normalized using Equation (15)
where
is the standard deviation of the
-th channel, and
ensures numerical stability. These intermediate feature maps, as displayed in
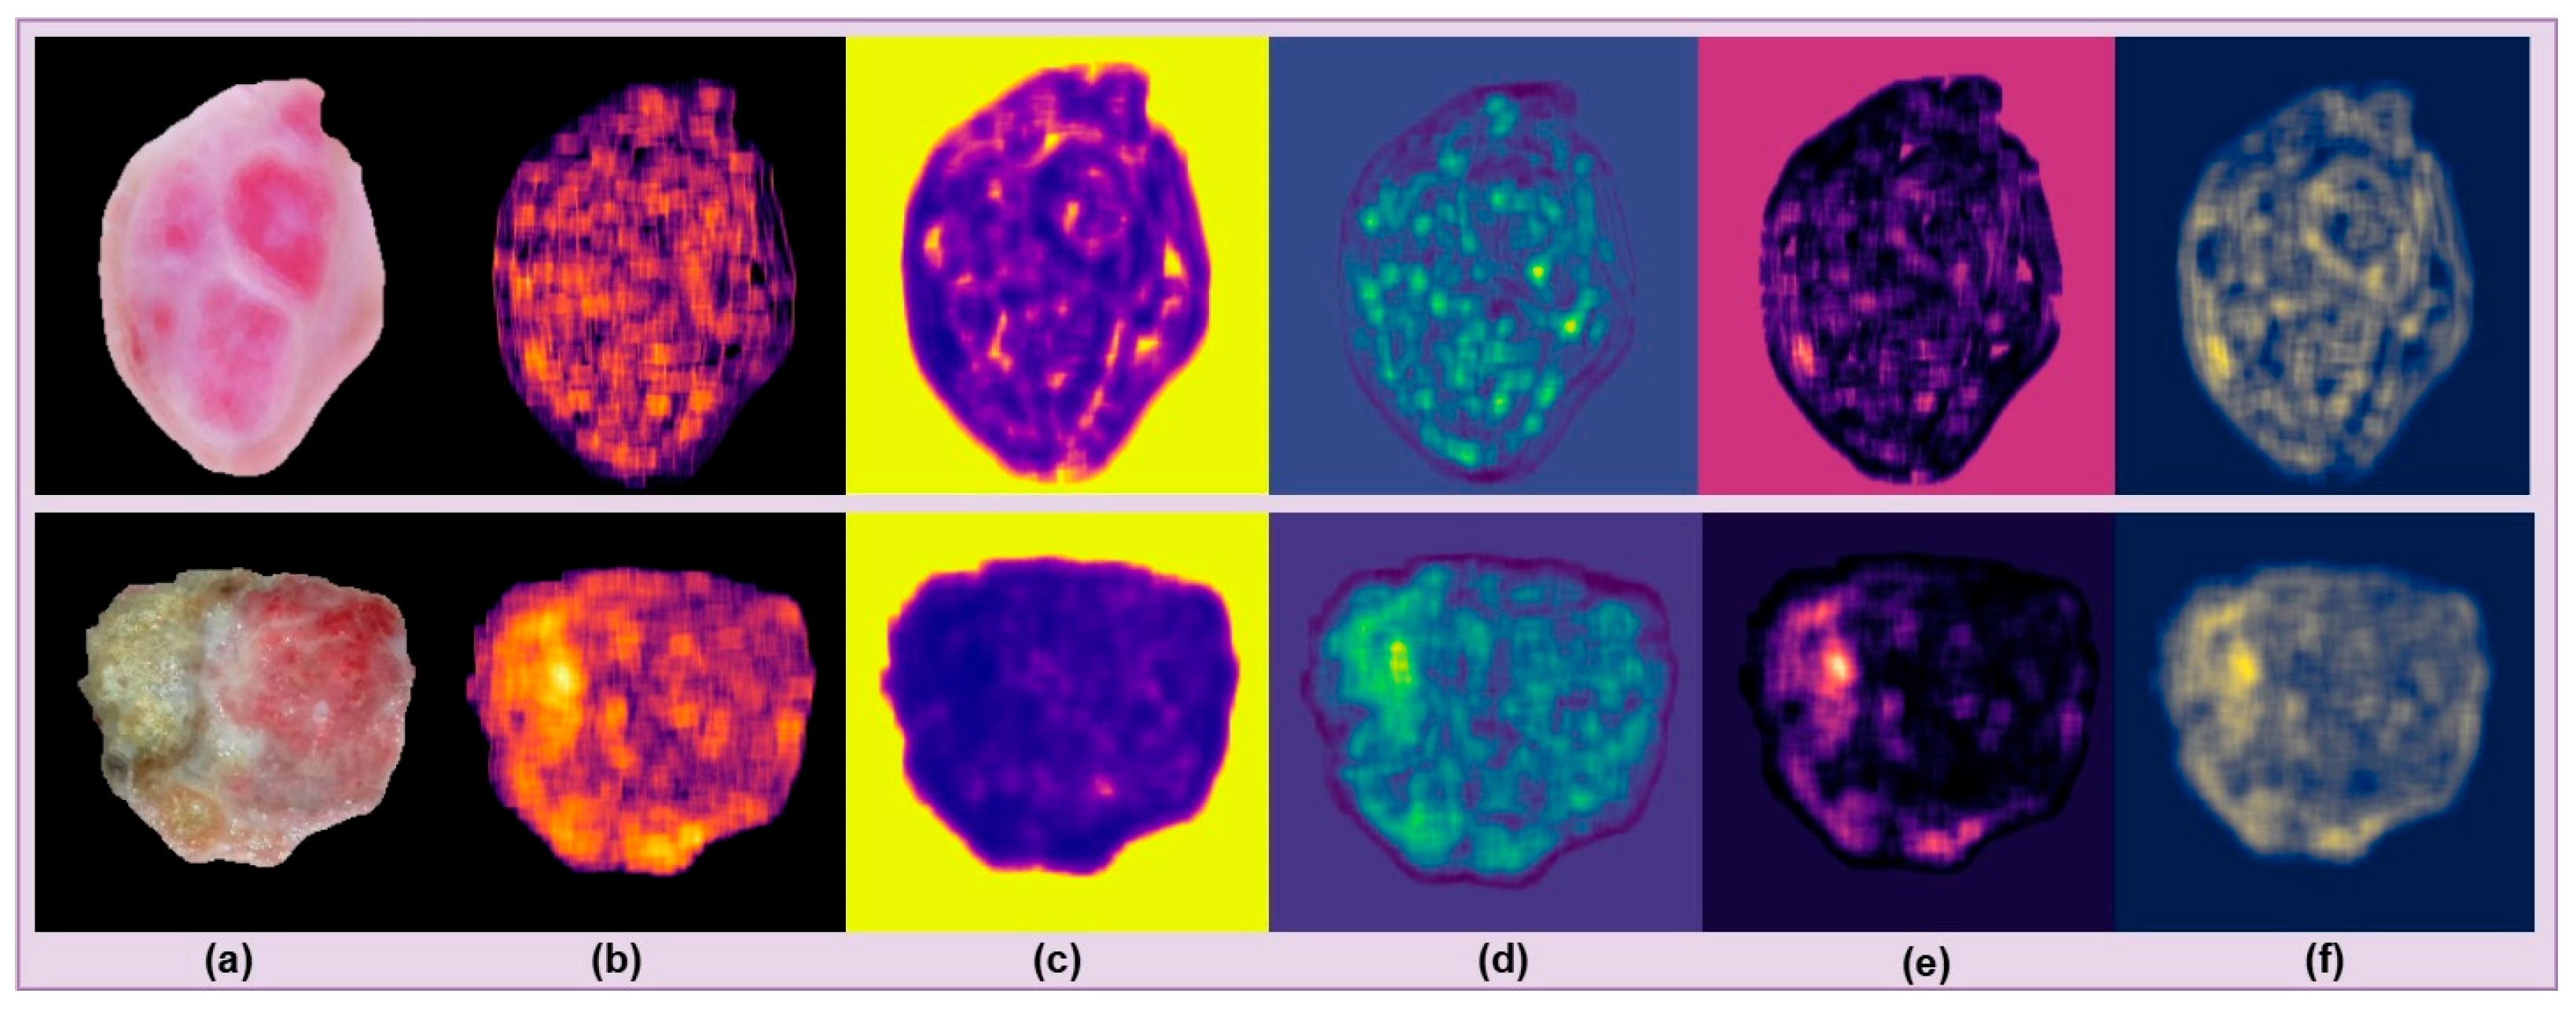
Figure 5, capture progressively complex patterns, ranging from low-level edges and textures to high-level lesion-specific structures, enabling MobileNetV2 to efficiently learn discriminative local lesion representations that enhance the robustness of the proposed skin cancer classification framework while maintaining computational efficiency.
3.4.2. Self-Supervised Vision Transformer Feature Extraction Using DINO
To capture global contextual representations, a self-supervised Vision Transformer (ViT-S/8) that was pretrained using DINO was employed. Each hair-removed image
was resized, normalized using ImageNet statistics, and divided into non-overlapping
patches. The image was converted into token embeddings as
, where
is the classification token and
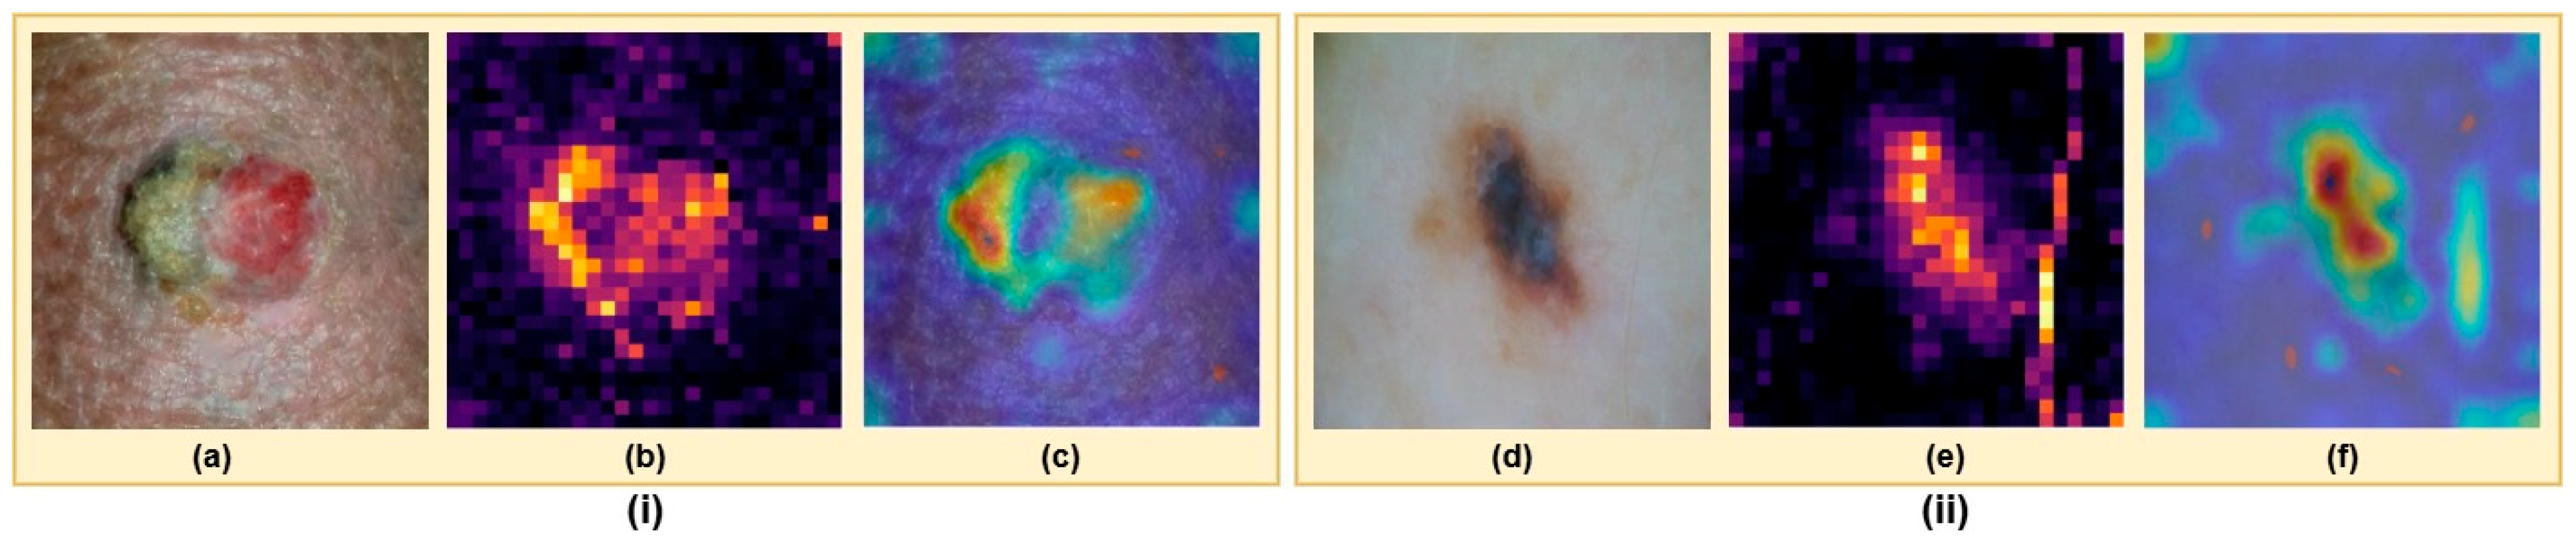
is the number of patches, as displayed in
Figure 5. Self-attention was computed using Equation (16)
where
,
, and
are the query, key, and value matrices; and
is the feature dimension. Spatial relevance was obtained using class-to-patch attention
, producing a vector of length
, which was reshaped into a spatial grid
. To improve stability, attention across multiple heads was averaged using Equation (17)
where
is the number of heads. The resulting attention map was normalized to
using Equation (18)
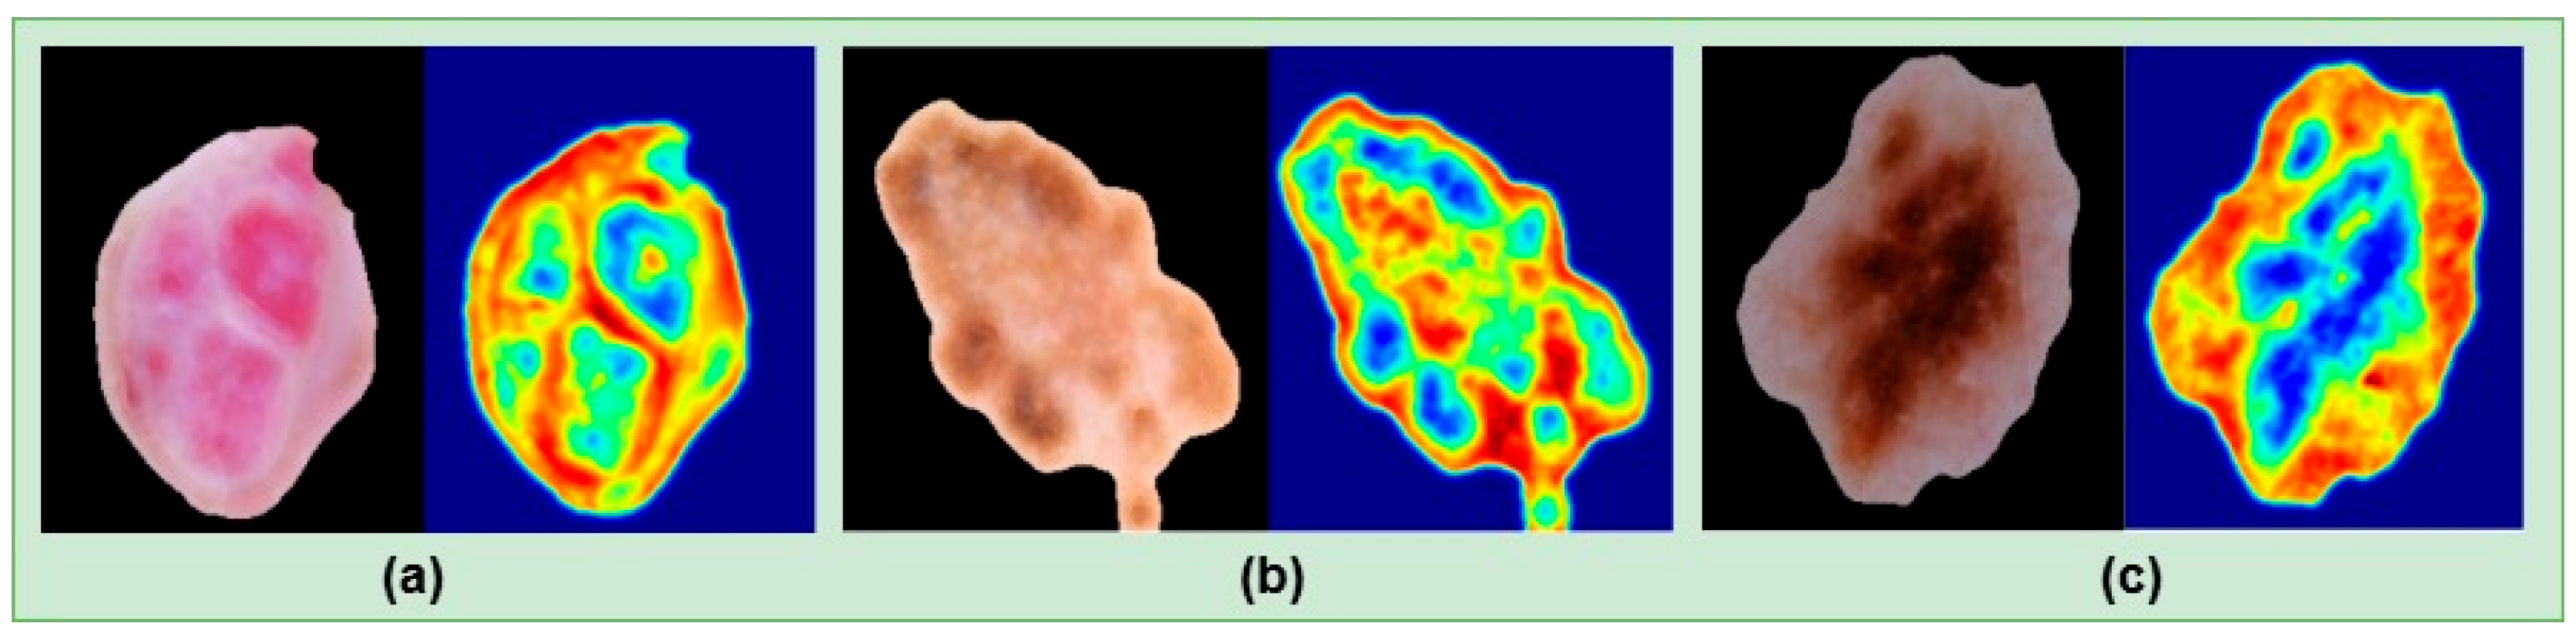
Finally, the map was up-sampled to the original image size using nearest-neighbor interpolation to preserve patch boundaries. The resulting attention maps, as shown in
Figure 6, highlight diagnostically relevant lesion regions and capture rich global contextual representations with long-range feature dependencies, enabling the self-supervised ViT-based DINO to complement the local texture information extracted by MobileNetV2 and enhance the robustness of the proposed skin cancer classification framework.
3.5. Multi-Strategy Keypoint-Based Feature Extraction
SIFT extracts scale- and rotation-invariant keypoints, while superpixel-based contour analysis captures boundary-aware keypoints, providing complementary structural information.
3.5.1. Superpixel-Based Centroid and Contour Keypoint Extraction
To capture local structural patterns of skin lesions, the segmented lesion image was partitioned into
superpixels
using the SLIC algorithm, which clusters pixels based on color and spatial proximity by minimizing the distance metric using Equation (19)
where
is the color distance,
is the spatial distance,
is the nominal superpixel size, and
is a compactness parameter controlling shape regularity. For each superpixel
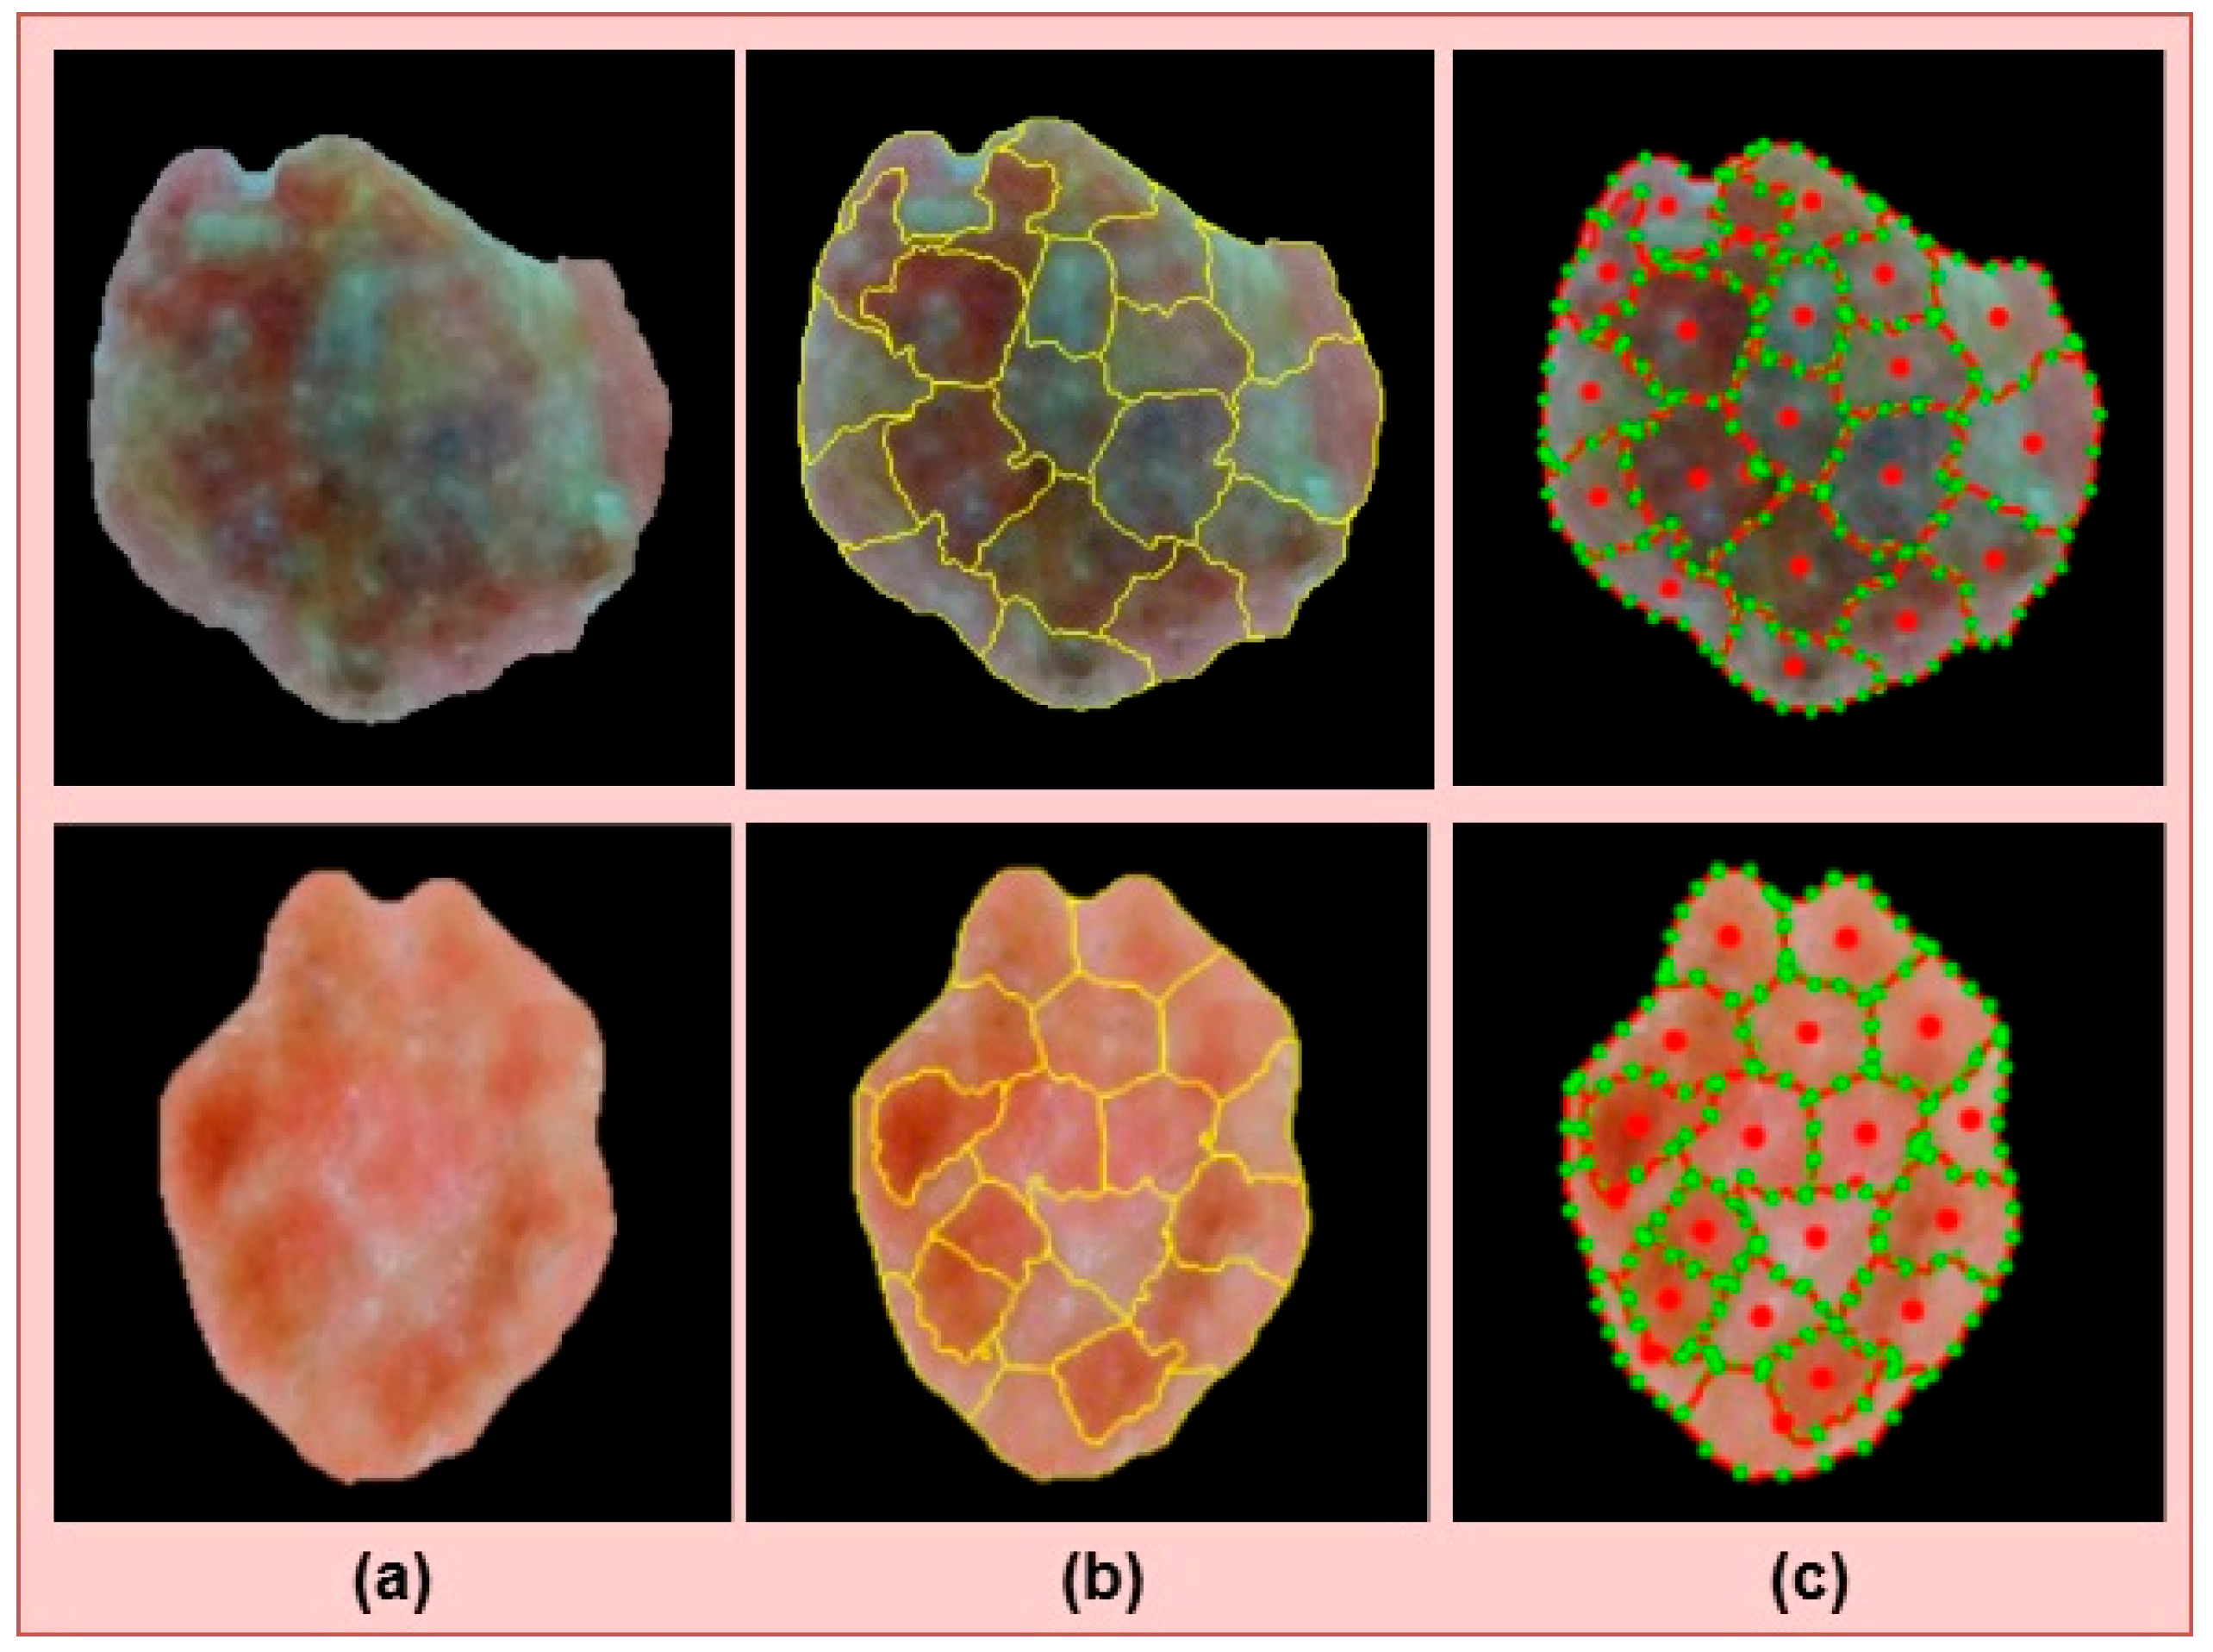
, as shown in
Figure 7b, contours
were extracted using boundary detection. To reduce dimensionality while preserving structural information, keypoints
were sampled evenly along each contour by employing Equation (20)
where
is the total number of contour points and
is the number of sampled points per contour. Additionally, the centroid of each superpixel was computed using image moments, as given by Equation (21)
where
is the indicator function. This process yields superpixels, contour-based keypoints, and centroids, as displayed in
Figure 7c. The extracted superpixel centroid and contour keypoints contribute complementary structural and boundary information by preserving lesion geometry and spatial organization, thereby enhancing the robustness of the proposed framework and improving its feature discrimination for skin lesion classification.
3.5.2. SIFT Keypoint-Based Feature Extraction
To capture scale- and rotation-invariant local features from skin lesions, the Scale-Invariant Feature Transform (SIFT) algorithm was applied to detect keypoints and compute descriptors. SIFT identifies extrema in the Difference-of-Gaussians (DoGs) scale space defined as Equation (22)
where
is a Gaussian kernel of standard deviation
,
is a multiplicative scale factor, and
denotes convolution. Keypoints are identified as local extrema of
across space and scale. Each keypoint is assigned a dominant orientation
based on local image gradients using Equation (23)
where
and
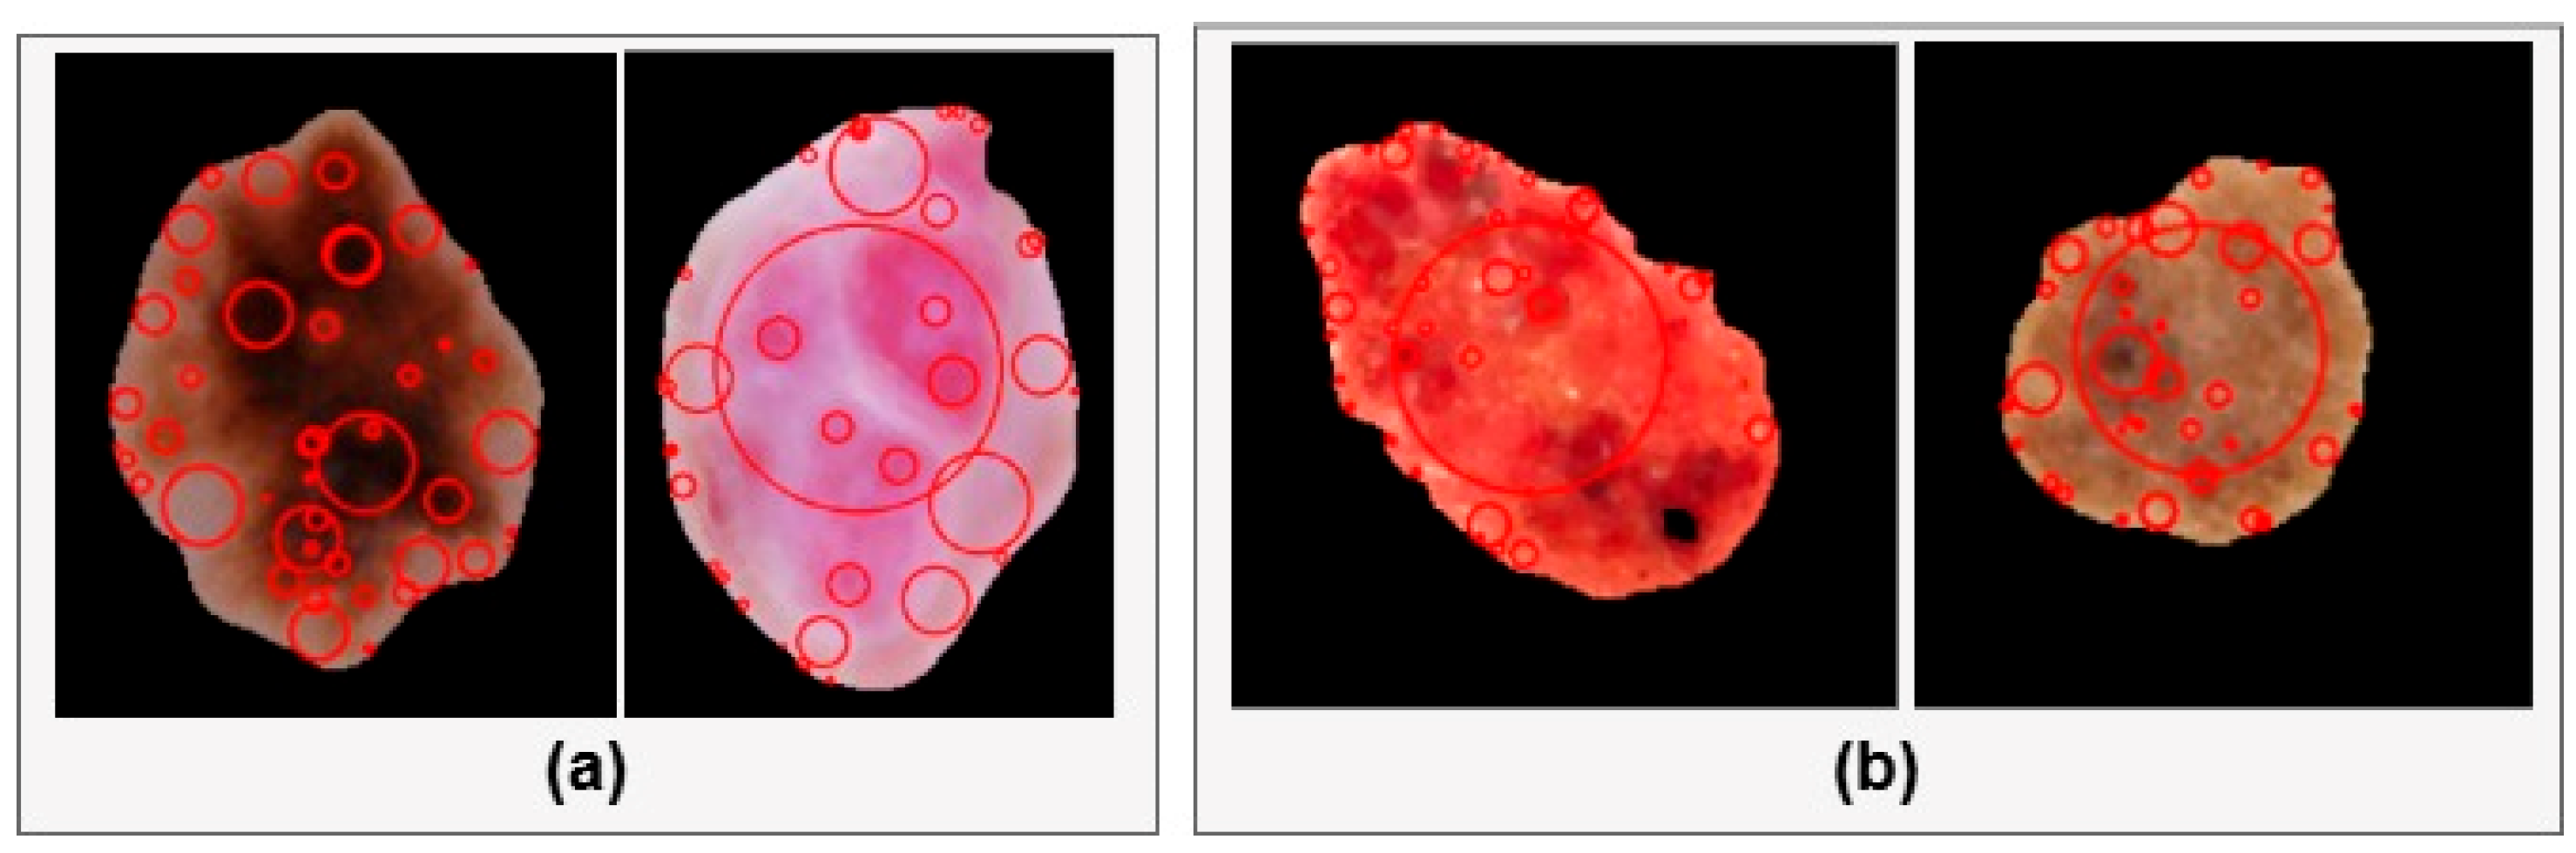
are image gradients in the x and y directions. For each keypoint, a 128-dimensional descriptor is formed from histograms of gradient orientations within a local neighborhood, providing robustness to illumination and rotation. These SIFT features, as displayed in
Figure 8, effectively encode edges, corners, and blob-like structures to generate scale- and rotation-invariant local descriptors, improving robustness against variations in lesion size, orientation, and imaging conditions while providing highly discriminative representations for skin lesion classification.
3.6. Hybrid Texture Feature Representation
GLRLM, Tamura, and Gabor features are combined to capture run-length statistics, perceptual texture, and frequency-based patterns for comprehensive lesion texture representation.
3.6.1. Texture Analysis Using Gray-Level Run-Length Matrix (GLRLM)
To extract fine-grained texture information from dermoscopic segmented images, each image was first converted to grayscale
using the standard luminance formula of
, where
are the color channels. The grayscale image was quantized into
levels using Equation (24)
A
sliding window with reflective padding was applied to compute the Gray-Level Run-Length Matrix (GLRLM) [
16] of
, where
is the gray level and
is the run length, counting horizontal runs of length
at gray levels
. From the GLRLM, five texture descriptors were extracted. Short Run Emphasis (SRE) and Long Run Emphasis (LRE) capture short and long texture structures by using Equation (25)
Gray-Level Non-Uniformity (GLN) and Run-Length Non-Uniformity (RLN) measure intensity and run variability by using Equation (26)
Run Percentage (RP) reflects the run density, and is mathematically expressed as Equation (27). Pixel-wise feature maps were generated using sliding windows and normalized via min–max scaling using Equation (27)
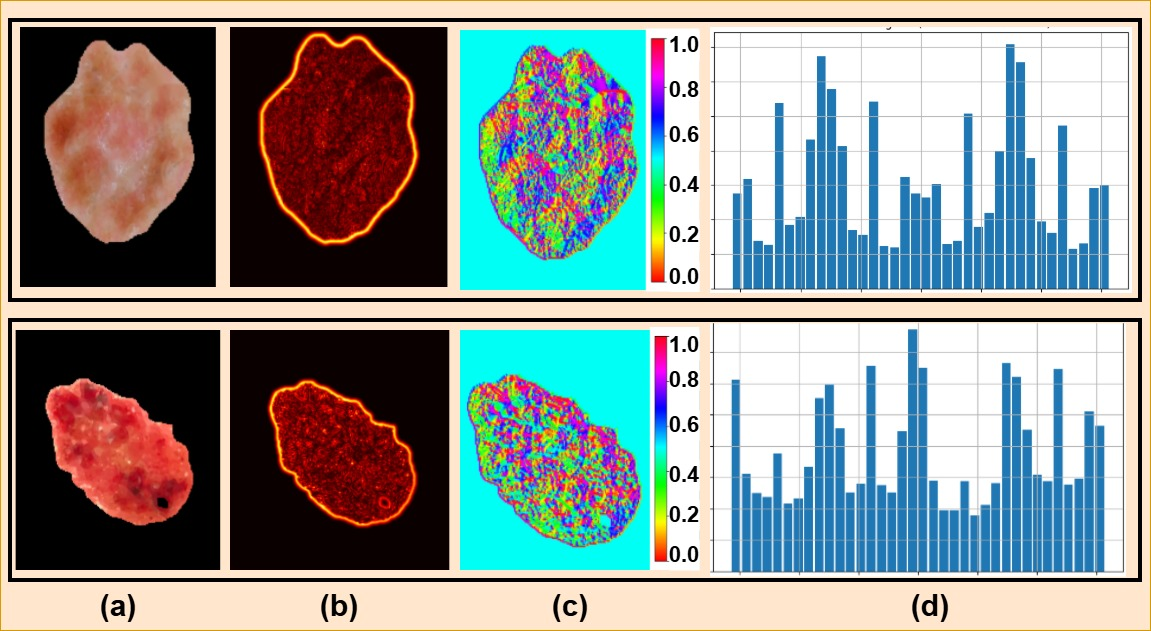
These normalized GLRLM maps, as displayed in
Figure 9, capture local texture variations in skin lesions and serve as discriminative features for classification. GLRLM features contribute complementary statistical texture information by capturing gray-level run-length characteristics associated with lesion homogeneity and structural heterogeneity.
3.6.2. Gabor Filter-Based Texture Analysis
Gabor filters, which combine Gaussian envelopes with sinusoidal plane waves, were applied to the enhanced grayscale image. A 2D Gabor filter
, at wavelength
, orientation
, Gaussian standard deviation
, and spatial aspect ratio
, is defined as Equation (28)
where
The filter was applied at multiple orientations
and wavelengths corresponding to spatial frequencies
using 2D convolution as
where
denotes convolution. The Gabor energy map was then computed using Equation (29), as depicted in
Figure 10, by summing the absolute values of all filter responses.
This was then normalized to the range of
for visualization by using Equation (30)
where
and
are the minimum and maximum values of
, respectively. These Gabor energy maps encode directional and frequency-specific texture patterns of skin lesions, capturing structural variations, such as streaks, ridges, and spots. Gabor features contribute multi-scale and multi-orientation texture representations that effectively characterize directional lesion patterns and fine surface textures, enhancing feature discrimination.
3.6.3. Tamura Texture Feature Extraction
To characterize skin lesion textures, the input image was first converted to grayscale, and Tamura texture descriptors were computed for contrast and directionality. The contrast map, as shown in
Figure 11b, captures intensity variation using standard deviation
, mean
, and normalized fourth central moment
, as defined by Equation (31)
Figure 11c shows the directionality map that captures edge orientation consistency. Image gradients are computed using Sobel operators, as given by Equation (32)
A magnitude-weighted histogram of
is constructed, and directionality is defined as the variance of this histogram, i.e.,
as displayed in
Figure 11d. These Tamura-based contrast and directionality descriptors provide a compact representation of local intensity variation and edge orientation patterns in skin lesions, supporting effective classification.
3.7. Morphological and Geometric Feature Extraction
To effectively characterize the structural properties of skin lesions, a set of geometric and shape-based descriptors is extracted. These features capture global morphology, invariant shape patterns, and symmetry characteristics, providing complementary information for robust lesion analysis.
3.7.1. Ellipse-Based Geometric Feature Extraction
To characterize global lesion shape, the dermoscopic image
was converted to grayscale
and smoothed using Gaussian filtering with
, where
is a Gaussian kernel and
denotes convolution. A binary lesion mask
was obtained via Equation (33)
ensuring that the lesion region is represented by white pixels. The largest contour
was extracted and fitted with an ellipse using least squares, yielding the center
, major axis
, minor axis
, and orientation
. Ellipticity was defined as
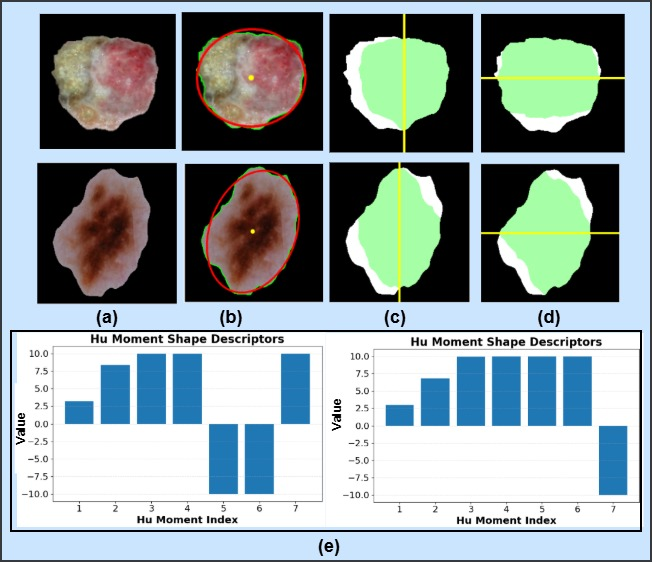
. The resulting mask is given in
Figure 12b. These geometric features (
) provide a compact representation of lesion shape, capturing elongation and orientation characteristics for distinguishing benign and malignant lesions. Ellipse fitting contributes geometric characterization of lesion morphology by providing robust shape descriptors that complement texture and deep feature representations.
3.7.2. Symmetry-Based Shape Feature Extraction
To quantify structural asymmetry, binary lesion masks
were used, where non-zero pixels represent the lesion. Symmetry was evaluated along vertical and horizontal axes by comparing the mask with its flipped versions. For vertical symmetry, the reflected mask
is defined as Equation (34) and displayed in
Figure 12c.
where
is the image width. The overlap
and vertical symmetry score
are computed using Equation (35)
For horizontal symmetry, the flipped mask
is given as Equation (36), as shown in
Figure 12d.
where
is the image height. The overlap
and symmetry score
were computed using Equation (37)
The scores and indicate greater symmetry with higher values. Symmetry analysis contributes clinically relevant morphological information by quantifying lesion asymmetry, an important indicator for distinguishing benign and malignant skin lesions.
3.7.3. Hu Moment Shape Feature Extraction
To capture the global shape characteristics of skin lesions, binary lesion masks are used.
The raw spatial moments of the binary mask were computed using Equation (38)
From these, the central moments are defined as Equation (39)
The normalized central moments are given by Equation (40)
Using these, the seven Hu invariant moments
were computed, which are invariant to translation, scale, and rotation. For numerical stability, a logarithmic transformation was applied using Equation (41)
where
avoids singularities. The centroid of the lesion was also computed as
. These Hu moments, graphically represented in
Figure 12e, provide a compact and rotation-invariant descriptor of lesion shape, complementing other geometric and texture features for robust skin cancer classification.
3.8. Feature Fusion Strategy
The proposed framework integrates heterogeneous representations by combining deep embeddings and handcrafted descriptors into a unified feature vector. We let
and
denote deep features from the ViT-based DINO and MobileNetV2, respectively. Texture features
are extracted using Tamura descriptors, GLRLM, and Gabor responses, while shape features
include Hu moments, ellipse parameters, and symmetry descriptors. Keypoint features
are derived from SIFT, superpixel centroids, and contour-based distributions. All feature vectors are first normalized using min–max scaling and computed by Equation (42)
The normalized features are then fused at the feature level using Equation (43), where
denotes concatenation.
The deep and handcrafted features are normalized using min–max scaling and concatenated to form a fused feature vector of 5313 dimensions. Gray Wolf Optimization (GWO) is then applied to select the most discriminative features, resulting in a final optimized feature vector of 1856 dimensions, as given in
Table 3.
3.9. Gray Wolf Optimization for Feature Selection and Refinement
To enhance discriminative power and reduce redundancy in the fused feature space
, Gray Wolf Optimization (GWO) is employed for adaptive feature weighting and selection. Each candidate solution represents a weight vector as
, where
denotes feature importance. The objective is to minimize classification loss
with regularization computed using Equation (44). GWO is guided by three leaders
(best solutions), while the remaining wolves update their positions using Equation (44)
where
is the best solution. The coefficients are given by Equation (45)
where
decreases linearly from 2 to 0, and
ensuresthe exploration–exploitation balance. The optimal weights
are obtained from
, producing refined features, as calculated by Equation (46)
This optimization enhances class separability by retaining informative features while suppressing redundant and noisy components, improving the performance of the downstream GNN–CNN classifier.
Gray Wolf Optimization (GWO) was selected for feature selection because the proposed framework generates a high-dimensional fused feature space by integrating deep and handcrafted features, which may contain redundant and correlated information. GWO effectively identifies the most discriminative feature subset while preserving complementary information. Compared with Genetic Algorithm (GA), which relies on computationally intensive crossover and mutation operations, and Particle Swarm Optimization (PSO), which may converge prematurely, GWO achieves a better exploration–exploitation balance through its hierarchical leadership mechanism. Unlike Ant Colony Optimization (ACO), Differential Evolution (DE), and Salp Swarm Algorithm (SSA), GWO requires fewer control parameters and provides stable convergence with lower computational complexity. By reducing redundant features while retaining lesion-specific texture, shape, and structural information, GWO improves classifier generalization and enhances the accuracy and efficiency of the proposed skin cancer classification framework.
Table 4 shows the comparison of effect of various optimizers on the overall accuracy of the model.
3.10. Hybrid GNN–CNN Classification Framework
The optimized feature vector
is classified using a hybrid GNN–CNN architecture to capture both relational and local feature patterns. First,
is represented as a graph
, where each node
corresponds to feature
, and edges
are defined using similarity, as given by Equation (47). In the GNN, node embeddings are updated via message passing using Equation (47)
In parallel,
is reshaped and processed by a 1D CNN to capture local correlations using Equation (48). The GNN and CNN outputs are fused by concatenation using Equation (48)
Finally, classification is performed using a fully connected layer with softmax, as given by Equation (49)
The hybrid GNN–CNN classifier contributes complementary local feature learning and graph-based relational modeling, enabling more robust discrimination of visually similar skin lesion categories and improving multi-class classification performance. The complete implementation details, including the network configuration, feature dimensions, training hyperparameters, Gray Wolf Optimization parameters, and hardware/software environment, are summarized in
Table 5.
4. Results
4.1. Dataset Description
The proposed framework was evaluated on five publicly available skin lesion datasets containing RGB dermoscopic and clinical images with diverse lesion categories and acquisition conditions. The PAD-UFES-20 [
17] dataset contains 2298 RGB clinical images from six classes: melanoma, basal cell carcinoma, squamous cell carcinoma, actinic keratosis, seborrheic keratosis, and nevus. The ISIC [
6] dataset is a large-scale benchmark dataset comprising RGB dermoscopic images with multiple lesion categories acquired under varying imaging conditions. The Derm7pt [
18] dataset contains approximately 2000 RGB dermoscopic images. In this work, five classes were utilized: melanoma, nevus, basal cell carcinoma, seborrheic keratosis, and dermatofibroma. The BCN20000 [
12] dataset consists of over 19,000 RGB dermoscopic images from eight classes: melanoma, nevus, basal cell carcinoma, actinic keratosis, benign keratosis, dermatofibroma, vascular lesion, and squamous cell carcinoma. The PH
2 [
19] dataset contains 200 high-resolution RGB dermoscopic images categorized into common nevus, atypical nevus, and melanoma classes.
4.2. Training, Validation, and Testing Procedure
The training, validation, and testing procedure adopted in this study is described below, including the data splitting strategy, patient-level data handling, and hyperparameter tuning protocol.
- •
Data Splitting: We performed five-fold stratified cross-validation with an 80/20 train–validation split.
- •
Patient-Level Separation: We did not apply patient-level splitting in the current study. This was primarily because most of the publicly available datasets used (such as ISIC, Derm7pt, BCN20000, and PH2) do not provide consistent and reliable patient-level metadata or clear linkage between images and patients. Therefore, data splitting was performed at the image level across all datasets.
- •
Hyperparameter Tuning: Hyperparameters were tuned solely on the validation set of the first fold, and the selected configuration was fixed for all subsequent folds to minimize data leakage.
4.3. Computational Cost Analysis
Table 6 summarizes the computational cost of each module in the proposed framework. While the ViT-based DINO incurs the highest computational complexity and the hair removal stage requires the longest execution time, MobileNetV2 and the handcrafted feature extraction methods maintain relatively low computational overhead. Overall, the proposed framework achieves an effective balance between computational efficiency and robust skin cancer classification performance.
4.4. Confusion Matrices
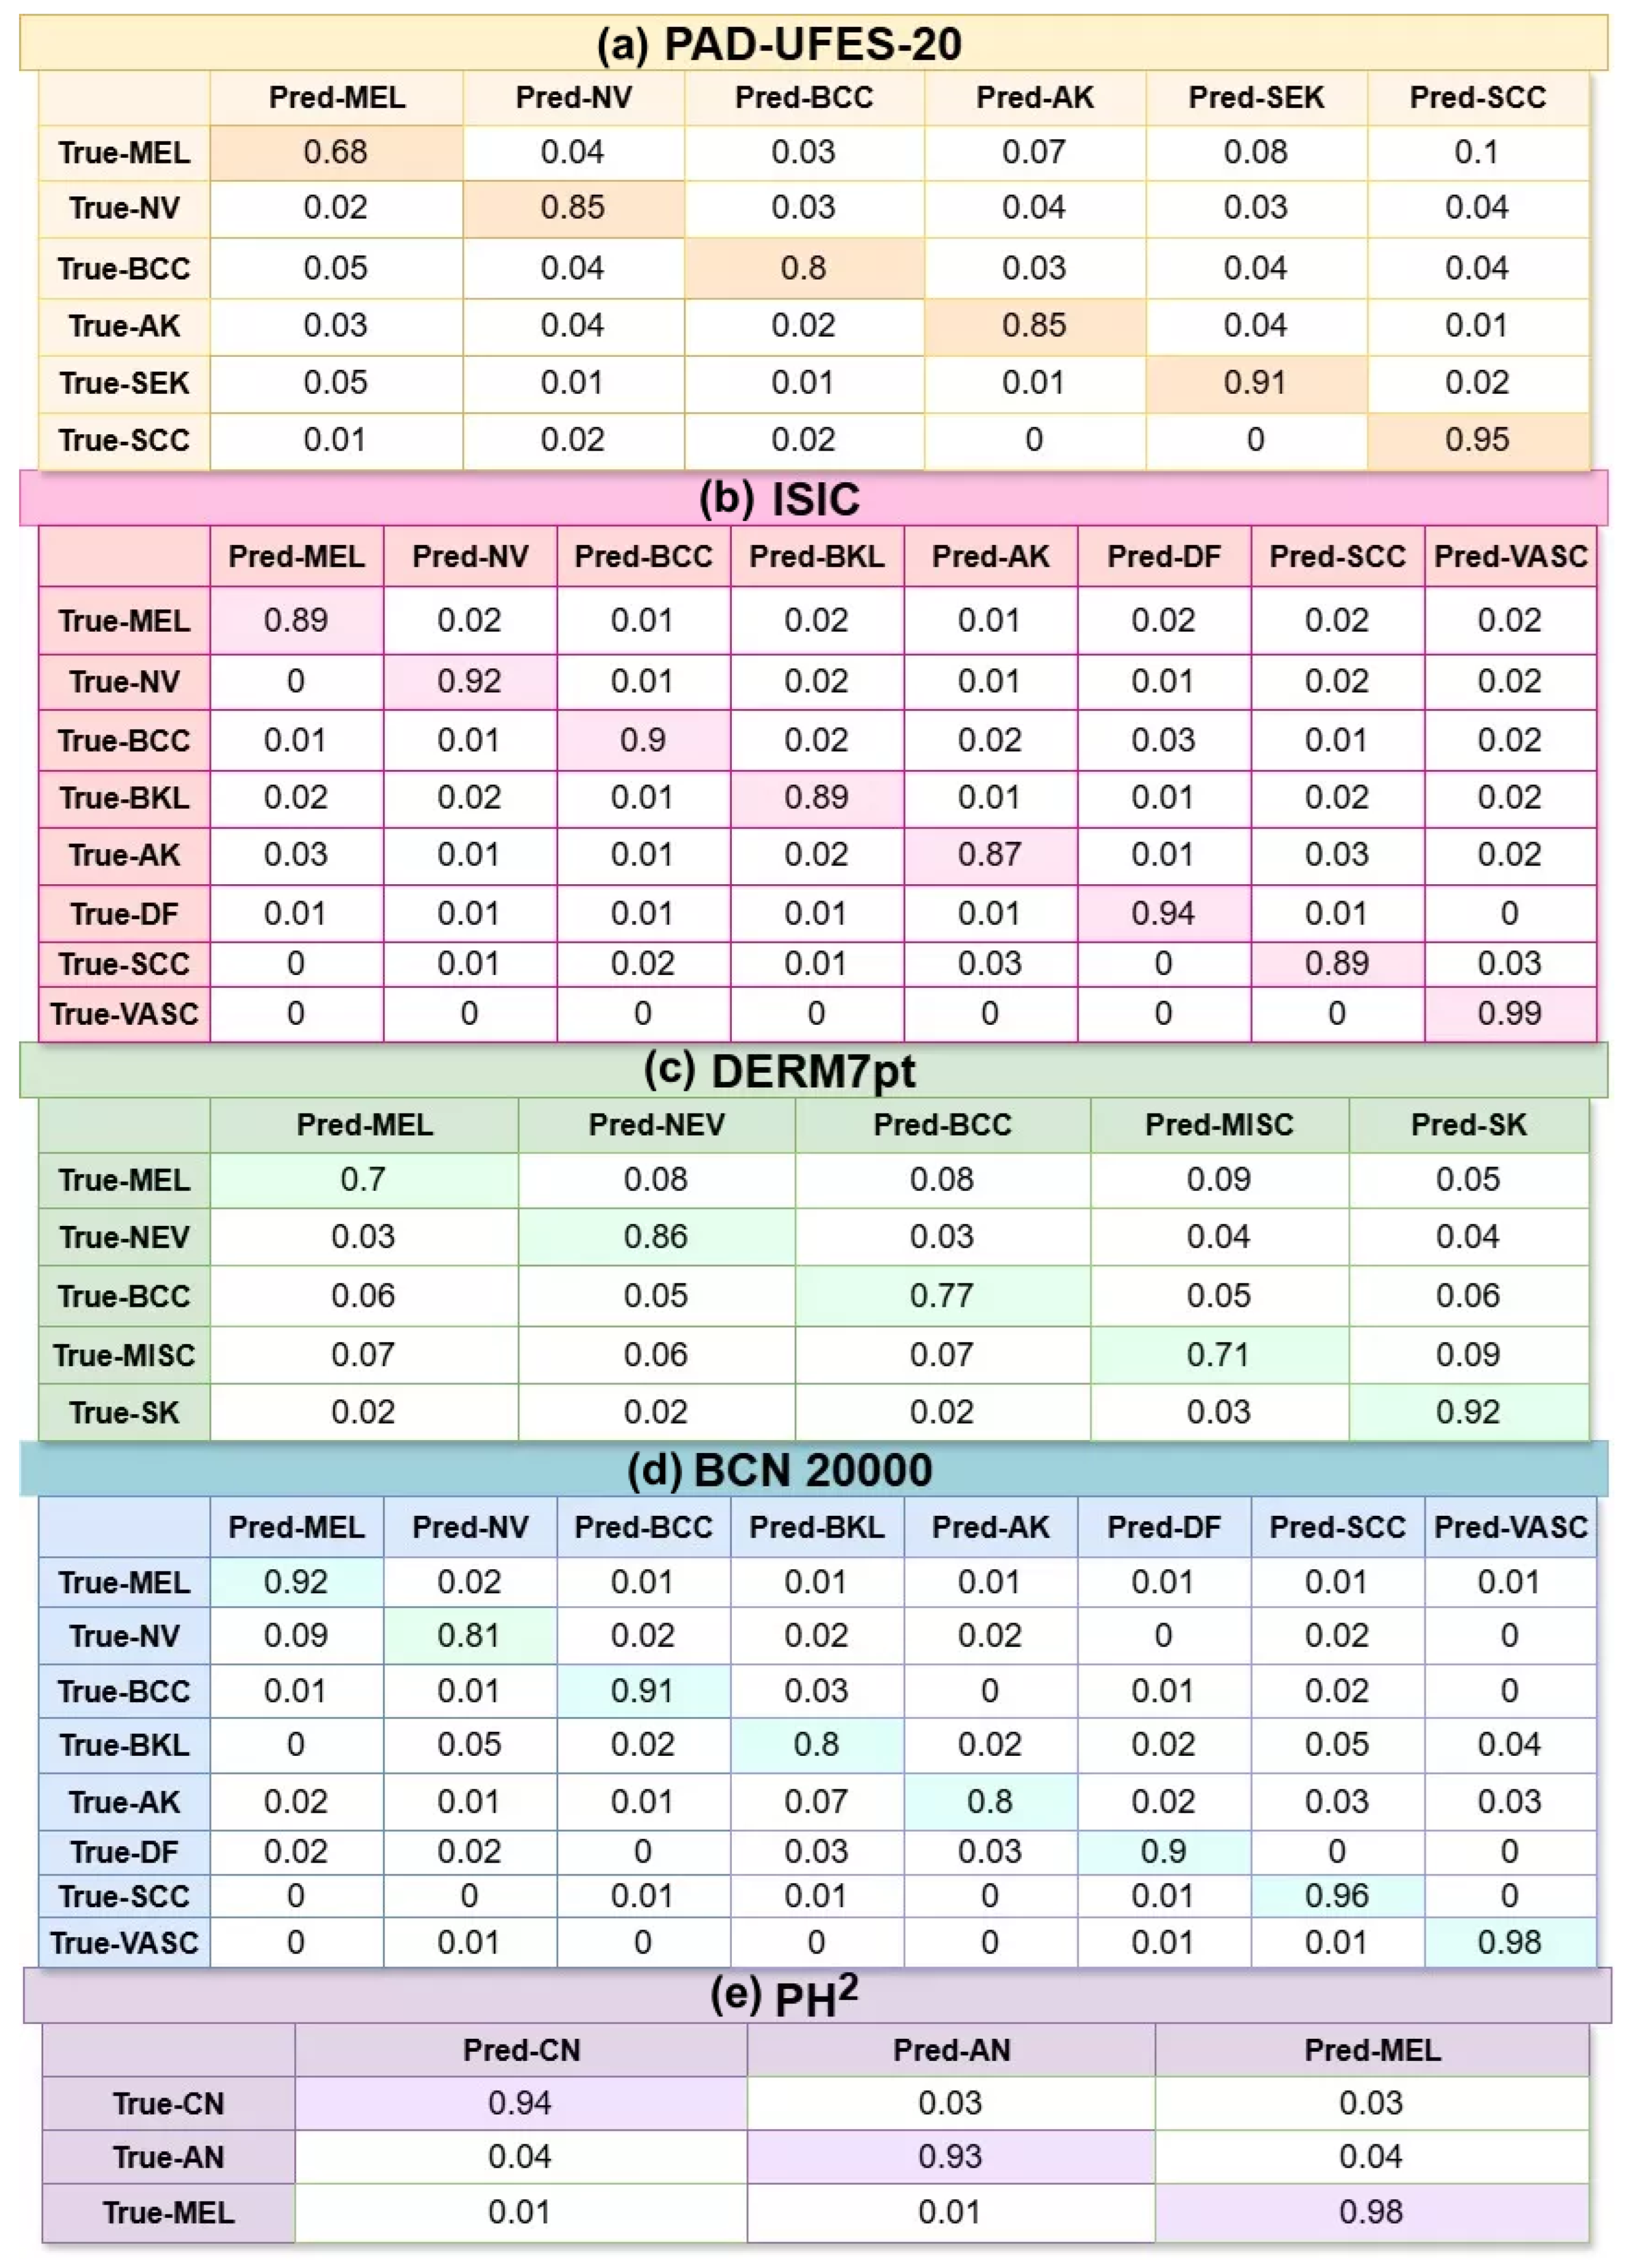
Figure 13 shows the confusion matrices on the five datasets. The PAD-UFES-20 confusion matrix shows strong recognition for SCC (95%), SEK (91%), and AK (85%). MEL achieved lower accuracy (68%) due to visual similarity and overlapping texture patterns with SEK and SCC, while NV and BCC attained 85% and 80% accuracy, respectively. For the ISIC dataset, high multi-class performance was achieved across all classes, with VASC (99%) and DF (94%) showing the highest accuracy. Minor misclassification occurred among MEL, BKL, AK, and SCC due to similar pigmentation, irregular borders, and lesion morphology. The Derm7pt dataset achieved strong recognition for SK (92%) and NEV (86%), whereas MEL (70%) and MISC (71%) showed higher confusion because of heterogeneous dermoscopic structures and overlapping visual characteristics. BCC achieved 77% accuracy with limited cross-class confusion. The BCN20000 confusion matrix demonstrated strong classification for VASC (98%), SCC (96%), MEL (92%), and BCC (91%). Misclassification among NV, BKL, and AK was mainly caused by high intra-class variability and similar lesion appearance. The PH
2 dataset showed highly reliable classification, with MEL, CN, and AN achieving 98%, 94%, and 93% accuracy, respectively. Minor confusion between CN and AN resulted from subtle visual differences in lesion boundaries and pigmentation.
4.5. Results and Discussion
The proposed framework, as shown in
Table 7, achieved 88.0% accuracy on the PAD-UFES-20 dataset, with precision, recall, and F1-score of 0.845, 0.84, and 0.841, respectively. On the ISIC dataset, the model achieved 94.5% accuracy, with precision, recall, and F1-score of 0.907, 0.91, and 0.911, demonstrating strong multi-class performance. The Derm7pt dataset achieved 83.6% accuracy with precision, recall, and F1-score of 0.792, 0.79, and 0.792, respectively. For the BCN20000 dataset, the framework obtained 93.2% accuracy, with precision, recall, and F1-score of 0.877, 0.885, and 0.88. The PH
2 dataset achieved the highest performance, with 96.7% accuracy, 0.943 precision, 0.95 recall, and 0.947 F1-score. All reported results represent the mean ± standard deviation obtained from five-fold stratified cross-validation (80/20 train–test split). The 95% confidence intervals were calculated as mean ± 1.96 × (SD/√5). The relatively low standard deviations across all datasets demonstrate the robustness and stability of the proposed framework.
Table 7 further demonstrates that model achieved high sensitivity (79.2–94.7%) and specificity (94.8–98.7%), indicating its effectiveness in correctly identifying skin lesion classes while minimizing false-positive predictions. Furthermore, the balanced accuracy values (87.0–96.2%) confirm reliable performance under class-imbalanced conditions. Although PAD-UFES-20 exhibited comparatively lower sensitivity due to the challenging nature of melanoma classification and dataset imbalance, the framework maintained competitive performance on this dataset and consistently strong results across all other benchmarks. The low standard deviations and narrow 95% confidence intervals further demonstrate the robustness and stability of the proposed framework.
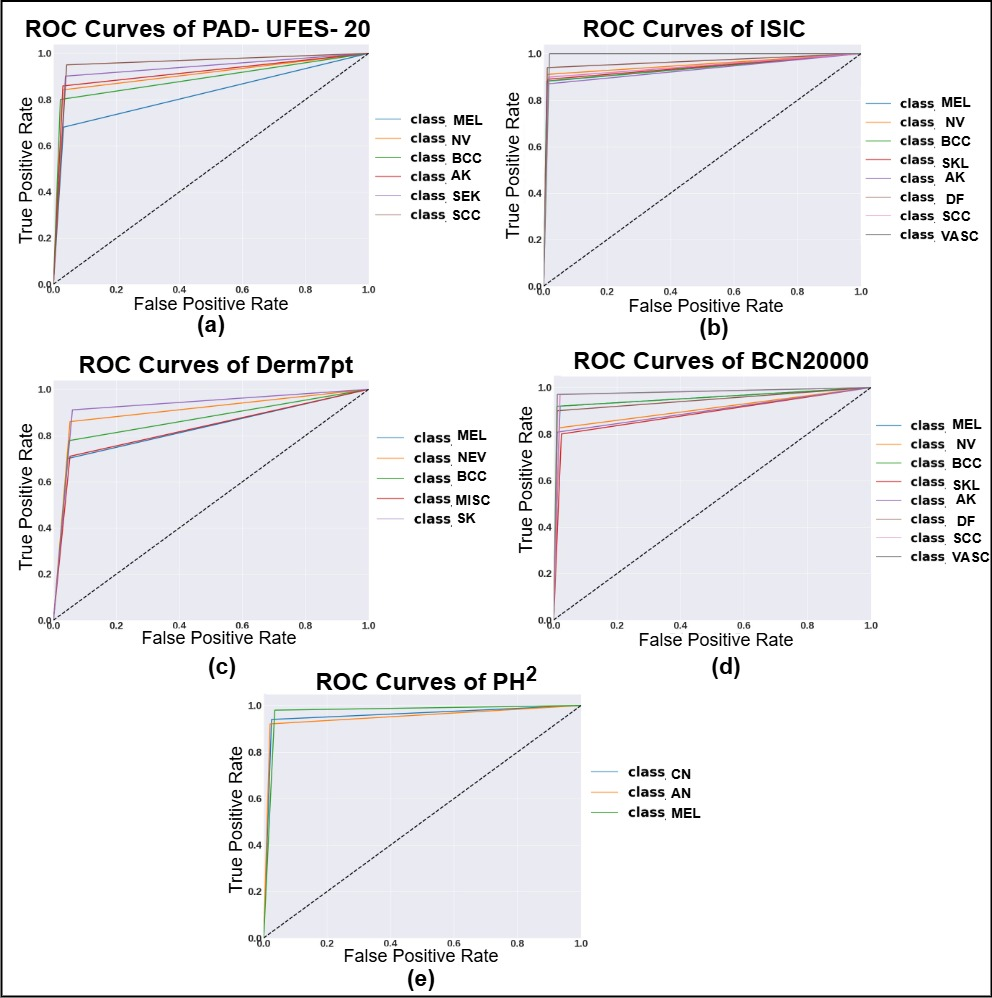
The ROC curve analysis for all datasets is presented in
Figure 14. The PAD-UFES-20 dataset demonstrates effective class separability, with slight performance degradation for MEL due to overlap with visually similar lesion categories. For the ISIC dataset, the ROC curves remain close to the top-left region, indicating high sensitivity and specificity across all classes. The Derm7pt dataset exhibits comparatively lower ROC performance for the MEL and MISC classes because of heterogeneous dermoscopic structures and inter-class similarity. The ROC curves of the BCN20000 dataset indicate strong discriminative capability, with minor variations among the NV, BKL, and AK classes caused by similar lesion morphology. The PH
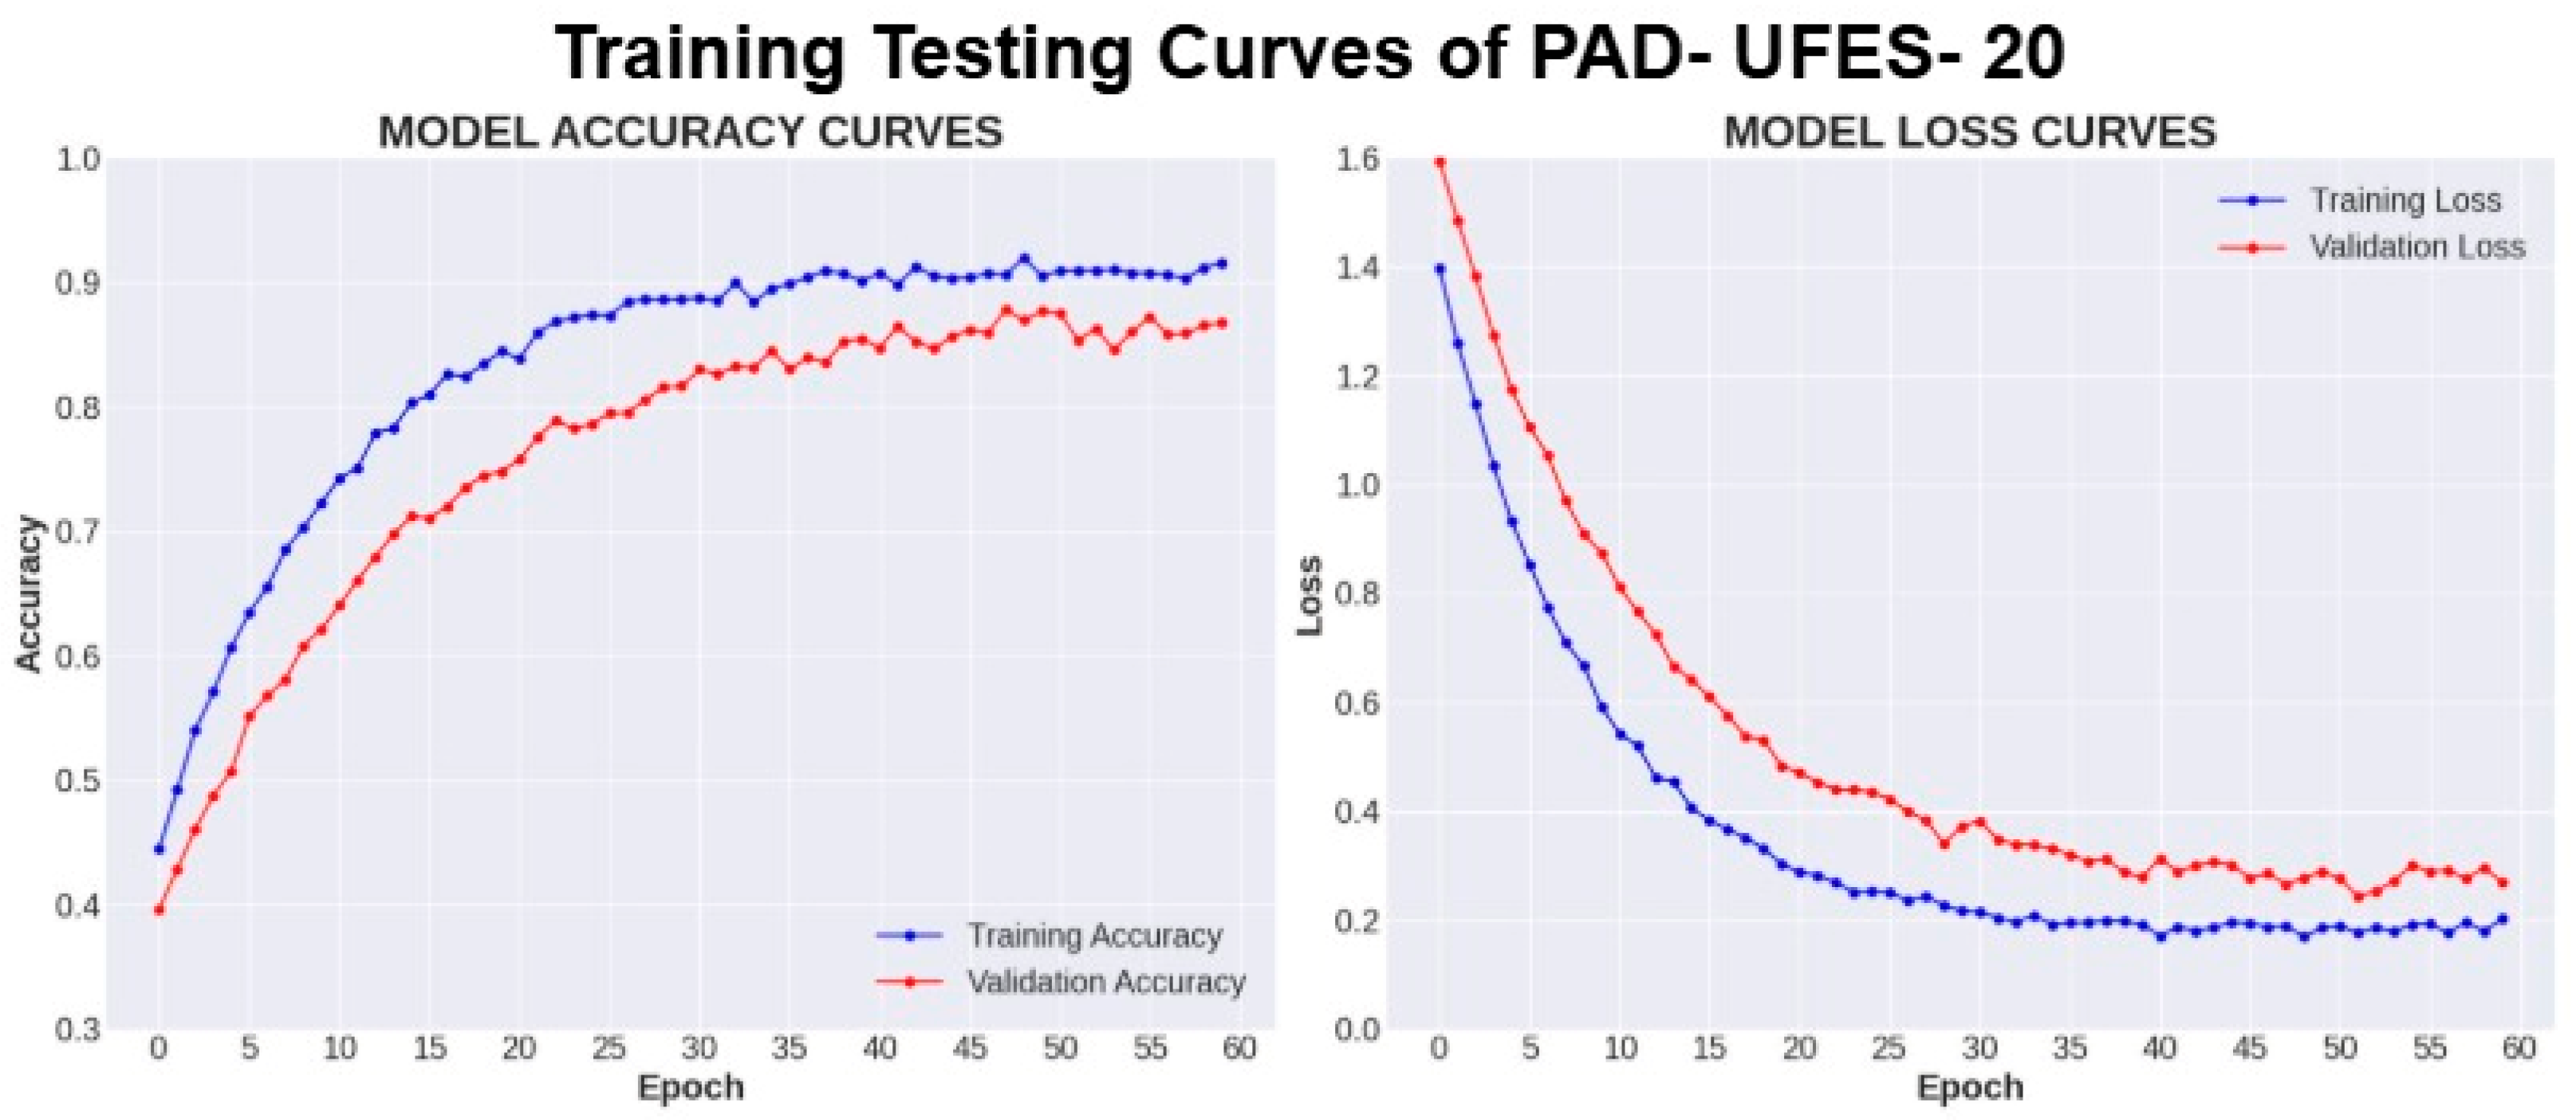
2 dataset achieved near-ideal ROC characteristics, demonstrating highly reliable lesion discrimination and melanoma detection performance. The training and testing curves of PAD-UFES-20 are shown in
Figure 15.
Although the proposed framework achieved an overall competitive performance on the PAD-UFES-20 dataset (88.0%), melanoma exhibited comparatively lower recognition than other lesion categories. This can be attributed to the inherent challenges associated with melanoma classification. Melanoma demonstrates high intra-class variability, with substantial differences in color, pigmentation, border irregularity, size, and texture, while early-stage melanomas often closely resemble benign lesions. Moreover, melanoma shares significant visual characteristics with seborrheic keratosis, basal cell carcinoma, and squamous cell carcinoma, resulting in increased inter-class confusion. Another contributing factor is the relatively limited number of melanoma samples in the PAD-UFES-20 dataset, which restricts the model’s ability to learn sufficiently representative melanoma-specific patterns. Nevertheless, despite these challenges, the proposed framework achieved higher overall accuracy than several existing state-of-the-art methods on the same dataset and demonstrated consistently strong performance across all five benchmark datasets. Future work will focus on improving melanoma sensitivity by leveraging diffusion-based synthetic data generation and adaptive class-balanced focal loss to mitigate dataset imbalance, thereby improving the framework’s robustness and clinical applicability.
4.6. Ablation Study
In
Table 8, the ablation study validates the effectiveness of each module in the proposed framework. The full model, integrating preprocessing, deep features, lesion keypoints, textural descriptors, and shape-based features, achieves the highest accuracies of 88.0%, 94.5%, 83.6%, 93.2%, and 96.7% on PAD-UFES-20, ISIC, Derm7pt, BCN20000, and PH
2, respectively. Removing preprocessing reduces robustness, while excluding MobileNetV2 and ViT-based DINO features causes the largest performance decline, highlighting the importance of deep semantic representations. Likewise, removing lesion keypoints, texture descriptors, and shape-based features consistently decreases accuracy, confirming the complementary role of structural, textural, and morphological information in skin lesion classification.
4.7. Comparative Analysis
The proposed model consistently outperforms state-of-the-art methods across multiple datasets, as shown in
Table 9. On PAD-UFES-20, prior works have reported accuracies, such as Khurshid et al. (0.851), Tang et al. (0.830), and Uliana and Krohling (0.6457), while the proposed model achieves 88.0%. For ISIC, existing methods have included Moodi et al. (0.7142), Pacal et al. (0.9254), Ozdemir et al. (93.60%), and Yang et al. (92.791%). The proposed model attains 94.5%, outperforming them all. On Derm7pt, methods such as Xu et al. (0.813), Tang et al. (0.785), and Bi et al. (0.699) have shown lower performance, whereas the proposed model reaches 83.6%. For BCN20000, prior results have included Agarwal et al. (91.17%), Joshi et al. (92%), and Gunaratne et al. (91.9%), while the proposed model improves to 93.2%. On PH
2, existing methods such as Nawaz et al. (95.6%) and Toprak et al. (94.44%) are surpassed by the proposed model, which achieves 96.7%.
4.8. Workflow Integration
The proposed framework is intended to function as a computer-aided decision support system rather than a replacement for dermatologist expertise. In a typical clinical workflow, dermoscopic or clinical skin lesion images would first undergo automated preprocessing, artifact removal, and lesion segmentation, followed by feature extraction and classification. The predicted lesion category, together with attention visualizations and interpretable handcrafted feature descriptors, can provide clinicians with complementary information to support diagnostic decision-making. Final diagnosis and treatment planning would remain under the supervision of dermatologists, who can integrate the model’s predictions with patient history, physical examination, and other clinical findings. Future work will focus on prospective clinical validation, integration with hospital information systems, and evaluation in real-world clinical settings before considering routine clinical deployment.
5. Limitations
While the proposed framework demonstrates strong performance across multiple benchmark datasets, several limitations should be acknowledged. First, patient-level splitting was not implemented in the current study due to the unavailability of consistent and reliable patient metadata in most public datasets (e.g., ISIC, Derm7pt, BCN20000, and PH2), where images often lack clear patient linkage. Consequently, data splitting was performed at the image level, which may introduce a minor risk of data leakage in cases where multiple images from the same patient exist. Furthermore, differences in imaging devices, illumination conditions, patient characteristics, and rare lesion categories may influence the generalizability of the proposed framework in real-world clinical settings. Although the hybrid deep learning architecture demonstrated promising performance, it still lacks robust interpretability mechanisms, making clinical decision explanation and physician trust more challenging. In addition, although Gray Wolf Optimization (GWO) effectively reduced the feature dimensionality from 5313 to 1856 while improving classification performance, it is inherently susceptible to limitations, such as potential premature convergence, which may affect the identification of the globally optimal feature subset.
6. Conclusions and Future Work
This study presented a comprehensive hybrid framework for automated skin cancer classification by integrating advanced preprocessing, lesion segmentation, deep learning, handcrafted feature extraction, optimization, and hybrid classification techniques into a unified pipeline. The proposed CutisNet segmentation architecture effectively preserved lesion boundaries and improved robustness under challenging imaging conditions, while the combination of MobileNetV2, self-supervised ViT-based DINO, and uniquely selected handcrafted descriptors enabled comprehensive representation of local textures, structural properties, and global contextual information. Furthermore, the incorporation of Gray Wolf Optimization and a hybrid GNN–CNN classifier significantly enhanced discriminative feature learning and multi-class classification performance. Experimental evaluations demonstrated strong performance across multiple benchmark datasets, achieving accuracies of 88.0% on PAD-UFES-20, 94.5% on International Skin Imaging Collaboration—ISIC, 83.6% on Derm7pt, 93.2% on BCN20000, and 96.7% on PH2, thereby confirming the robustness and generalization capability of the proposed framework. Comparative evaluations and ablation studies further validated the contribution of each module toward improved diagnostic accuracy. Future work will focus on improving model interpretability, reducing computational complexity, and incorporating attention-based multimodal learning strategies to enhance real-world clinical applicability and diagnostic reliability. In addition, future studies will prioritize the use of datasets with reliable patient-level annotations to enable patient-level data splitting and further validate the generalizability of the proposed framework in real-world clinical settings. Furthermore, hybrid metaheuristic optimization strategies, such as Gray Wolf Optimization (GWO) combined with Particle Swarm Optimization (PSO) or Genetic Algorithms (GAs), will be investigated to achieve a better exploration–exploitation balance, mitigate premature convergence, and further enhance feature selection performance.



 ,
,