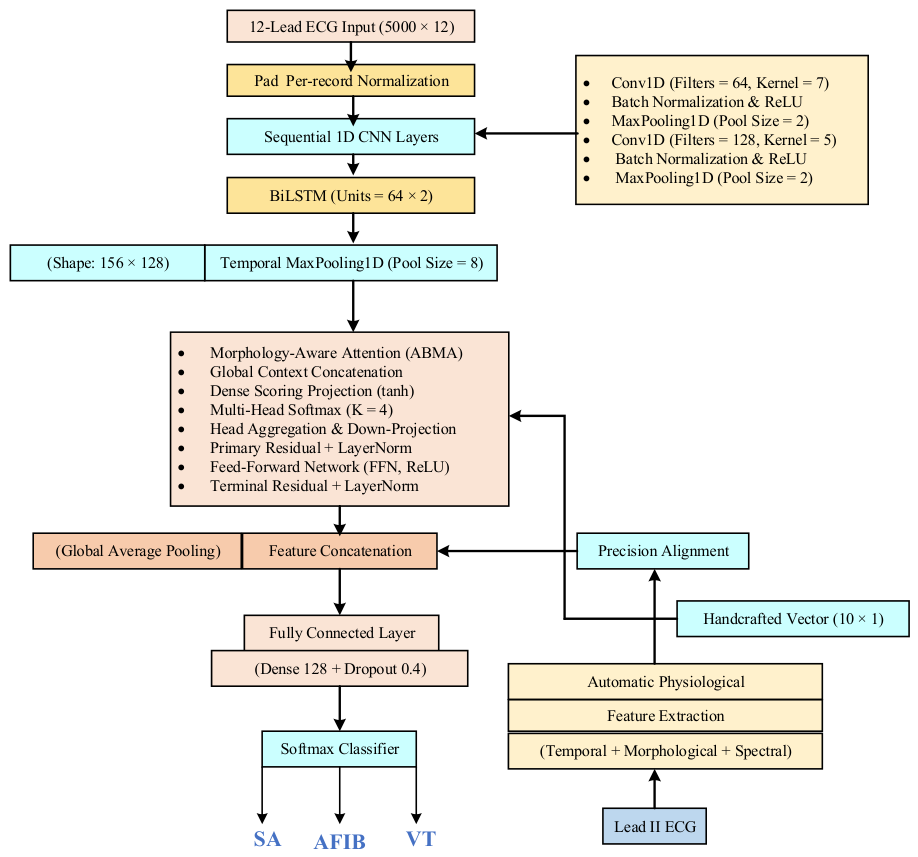
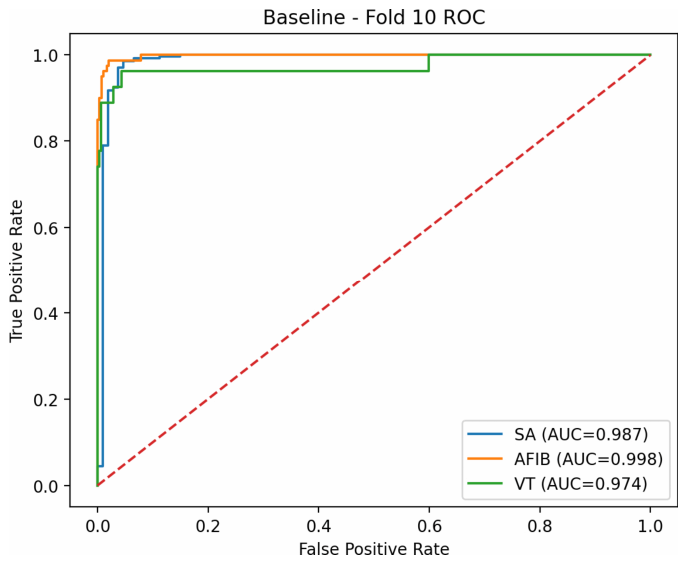
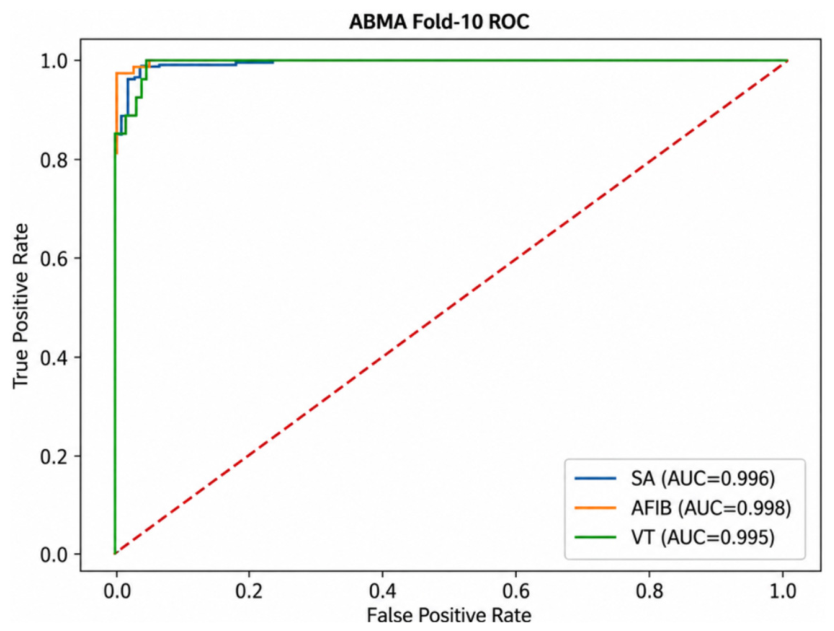
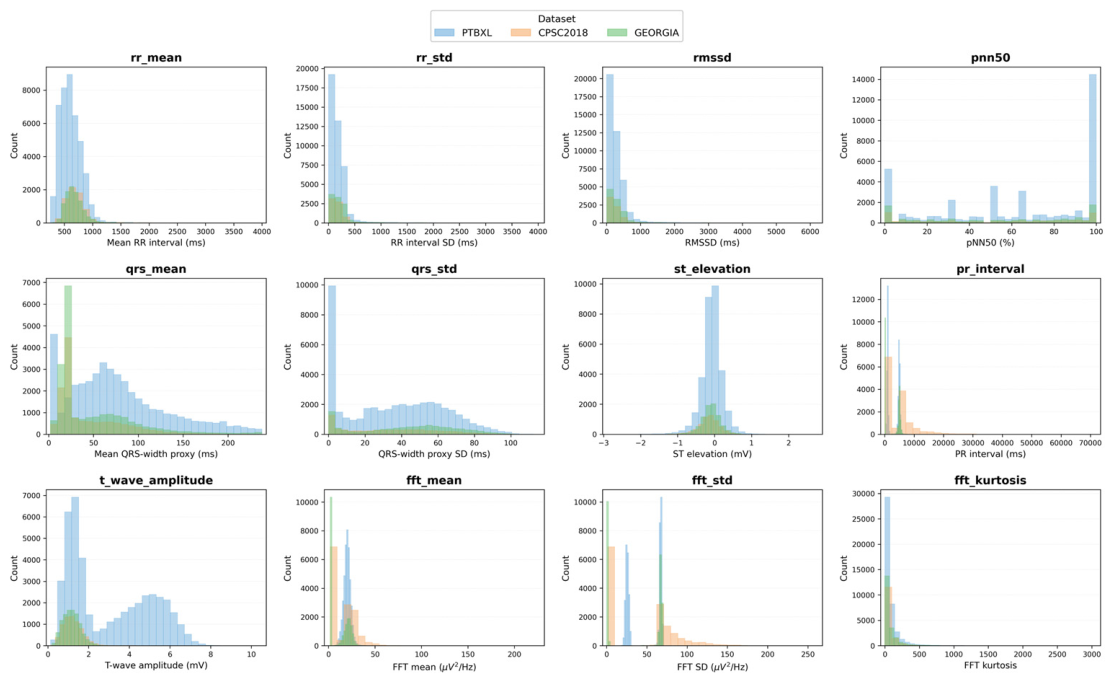
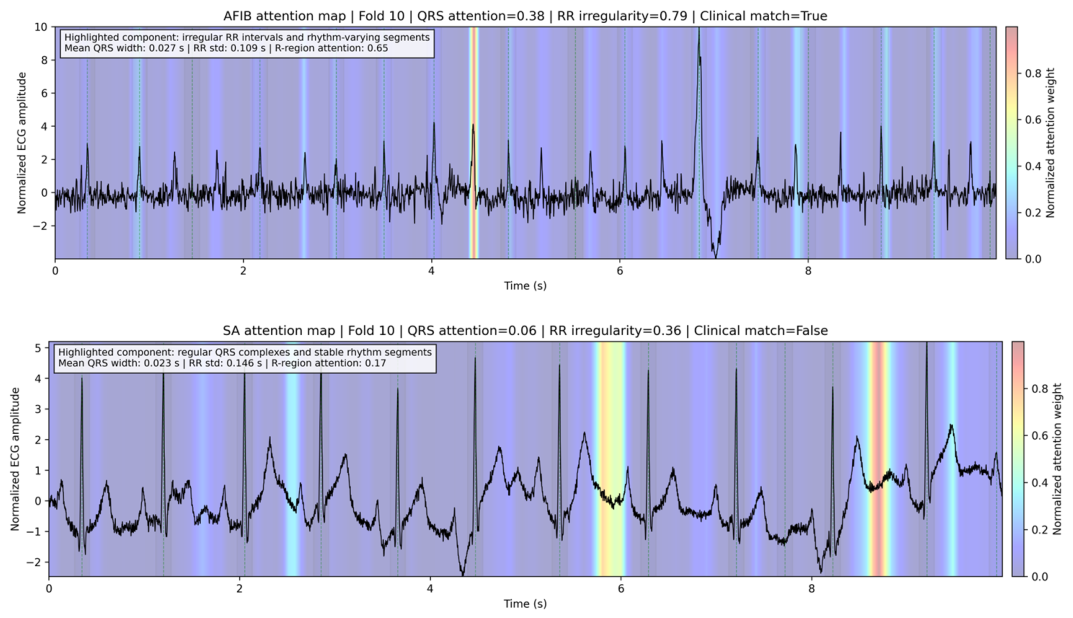
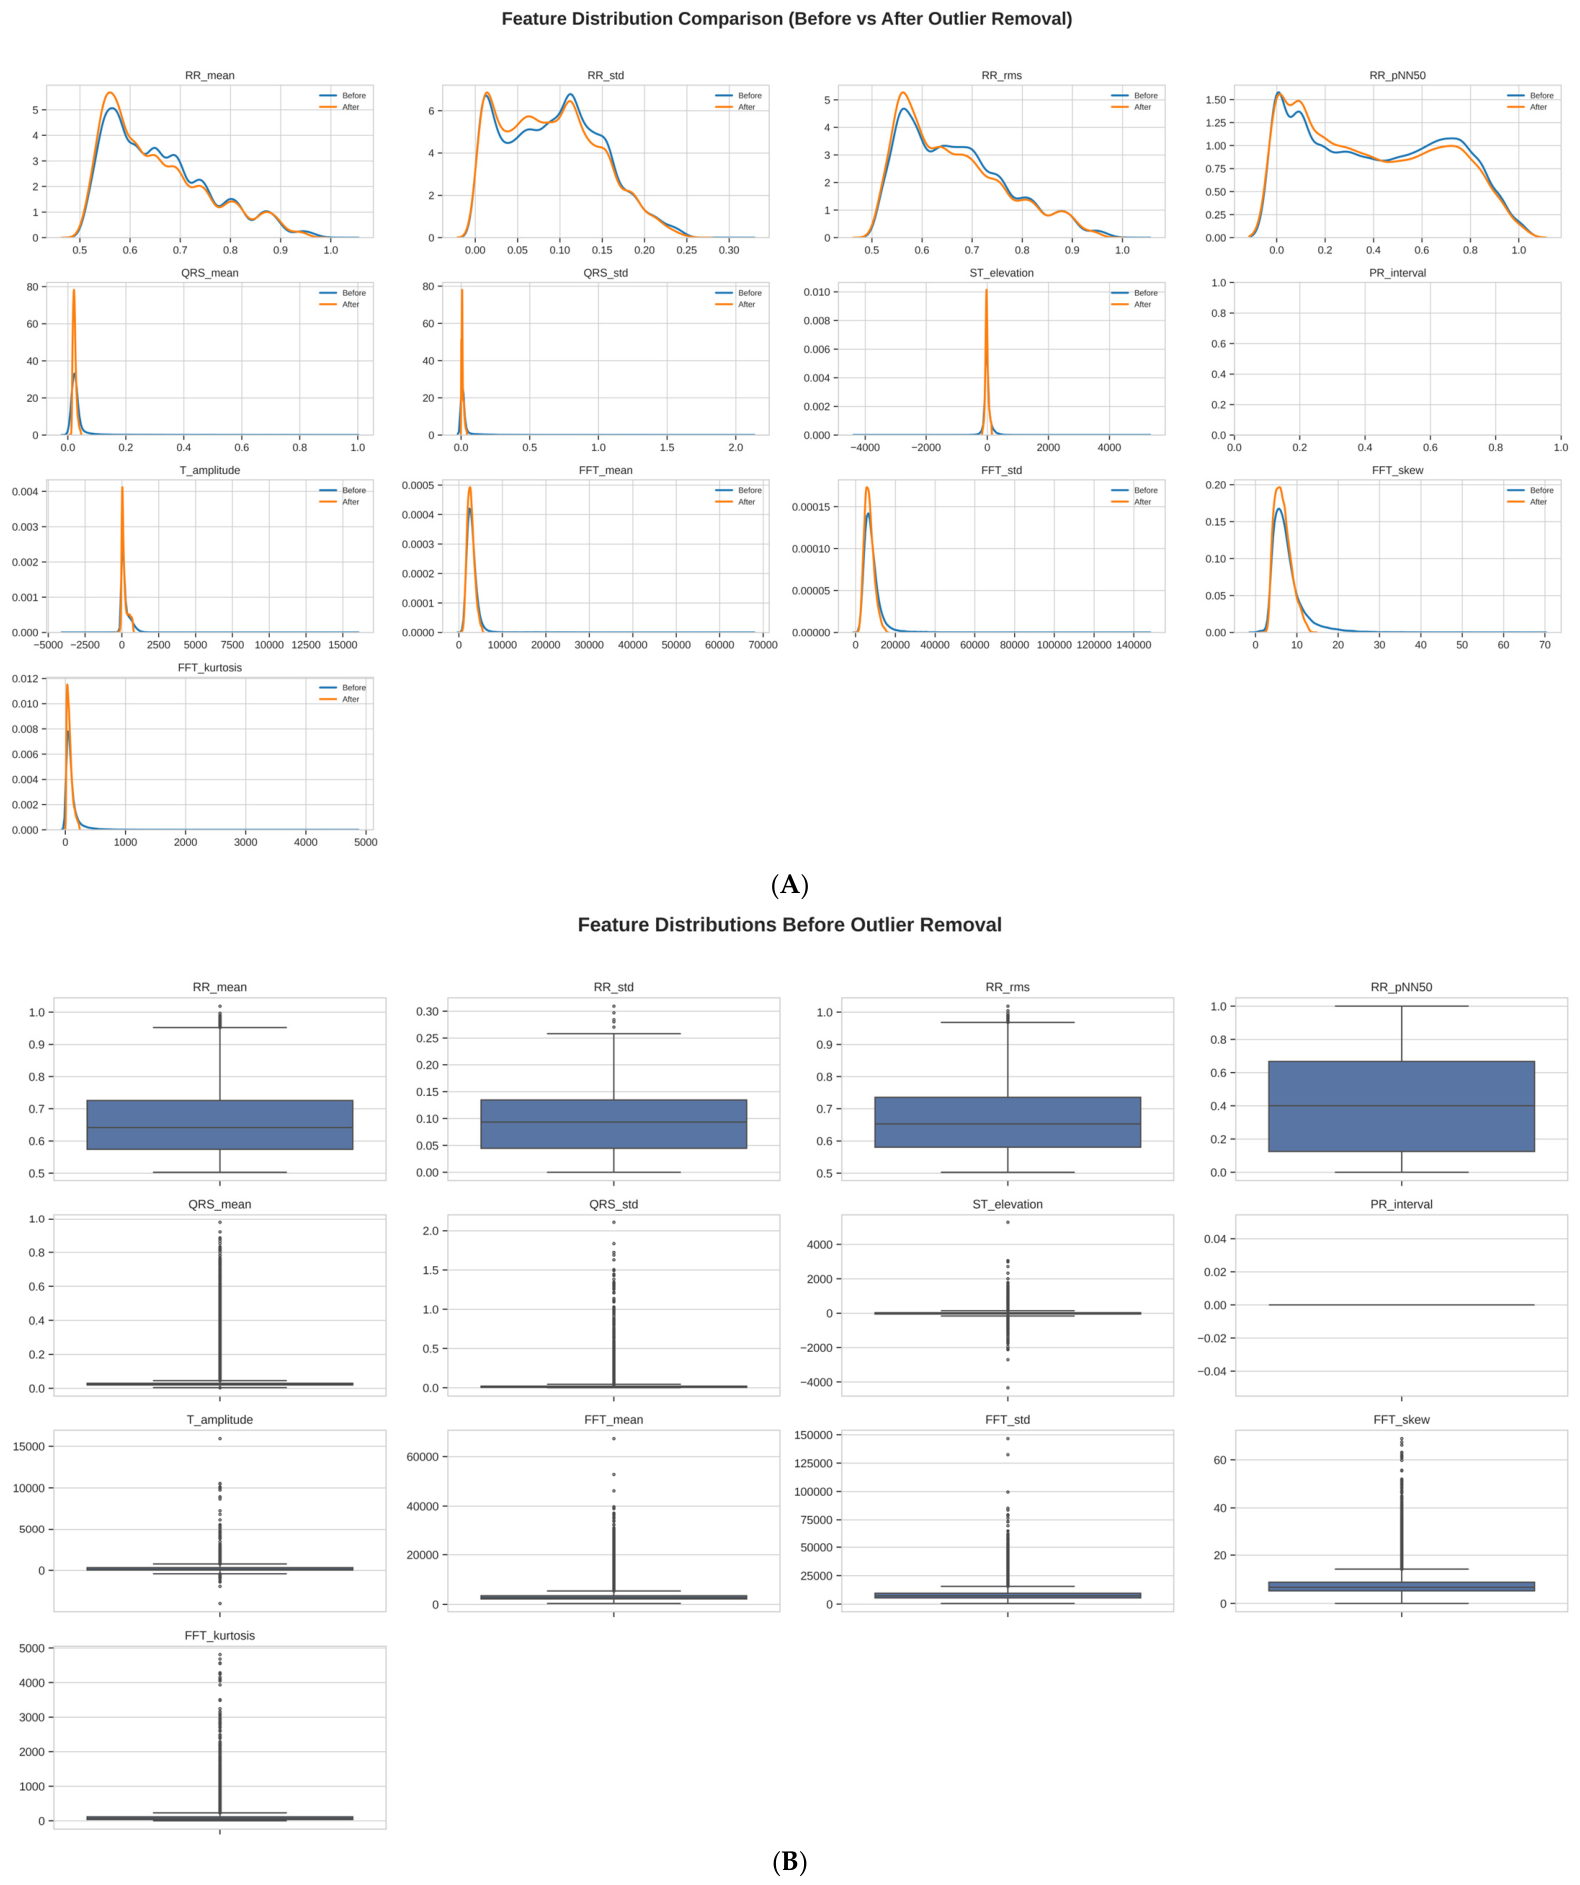
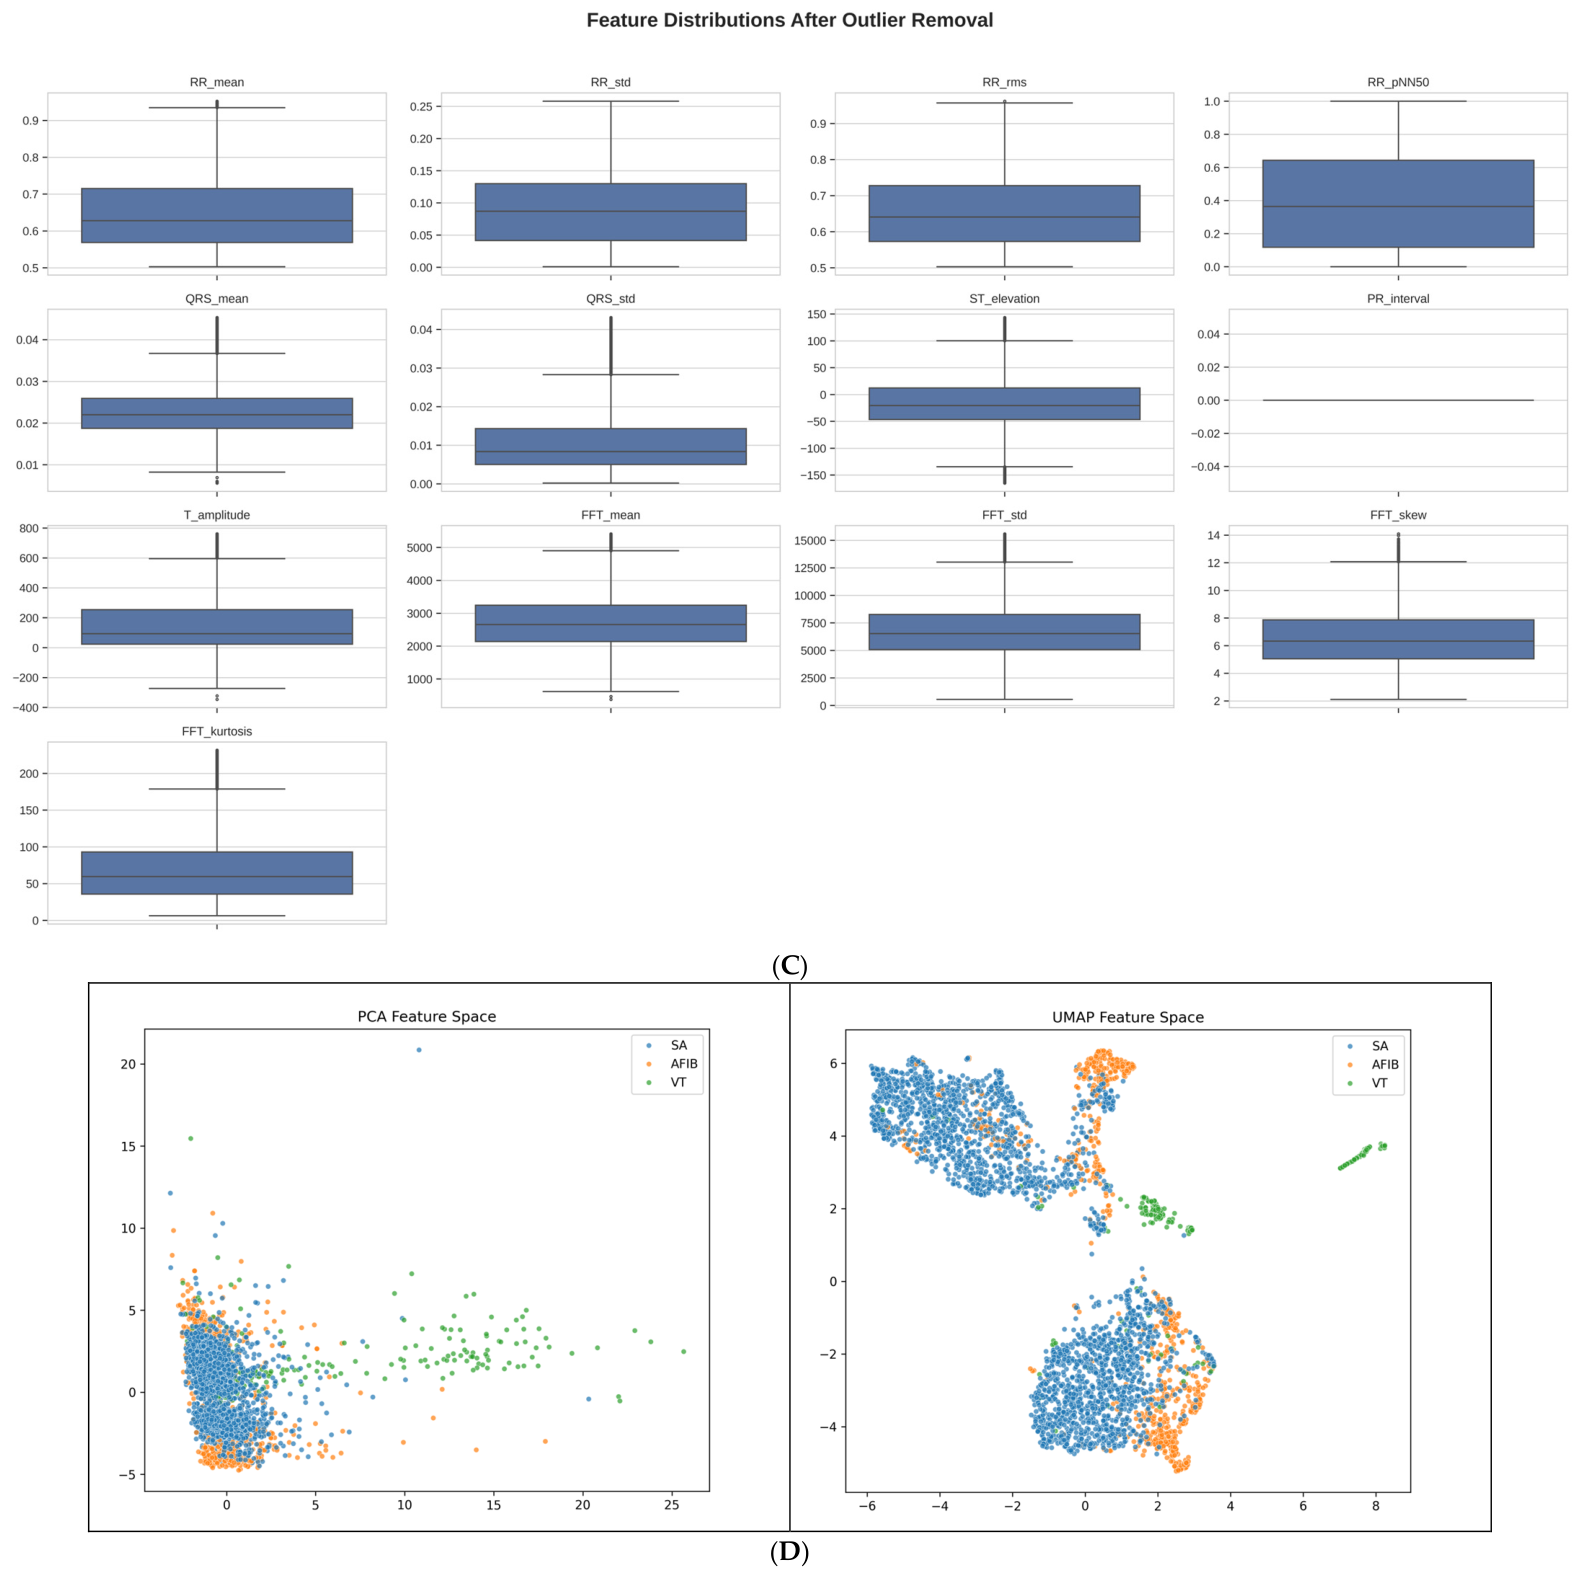
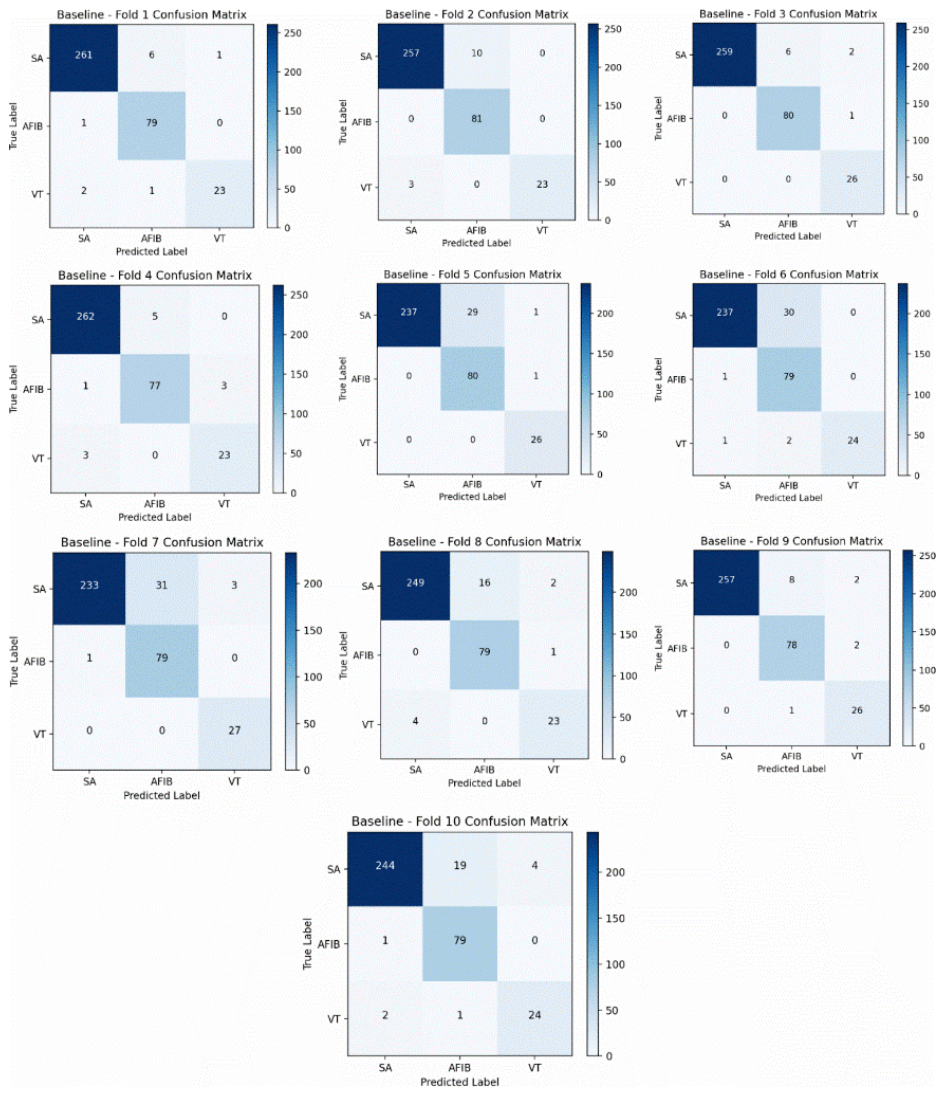
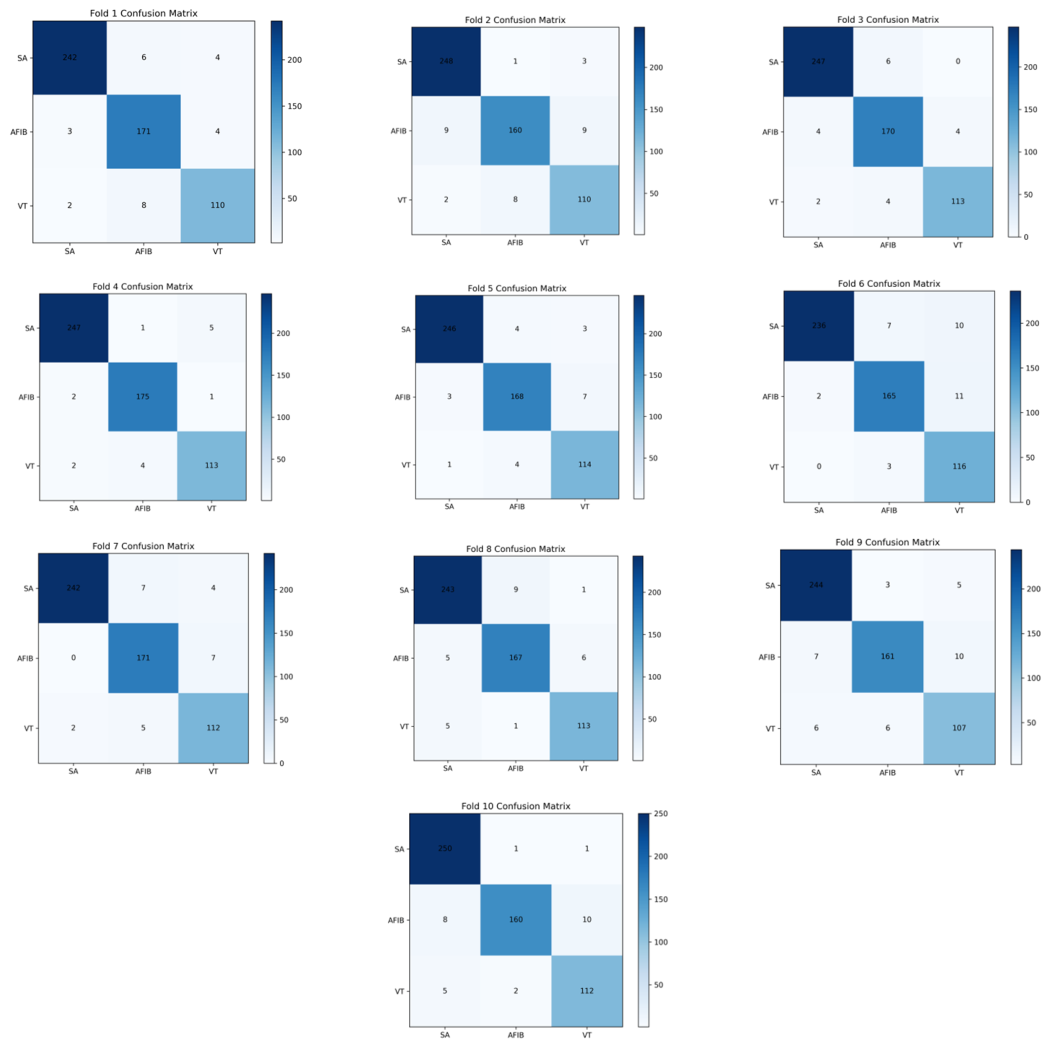
In order to evaluate the proposed ABMA framework for the arrhythmia classification task in depth, we conducted a series of experiments on the six different architectures that were introduced in this paper. All of the experiments for these architectures were conducted using a stratified 10-fold cross-validation protocol, and all of the architectures were run under identical experimental conditions. The feature extraction for each of the architectures was conducted using an identical pipeline of preprocessing steps, and all of the architectures were tested using an identical set of evaluation metrics as well as an identical set of optimization parameters. In particular, all of the architectures were tested using the exact same set of features that were normalized to have means of zero and standard deviations of one for each feature standardization, and the architectures were all tested using the exact same learning rate schedule as well as the exact same set of other training hyperparameters that controlled the optimization process. The results of these experiments are summarized in
Table 5 for all of the architectures that were tested. The baseline CNN–BiLSTM architecture obtained a mean accuracy of 94.44% ± 2.73%, a weighted F1-score of 94.60% ± 2.54%, and a macro F1-score of 92.77% ± 2.27%. However, the lower value of the macro F1-score in comparison to the weighted F1-score is a sign of decreased robustness of the architecture for minority classes of arrhythmias (i.e., for AFIB and VT in particular). When we look at the results for all tested models, the complete ABMA framework is clearly the best model concerning the overall performance. The mean accuracy of the complete ABMA framework is 95.18 ± 1.18%, the weighted F1-score is 95.19 ± 1.18% and the macro F1-score is 94.66 ± 1.35%. We were able to improve the baseline model CNN–BiLSTM by 0.74 percentage points in terms of accuracy, by 0.59 percentage points in terms of weighted F1-score and by 1.89 percentage points in terms of macro F1-score. The lower standard deviations for all quality metrics also show that the ABMA framework is more robust than the baseline model. The standard deviations describe the spread of the single cross-validation runs and thus the ability of a model to generalize. In our case, the complete ABMA framework clearly shows a more consistent performance than the baseline model. Further insights into the performance of each individual component are obtained from the ablation analysis. Removal of the handcrafted feature branch led to a reduction in the network’s accuracy to 94.40 ± 1.42% and the corresponding macro F1-score to 93.80 ± 1.65%, which highlights the importance of the automatically derived physiological descriptors in conjunction with the deep ECG features learned through the network. Removal of the Morphology-Aware Attention module, on the other hand, yielded slightly lower results of 94.18 ± 1.33% accuracy and 93.57 ± 1.64% macro F1-score, since the Morphology-Aware Attention module enhances performance by learning morphology-aware importance scores for each time step that allow the network to focus on relevant portions of the ECG signal. Similar observations were made for the morphology scoring network, where scores calculated for morphology-aware importance enabled more discriminative features, although the results for accuracy (94.18 ± 1.45%) and corresponding macro F1-score (93.57 ± 1.81%) were comparable to those for the Morphology-Aware Attention module. The largest degradation among all the ablation variants was observed upon replacing the four-head attention mechanism with a single attention head. The resulting network’s accuracy dropped to 94.07 ± 1.28%, while its corresponding macro F1-score decreased to 93.36 ± 1.49%, which implies that the four individual attention heads of the four-head attention mechanism are able to learn distinct morphological representations that are not sufficiently captured by a single attention head. Our new framework, fully implemented as a complete ABMA model, even outperforms the individual class accuracies of the separately developed SA, AFIB and VT models, achieving F1-scores of 97.00 ± 0.76% (SA), 94.28 ± 1.54% (AFIB), and 92.70 ± 2.16% (VT) on the three classes. The effect of removing the handcrafted feature branch from the individual ablation models is smallest among all classes, while replacing the multi-head attention mechanism with a single attention head has the largest negative impact. The performance loss is especially pronounced for the VT class, where an F1-score of 90.64 ± 2.75% is achieved. Interestingly, while the individual ablation models already perform decently on all classes, their sensitivity to the removal of individual architectural components is much higher for classes with higher morphological and rhythm variability, i.e., AFIB and VT, than for the SA class. This confirms our design choice that the handcrafted feature branch, the morphology-aware attention mechanism, the morphology scoring network, and the multi-head attention mechanism in total and separately provide important information for a thorough classification of electrocardiogram signals. The results of the ablation study indicate that the highest accuracy, best balanced classification accuracy, and highest reliability of the ABMA framework are based on the combination of morphology-aware attention, the multiple representations that are learned by the model using the multiple- heads, and the additional physiological features. This synergy leads to better results than the sum of the single components.
The model achieved better arrhythmia detection using convolution filter sizes of 7 and 5, which extracted both fine and coarse ECG features. The use of multi-scale feature extraction is essential for distinguishing arrhythmias. The early stopping mechanism was used to stop training when the validation performance stopped improving to prevent overfitting. The learning rate schedule was used to gradually decrease the learning rate, which helped in achieving better convergence and final accuracy. The hyperparameter tuning resulted in a robust classifier that achieved high accuracy on SA, AFIB and VT while being stable and not overfitting on this clinically complex dataset. To improve the diagnostic capabilities of the model, the addition of features such as ST segment elevation, PR interval and T wave amplitude is also considered. On the other hand, including many features may contain redundant or noisy information if these features are not well related to the target classes. This phenomenon is well documented in ECG signal analysis, where the challenge is to identify meaningful features for classification tasks [
15]. The performance of models, especially in ECG classification tasks, depends heavily on feature selection. Studies have shown that the process of selecting ECG features is iterative, wherein several feature sets are evaluated to achieve the optimal classification performance. This challenge is inherently difficult because one is asked to estimate the performance of a feature set from ECG feature extraction without ever training and testing the classification model. As a result, ECG feature selection is an iterative process requiring the evaluation of multiple feature sets to achieve optimal classification performance. To classify arrhythmias, a new deep learning approach used 2D recurrence plot images of 2 s ECG segments. Stage 1 had 95.3% accuracy for noise or ventricular fibrillation detection, and Stage 2 reached 98.41% accuracy for atrial fibrillation, normal heart rhythms, early atrial fibrillation, and ventricular fibrillation after five-fold cross-validation. This method gives clinicians a reliable way to detect and differentiate arrhythmia types [
32]. In [
33], the authors’ study presents a 2D CNN approach for ECG arrhythmia classification. NOR, LBB, RBB, PVC and APC type ECG signals were transformed into the time frequency domain using short time Fourier transform and these spectrograms were fed into a 2D CNN to achieve an accuracy of 99% using MIT-BIH database. The best performance was achieved at the learning rate of 0.001 and batch size of 2500. The 2D CNN outperformed the 1D CNN with an accuracy of 90.93%, without the need for manual preprocessing of the ECG signal, making it suitable for ECG signal classification. In [
34], the study is intended to contribute to the development of an ECG arrhythmia classification system using the Optimum Path Forest (OPF) classifier, a supervised graph-based technique, applied for the first time to the ECG signal classification. The OPF’s performance (training/testing time, accuracy, sensitivity and specificity) is compared with that of Support Vector Machines (SVM), Bayesian classifiers and Multilayer Perceptron (MLP) neural networks. From features of six common approaches in the ECG analysis and the MIT-BIH arrhythmia database, the OPF classifier showed robust, parameter-free performance, being faster and more accurate than MLP and SVM and as accurate as Bayesian classifiers. Thus, the OPF method can be considered as a promising, efficient tool for the ECG analysis with low computational cost. Authors [
35] present the Deep Multi-Scale Convolutional Neural Network Ensemble (DMSCE) for robust arrhythmia classification. Using multiple scale-dependent DCNN expert classifiers with varying receptive fields, DMSCE simulates various pathological ECG characteristics. A convolutional gating network learns to compute fusion weights to aggregate local predictions from the experts, and a novel error function with a correlation penalty improves interaction and diversity among classifiers during training. On PTBXL-2020 (12-lead) and CinC-training2017 (single-lead) ECG datasets, the DMSCE achieved state-of-the-art F1-scores of 84.5% and 88.3%, respectively. Because of its strong generalization and scalability, it is suitable for remote and in-hospital cardiac monitoring. Authors [
36] present a hybrid approach for ECG classification that combines deep learning features from AlexNet for both ECG and HRV. Using the Gabor transform, the ECG signals were transformed into 2D images and optimal features were extracted and classified to detect normal sinus rhythm, arrhythmia and congestive heart failure. The method has an accuracy of 98.75%, a specificity of 99.00%, a sensitivity of 98.18%, and a computation time of 0.15 s and thus has the potential for real-time clinical use. In [
37], the paper proposes a spatiotemporal attention-based convolutional recurrent neural network (STA-CRNN) for improved arrhythmia detection from 12-lead ECG signals. STA-CRNN integrates CNN to extract spatial features, RNN for temporal information and attention modules to select relevant spatial and temporal information. The model obtained an average F1-score of 0.835 across 8 arrhythmia classes and normal rhythm and outperformed state-of-the-art methods on the same dataset. Visualization showed that the features learned by the STA-CRNN are consistent with clinical judgment and that it can support cardiologists in their arrhythmia diagnosis (refer to
Table 4). In [
16], the study discusses the difficulties of the automatic classification of ECG arrhythmias and the necessity of managing vast amounts of clinical data as well as irrelevant features. A two-step method was used: shallow feature extraction (time-domain analysis) and feature selection using a metaheuristic optimization algorithm. The experiment shows that choosing 1–3 features from RR interval assessment is sufficient to achieve perfect classification performance with 100% accuracy, sensitivity, specificity, and precision, and it is better than other techniques, suggesting that optimized feature selection is efficient for ECG analysis. Authors [
38] have also used DL for classification of cardiac arrhythmia after reversing ECG images into time-series signals and digitizing ECG images. Using convolutional neural networks (CNN), long short-term memory (LSTM) networks, and self-supervised learning (SSL) models, ECG signals from digitized lead II heartbeats were classified. CNN had the highest accuracy of ~92%, which guarantees fast real-time inference. The proposed method also has the advantage of being able to integrate with ECG machines as a raw signal rather than an image, thus enabling real-time and accurate monitoring by cardiologists. Authors [
39] present a deep learning-based approach for arrhythmia detection from ECG signals with minimal amount of preprocessing. A 1D CNN with a Gate Recurrent Unit (GRU) is employed for feature extraction and classification of five arrhythmia classes: Normal, PVCs, LBBB, RBBB, and paced beats. The method uses a multi-class Support Vector Machine (SVM) for extra classification, with an accuracy of 99.97%. The approach shows the possibility of using this approach for the efficient and accurate detection of arrhythmia in clinical applications with minimal data preparation. The proposed method demonstrates balanced performance across various arrhythmia classes by achieving 85% accuracy and 0.85 F1-score. The STFT-CNN [
33] and AlexNet-Gabor [
36] achieve higher accuracy rates of up to 99% but they require image transformations. The model preserves high interpretability and clinical relevance through its use of untransformed 12-lead ECG signals, and it does not require expensive transformations which makes it suitable for hospital system integration. The attention mechanism in ABMA provides interpretability whereas GRU-SVM hybrids [
39] lack because their decision-making processes remain unclear (Refer to
Table 7). To classify variable-length ECG signals, authors [
40] employed a temporal attention mechanism with CNN and recurrent cells, achieving high accuracy of 81.2% while significantly improving the detection of paroxysmal arrhythmias. The proposed system also greatly reduces the complexity of computation and the number of model parameters. The authors present a multi-task channel attention network called MCA-Net using residual channel attention for the joint detection and localization of myocardial infarction from 12-lead ECGs. The network reaches a detection accuracy of >90% and localization accuracy of >80% on the dataset PTB-XL [
41]. Yang designed CaMPNet, a multimodal transformer that employs cross-attention to integrate ECG signals, structured ECG features, and demographic data for the detection of cardiovascular comorbidities. CaMPNet achieved AUC values of 0.845 (on internal data) and 0.715 (on external data); however, its external generalization performance was poor [
42]. Authors [
43] present MS-LTCAF, a multi-scale lead-temporal co-attention framework that integrates lead-temporal co-attention and multi-scale feature extraction for multilead ECG arrhythmia classification. Experimental results on two datasets (PTB-XL and LUDB) achieved AUCs of 0.927 and 0.942, respectively, enhancing the lead–temporal representation. However, the results were not externally validated. The presented methodology, backed by thorough quantitative and visual analysis, also possesses strong potential for automation of clinical ECG analysis systems. In this work [
44], we introduce a multibranch CNN, MB-CNN-ATT, for multilabel 12-lead ECG classification, where lead-wise attention fusion is further introduced to enhance inter-lead feature integration. Experimental results on two public datasets, PTB-XL and CPSC, show that MB-CNN-ATT outperforms state-of-the-art CNN- and ResNet-based methods with AUCs of 93.3% and 96.1%, respectively. In the paper, the authors introduced MB-CNN-ATT, a multibranch CNN for 12-lead ECG classification with lead-wise attention fusion. The proposed model outperforms state-of-the-art approaches in terms of AUCs (93.3% and 96.1%) and significantly enhances inter-lead feature learning [
44]. In the paper [
45], the authors propose a Multi-Scale Grid Transformer, called MSGformer, that integrates self-attention with multilead feature fusion and multi-scale grid attention for ECG classification. The approach yields an F1-score of 0.86 on CPSC 2018 and 99.28% accuracy on MIT-BIH arrhythmia database. The authors proposed [
18] “Lead wise grouping multibranch network” that organizes 12-lead ECG network partitions into groups processed by parallel branches. State-of-the-art results are achieved with AUROC ~0.96 and F1 ~0.75–0.81. One of the main challenges is the strong lead dependency. The method significantly improves the efficiency of multi-label classification, and also some researchers have applied supervised machine learning techniques with hyperparameter tuning and SHAP interpretability in order to predict heart disease [
19].
Differentiating between sinus rhythm disorders, atrial disorders, supraventricular disorders, and bundle branch and ventricular disorders using electrocardiography (ECG) can be challenging due to overlapping features and the complex nature of cardiac electrophysiology. Each category of arrhythmia presents distinct characteristics on an ECG, but subtle variations and similarities can complicate accurate diagnosis. Atrial disorders are those in which there is abnormal electrical activity of the atria [
47]. AF is characterized by rapid, irregular atrial depolarizations resulting in an irregularly irregular ventricular response and the absence of distinct P waves on the ECG. Atrial flutter is another atrial disorder that shows a “saw-toothed” pattern of flutter waves at a rate of about 250–350 beats per minute, with a regular ventricular response depending on the degree of AV block. As AF and atrial flutter are easily confounded, distinguishing between the two is crucial because they have different clinical implications and management strategies. However, variable AV conduction or other coexisting conditions can make these patterns less clear [
48,
49]. Supraventricular disorders are arrhythmias originating above the ventricles, i.e., from the atria or the AV node. SVT is one of the most common types, which presents a fast heart rate with a narrow QRS complex on the ECG. The causes of SVT include mechanisms such as AV nodal reentrant tachycardia (AVNRT) or AV reentrant tachycardia (AVRT), each with its own slight ECG differences. The above conditions cannot be distinguished easily due to factors like rate dependent changes, pre-existing conduction abnormalities, or the effect of medications or electrolyte imbalance. For instance, atrial fibrillation with a rapid ventricular response can look like VT if there is a BBB, producing a wide QRS complex. Conversely, sinus tachycardia with aberrant conduction can look like SVT or VT. An accurate diagnosis is often made with clinical context, patient history, and other diagnostic tools like electrophysiological studies or advanced imaging. Although ECG is still a valuable method for diagnosing cardiac arrhythmias, the overlapping features of sinus rhythm disorders, atrial disorders, supraventricular disorders, bundle branch and ventricular disorders require a total and precise approach to interpretation. They necessitate an approach that is comprehensive and nuanced, even though ECG remains a fundamental tool in diagnosing cardiac arrhythmias. When necessary, consultation with electrophysiology specialists and continuing education and experience are essential for accurate diagnosis and management. Our proposed model demonstrated strong classification performance for both VT and AFIB, achieving high class-specific F1-scores across the cross-validation folds. The model’s performance and interpretability make it suitable for both acute care and routine monitoring settings if external validation confirms its robustness.
Misclassification between SA and AFIB exists, partly due to their overlapping characteristics and the difficulties inherent in accurately capturing and distinguishing the distinct morphological features of these two different arrhythmias. Both of these arrhythmias display irregular RR intervals; however, SA is distinguished by its organized P-waves and AFIB by the lack of P-waves. P-wave visibility has been found to be highly variable in quality due to factors such as noise, baseline wander, and variability in signal quality, resulting in some challenging instances for the model to classify correctly. This results in classification ambiguity in some cases and is reflected in the corresponding confusion matrix where there is considerable misclassification between SA and AFIB.