1. Introduction
Brain tumors located at the cerebellopontine angle (CPA) are the most common neoplasms within the posterior fossa, comprising 5–10% of all brain tumors. Among all the types of CPA lesions, vestibular schwannomas (VSs) and CPA meningiomas (CPAMs) account for 70–80% and 10–15%, respectively [
1]. Furthermore, research on IDH-mutant astrocytomas in the posterior cranial fossa (PCF) reveals that these tumors, although rare, pose significant diagnostic and therapeutic challenges due to their location and infiltrative nature. Multimodal treatment, including surgery, radiotherapy, and chemotherapy, is crucial for managing these tumors and achieving long-term disease control [
2]. Trigeminal schwannomas (TSs), although rare, constitute a significant diagnostic and therapeutic challenge due to their complex anatomy and location, often requiring specialized surgical approaches such as an endoscopic transorbital approach (ETOA) for effective management. The endoscopic transorbital approach (ETOA) has emerged as a promising surgical option for treating trigeminal schwannomas (TSs), demonstrating high rates of gross total resection (GTR) and adaptability to individual patient needs [
3].
Meningiomas originate from arachnoid villi, whereas most schwannomas arise from the vestibular nerves of the inner ear canal. In the CPA, meningiomas are the second most common tumors after VSs, including, in order of decreasing frequency, the posterior surface of the petrous bone, folds, slopes, cerebellar protrusions, and occipital holes. They often remain asymptomatic during growth, causing only spatial changes, particularly in CPA anatomy [
4]. Meningiomas do not penetrate or erode the internal auditory canal (IAC), while VSs can penetrate the nerve bundles within the IAC [
5]. Although the surgical management of vestibular schwannomas (VS) and cerebellopontine angle Meningiomas (CPAM) generally utilizes similar approaches—most commonly the retro sigmoid (posterior sigmoid suboccipital) approach—specific considerations such as hearing status and tumor extent can alter surgical strategy. For example, the trans labyrinthine approach is specifically indicated for VS patients in whom hearing preservation is no longer possible [
6,
7]. Therefore, accurately identifying these two tumors before surgery is critical to selecting the appropriate surgical procedures and treatment options. However, distinguishing between these two entities is challenging due to significant overlap [
8]. Large trigeminal schwannomas, though benign, pose a significant surgical challenge due to their intricate location and often require a functional sparing approach to balance tumor removal with nerve preservation [
9].
Other studies have found no significant differences in the clinical manifestations between CPAMs and schwannomas, indicating that these manifestations provide limited assistance in differentiating between the two. For example, regarding hearing abnormalities, there is no significant difference between patients with meningiomas and those with schwannomas [
10]. The analysis of tumor samples on glass slides under a microscope, termed as histology, has been considered the golden standard for diagnosing brain tumors such as VS and CPAM. However, this method requires tissue removal, making it an invasive procedure. Thus, it serves as a final confirmatory diagnosis that patients choose reluctantly when no other options are available. Noninvasive brain imaging methods like magnetic resonance imaging (MRI) are employed for the routine examination of brain tumors, including VS and CPAM, to address this limitation. In some instances, VS and CPAM display distinct behaviors, which are evident as unique features in structural MRI data, aiding in their differentiation. For example, VS often involves the inner ear canal and presents heterogeneous tumor enhancement. In contrast, the ‘dural tail’ sign frequently appears in CPAM [
11]. On the other hand, the features mentioned are generally absent in most cases, preventing the identification of VS and CPAM using this method for those applications. In practice, the structural MRI method has been expanded to include four types of pulse sequences: T2-weighted (T2w), T1-weighted (T1w), T1-weighted with enhancement (T1w+), and diffusion-weighted (DW) images (DWI). Among these four modalities, T1w+ images provide the most compelling diagnoses. However, acquiring such diagnoses often necessitates the injection of contrast media, which can be distressing to patients and may lead to contrast media sensitivity reactions.
The T2-weighted sequence is frequently utilized for diagnosing conditions related to the cerebellopontine angle, primarily indicating defects in the cerebrospinal fluid within the cerebellopontine cistern. A T1-weighted sequence with contrast is often employed to refine the diagnosis, necessitating the injection of a contrast agent. Reports concerning gadolinium-based contrast agents have recently received attention. Studies indicate that gadolinium can deposit multiple times in patients’ brains [
12]. Although there is no evidence to show whether the deposition in the brain has a significant effect on brain function, the injection of GBCA is crucial for patients’ safety. A clinical allergy to GBCA is also common. Therefore, in clinical work, if we can reduce the injection of the invasive contrast agent, patients will be better protected.
Previous research in the region of the Antoni B cells has explored the role of diffusion-weighted MRI (DWI) with quantitative apparent diffusion coefficients (ADCs) in distinguishing between VSs and CPAMs [
13]. VSs have a lower density, and their average ADC value is significantly higher than that of CPAMs. Studies mentioned a significant overlap between VS and CPAM, limiting the clinical application for tumor differentiation among individuals. Previously, obtaining an average ADC value entailed manually localizing the region of interest (ROI) on the tumor, overlooking its heterogeneity and potentially causing an overlap in average ADC values observed between the two entities [
14,
15]. The ADC map of the whole tumor is better than the localized approach that was used before because it gives more information about how heterogeneous the tumor is overall and its histological features [
16]. Regions within the tumor exhibiting different diffusion characteristics are represented in the histogram when the entire tumor is analyzed. Histogram analysis using the complete tumor ROI method demonstrates advantages in distinguishing or classifying tumors and predicting therapeutic outcomes across various organs [
17]. Earlier research assessed the efficacy of ADC maps, utilizing the full tumor ROI method combined with histogram analysis, in distinguishing radiologically ambiguous CPAM from VS. However, this research merely contrasted percentile differences between CPAM and VS [
18]. They neglected to explore other potential numerical attributes derived from the ADC maps that could aid in identifying CPAM and VS. More importantly, they did not compare the performance of ADC maps to the image features acquired using other modalities of MRI that have been extensively used in clinics, such as T2w and T1w+ as described above, leaving the important question of how to objectively select these sequences in clinical applications unanswered. Therefore, in this study, for the first time, we systematically and comprehensively investigated the applicability of all the 19 possible numerical features computed from ADC maps and compared their performance with the same features computed from the other two clinically often used MRI modalities with the two pulse sequences, T2w and T1w+, in the identification and differentiation of CPAM and VS. We found that this significantly outperformed the other two sequences (T2w and T1w+) in most of these numerical features. Then, we further cross-validated the differentiation performance of CPAM and VS using ADC maps and their numerical features using machine learning based on a support vector machine (SVM).
4. Discussion
4.1. Multimodal Characteristics of VS and CPAM in Cerebellopontine Angle
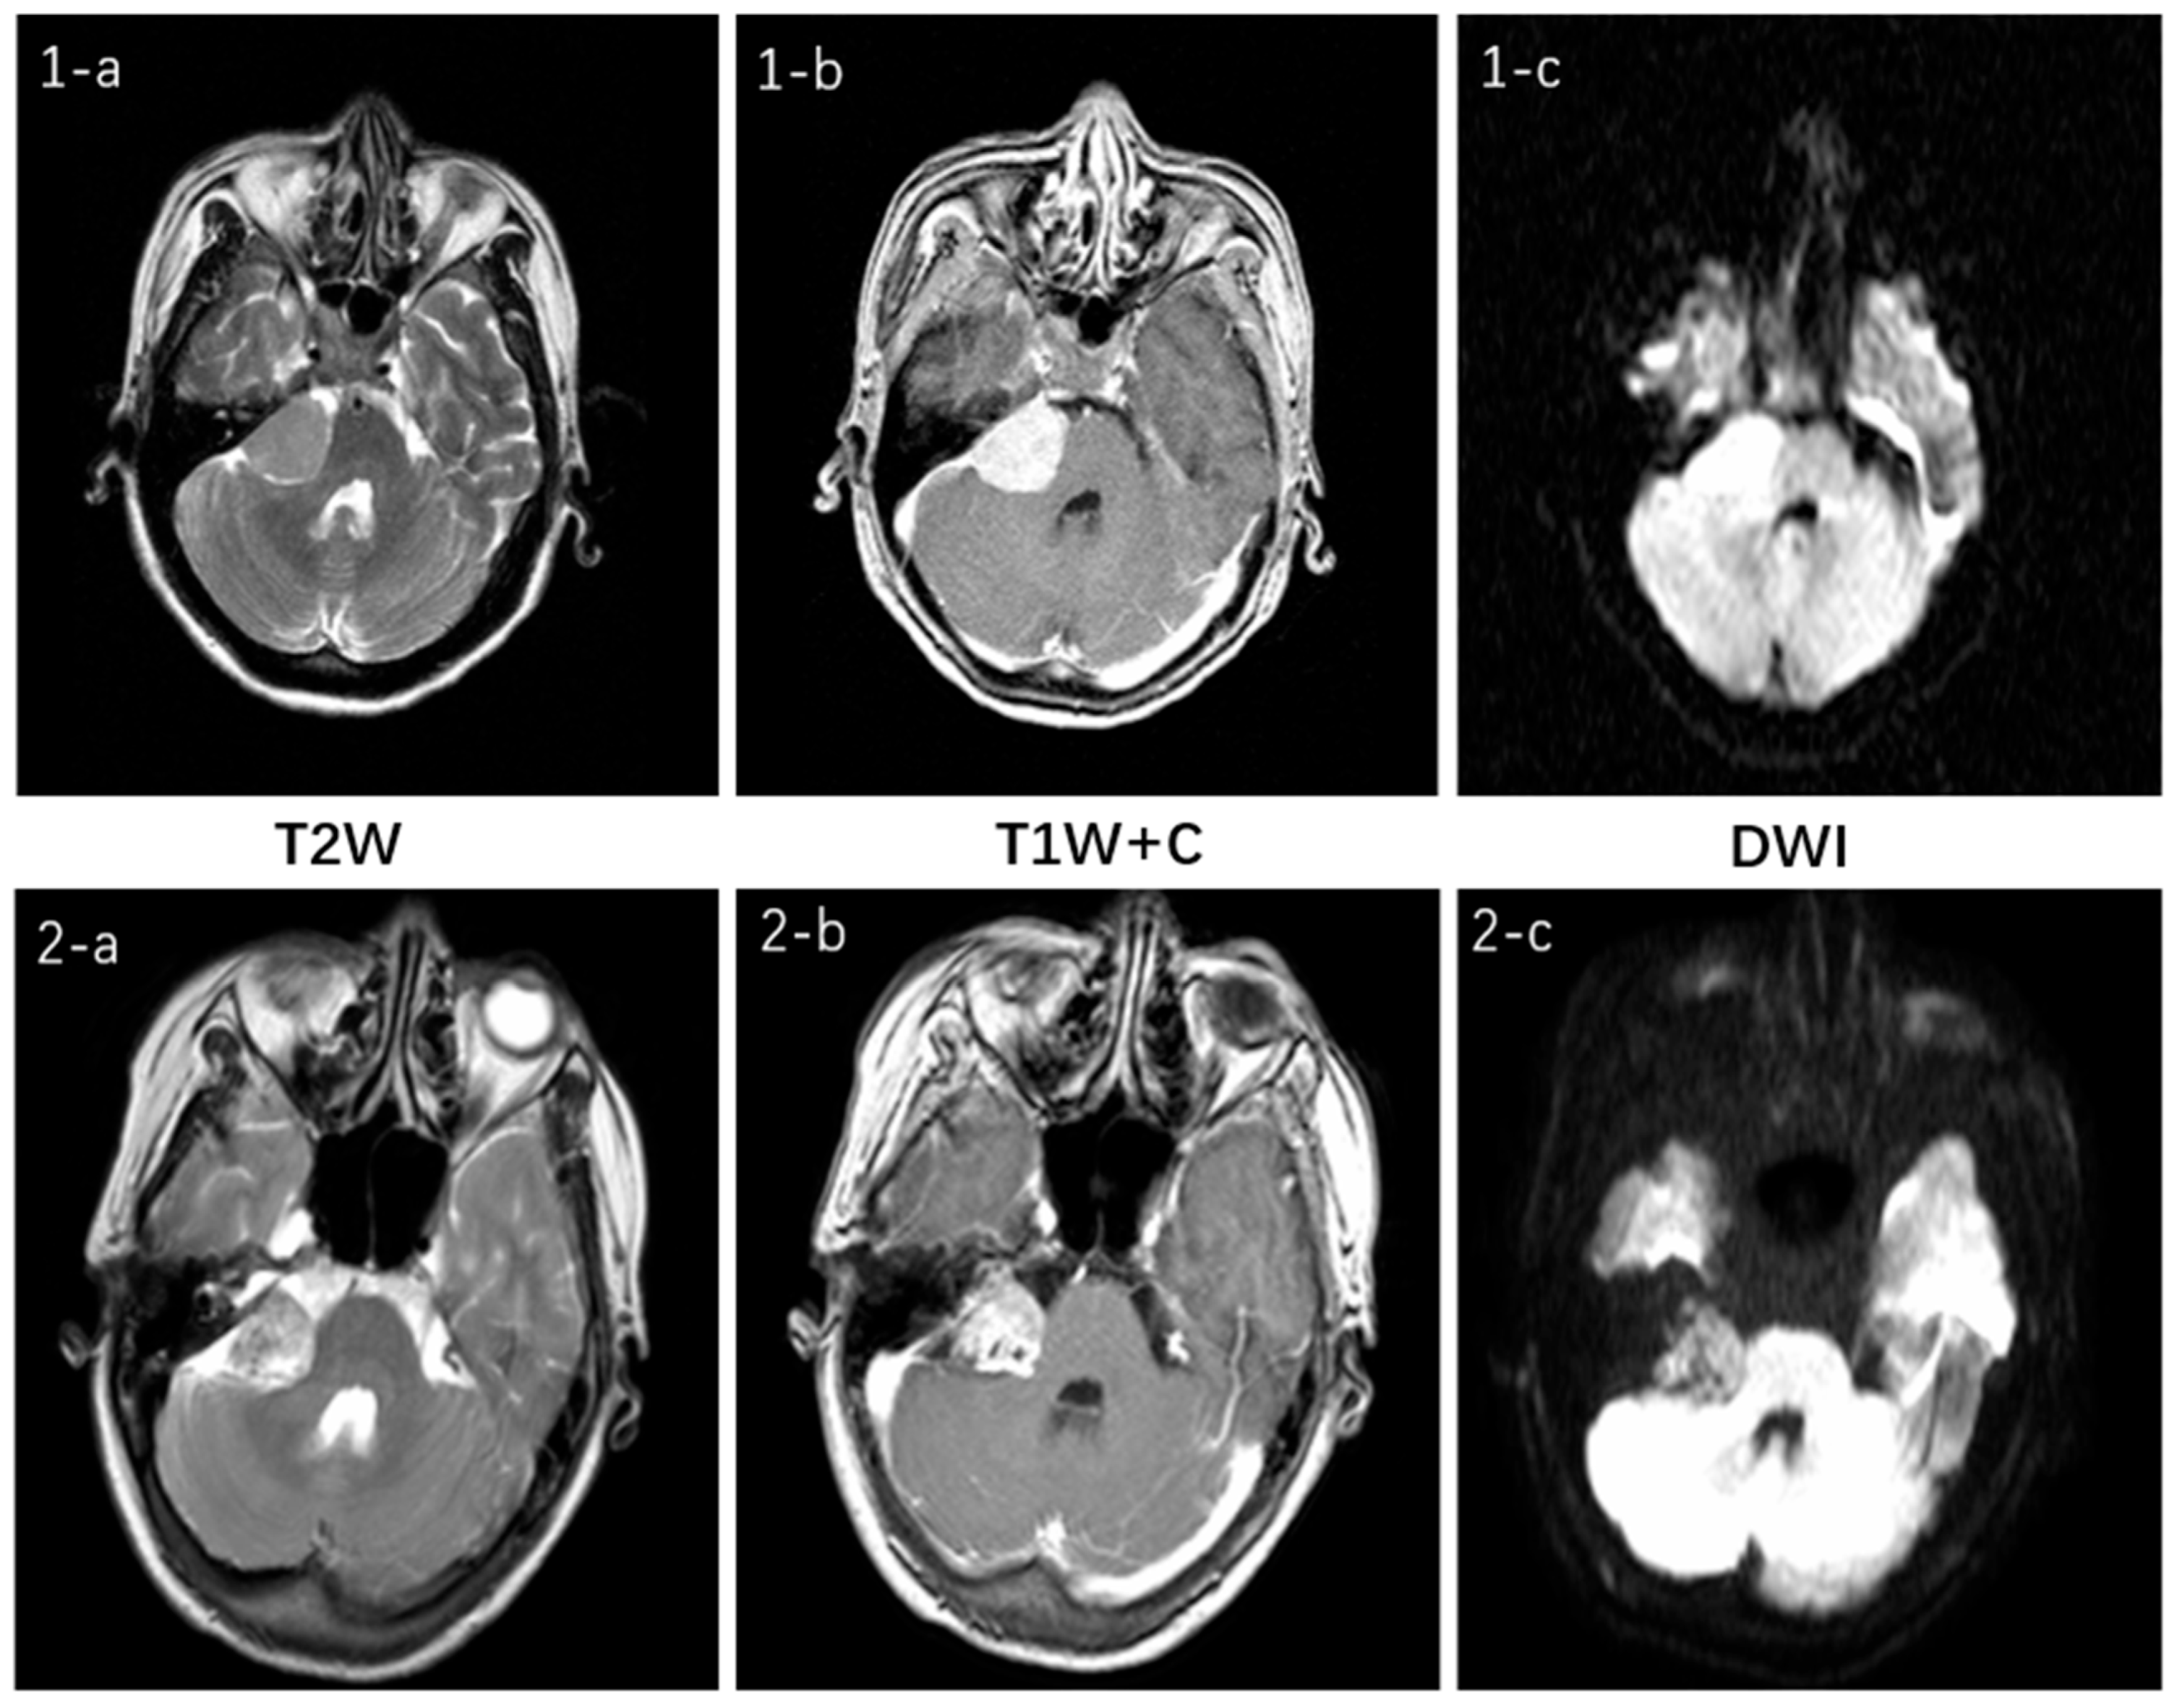
Figure 11 illustrates the multimodal MRI features for the two tumor types and their respective sequences involved in this study. Both tumors are located in the cerebellopontine angle and exhibit no significant difference. On T2W imaging, both demonstrate moderate signal intensity, which is slightly uneven in the VS. Both of the T1W + C sequences show a high signal and clear enhancement. In the DWI sequence, they appear isointense but with slight variations in signal intensity: the CPAM signal is relatively uniform, whereas the VS lesion signal is less so. Clinically, this represents only one manifestation of what can be variable presentations for the same tumor type, thereby increasing diagnostic challenges [
27].
4.2. ADC Imaging Characteristics of CPAM and VS in Cerebellopontine Angle
Previous studies on the differential diagnosis of ADC maps in these two diseases have simply compared individual histogram parameters without systematic comparison or multimodal analysis [
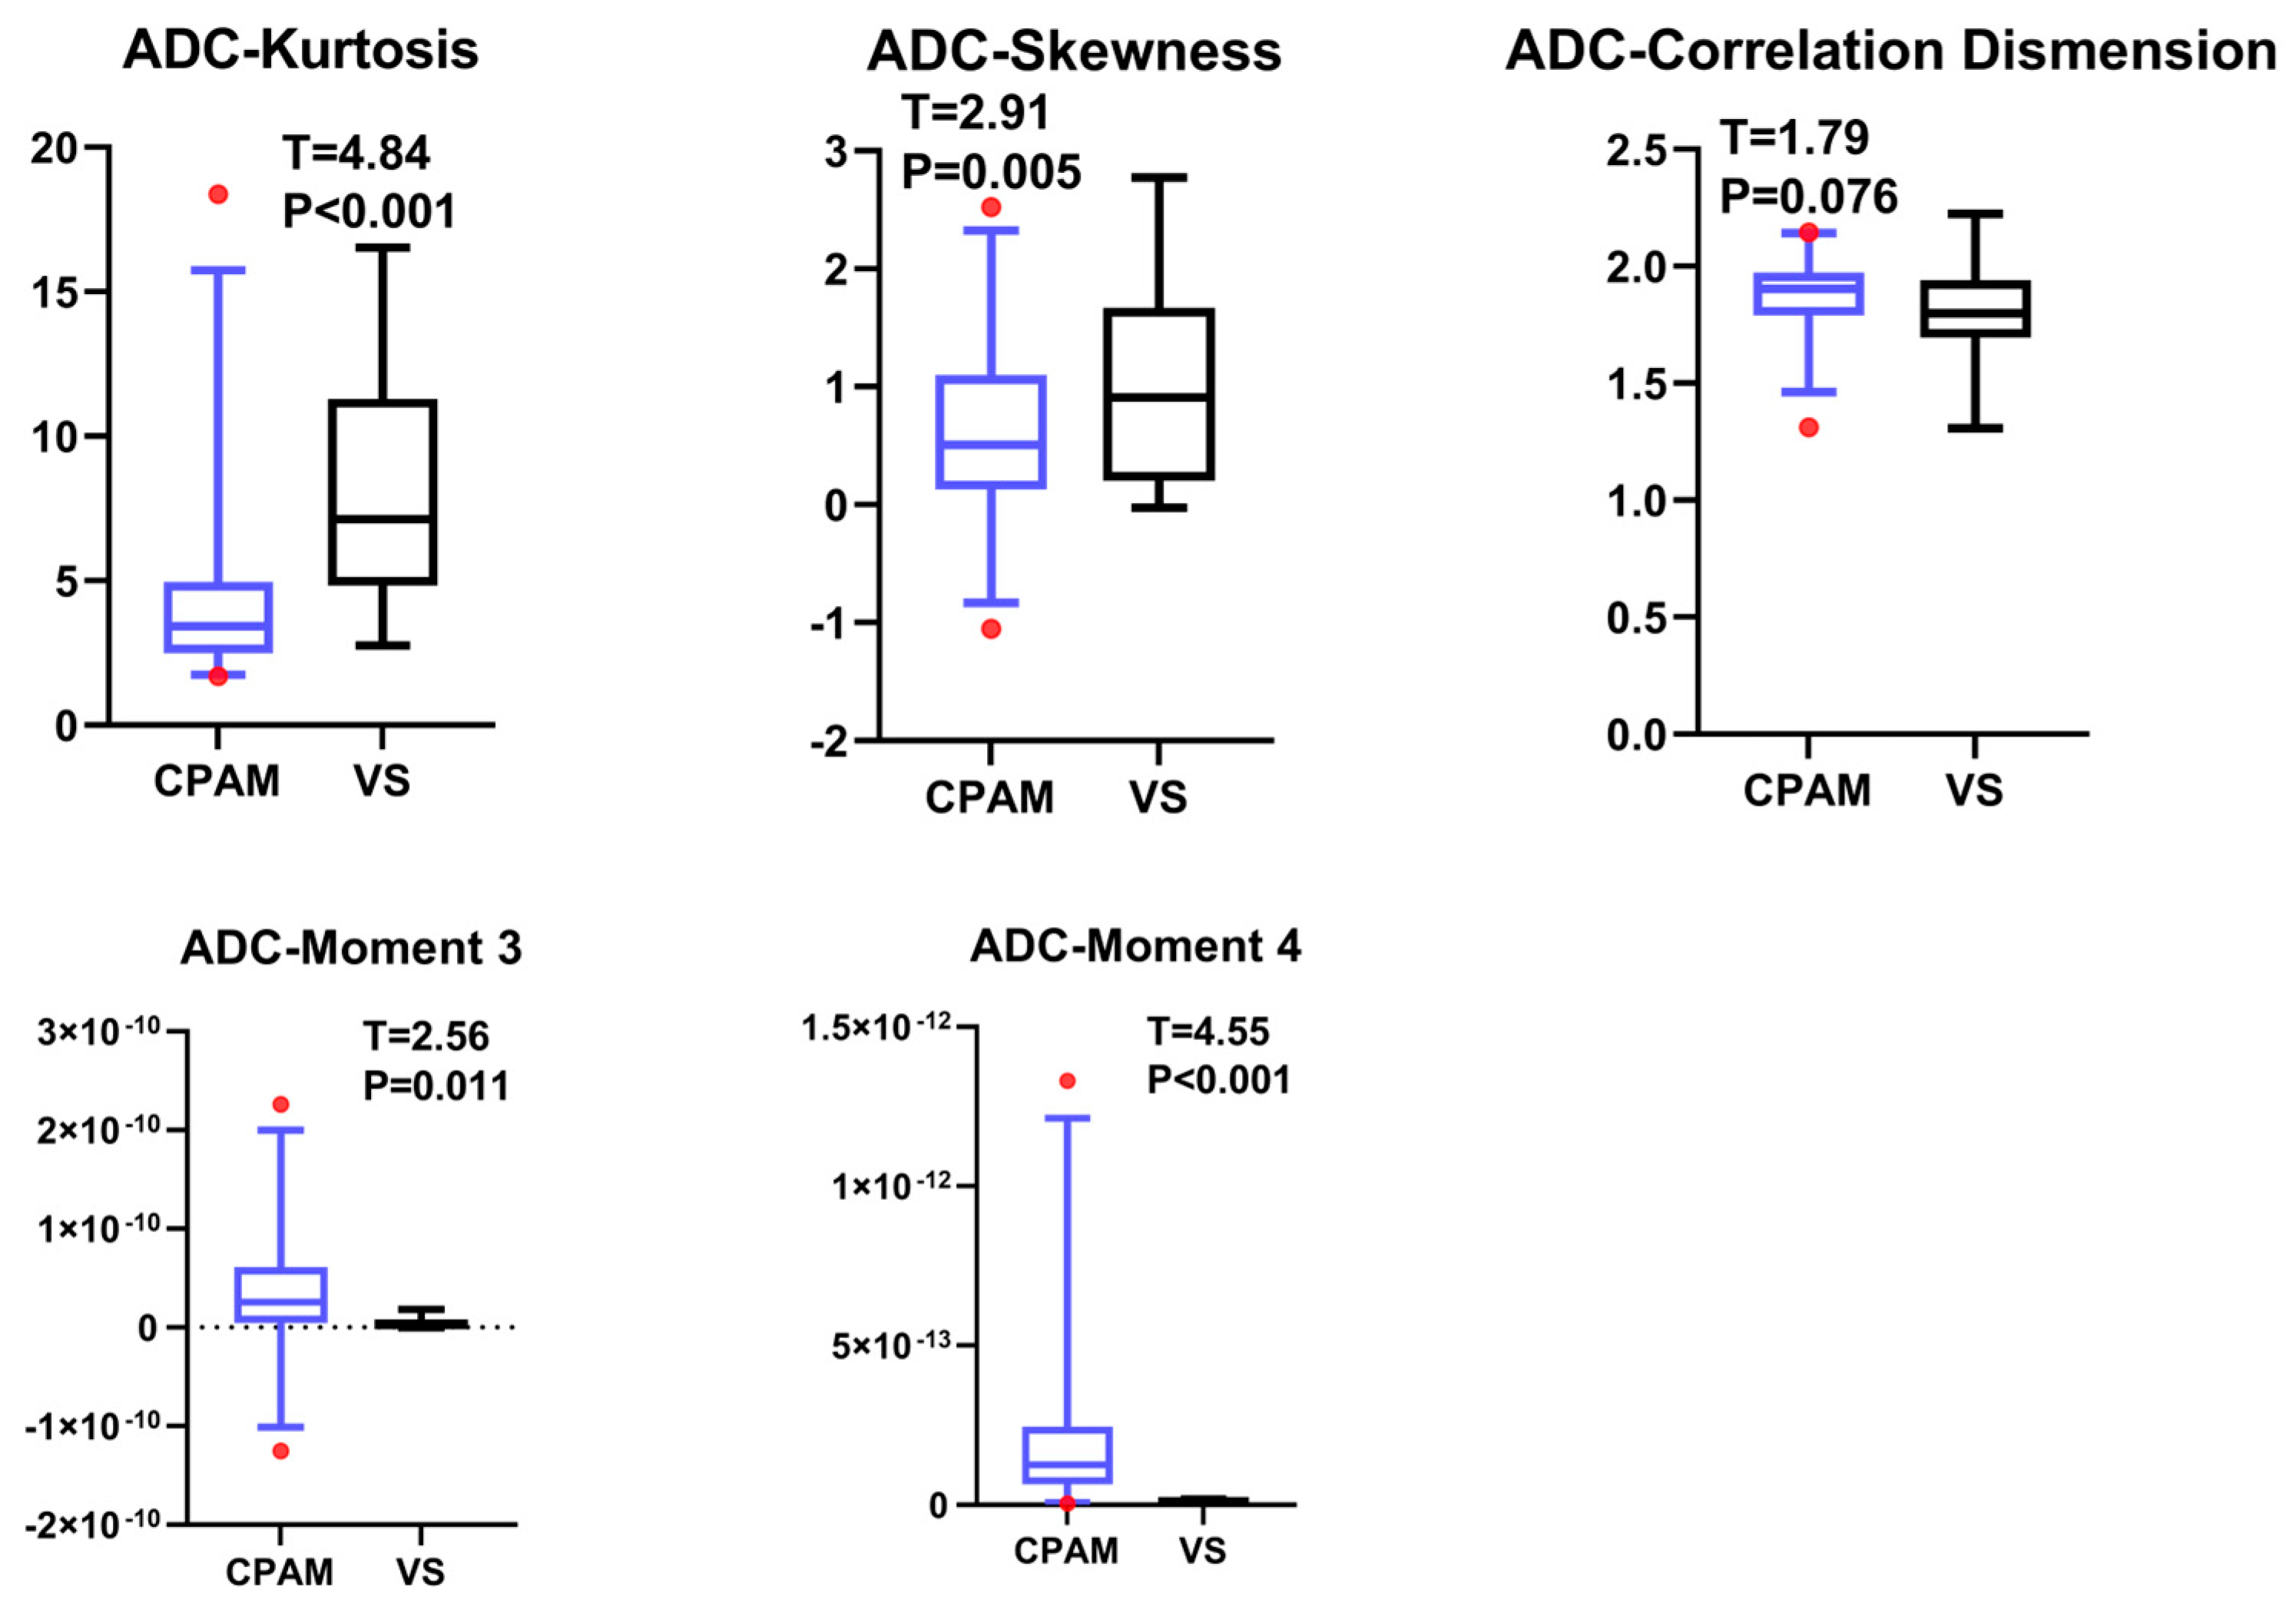
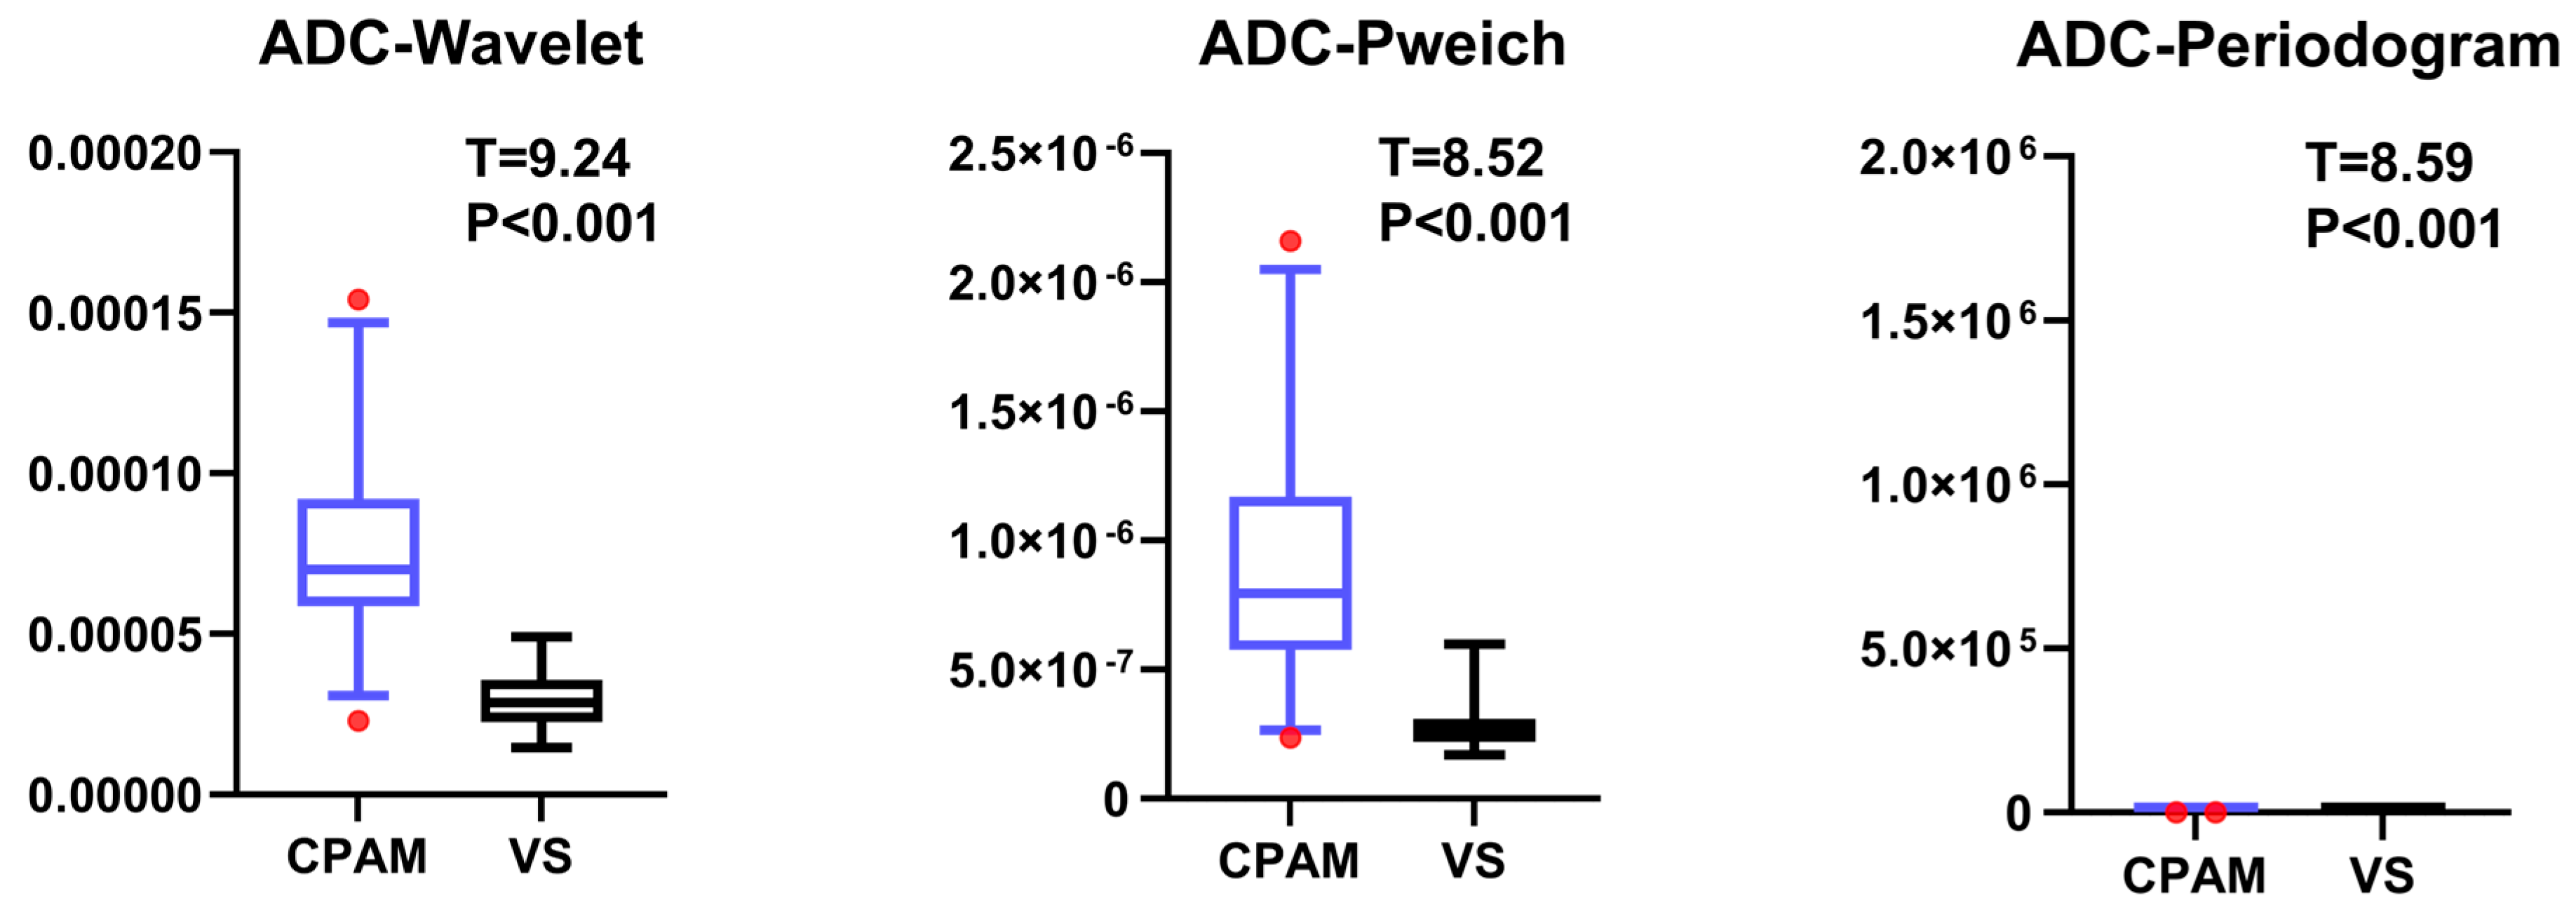
18]. In our study, the CPAM group was significantly larger than the VS group in terms of first-order features. In terms of second-order image features, kurtosis and skewness in the CPAM group were significantly lower than those in the VS group, whereas the third and fourth moments in the CPAM group were significantly higher than those in the VS group. There was no significant difference in the related dimensions between the two groups. In terms of third-order image features, the CPAM group had significantly more features—continuous wavelet transform coefficient, Welch power spectral density, and periodogram—than the VS group. The CPAM group significantly outperforms the VS group, with the exception of kurtosis, skewness, and correlation dimension.
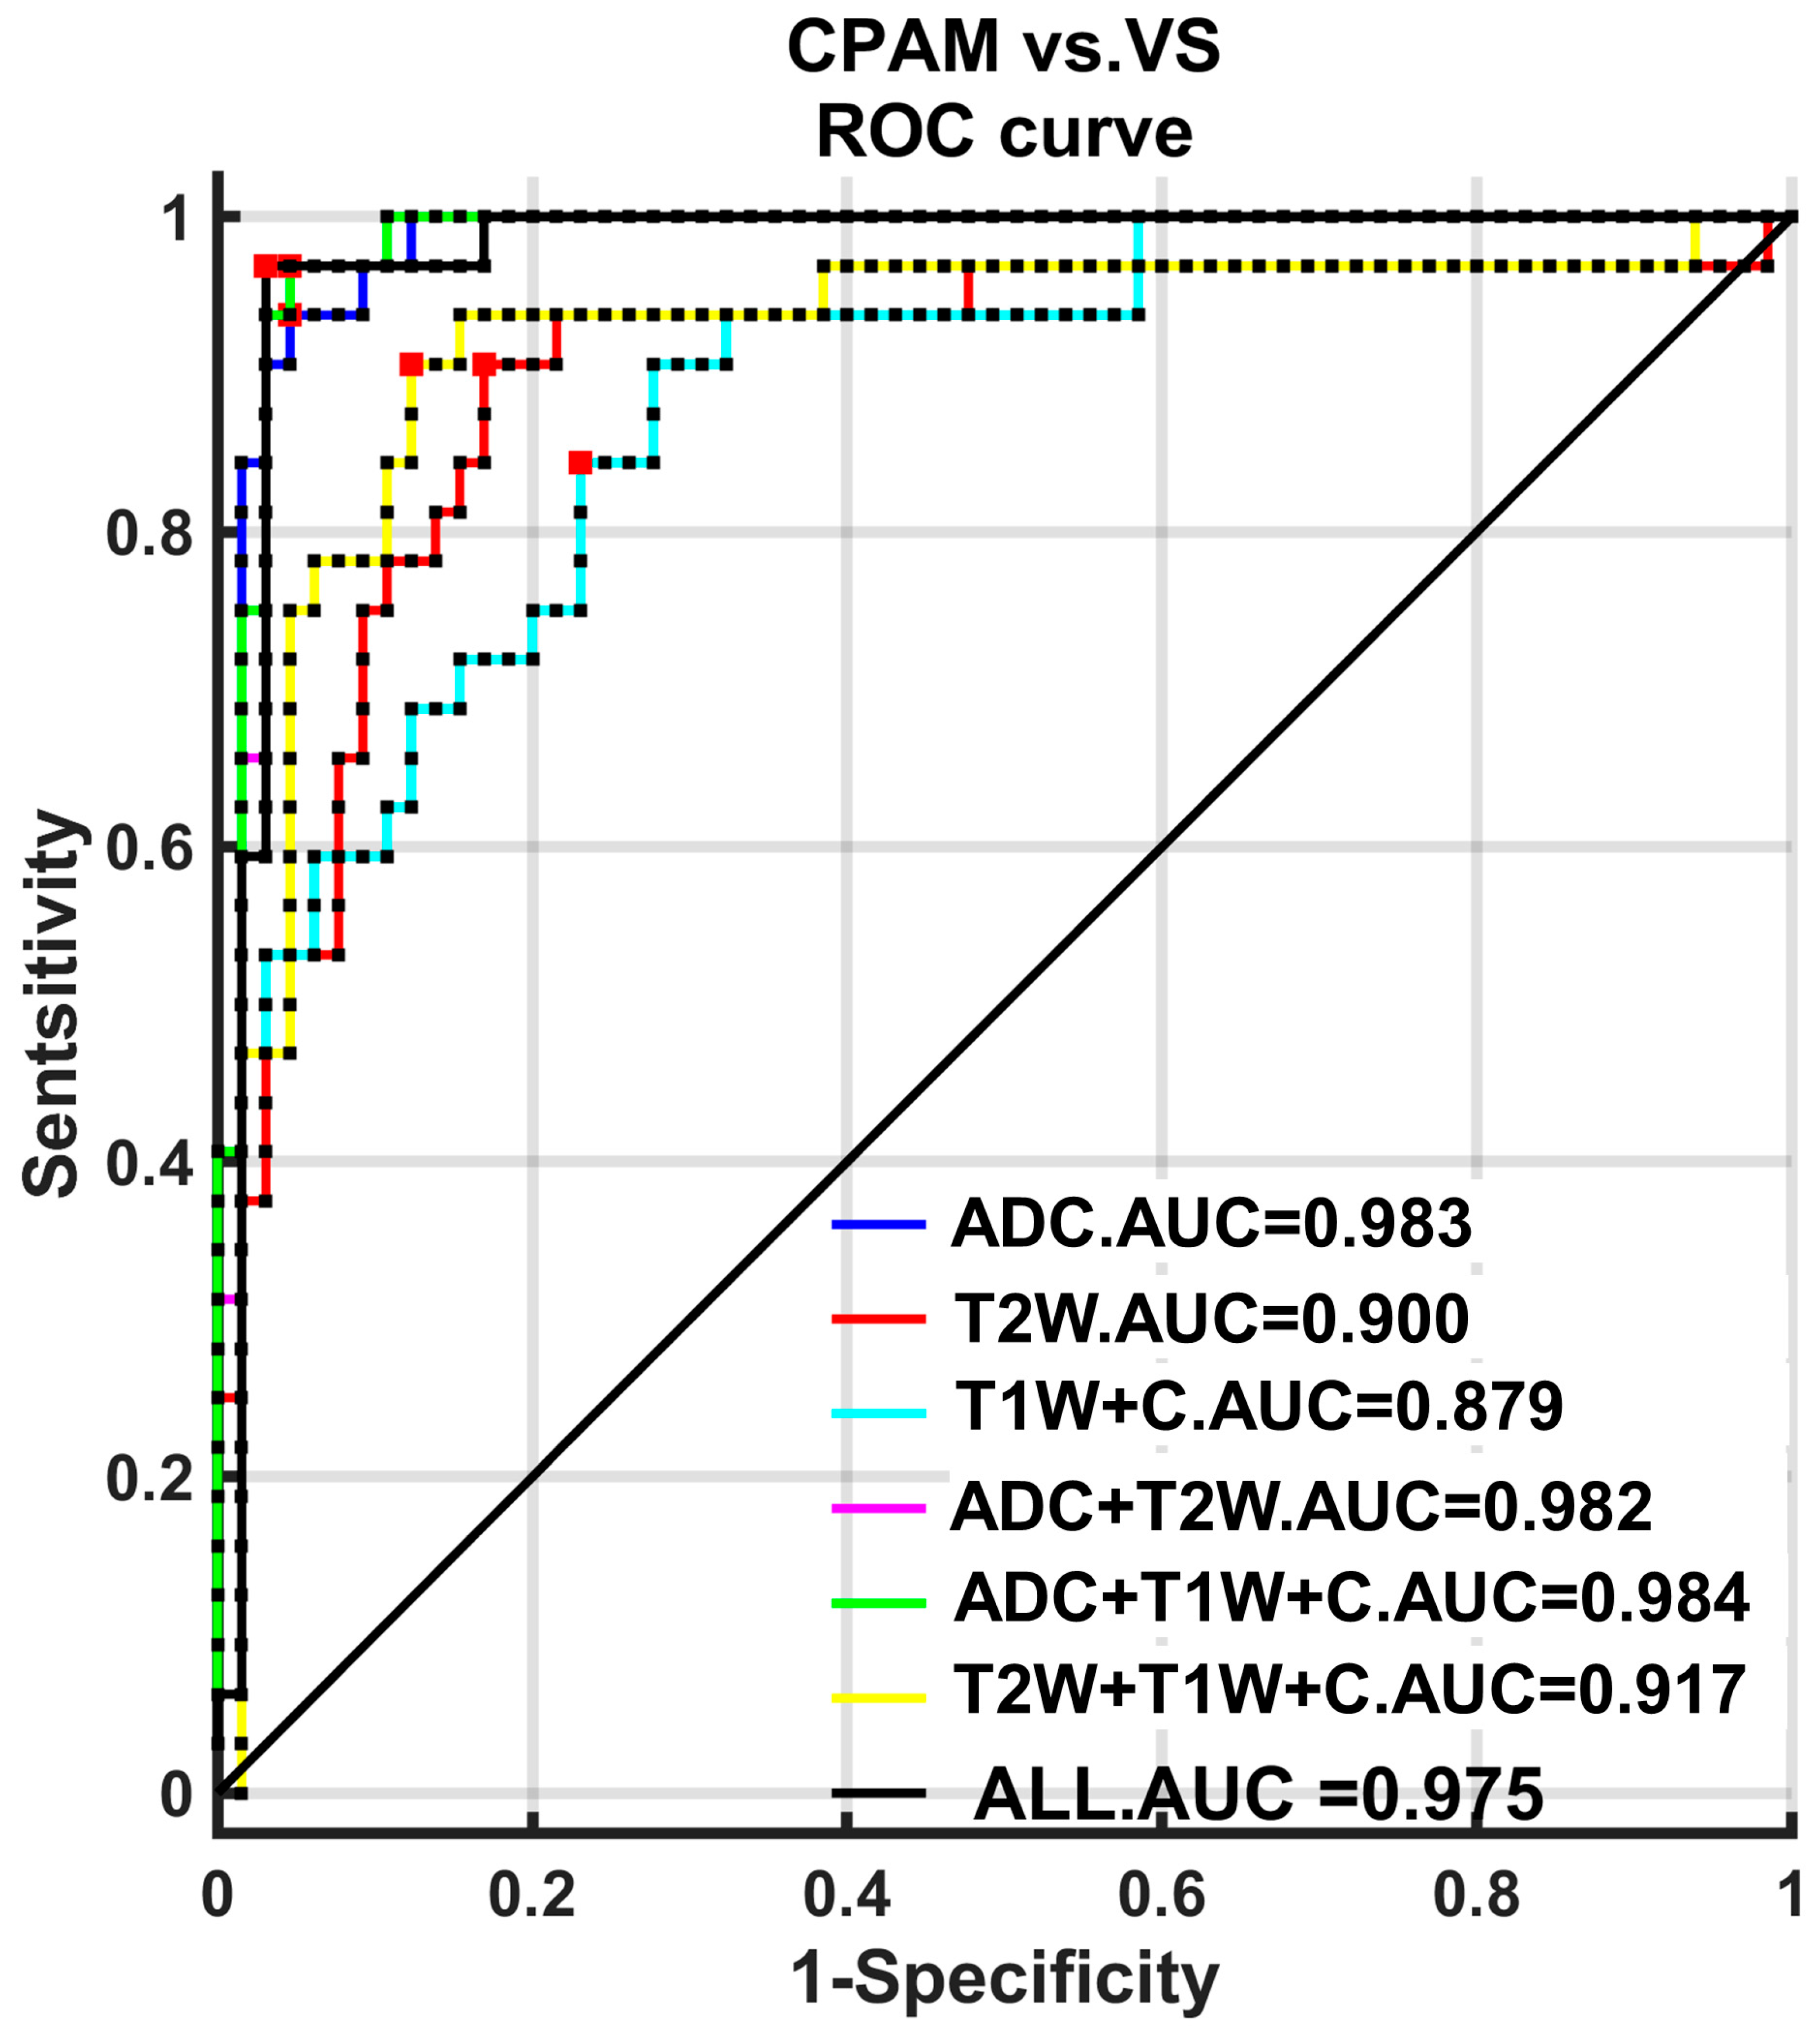
We carry out subsequent machine learning using an SVM on five different combinations of imaging features [
28]. These combinations include the following: (1) the first group, which contains all 18 imaging features except “entropy”, which could not be successfully extracted for most subjects; (2) the second group, which includes all 10 first-order features; (3) the third group, which includes all five second-order features; (4) the fourth group, which includes all three third-order features; and (5) the fifth group, which includes all characteristics with significant differences between groups, totaling 16. These five groups of feature combinations were classified into the CPAM group and VS group. It was found that the third-order feature classification achieved the highest accuracy, sensitivity, and specificity [
29]. Moreover, the ROC curve was used to quantitatively analyze these classification strategies. Both the first-order and third-order features had the highest AUC, at 0.9817 each.
The above research shows that machine learning enables the third-order features to achieve the highest classification accuracy for the two disease groups. Additionally, they exhibit the highest and most stable classification efficiency.
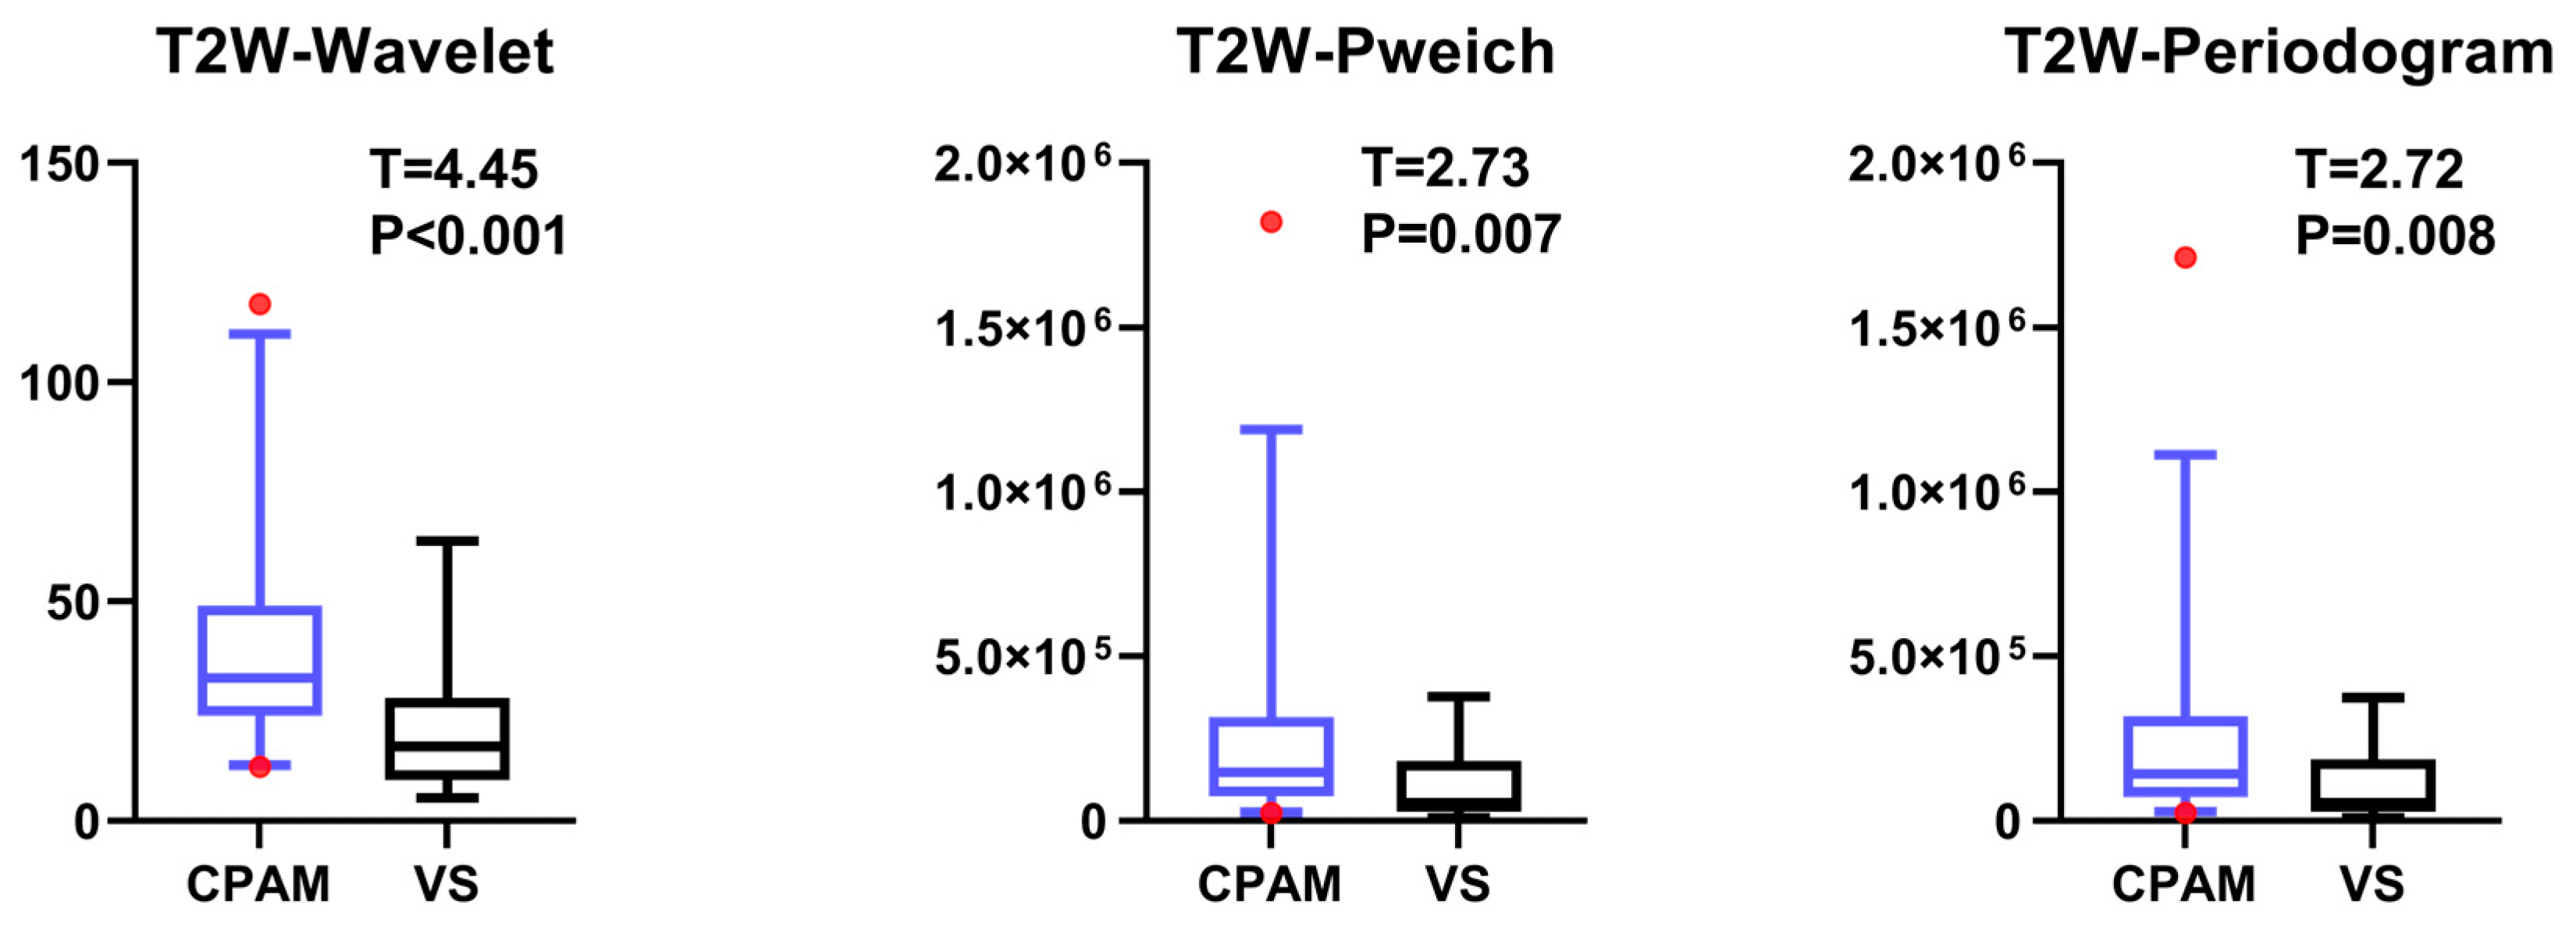
4.3. T2W Imaging Features of VS and CPAM in Cerebellopontine Angle
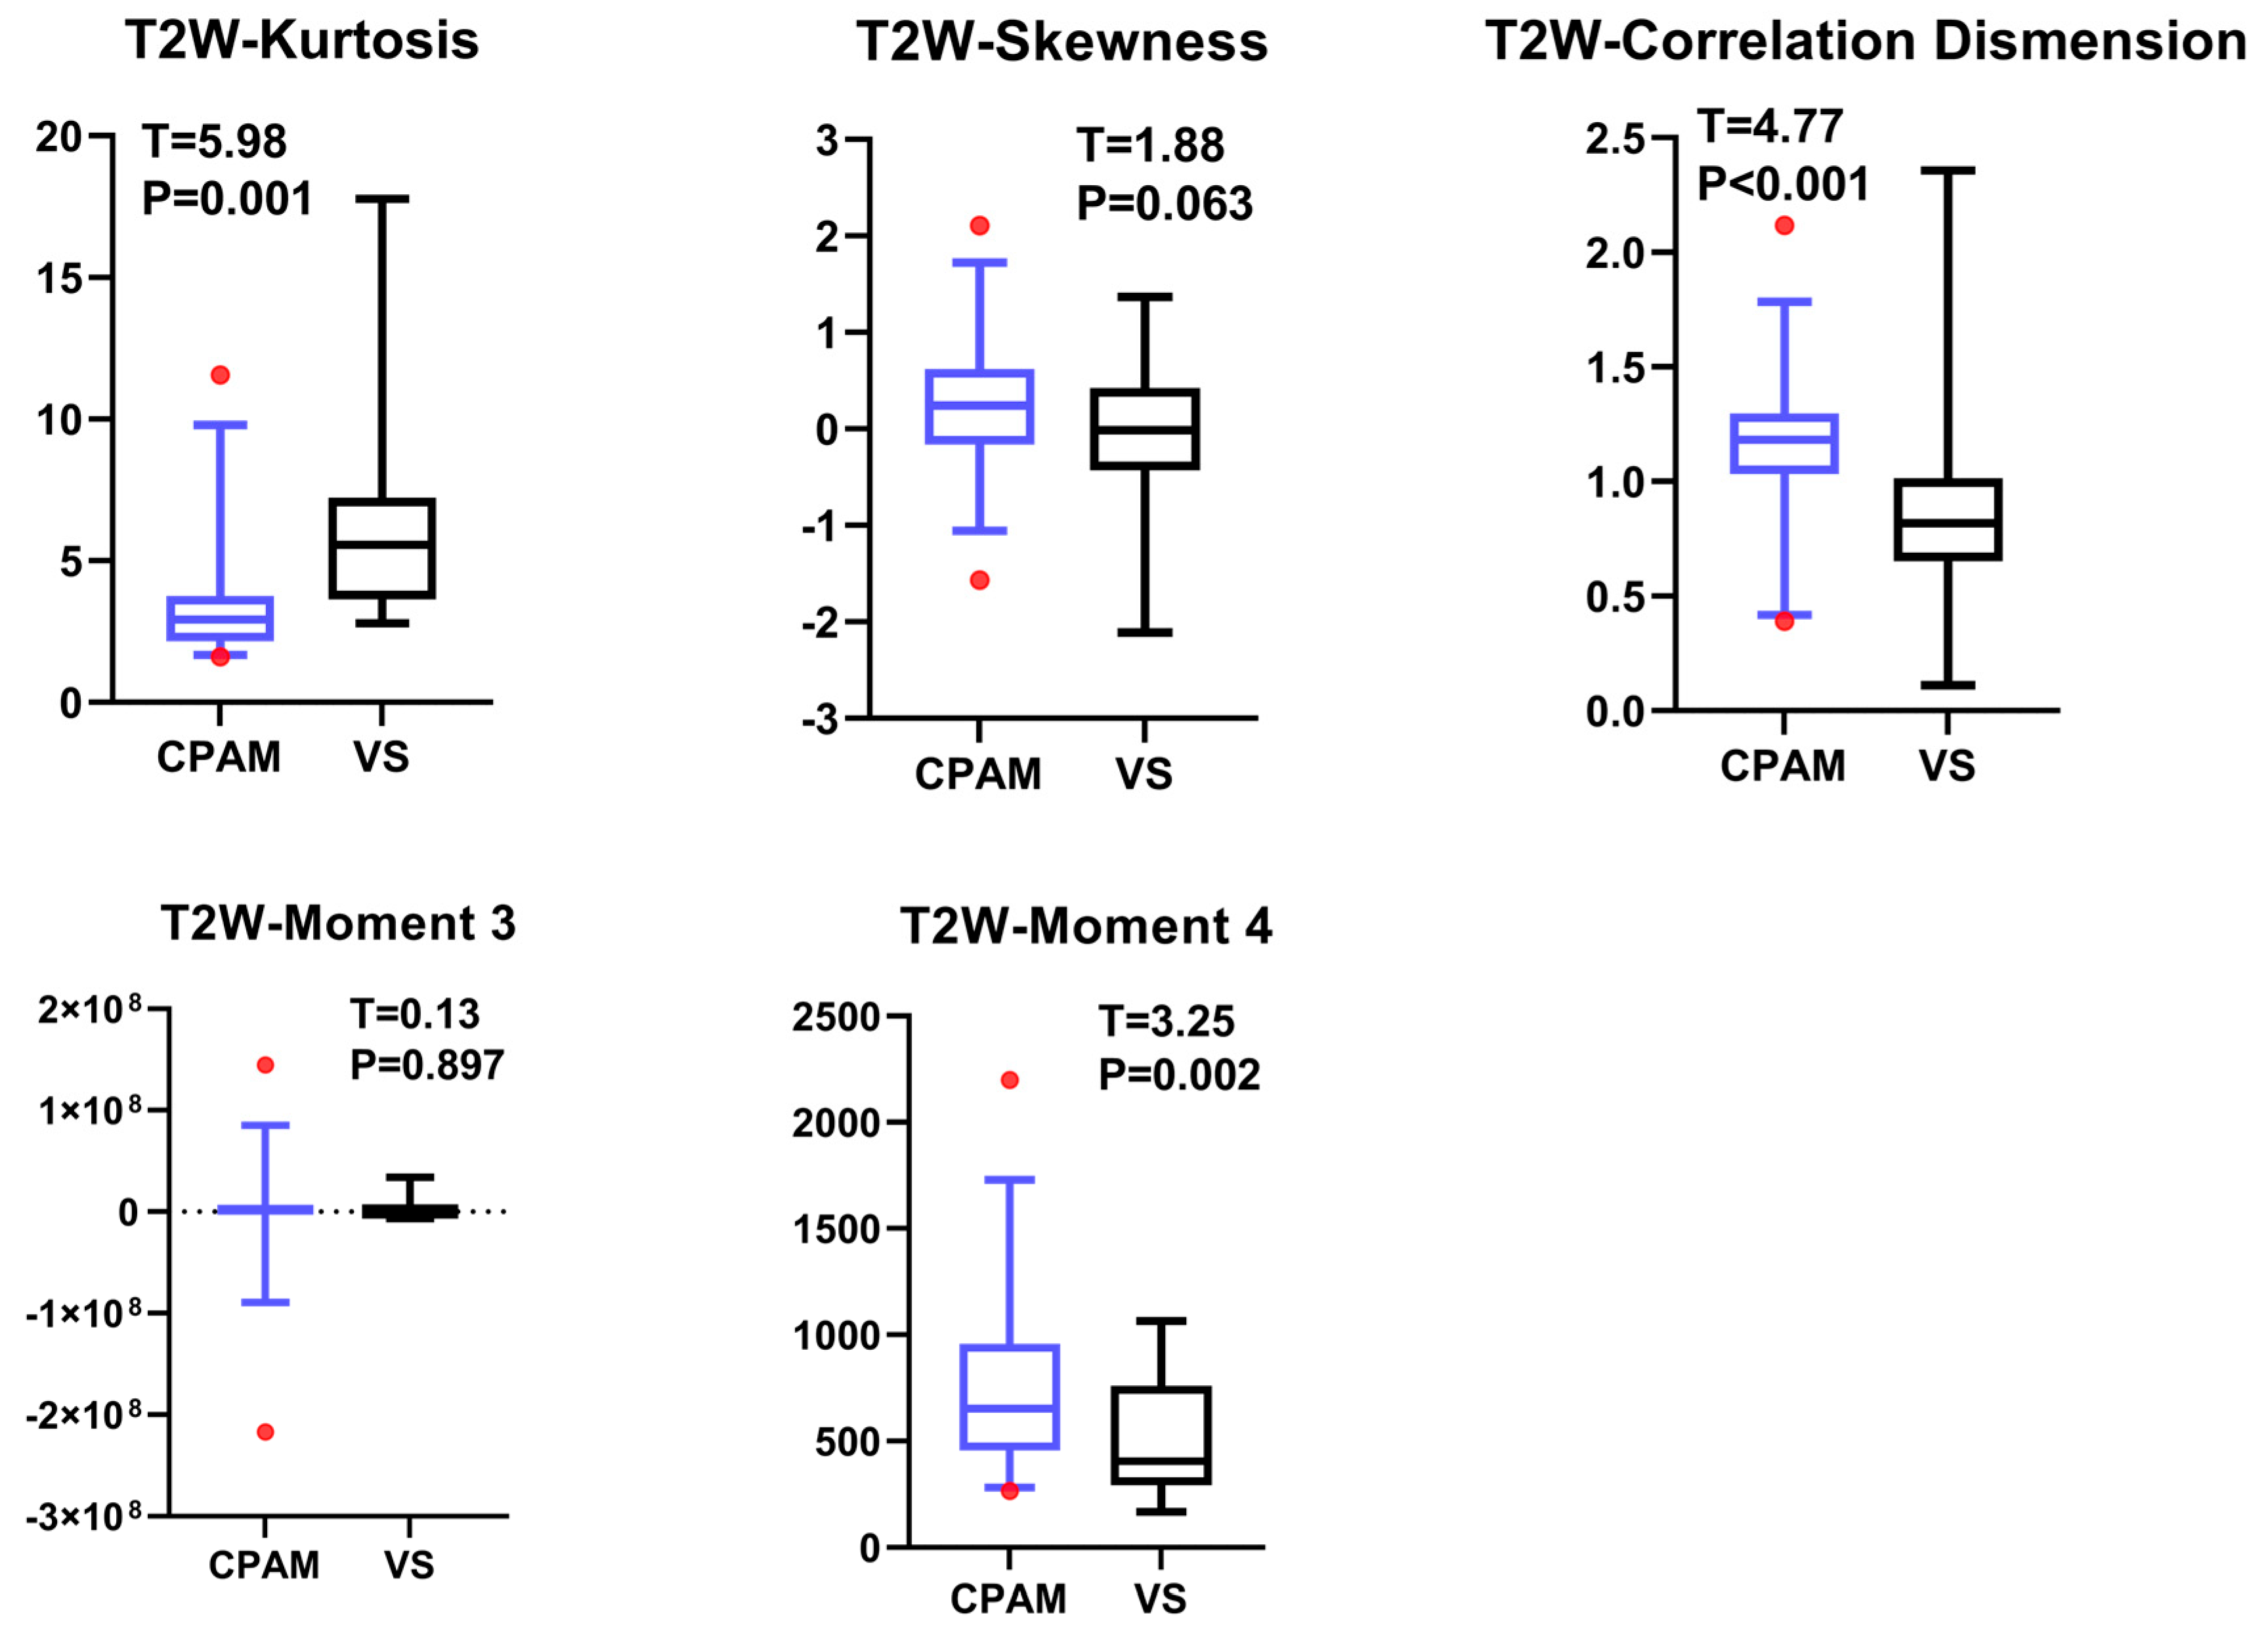
The t-test for the T2W images shows that there is no significant difference in the 10th percentile, third moment, fourth moment, and skewness, except for their entropy. The kurtosis in the CPAM group was significantly lower than in the VS group. The remaining 13 characteristics demonstrated that the CPAM group was significantly larger than the VS group. The image features of the T2W sequence are classified by SVM, and five different feature combinations are used for SVM classification: imaging features, first-order features, second-order features, third-order features, and features with significant intergroup differences. Using the second-order feature for classification yielded the highest efficiency at 87.63%.
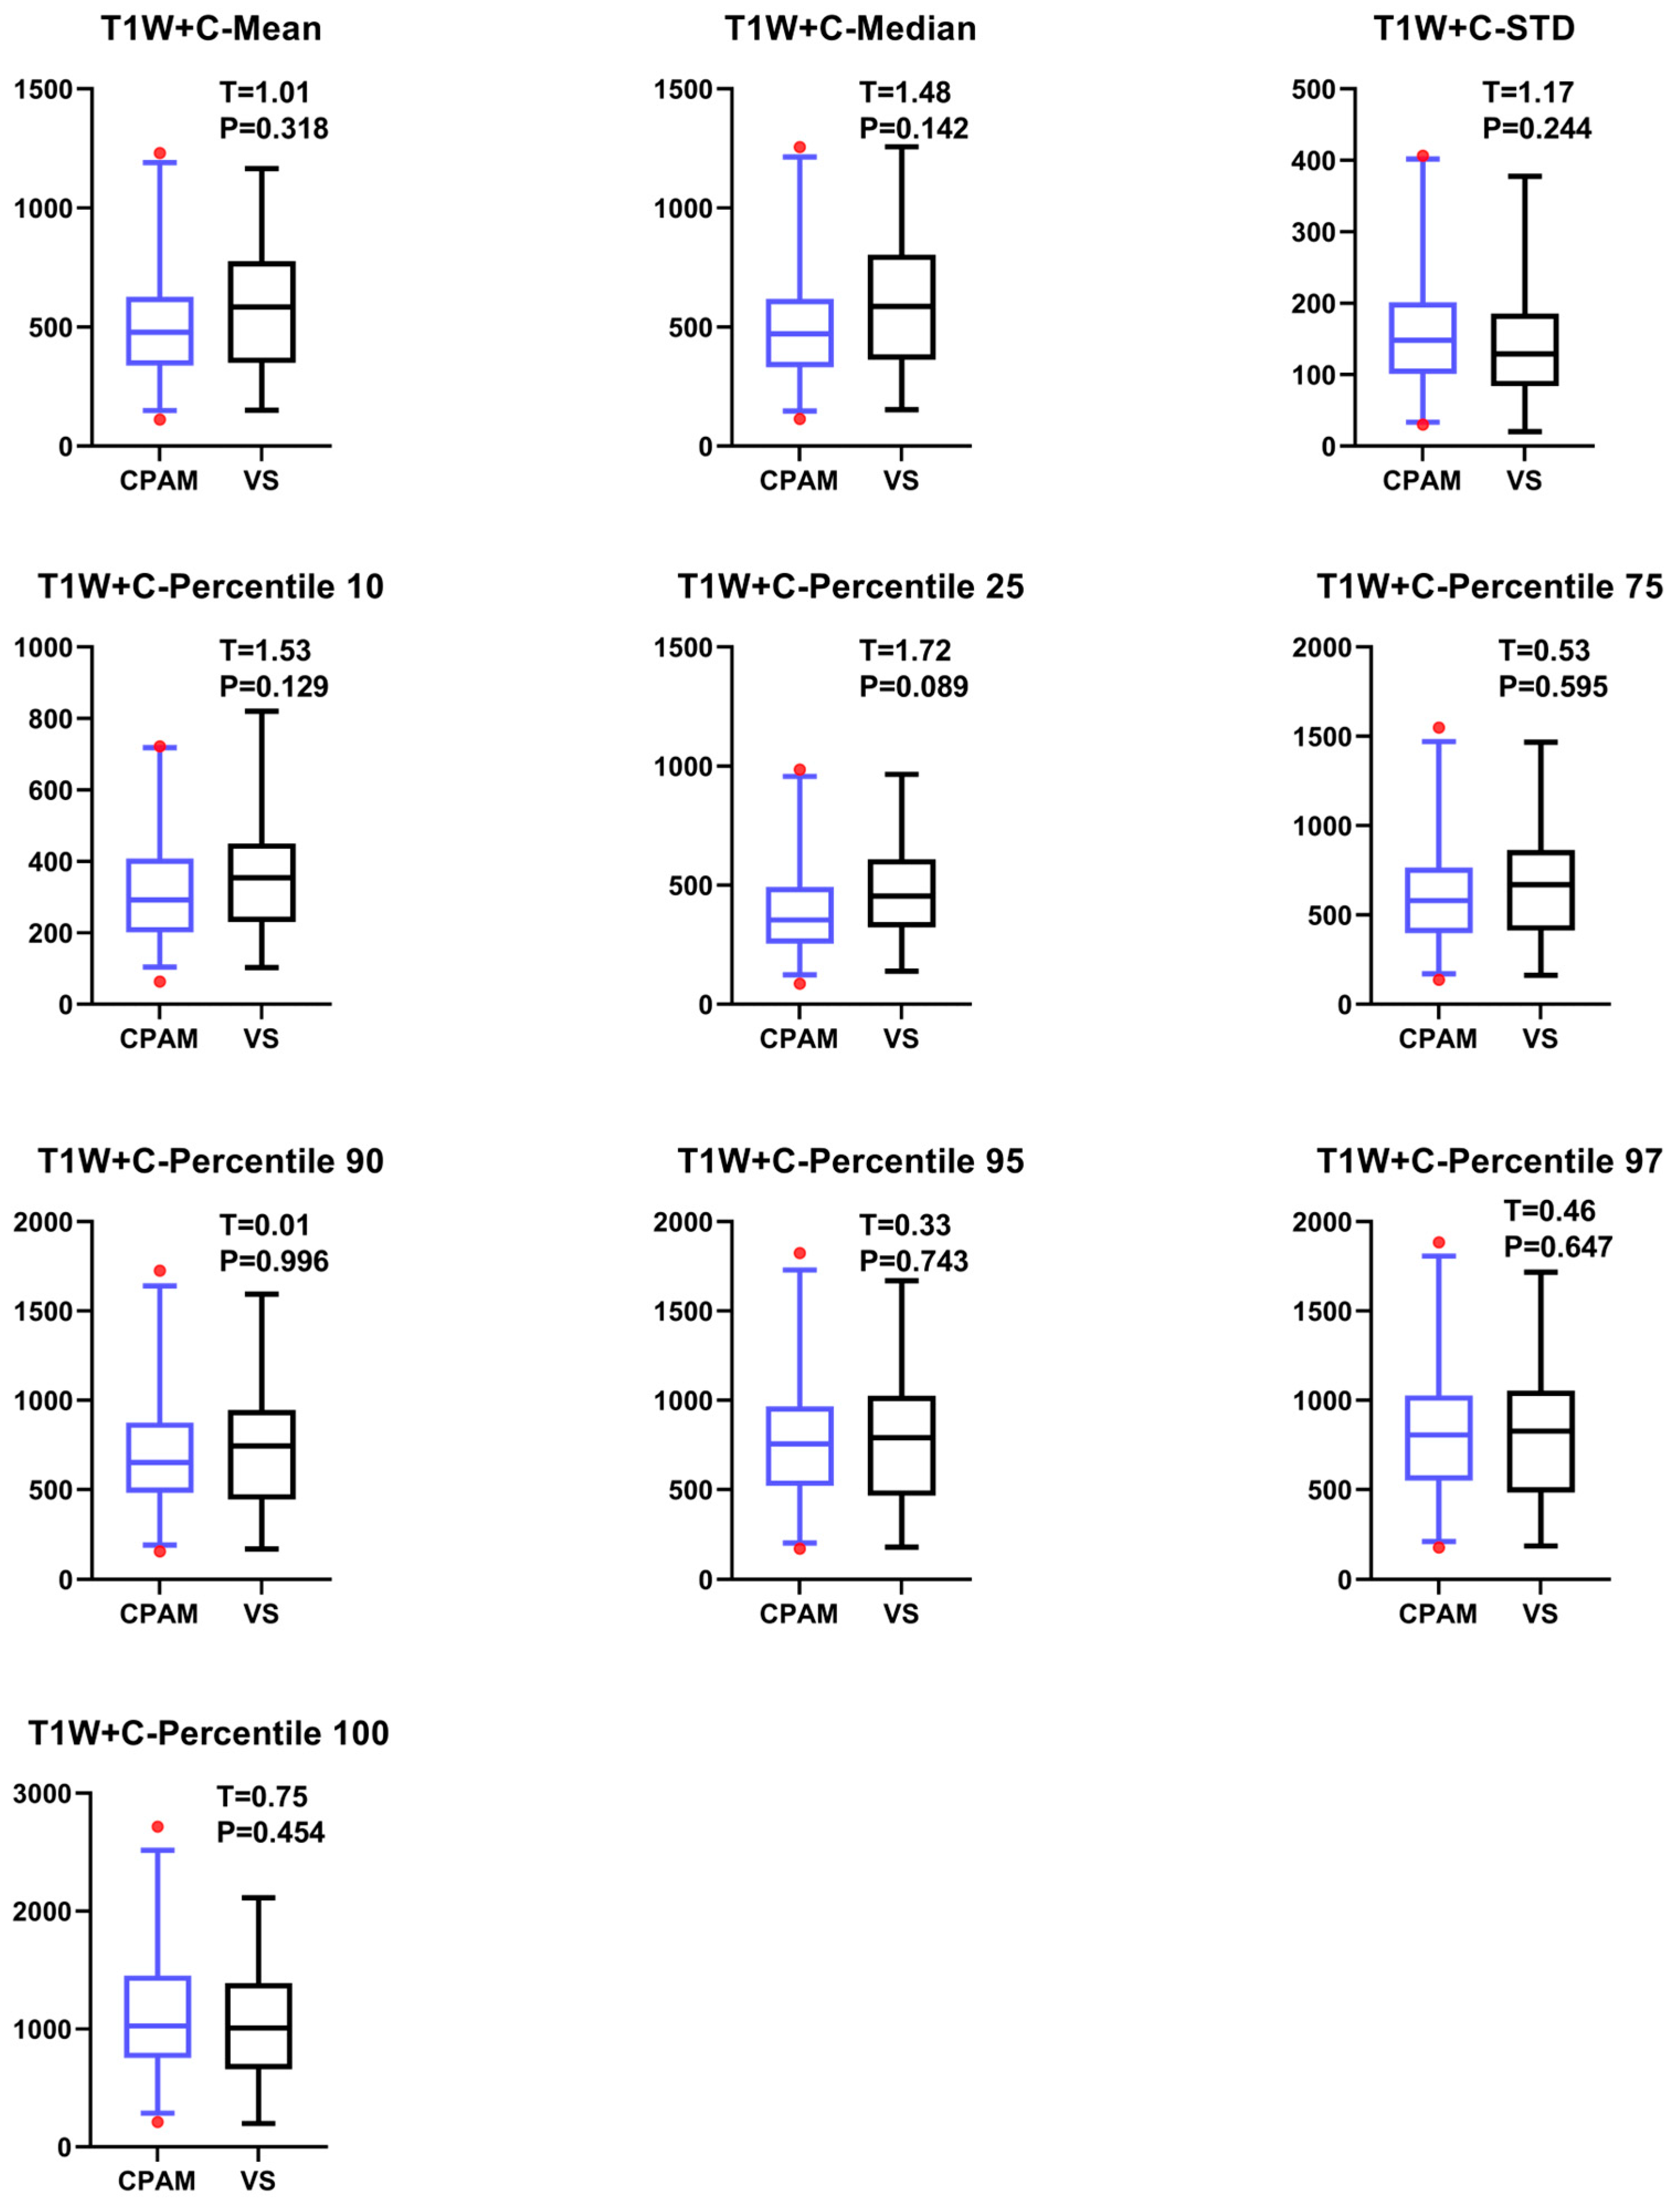
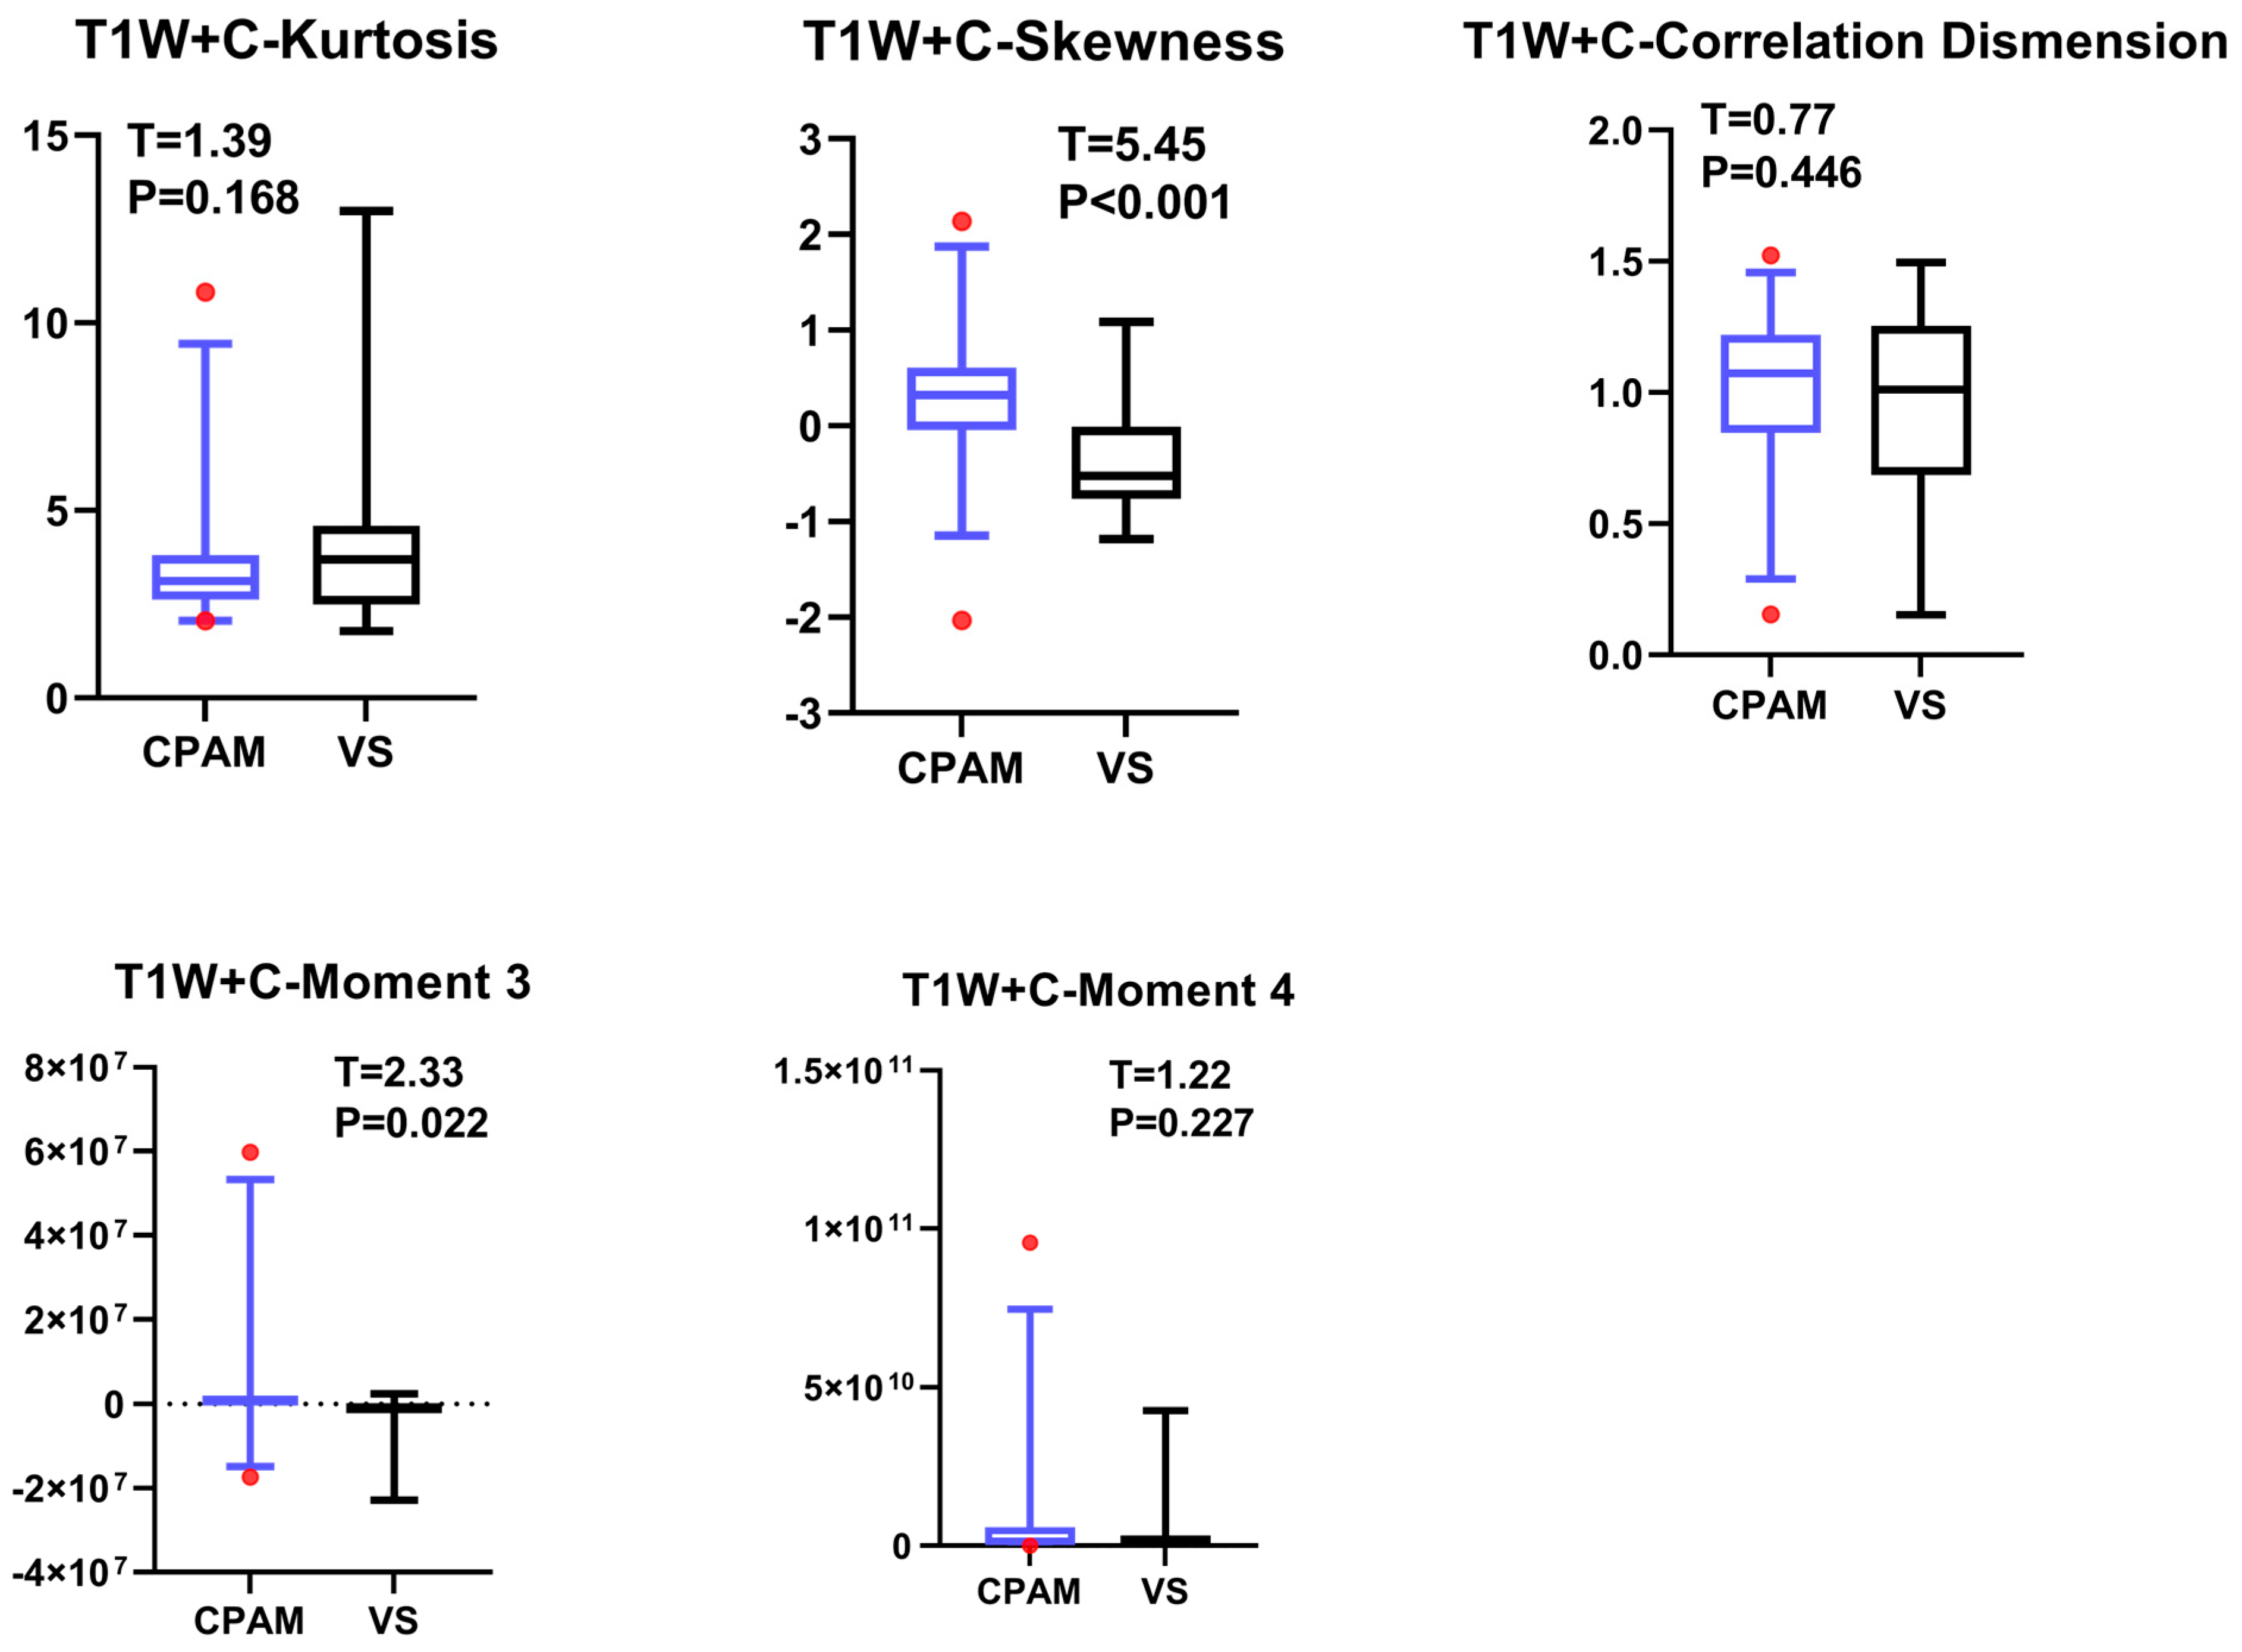
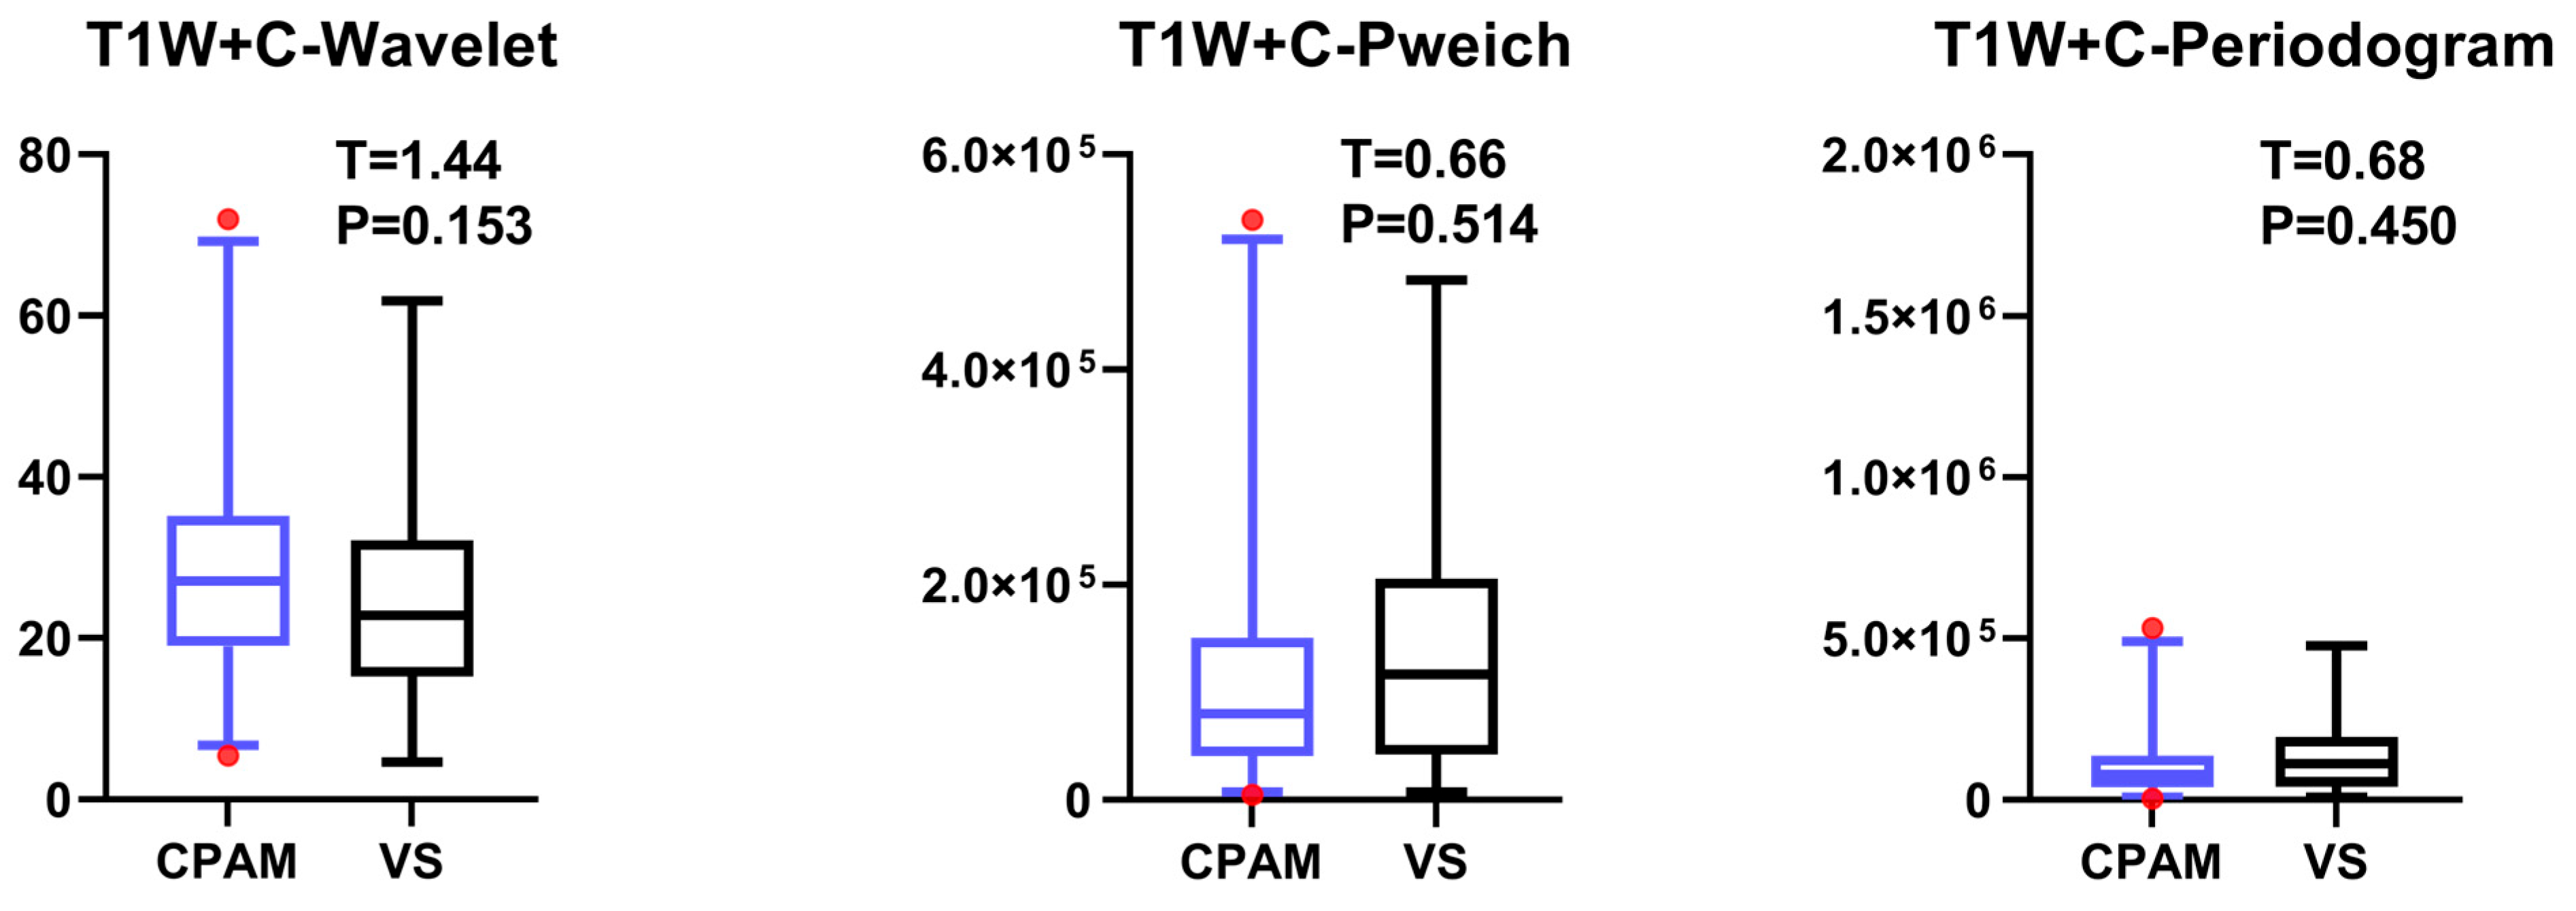
4.4. T1W + C Imaging Features of VS and CPAM in Cerebellopontine Angle
The t-test on the T1W + C sequence images shows no significant difference between the third and fourth moments, except for the failure of entropy extraction. The standard deviation and peak value for the CPAM group were markedly lower than those for the VS group. In the meantime, the CPAM group significantly outperformed the VS group in 14 other characteristics. Support vector machine (SVM) was used to group image features from the T1W + C sequence into five different groups: all imaging histograms, all first-order features, all second-order features, all third-order features, and all features that showed significant intergroup differences. Mirroring the results seen with T2W, utilizing second-order features yielded the highest classification efficiency, achieving 81.25%.
4.5. Comparison of Multimodal Sequence Texture Analysis Features Between VS and CPAM in Cerebellopontine Angle
We used the three groups of features—third-order features of the ADC image and second-order features of T1W + C and T2W images—with the highest classification efficiency among the three sequences. We then paired these features with all three sequences. For classification, we utilized three sequences of case subjects. The ADC features exhibited the best classification performance. Moreover, ROC analysis revealed that the AUC of ADC classification was significantly higher than that of T1W + C, T2W, or a combination of T1W + C and T2W. However, combining ADC features with T1W + C or T2W, or all three sequences, did not significantly enhance the classification performance compared to using ADC features alone. In fact, these combinations did not even meet the performance standard of using only ADC features.
4.6. Limitations
In our study, we compared the classification accuracy of three sequences: apparent diffusion coefficient (ADC), T1-weighted with contrast (T1W + C), and T2-weighted (T2W) as calculated by diffusion-weighted imaging (DWI). The results revealed that the DWI sequence offers significant advantages in diagnosing both vestibular schwannoma (VS) and cerebellopontine angle meningioma (CPAM). During clinical scanning, emphasizing the importance of the DWI sequence and focusing on it can enhance efficiency. Normally, magnetic resonance imaging scans for patients are time-consuming. As the number of follow-up patients increases, appointment durations extend. To improve efficiency, technicians sometimes reduce image resolution or scanning layer thickness [
30], which unfortunately can introduce unsatisfactory factors into the diagnosis. For instance, excessive thickness may lead to missing small lesions; if the thickness is set at 5 mm, lesions smaller than 5 mm might not be detected easily. Furthermore, lower image resolution also complicates the diagnostic process.
Recently, gadolinium-based contrast agents (GBCAs) have been reported to potentially deposit in the brain following repeated administration [
31]. There is currently no evidence to determine the substantial impact of this deposition on brain function [
32]. However, GBCA injections are crucial for patient safety. Allergic reactions to GBCAs are also common in clinical settings [
33]. Thus, reducing the use of invasive contrast agents in clinical practice is vital for patient safety.
Our findings indicate that diffusion-weighted imaging (DWI) offers significant advantages in diagnosing cerebellopontine angle meningiomas (CPAMs) and vestibular schwannomas (VSs). In clinical workflows, focusing on DWI scans can enhance their quality and duration, potentially shortening other sequences or, in specific cases, conducting only a single DWI sequence to fulfill clinical diagnostic needs.


 and
and 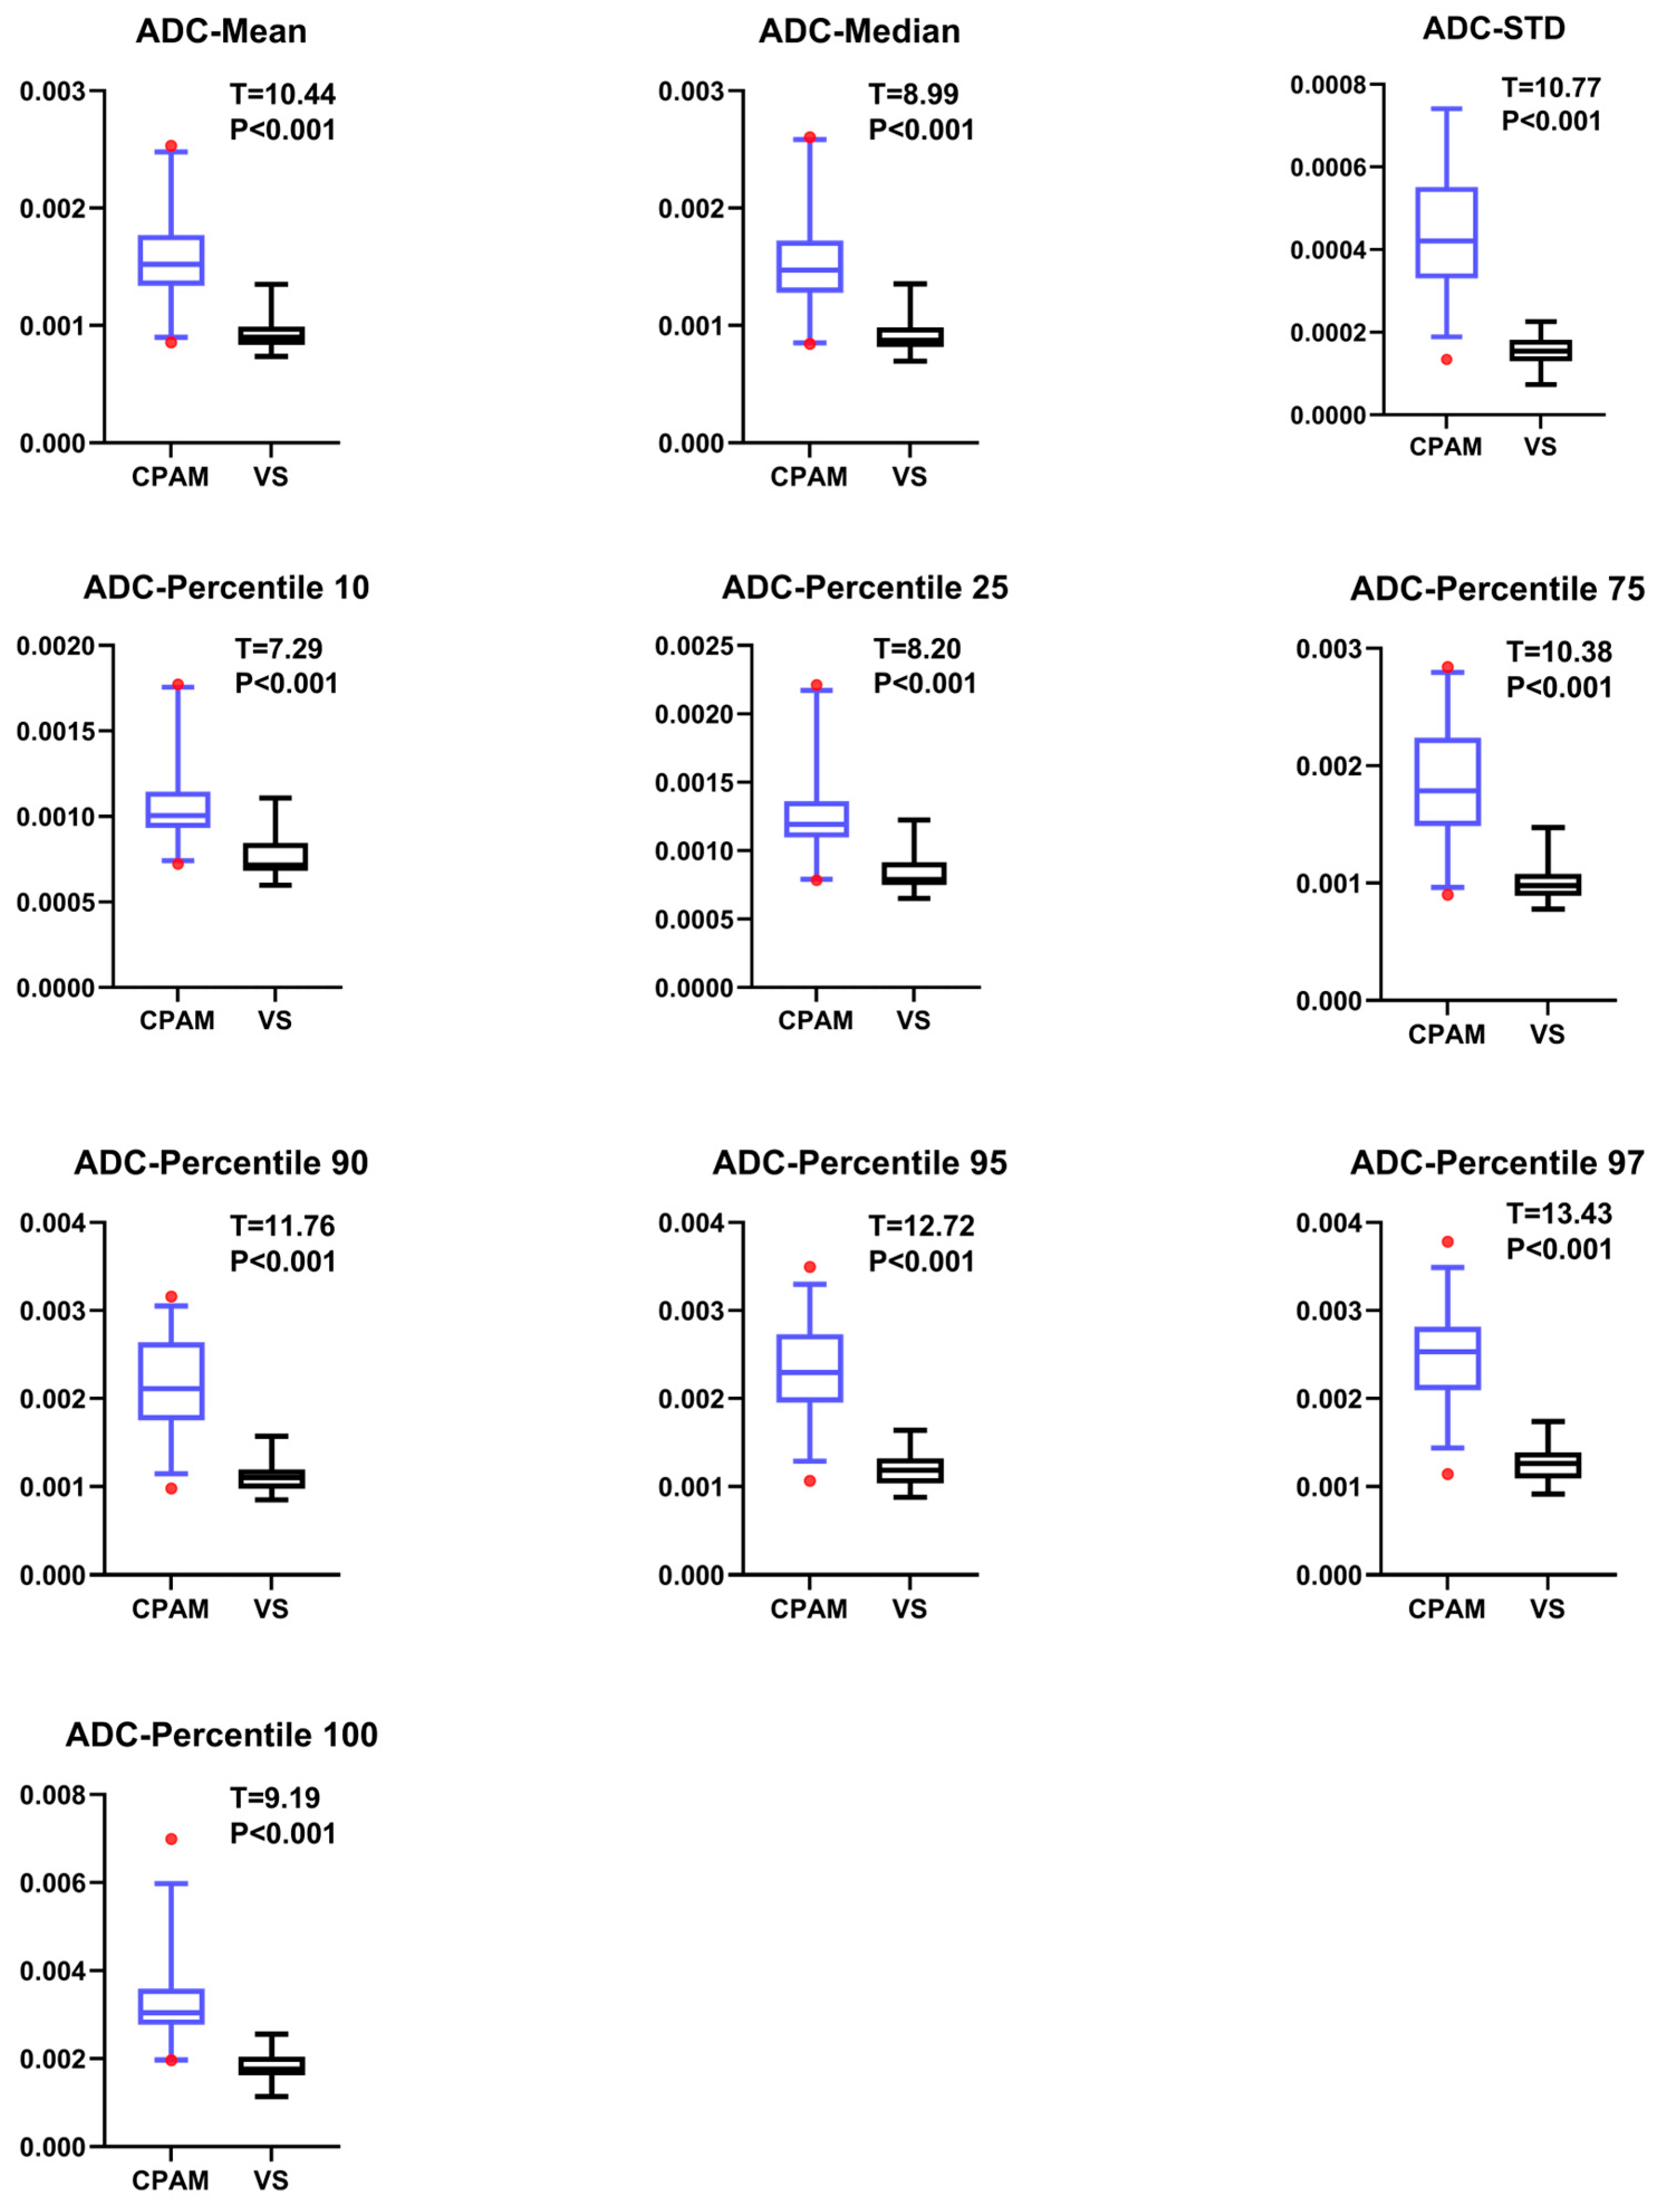

