

Automated Lightweight Model for Asthma Detection Using Respiratory and Cough Sound Signals

 , ,
, ,  , , and
Abstract
1. Introduction
2. Materials and Methods
- Audio input: The process begins by collecting audio data that capture cough or respiratory sounds. The data are input to the proposed system.
- Time–frequency transformation: Utilises STFT to generate spectrograms, facilitating time-resolved frequency analysis of audio signals [9].
- Lightweight DL feature extraction: Uses the most efficient CNN architectures such as ShuffleNet, SqueezeNet, MobileNet, and EfficientNet to extract the most relevant features from the spectrograms.
- Feature selection: Selects the most informative features to reduce the dimensionality of the data and, therefore, focuses on the classification of the best features in the relevant data [10]. ML classification: Employs classical ML algorithms (i.e., DT, SVM, NN, RF, and KNN) to classify the audio data and detect the patterns that are indicative of asthma [11].
2.1. Dataset
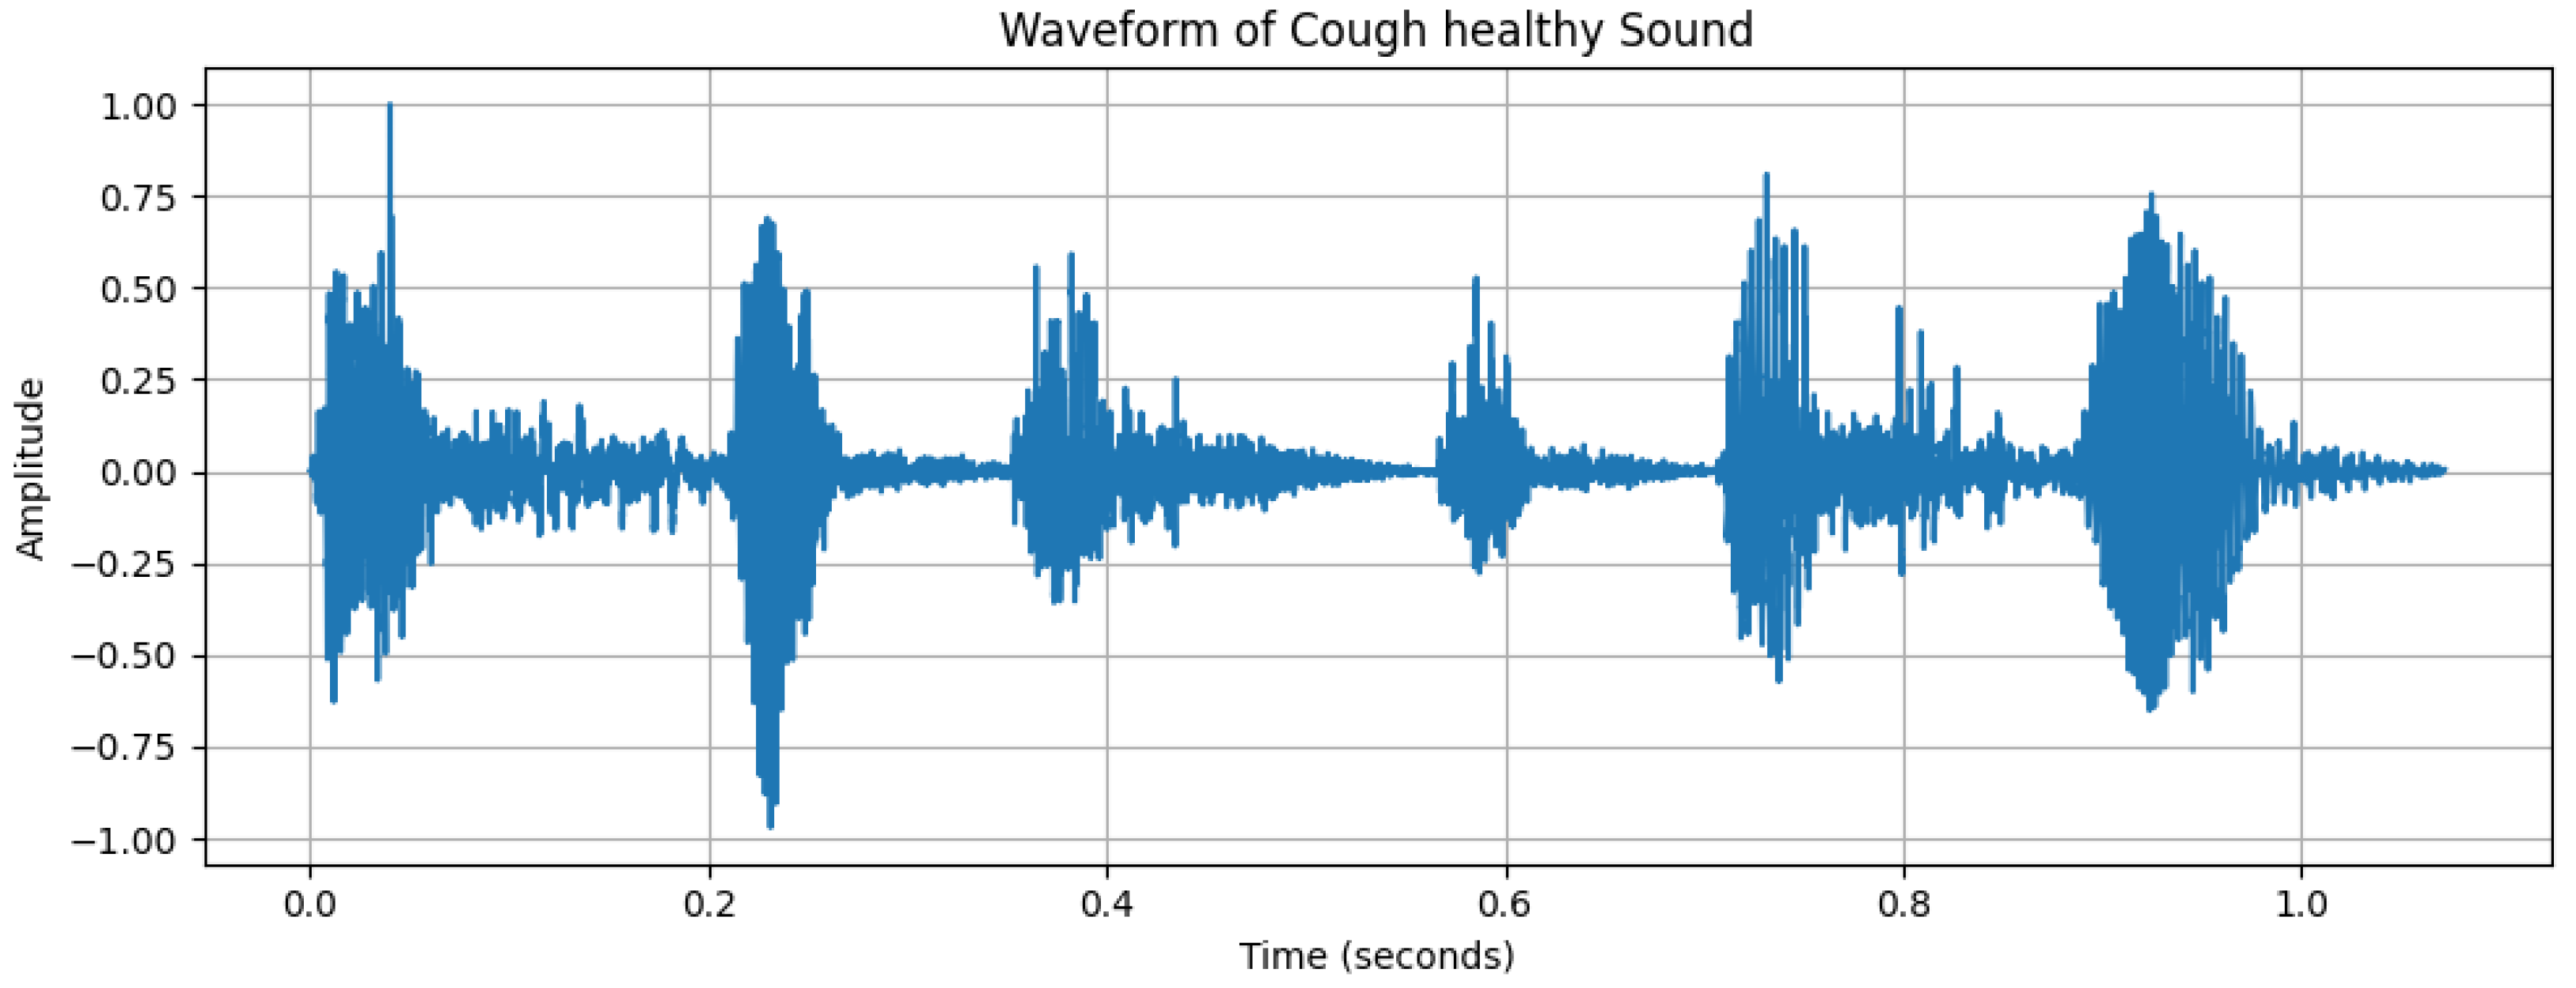
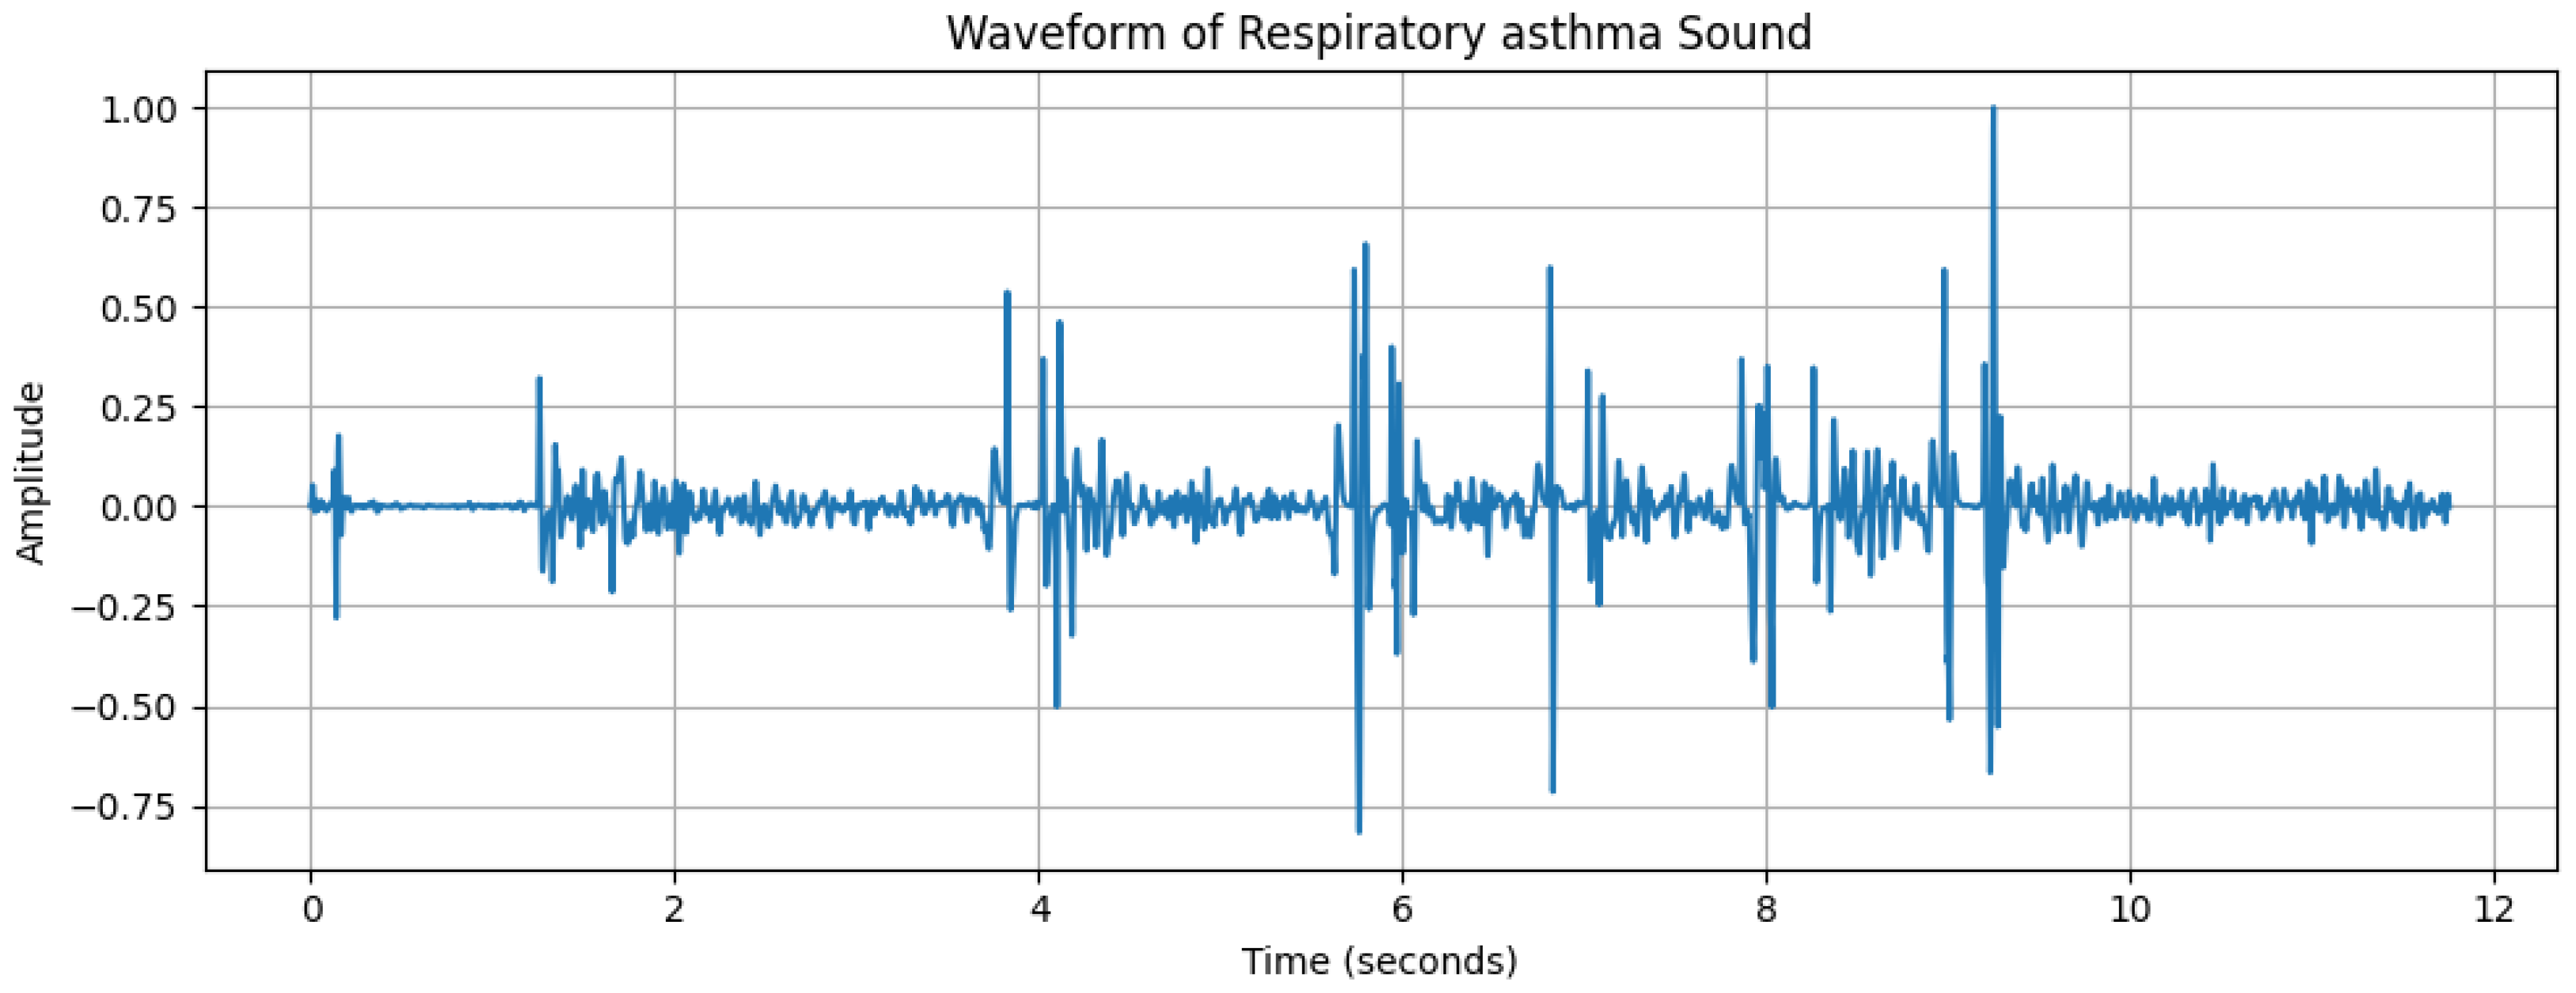
2.2. Data Analysis
2.3. Signal Transformation Approaches
2.4. Feature Extraction
- ShuffleNet is a type of neural network architecture that is ideal for devices with limited computational resources, like smartphones or other mobile devices. The data flow through channels in layers. In ShuffleNet, the data from these channels are mixed up or “shuffled”. This mixing helps ShuffleNet learn better from the data without needing more power or memory [10]. ShuffleNet organises its data channels into groups. Within these groups, it does convolutions (filtering data) that help it learn from images or other inputs. By using groups, it can do many operations at the same time, which saves time and energy.
- EfficientNet is an innovative neural network architecture that sets new benchmarks for both efficiency and ACC. EfficientNet uses compound scaling to uniformly scale the network’s depth, width, and resolution using a set of fixed scaling coefficients. This approach not only increases the depth and improves the resolution but also ensures that the foundations become wider, so everything stays in proportion and works well together [23].
- SqueezeNet is designed to be both small in size and fast in performance, while still maintaining a high level of accuracy in tasks, requiring less computational power and storage. SqueezeNet allows it to do more with fewer parameters. The architecture uses squeezed layers that reduce the number of parameters, followed by expanded layers that increase them again. The building blocks of SqueezeNet are called fire modules, which are made up of squeezed and expanded layers. These modules are designed to keep the network efficient [24].
- MobileNet is designed with a focus on mobile and embedded vision applications, providing high-performance model architectures that can run efficiently on smartphones and other devices with limited computational resources. The core ideas in MobileNet involve the use of separable convolutions [25]. It breaks down the usual complex operations into simpler, smaller operations that are easier to compute. This results in a dramatic reduction in the number of computations and the model size. The architecture is modular, which means it is made up of building blocks that can be mixed and matched to create networks that suit different needs and capacities.
2.5. Feature Selection
2.6. Classification Methods
- RF is an ensemble learning method that operates by constructing multiple decision trees during training and outputting the class that is the mode of the classes of the individual trees [29].
- SVM is a classifier that finds the optimal boundary to separate different classes by maximising the margin between support vectors, which are the data points closest to the boundary [30].
- NNs are a set of algorithms, modelled loosely after the human brain, which are designed to recognise patterns and perform tasks like classification by learning from examples [31].
- DT is a flowchart-like tree structure where an internal node represents a feature(or attribute), the branch represents a decision rule, and each leaf node represents the outcome [32]. These classifiers are trained to detect the presence of respiratory diseases by recognising patterns and signatures in the cough and respiratory sounds that are characteristic of the condition.
- KNN is a simple, instance-based learning algorithm that classifies a sample based on the majority vote of its k nearest neighbours in the feature space [33].
2.7. Parameter Tuning
- RF: Criterion: [‘gini’, ‘entropy’, ‘log_loss’]. N Estimators: [100, 200, 300] to stabilise predictions. Max Depth: [10, 20, 30, 40, 50]. Max Features: ‘sqrt’, to improve model diversity.
- SVM: C: [0.1, 1, 10, 100] to control regularisation strength. Kernel: [‘linear’, ‘poly’, ‘rbf’] for handling both linear and non-linear relationships.
- NN: Activation: [‘identity’, ‘logistic’, ‘tanh’, ‘relu’] to introduce non-linearity. Solver: [‘sgd’, ‘adam’] to explore different optimisation techniques. Hidden Layer Sizes: [(32), (64), (128), (32, 32), (64, 64), (128, 128)] for different network depths. Alpha: [0.0001, 0.001, 0.01, 0.1, 1.0] as a regularisation parameter to prevent over-fitting.
- DT: Criterion: [‘gini’, ‘entropy’, ‘log_loss’] as splitting criteria. Max Depth: [10, 20, 30, 40, 50] to control tree depth and prevent over-fitting. Min Samples Split: 10, to ensure each split has sufficient samples. Min Samples Leaf: 10, to avoid overly small leaves.
- KNN: N neighbours: [3, 5, …, 135] (odd numbers), to find the optimal number of neighbours.
2.8. Model Evaluation
- ACC: This measures the proportion of true results (both true positives and true negatives) in the total number of cases examined [34]. It is defined in Equation (4).where we have the following:
- -
- = True Positives
- -
- = True Negatives
- -
- = False Positives
- -
- = False Negatives
- Precision: This is also known as PPV; quantifies the proportion of correctly predicted positive cases among all predicted positives [34]. Mathematically, it is defined as follows:
- Recall: This is also known as sensitivity or the true positive rate; it measures the proportion of actual positives correctly identified [7]. It is defined as follows:
- F1 score: This is the harmonic mean of precision and recall, offering a balance between them [7]. It is defined as follows:
3. Results
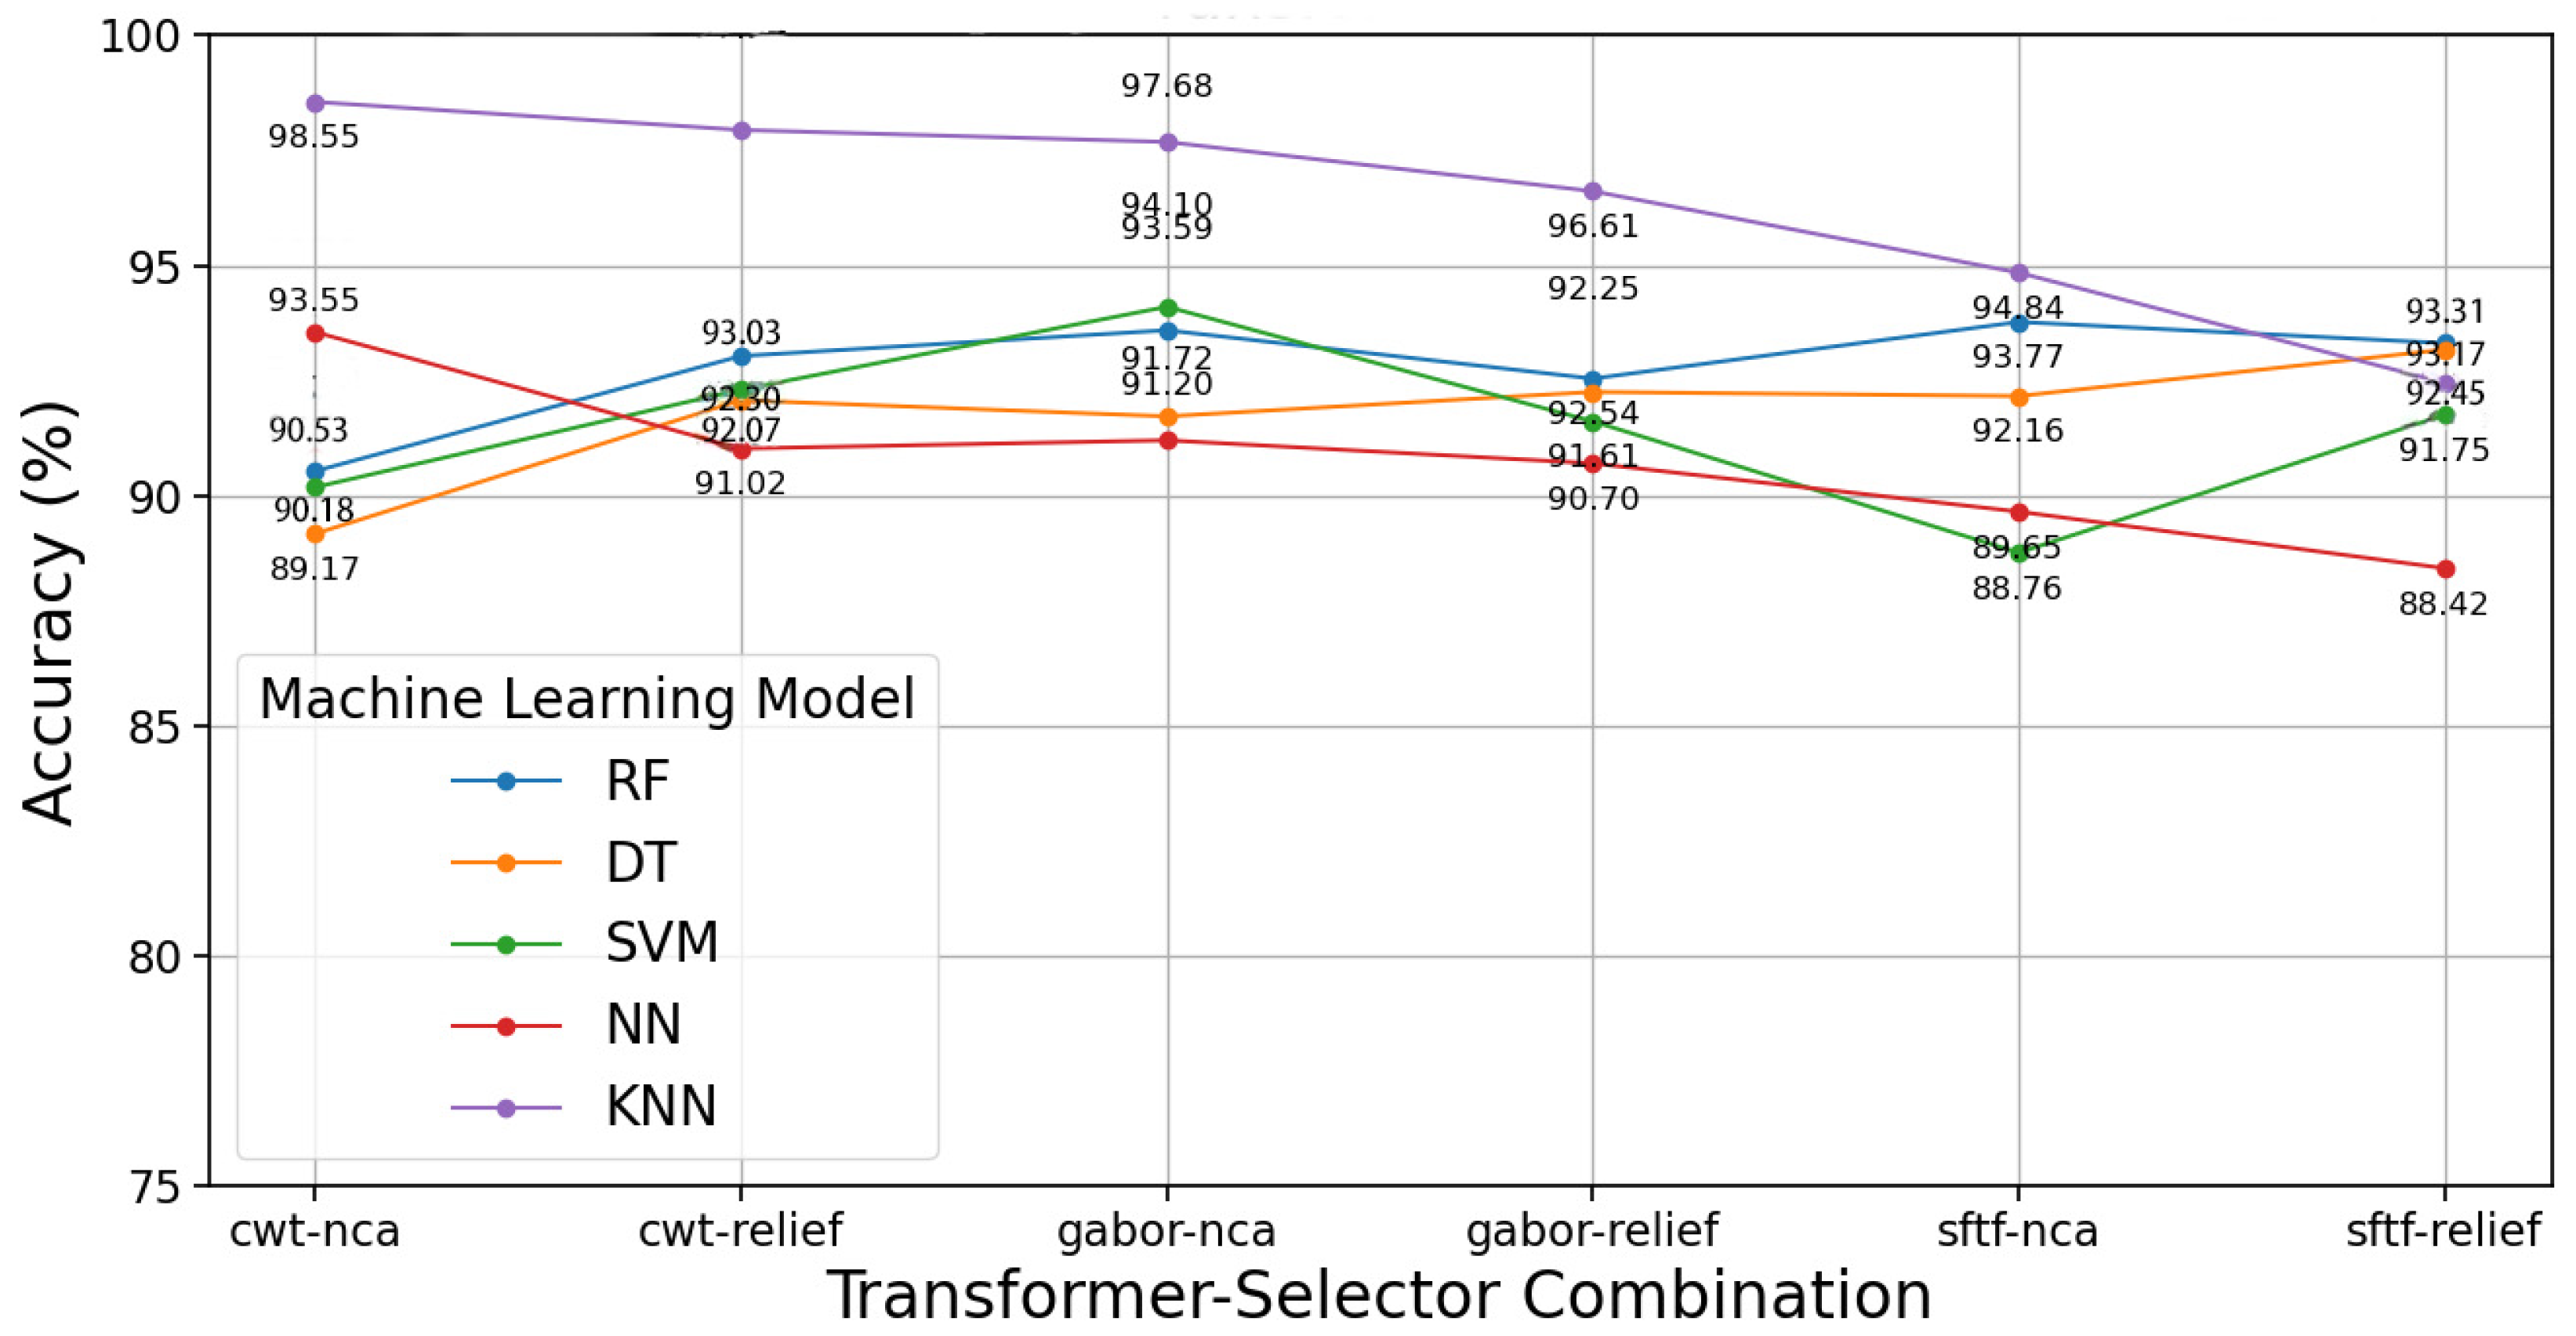
3.1. Proposed Model Results with Respiratory Sound
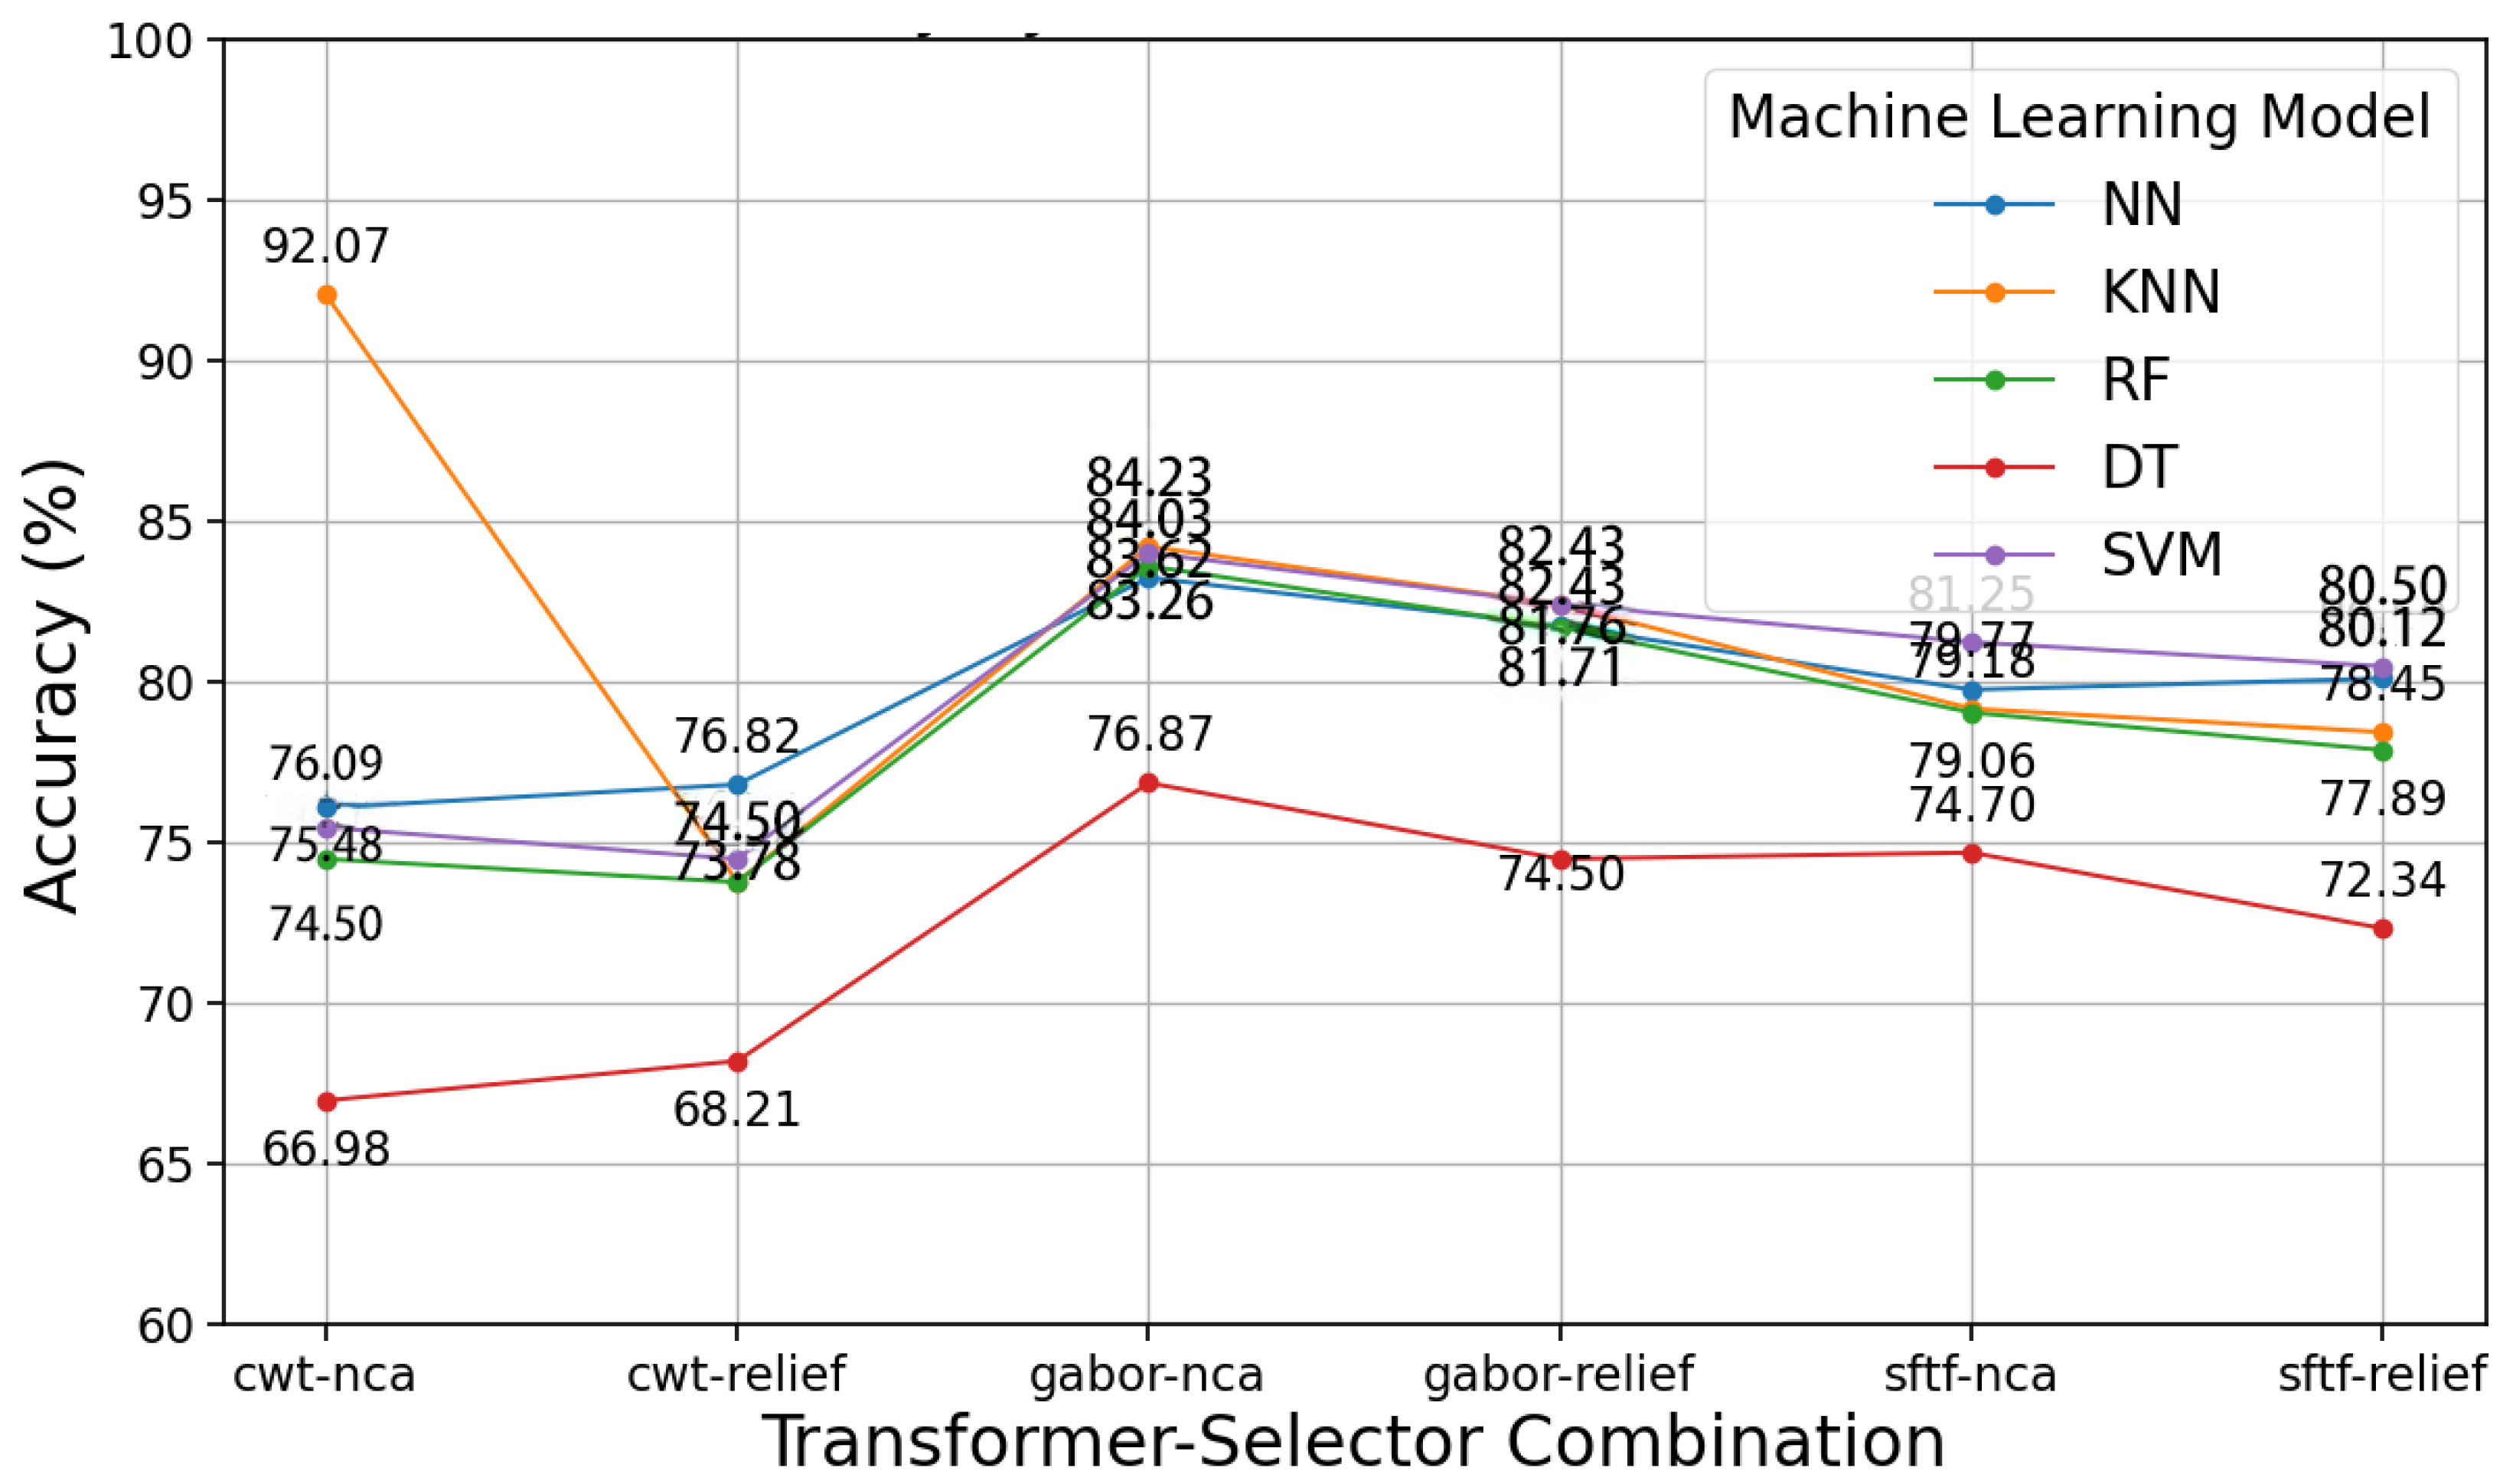
3.2. Proposed Model Results with Cough Sound
4. Discussion
4.1. Key Findings
4.2. Limitations
4.3. Future Work
5. Conclusions
Author Contributions
Funding
Institutional Review Board Statement
Informed Consent Statement
Data Availability Statement
Acknowledgments
Conflicts of Interest
Abbreviations
| 3G | International Mobile Telecommunications-2000 |
| 4G | successor to 3G |
| TRP | true positive rate |
| FRP | false positive rate |
| ACC | accuracy |
| A-V | atrioventricular |
| ACR | American College of Radiology |
| ADA | American Diabetes Association |
| ADASYN | adaptive synthetic sampling |
| AE | autoencoder |
| AED | automated external defibrillator |
| AES | advanced encryption standard |
| AFL | atrial flutter |
| AFIB | atrial fibrillation |
| AFDB | atrial fibrillation database |
| ApEn | approximate entropy |
| ALLSTAR | Allostatic State Mapping by Ambulatory ECG Repository |
| ALN | axillary lymph node |
| ALND | axillary lymph node dissection |
| ANFIS | adaptive network-based fuzzy inference system |
| ANS | autonomic nervous system |
| ANN | artificial neural network |
| ANOVA | analysis of variance |
| ANSI | American National Standards Institute |
| ANT | anterior left atrial free wall |
| AHE | adaptive histogram equalisation |
| AHI | Apnea–Hypopnea Index |
| AI | artificial intelligence |
| ASM | active shape model |
| API | application programming interface |
| AR | autoregressive |
| ARF | acoustic radiation force |
| ARMA | autoregressive moving average |
| ARMAX | autoregressive moving average with exogenous inputs |
| AT | atrial tachycardia |
| ATM | automated teller machine |
| AUC | area under the curve |
| AVN | atrioventricular node |
| ATS/ERS | American Thoracic Society/European Respiratory Society |
| QCT | quantitative CT |
| BA | Bayesian averaging |
| BCI | brain–computer interface |
| BEMD | bidimensional empirical mode decomposition |
| BERT | bidirectional encoder representations from transformers |
| MTS | Mahalanobis–Taguchi System |
| BLE | Bluetooth Low Energy |
| BMI | body mass index |
| BPA | Backpropagation Algorithm |
| BPSO | binary particle swarm optimisation |
| BPM | beats per minute |
| BSN | biomedical sensor network |
| CAD | computer-aided diagnosis |
| CaD | capacity dimension |
| CAN | cardiovascular autonomic neuropathy |
| CART | classification and regression tree |
| CD | celiac disease |
| CEUS | contrast-enhanced ultrasound |
| CI | confidence interval |
| CHF | congestive heart failure |
| CHS | community health centres |
| DL | deep learning |
| CLAHE | contrast limited adaptive histogram equalisation |
| CLDA | clustering linear discriminant analysis algorithm |
| CNN | convolutional neural network |
| CM | clustered microcalcification |
| COPD | chronic obstructive pulmonary disease |
| CSP | communicating sequential process |
| CS | compressed sampling |
| CT | computed tomography |
| CPA | communicating process architecture |
| CPC | cardiopulmonary coupling |
| CPU | central process unit |
| CSA | central sleep apnea |
| CSME | clinically significant macular oedema |
| CSR | Cambridge silicon radio |
| CVD | cardiovascular disease |
| CWT | continuous wavelet transform |
| CTA | tomographic pulmonary angiography |
| D2H2 | distributed diagnosis and home healthcare |
| DAGSVM | directed acyclic graph support vector machine |
| DB | database |
| DBN | deep belief network |
| DCN | deep convolutional network |
| DCT | discrete cosine transform |
| DET | determinism |
| DFT | discrete Fourier transform |
| DII | Diabetic Integrated Index |
| DL | deep learning |
| DLLE | diagonal line length entropy |
| DM | diabetes mellitus |
| DN | diabetic neuropathy |
| DNN | deep neural network |
| DR | diabetic retinopathy |
| DT | decision tree |
| DWT | discrete wavelet transform |
| E | external |
| E-M | expectation–maximisation |
| ECG | electrocardiogram |
| EDR | ECG-derived respiration |
| ECHONET | EchoCardiographic Healthcare Online Networking Expertise in Tasmania |
| EEG | electroencephalogram |
| ELM | extreme learning machine |
| EM | electromagnetic |
| EMD | empirical mode decomposition |
| EMG | electromyogram |
| EOG | electrooculogram |
| FAQ | frequently asked questions |
| FB | fusion beat |
| FD | fractal dimension |
| FDDI | fibre-distributed data interface |
| FEn | fuzzy entropy |
| FES | functional electrical stimulation |
| FCM | fuzzy C-means |
| EHR | electronic health record |
| FIR | finite impulse response |
| EMR | electronic medical record |
| FN | false negative |
| FNA | fine-needle aspiration |
| FNN | false nearest neighbour |
| FP | false positive |
| FSC | fuzzy Sugeno classifier |
| FT | Fourier transform |
| GA | genetic algorithm |
| GB | gradient boosting |
| GLCM | grey-level co-occurrence matrix |
| GMM | Gaussian mixture model |
| GOE | Global Observatory for eHealth |
| GPC | Gaussian process classification |
| GPRS | General Packet Radio Service |
| GPU | graphics processing unit |
| GSM | Global System for Mobile communication |
| GUI | graphical user interface |
| H | Hurst exponent |
| HDNTs | hospital digital networking technologies |
| HIHM | home-integrated health monitor |
| HIPAA | Health Insurance Portability and Accountability Act |
| HMA | haemorrhages and microaneurysms |
| HMM | hidden Markov model |
| HOG | histogram of gradient |
| HOS | higher-order spectrum |
| HP | Helicobacter Pylori |
| HR | heart rate |
| HRUS | high-resolution ultrasound |
| HRV | heart rate variability |
| HRVAS | heart rate variability analysis software |
| HSDPA | high-speed downlink packet access |
| I | internal |
| IBD | inflammatory bowel disease |
| ICA | independent component analysis |
| ICU | intensive care unit |
| IEEE | Institute of Electrical and Electronic Engineers |
| IMF | intrinsic mode function |
| IoT | Internet of Things |
| IIR | infinite impulse response |
| IR | infrared |
| IT | information technology |
| IVUS | intravascular ultrasound |
| JMMB | Journal of Mechanics in Medicine and Biology |
| KS | Kolmogorov–Sinai |
| KNN | K-nearest neighbour |
| LA | left atrium |
| LAM | laminarity |
| LBP | local binary pattern |
| LC | linear classifier |
| LCP | local configuration pattern |
| LDA | linear discriminant analysis |
| LFP | local field potential |
| LIP | left inferior pulmonary |
| LLE | largest Lyapunov exponent |
| LMNN | Levenberg–Marquardt neural network |
| LP | lamina propria |
| LR | logistic regression |
| LSP | left superior pulmonary |
| LSTM | long short-term memory |
| LTAFDB | long-term AF database |
| LTE | long-term evolution |
| LR | logistic regression |
| LRNC | lipid-rich necrotic core |
| LV | left ventricular |
| MA | moving average |
| MC | clustered microcalcifications |
| MCA | multiple correspondence analysis |
| NCSME | non-clinically significant macular oedema |
| MCT | mobile cardiac telemetry |
| MDA | multiple discriminant analysis |
| NDDF | normal density discriminant function |
| MI | myocardial infarction |
| MIL | multiple instance learning |
| ML | machine learning |
| MLP | multilayer perceptron |
| MMSE | modified multiscale entropy |
| MOH | Ministry Of Health |
| MP | mobile phone |
| MR | magnetic resonance |
| MRI | magnetic resonance imaging |
| MSE | multiscale entropy |
| MTS | multivariate time series |
| MVA | multiple variable analysis |
| NASA | National Aeronautics and Space Administration |
| NB | Naïve Bayes |
| NCA | neighbourhood component analysis |
| nB | number of beats |
| NCD | non-celiac duodenitis |
| NEB | non-ectopic beat |
| NEWS | National Early Warning Score |
| NF | neuro-fuzzy |
| NN | neural network |
| NoF | number of features |
| nP | number of patients |
| NPDR | non-proliferative diabetic retinopathy |
| NSR | normal sinus rhythm |
| OFDM | orthogonal frequency-division multiplexing |
| OSA | obstructive sleep apnea |
| PAF | paroxysmal atrial fibrillation |
| PCA | principal component analysis |
| PDR | proliferative diabetic retinopathy |
| PET | positron emission tomography |
| PET-MRI | positron emission tomography-magnetic resonance imaging |
| PFT | pulmonary function testing |
| PHC | primary health centre |
| PHOG | pyramid histogram of gradient |
| PLS-DA | partial least squares discriminant analysis |
| PNN | probabilistic neural network |
| PPG | photoplethysmogram |
| POS | posterior left atrial free wall |
| PPV | positive predictive value |
| PRE | precision |
| PRISMA | preferred reporting items for systematic reviews and meta-analyses |
| PSD | power spectral density |
| PSG | polysomnography |
| PVC | premature ventricular contraction |
| QDA | quadratic discriminant analysis |
| QoS | quality of service |
| qCT | quantified computed tomography |
| RAM | random access memory |
| RBF | radial basis function |
| RBFNN | radial basis function neural network |
| RBM | restricted Boltzmann machine |
| REC | recurrence rate |
| ReLU | rectified linear unit |
| ResNet | residual neural network |
| RF | random forest |
| RHN | regional health network |
| RIP | right inferior pulmonary |
| RNA | ribonucleic acid |
| RNN | recurrent neural network |
| ROC | receiver operating characteristic |
| ROI | region of interest |
| RQA | recurrence quantification analysis |
| RP | recurrence plot |
| RSA | respiratory sinus arrhythmia |
| RSP | right superior pulmonary |
| RTF | recurrent neural network |
| RVM | relevance vector machine |
| SWT | stationary wavelet transform |
| SA | sinoatrial |
| SAE | sparse autoencoder |
| SampEn | sample entropy |
| SAN | sinoatrial node |
| SC | statistical classifier |
| SD | standard deviation |
| SCD | sudden cardiac death |
| SDNN | standard deviation of normal-to-normal intervals |
| SEN | sensitivity |
| SE | standard error |
| SpO2 | oxygen saturation |
| ShanEn | Shannon entropy |
| SLNB | sentinel lymph node biopsy |
| SMDS | switched multi-megabit data service |
| SNN | spiking neural network |
| SOM | self-organising map |
| SPE | specificity |
| STFT | short-time Fourier transform |
| SWE | shear wave elastography |
| SWT | stationary wavelet transform |
| SQL | structured query language |
| SVEB | supraventricular ectopic beat |
| SVM | support vector machine |
| SNPs | single-nucleotide polymorphisms |
| MTS | Mahalanobis–Taguchi system |
| T | thoracic |
| TIA | transient ischaemic attack |
| TEE | transesophageal echocardiogram |
| TN | true negative |
| TP | true positive |
| TT | trapping time |
| TTE | transthoracic echocardiography |
| TVCF | time-varying coherence function |
| UB | unclassified beat |
| UIT | urinary tract infection |
| ULP | ultra-low power |
| UMMC | University Malaya Medical Centre |
| UMTS | Universal Mobile Telecommunications System |
| US | ultrasound |
| USG | ultrasonography |
| UWB | ultra-wideband |
| xAI | explainable AI |
| VDSNet | VGG data STN with CNN |
| VEB | ventricular ectopic beat |
| VF | ventricular fibrillation |
| VFL | ventricular flutter |
| VT | ventricular tachycardia |
| WBAN | wireless body area network |
| WEP | wired equivalent privacy |
| WHO | World Health Organization |
| WiMAX | Worldwide Interoperability for Microwave Access |
| WLAN | wireless local area network |
| WMAN | wireless metropolitan area network |
| WPA | Wi-Fi-protected access |
| WPAN | wireless personal area network |
| WPD | wavelet packet decomposition |
| WWAN | wireless wide area network |
Appendix A. Pseudocode

References
- Alzghoul, B.N.; Reddy, R.; Chizinga, M.; Innabi, A.; Zou, B.; Papierniak, E.S.; Faruqi, I. Pulmonary embolism in acute asthma exacerbation: Clinical characteristics, prediction model and hospital outcomes. Lung 2020, 198, 661–669. [Google Scholar] [CrossRef] [PubMed]
- Lanclus, M.; Clukers, J.; Van Holsbeke, C.; Vos, W.; Leemans, G.; Holbrechts, B.; Barboza, K.; De Backer, W.; De Backer, J. Machine learning algorithms utilizing functional respiratory imaging may predict COPD exacerbations. Acad. Radiol. 2019, 26, 1191–1199. [Google Scholar] [CrossRef] [PubMed]
- Abadi, M. TensorFlow: Learning functions at scale. In Proceedings of the 21st ACM SIGPLAN International Conference on Functional Programming, Nara, Japan, 18–24 September 2016; p. 1. [Google Scholar]
- Chen, M.; Yu, L.; Zhi, C.; Sun, R.; Zhu, S.; Gao, Z.; Ke, Z.; Zhu, M.; Zhang, Y. Improved faster R-CNN for fabric defect detection based on Gabor filter with Genetic Algorithm optimization. Comput. Ind. 2022, 134, 103551. [Google Scholar] [CrossRef]
- Lin, S.; Zhang, Q.; Chen, F.; Luo, L.; Chen, L.; Zhang, W. Smooth Bayesian network model for the prediction of future high-cost patients with COPD. Int. J. Med. Inform. 2019, 126, 147–155. [Google Scholar] [CrossRef] [PubMed]
- Barua, P.D.; Keles, T.; Kuluozturk, M.; Kobat, M.A.; Dogan, S.; Baygin, M.; Tuncer, T.; Tan, R.S.; Acharya, U.R. Automated asthma detection in a 1326-subject cohort using a one-dimensional attractive-and-repulsive center-symmetric local binary pattern technique with cough sounds. Neural Comput. Appl. 2024, 36, 16857–16871. [Google Scholar] [CrossRef]
- Lee, C.S.; Parise, C.; Burleson, J.; Seidenwurm, D. Assessing the recall rate for screening mammography: Comparing the medicare hospital compare dataset with the national mammography database. Am. J. Roentgenol. 2018, 211, 127–132. [Google Scholar] [CrossRef]
- Peng, J.; Chen, C.; Zhou, M.; Xie, X.; Zhou, Y.; Luo, C.H. A machine-learning approach to forecast aggravation risk in patients with acute exacerbation of chronic obstructive pulmonary disease with clinical indicators. Sci. Rep. 2020, 10, 1–9. [Google Scholar] [CrossRef]
- Wang, W.; Zhang, G.; Yang, L.; Balaji, V.; Elamaran, V.; Arunkumar, N. Revisiting signal processing with spectrogram analysis on EEG, ECG and speech signals. Future Gener. Comput. Syst. 2019, 98, 227–232. [Google Scholar] [CrossRef]
- Zhang, X.; Zhou, X.; Lin, M.; Sun, J. Shufflenet: An extremely efficient convolutional neural network for mobile devices. In Proceedings of the IEEE Conference on Computer Vision and Pattern Recognition, Salt Lake City, UT, USA, 18–22 June 2018; pp. 6848–6856. [Google Scholar]
- Amin, H.U.; Malik, A.S.; Ahmad, R.F.; Badruddin, N.; Kamel, N.; Hussain, M.; Chooi, W.T. Feature extraction and classification for EEG signals using wavelet transform and machine learning techniques. Australas. Phys. Eng. Sci. Med. 2015, 38, 139–149. [Google Scholar] [CrossRef]
- Binson, V.A.; Subramoniam, M.; Mathew, L. Detection of COPD and Lung Cancer with electronic nose using ensemble learning methods. Clin. Chim. Acta 2021, 523, 231–238. [Google Scholar]
- Giannakopoulos, T.; Pikrakis, A. Introduction to Audio Analysis: A MATLAB® Approach; Academic Press: Cambridge, MA, USA, 2014. [Google Scholar]
- Purwins, H.; Li, B.; Virtanen, T.; Schlüter, J.; Chang, S.Y.; Sainath, T. Deep learning for audio signal processing. IEEE J. Sel. Top. Signal Process. 2019, 13, 206–219. [Google Scholar] [CrossRef]
- Goto, T.; Jo, T.; Matsui, H.; Fushimi, K.; Hayashi, H.; Yasunaga, H. Machine learning-based prediction models for 30-day readmission after hospitalization for chronic obstructive pulmonary disease. COPD J. Chronic Obstr. Pulm. Dis. 2019, 16, 338–343. [Google Scholar] [CrossRef] [PubMed]
- Burriel-Valencia, J.; Puche-Panadero, R.; Martinez-Roman, J.; Sapena-Bano, A.; Pineda-Sanchez, M. Short-frequency Fourier transform for fault diagnosis of induction machines working in transient regime. IEEE Trans. Instrum. Meas. 2017, 66, 432–440. [Google Scholar] [CrossRef]
- Mateo, C.; Talavera, J.A. Short-time Fourier transform with the window size fixed in the frequency domain. Digit. Signal Process. 2018, 77, 13–21. [Google Scholar] [CrossRef]
- Dinh, P.H. Combining gabor energy with equilibrium optimizer algorithm for multi-modality medical image fusion. Biomed. Signal Process. Control 2021, 68, 102696. [Google Scholar] [CrossRef]
- Aguiar-Conraria, L.; Soares, M.J. The continuous wavelet transform: Moving beyond uni-and bivariate analysis. J. Econ. Surv. 2014, 28, 344–375. [Google Scholar] [CrossRef]
- Tan, M.; Le, Q. Efficientnet: Rethinking model scaling for convolutional neural networks. In Proceedings of the International Conference on Machine Learning. PMLR, Long Beach, CA, USA, 9–15 June2019; pp. 6105–6114. [Google Scholar]
- Iandola, F.N. SqueezeNet: AlexNet-level accuracy with 50x fewer parameters and <0.5 MB model size. arXiv 2016, arXiv:1602.07360. [Google Scholar]
- Howard, A.G. Mobilenets: Efficient convolutional neural networks for mobile vision applications. arXiv 2017, arXiv:1704.04861. [Google Scholar]
- Koonce, B.; Koonce, B. EfficientNet. In Convolutional Neural Networks with Swift for Tensorflow: Image Recognition and Dataset Categorization; Springer: Berlin/Heidelberg, Germany, 2021; pp. 109–123. [Google Scholar]
- Koonce, B.; Koonce, B. SqueezeNet. In Convolutional Neural Networks with Swift for Tensorflow: Image Recognition and Dataset Categorization; Springer: Berlin/Heidelberg, Germany, 2021; pp. 73–85. [Google Scholar]
- Sinha, D.; El-Sharkawy, M. Thin mobilenet: An enhanced mobilenet architecture. In Proceedings of the 2019 IEEE 10th Annual Ubiquitous Computing, Electronics & Mobile Communication Conference (UEMCON), New York, NY, USA, 10–12 October 2019; pp. 280–285. [Google Scholar]
- Petmezas, G.; Cheimariotis, G.A.; Stefanopoulos, L.; Rocha, B.; Paiva, R.P.; Katsaggelos, A.K.; Maglaveras, N. Automated Lung Sound Classification Using a Hybrid CNN-LSTM Network and Focal Loss Function. Sensors 2022, 22, 1232. [Google Scholar] [CrossRef]
- Urbanowicz, R.J.; Meeker, M.; La Cava, W.; Olson, R.S.; Moore, J.H. Relief-based feature selection: Introduction and review. J. Biomed. Inform. 2018, 85, 189–203. [Google Scholar] [CrossRef]
- Amankwaa-Kyeremeh, B.; Greet, C.; Zanin, M.; Skinner, W.; Asamoah, R. Selecting key predictor parameters for regression analysis using modified Neighbourhood Component Analysis (NCA) Algorithm. In Proceedings of the 6th UMaT Biennial International Mining and Mineral Conference, Tarkwa, Ghana, 5–6 August 2020; pp. 320–325. [Google Scholar]
- Rigatti, S.J. Random forest. J. Insur. Med. 2017, 47, 31–39. [Google Scholar] [CrossRef]
- Binson, V.; Subramoniam, M.; Sunny, Y.; Mathew, L. Prediction of pulmonary diseases with electronic nose using SVM and XGBoost. IEEE Sens. J. 2021, 21, 20886–20895. [Google Scholar] [CrossRef]
- Abiyev, R.H.; Ma’aitaH, M.K.S. Deep convolutional neural networks for chest diseases detection. J. Healthc. Eng. 2018, 2018. [Google Scholar] [CrossRef]
- Rai, K.; Devi, M.S.; Guleria, A. Decision tree based algorithm for intrusion detection. Int. J. Adv. Netw. Appl. 2016, 7, 2828. [Google Scholar]
- Zhang, S.; Cheng, D.; Deng, Z.; Zong, M.; Deng, X. A novel kNN algorithm with data-driven k parameter computation. Pattern Recognit. Lett. 2018, 109, 44–54. [Google Scholar] [CrossRef]
- Faust, O.; Barika, R.; Shenfield, A.; Ciaccio, E.J.; Acharya, U.R. Accurate detection of sleep apnea with long short-term memory network based on RR interval signals. Knowl.-Based Syst. 2021, 212, 106591. [Google Scholar] [CrossRef]
- Nahm, F.S. Receiver operating characteristic curve: Overview and practical use for clinicians. Korean J. Anesthesiol. 2022, 75, 25–36. [Google Scholar] [CrossRef]
- De Hond, A.A.; Steyerberg, E.W.; Van Calster, B. Interpreting area under the receiver operating characteristic curve. Lancet Digit. Health 2022, 4, e853–e855. [Google Scholar] [CrossRef]
- Xu, S.; Deo, R.C.; Soar, J.; Barua, P.D.; Faust, O.; Homaira, N.; Jaffe, A.; Kabir, A.L.; Acharya, U.R. Automated detection of airflow obstructive diseases: A systematic review of the last decade (2013–2022). Comput. Methods Programs Biomed. 2023, 241, 107746. [Google Scholar] [CrossRef]
- Haider, N.S.; Singh, B.K.; Periyasamy, R.; Behera, A.K. Respiratory sound based classification of chronic obstructive pulmonary disease: A risk stratification approach in machine learning paradigm. J. Med. Syst. 2019, 43, 1–13. [Google Scholar] [CrossRef]
- Nabi, F.G.; Sundaraj, K.; Lam, C.K.; Palaniappan, R. Characterization and classification of asthmatic wheeze sounds according to severity level using spectral integrated features. Comput. Biol. Med. 2019, 104, 52–61. [Google Scholar] [CrossRef] [PubMed]
- Infante, C.; Chamberlain, D.B.; Kodgule, R.; Fletcher, R.R. Classification of voluntary coughs applied to the screening of respiratory disease. In Proceedings of the 2017 39th Annual International Conference of the IEEE Engineering in Medicine and Biology Society (EMBC), Jeju, Republic of Korea, 11–15 July 2017; pp. 1413–1416. [Google Scholar]
- Balamurali, B.; Hee, H.I.; Kapoor, S.; Teoh, O.H.; Teng, S.S.; Lee, K.P.; Herremans, D.; Chen, J.M. Deep neural network-based respiratory pathology classification using cough sounds. Sensors 2021, 21, 5555. [Google Scholar] [CrossRef] [PubMed]
- Xi, J.; Zhao, W.; Yuan, J.E.; Kim, J.; Si, X.; Xu, X. Detecting lung diseases from exhaled aerosols: Non-invasive lung diagnosis using fractal analysis and SVM classification. PLoS ONE 2015, 10, e0139511. [Google Scholar] [CrossRef] [PubMed]
- Schroeder, J.D.; Lanfredi, R.B.; Li, T.; Chan, J.; Vachet, C.; Paine III, R.; Srikumar, V.; Tasdizen, T. Prediction of obstructive lung disease from chest radiographs via deep learning trained on pulmonary function data. Int. J. Chronic Obstr. Pulm. Dis. 2020, 15, 3455. [Google Scholar] [CrossRef]
- Ullah, R.; Khan, S.; Ali, H.; Chaudhary, I.I.; Bilal, M.; Ahmad, I. A comparative study of machine learning classifiers for risk prediction of asthma disease. Photodiagnosis Photodyn. Ther. 2019, 28, 292–296. [Google Scholar] [CrossRef]
- Luo, G.; Stone, B.L.; Fassl, B.; Maloney, C.G.; Gesteland, P.H.; Yerram, S.R.; Nkoy, F.L. Predicting asthma control deterioration in children. BMC Med. Inform. Decis. Mak. 2015, 15, 1–8. [Google Scholar] [CrossRef]
- Kor, C.T.; Li, Y.R.; Lin, P.R.; Lin, S.H.; Wang, B.Y.; Lin, C.H. Explainable Machine Learning Model for Predicting First-Time Acute Exacerbation in Patients with Chronic Obstructive Pulmonary Disease. J. Pers. Med. 2022, 12, 228. [Google Scholar] [CrossRef]


| Characteristics | Details |
|---|---|
| Duration | Duration of each audio file used to determine the range, the average, and the distribution of data length |
| File size | Assessing the file size to determine the dataset storage requirements |
| Sampling rate | The number of snapshots taken to recreate the original sound wave |
| Bit depth | The number of amplitude values in each snapshot to determine the audio resolution with the sampling rate |
| Metrics | Cough-Cough | Cough-Control | Resp-Asthma | Resp-Control |
|---|---|---|---|---|
| Avg duration (s) | 1.77 | 1.60 | 17.07 | 29.93 |
| Avg size (kB) | 174 | 162 | 136 | 239 |
| Sampling rate (Hz) | 48,000 | 48,000 | 4000 | 4000 |
| Bit depth | 16 | 16 | 16 | 16 |
| Transformation | Feature Extractor | Feature Selector | Classifier |
|---|---|---|---|
| Gabor | ShuffleNet | Relief | SVM |
| ShuffleNet+SqueezeNet | |||
| ShuffleNet+MobileNet | |||
| ShuffleNet+EfficientNet | RF | ||
| ShuffleNet+SqueezeNet+ MobileNet | |||
| CWT | ShuffleNet+SqueezeNet+EfficientNet | ||
| SqueezeNet“2” | DT | ||
| SqueezeNet+MobileNet | NCA | ||
| SqueezeNet+EfficientNet | |||
| SqueezeNet+MobileNet+EfficientNet | NN | ||
| STFT | ShuffleNet+MobileNet+EfficientNet “134” | ||
| MobileNet | |||
| MobileNet+EfficientNet | KNN | ||
| EfficientNet | |||
| All Nets |
| Transform | EXT | SEL | Model | ACC | Parameter | F1 | Precision | Recall | AUC |
|---|---|---|---|---|---|---|---|---|---|
| Gabor | 124 | NCA | KNN | 98.55 | n_neighbour = 3 | 66.46 | 63.43 | 57.30 | 69.86 |
| Gabor | 1234 | NCA | KNN | 97.12 | n_neighbour = 3 | 66.05 | 64.04 | 65.30 | 67.28 |
| Gabor | 12 | NCA | KNN | 97.10 | n_neighbour = 3 | 58.45 | 53.94 | 70.56 | 60.09 |
| CWT | 12 | Relief | KNN | 96.02 | n_neighbour = 3 | 61.93 | 57.13 | 72.86 | 61.66 |
| CWT | 13 | Relief | KNN | 94.52 | n_neighbour = 3 | 59.13 | 58.41 | 64.17 | 63.13 |
| Gabor | 34 | NCA | SVM | 94.12 | C = 1/kernel linear | 82.11 | 83.36 | 77.73 | 85.54 |
| Gabor | 23 | NCA | SVM | 94.10 | C = 100/kernel RBF | 74.73 | 73.11 | 75.69 | 77.69 |
| Gabor | 24 | NCA | SVM | 94.05 | C = 100/kernel poly | 92.49 | 91.04 | 91.85 | 93.06 |
| Model | Accuracy (95% CI) | Precision (95% CI) | Recall (95% CI) | F1 Score (95% CI) |
|---|---|---|---|---|
| SVM | 94.05 ± 1.2% | 93.8 ± 1.3% | 93.6 ± 1.2% | 93.7 ± 1.2% |
| Random Forest | 92.70 ± 1.4% | 92.5 ± 1.5% | 92.3 ± 1.4% | 92.4 ± 1.3% |
| KNN | 91.80 ± 1.6% | 91.5 ± 1.5% | 91.2 ± 1.6% | 91.4 ± 1.5% |
| Decision Tree | 89.50 ± 1.9% | 89.3 ± 1.8% | 89.0 ± 1.9% | 89.1 ± 1.8% |
| Neural Network | 93.10 ± 1.3% | 92.9 ± 1.3% | 92.7 ± 1.2% | 92.8 ± 1.3% |
| Transformation-Feature Selection | Average ACC (%) | Highest ACC (%) |
|---|---|---|
| CWT-NCA | 74.65 | 79.74 |
| CWT-Relief | 69.82 | 71.94 |
| Gabor-NCA | 80.79 | 80.95 |
| Gabor-Relief | 80.18 | 80.68 |
| STFT-NCA | 73.63 | 74.84 |
| STFT-Relief | 71.64 | 74.15 |
| Transform | EXT | SEL | Model | ACC | Parameter | F1 | Precision | Recall | AUC |
|---|---|---|---|---|---|---|---|---|---|
| CWT | NCA | 134 | KNN | 85.76 | n_neighbour = 3 | 30.45 | 51.98 | 26.92 | 54.86 |
| CWT | NCA | 23 | KNN | 88.60 | n_neighbour = 3 | 43.09 | 54.98 | 40.34 | 57.26 |
| CWT | NCA | 123 | KNN | 89.62 | n_neighbour = 3 | 42.32 | 54.51 | 38.73 | 57.76 |
| CWT | NCA | 124 | KNN | 90.12 | n_neighbour = 3 | 48.81 | 58.81 | 45.04 | 63.87 |
| CWT | NCA | 24 | KNN | 90.12 | n_neighbour = 3 | 32.69 | 54.12 | 30.24 | 56.99 |
| CWT | NCA | 34 | KNN | 91.12 | n_neighbour = 3 | 48.45 | 56.82 | 47.06 | 60.83 |
| STFT | Relief | 34 | KNN | 92.07 | n_neighbour = 3 | 59.81 | 59.82 | 62.85 | 65.77 |
| Gabor | NCA | 24 | SVM | 83.31 | C = 10, kernel = rbf | 80.07 | 75.93 | 80.41 | 75.90 |
| Gabor | NCA | 2 | SVM | 84.03 | C = 10, | ||||
| kernel = rbf | 79.84 | 76.66 | 78.57 | 76.63 | |||||
| Gabor | NCA | 124 | SVM | 84.03 | C = 10, | ||||
| kernel = rbf | 80.23 | 76.85 | 79.13 | 76.97 |
| Model | Accuracy (95% CI) | Precision (95% CI) | Recall (95% CI) | F1 Score (95% CI) |
|---|---|---|---|---|
| SVM | 83.31 ± 1.5% | 83.0 ± 1.6% | 82.8 ± 1.5% | 82.9 ± 1.4% |
| Random Forest | 82.10 ± 1.6% | 81.8 ± 1.5% | 81.5 ± 1.6% | 81.6 ± 1.5% |
| KNN | 81.05 ± 1.8% | 80.7 ± 1.7% | 80.5 ± 1.8% | 80.6 ± 1.7% |
| Decision Tree | 79.50 ± 2.0% | 79.1 ± 1.9% | 78.8 ± 2.0% | 78.9 ± 1.9% |
| Neural Network | 82.75 ± 1.4% | 82.4 ± 1.5% | 82.2 ± 1.4% | 82.3 ± 1.4% |
| Author, | Subtype | Classifier | Performance | Data | Data Size | |
|---|---|---|---|---|---|---|
| Year | Type | Algo. | ||||
| Balamurali et al. 2019 [41] | Cough sound | DL | DNN | ACC = 91.2% | Private | 51 subjects |
| Infante et al. 2017 [40] | Cough sound | ML | LR | AUC = 94 | Private | 54 patients |
| Xu et al. 2024 [37] | Cough sound | ML | SVM | ACC = 83.31% | Private | 1943 cough sounds |
| Haider et al. 2019 [38] | Respiratory sounds | ML | SVM | AUC = 83.6 | Private | 30 COPD; 25 healthy subjects |
| Nabi et al. 2019 [39] | Respiratory sounds | ML | ensemble | AUC = 83.6 | Private | 55 asthmatic patients |
| Xu et al. 2024 [37] | Respiratory sounds | ML | SVM | ACC = 94.05% | Private | 205 respiratory sounds |
| Proposed work | Cough sounds | Hybrid model for Normal vs. asthma | Feature extractor: Gabor-lightweight model Classifier: SVM | ACC = 83.31% | Private | 1326 participants (511 asthma, 815 healthy) 1943 cough segments (511 asthma, 815 healthy) |
| Respiratory sounds | ACC = 94.05% | |||||
Disclaimer/Publisher’s Note: The statements, opinions and data contained in all publications are solely those of the individual author(s) and contributor(s) and not of MDPI and/or the editor(s). MDPI and/or the editor(s) disclaim responsibility for any injury to people or property resulting from any ideas, methods, instructions or products referred to in the content. |
© 2025 by the authors. Licensee MDPI, Basel, Switzerland. This article is an open access article distributed under the terms and conditions of the Creative Commons Attribution (CC BY) license (https://creativecommons.org/licenses/by/4.0/).
Share and Cite
Xu, S.; Deo, R.C.; Faust, O.; Barua, P.D.; Soar, J.; Acharya, R. Automated Lightweight Model for Asthma Detection Using Respiratory and Cough Sound Signals. Diagnostics 2025, 15, 1155. https://doi.org/10.3390/diagnostics15091155
Xu S, Deo RC, Faust O, Barua PD, Soar J, Acharya R. Automated Lightweight Model for Asthma Detection Using Respiratory and Cough Sound Signals. Diagnostics. 2025; 15(9):1155. https://doi.org/10.3390/diagnostics15091155
Chicago/Turabian StyleXu, Shuting, Ravinesh C. Deo, Oliver Faust, Prabal D. Barua, Jeffrey Soar, and Rajendra Acharya. 2025. "Automated Lightweight Model for Asthma Detection Using Respiratory and Cough Sound Signals" Diagnostics 15, no. 9: 1155. https://doi.org/10.3390/diagnostics15091155
APA StyleXu, S., Deo, R. C., Faust, O., Barua, P. D., Soar, J., & Acharya, R. (2025). Automated Lightweight Model for Asthma Detection Using Respiratory and Cough Sound Signals. Diagnostics, 15(9), 1155. https://doi.org/10.3390/diagnostics15091155