
Equation Built by Multiple Adaptive Regression Spline to Estimate Biological Age in Healthy Postmenopausal Women in Taiwan

 ,
,  , ,
, ,
Abstract
1. Introduction
2. Materials and Methods
2.1. Participant and Study Design
2.2. Machine Learning Method
3. Results
4. Discussion
5. Conclusions
Author Contributions
Funding
Institutional Review Board Statement
Informed Consent Statement
Data Availability Statement
Acknowledgments
Conflicts of Interest
References
- Yin, D.; Chen, K. The essential mechanisms of aging: Irreparable damage accumulation of biochemical side-reactions. Exp. Gerontol. 2005, 40, 455–465. [Google Scholar] [CrossRef] [PubMed]
- Hollingsworth, J.W.; Hashizume, A.; Jablon, S. Correlations between tests of aging in Hiroshima subjects—An attempt to define ”physiologic age”. Yale J. Biol. Med. 1965, 38, 11–26. [Google Scholar]
- Comfort, A. Test-battery to measure ageing-rate in man. Lancet 1969, 2, 1411–1414. [Google Scholar] [CrossRef] [PubMed]
- Horvath, S.; Raj, K. DNA methylation-based biomarkers and the epigenetic clock theory of ageing. Nat. Rev. Genet. 2018, 19, 371–384. [Google Scholar] [CrossRef]
- Ashiqur Rahman, S.; Giacobbi, P.; Pyles, L.; Mullett, C.; Doretto, G.; Adjeroh, D.A. Deep learning for biological age estimation. Brief. Bioinform. 2021, 22, 1767–1781. [Google Scholar] [CrossRef]
- Bortz, J.; Guariglia, A.; Klaric, L.; Tang, D.; Ward, P.; Geer, M.; Chadeau-Hyam, M.; Vuckovic, D.; Joshi, P.K. Biological age estimation using circulating blood biomarkers. Commun. Biol. 2023, 6, 1089. [Google Scholar] [CrossRef] [PubMed]
- Libert, S.; Chekholko, A.; Kenyon, C. A mathematical model that predicts human biological age from physiological traits identifies environmental and genetic factors that influence aging. eLife 2024, 13, RP92092. [Google Scholar]
- Liu, W.S.; You, J.; Ge, Y.J.; Wu, B.S.; Zhang, Y.; Chen, S.D.; Zhang, Y.R.; Huang, S.Y.; Ma, L.Z.; Feng, J.F.; et al. Association of biological age with health outcomes and its modifiable factors. Aging Cell 2023, 22, e13995. [Google Scholar]
- Bafei, S.E.C.; Shen, C. Biomarkers selection and mathematical modeling in biological age estimation. NPJ Aging 2023, 9, 13. [Google Scholar] [CrossRef]
- NEJM AI Grand Rounds. Available online: https://nejm-ai.podbean.com/ (accessed on 13 September 2023).
- Asgari, A. In 2023, AI and Machine Learning Are Playing a Transformative Role in Medical Diagnostics. From Assisting Radiologists to Predicting Disease Progression, This Article Delves Into Real-World Applications and the Promising Future of These Technologies. Available online: https://dfisx.com/ai-and-machine-learning-in-medical-diagnostics/ (accessed on 28 July 2023).
- Al-Antari, M.A. Advancements in Artificial Intelligence for Medical Computer-Aided Diagnosis. Diagnostics 2024, 14, 1265. [Google Scholar] [CrossRef]
- Fountzilas, E.; Pearce, T.; Baysal, M.A.; Chakraborty, A.; Tsimberidou, A.M. Convergence of evolving artificial intelligence and machine learning techniques in precision oncology. NPJ Digit. Med. 2025, 8, 75. [Google Scholar] [CrossRef] [PubMed]
- Krishnan, G.; Singh, S.; Pathania, M.; Gosavi, S.; Abhishek, S.; Parchani, A.; Dhar, M. Artificial intelligence in clinical medicine: Catalyzing a sustainable global healthcare paradigm. Front. Artif. Intell. 2023, 6, 1227091. [Google Scholar]
- Friedman, J.H. Multivariate Adaptive Regression Splines. Ann. Stat. 1991, 19, 1–67. [Google Scholar] [CrossRef]
- Stull, K.E.; L’Abbé, E.N.; Ousley, S.D. Using multivariate adaptive regression splines to estimate subadult age from diaphyseal dimensions. Am. J. Phys. Anthropol. 2014, 154, 376–386. [Google Scholar]
- Corron, L.; Marchal, F.; Condemi, S.; Telmon, N.; Chaumoitre, K.; Adalian, P. Integrating Growth Variability of the Ilium, Fifth Lumbar Vertebra, and Clavicle with Multivariate Adaptive Regression Splines Models for Subadult Age Estimation. J. Forensic Sci. 2019, 64, 34–51. [Google Scholar]
- De Cos Juez, F.J.; Lasheras, F.S.; García Nieto, P.J.; Suarez, M.A.S. A new data mining methodology applied to the modelling of the influence of diet and lifestyle on the value of bone mineral density in post-menopausal women. Int. J. Comput. Math. 2009, 86, 1878–1887. [Google Scholar]
- Tzou, S.J.; Peng, C.H.; Huang, L.Y.; Chen, F.Y.; Kuo, C.H.; Wu, C.Z.; Chu, T.W. Comparison between linear regression and four different machine learning methods in selecting risk factors for osteoporosis in a Chinese female aged cohort. J. Chin. Med. Assoc. 2023, 86, 1028–1036. [Google Scholar]
- Wu, X.; Tsai, S.P.; Tsao, C.K.; Chiu, M.L.; Tsai, M.K.; Lu, P.J.; Lee, J.H.; Chen, C.H.; Wen, C.; Chang, S.-S.; et al. Cohort profile: The Taiwan MJ cohort: Half a million Chinese with repeated health surveillance data. Int. J. Epidemiol. 2017, 46, 1744g. [Google Scholar]
- MJ Health Research Foundation. The Introduction of MJ Health Database. MJ Health Research Foundation Technical Report 2016, MJHRF-TR-01. Available online: http://www.mjhrf.org/upload/user/files/MJHRF-TR-01%20MJ%20Health%20Database.pdf (accessed on 22 August 2016).
- Chen, I.C.; Chou, L.J.; Huang, S.C.; Chu, T.W.; Lee, S.S. Machine learning-based comparison of factors influencing estimated glomerular filtration rate in Chinese women with or without nonalcoholic fatty liver. World J. Clin. Cases 2024, 12, 2506–2521. [Google Scholar]
- R Core Team. R: A Language and Environment for Statistical Computing; R Foundation for Statistical Computing: Vienna, Austria, 2024; Available online: http://www.R-project.org (accessed on 11 June 2024).
- RStudio Team. RStudio: Integrated Development Environment for R. Boston, MA, USA. 2024. Available online: http://www.rstudio.com/ (accessed on 11 June 2024).
- Milborrow, S.; Hastie, T.; Tibshirani, R. Earth: Multivariate Adaptive Regression Splines. R Package Version. 5.3.4. 2024. Available online: https://cran.r-project.org/web/packages/earth/earth.pdf (accessed on 5 October 2024).
- Kuhn, M. Caret: Classification and Regression Training. R Package Version. 6.0–94. 2024. Available online: https://rdrr.io/rforge/caret/ (accessed on 28 January 2024).
- Xuan, R.; Song, Y.; Baker, J.S.; Gu, Y. The Evaluation of Bone Mineral Density based on Age and Anthropometric Parameters in Southeast Chinese Adults: A Cross-Sectional Study. Med. Sci. Monit. 2020, 26, e923603. [Google Scholar]
- Demontiero, O.; Vidal, C.; Duque, G. Aging and bone loss: New insights for the clinician. Ther. Adv. Musculoskel. Dis. 2012, 4, 61–76. [Google Scholar] [CrossRef] [PubMed]
- Kaye, S.A.; Folsom, A.R.; Prineas, R.J.; Potter, J.D.; Gapstur, S.M. The association of body fat distribution with lifestyle and reproductive factors in a population study of postmenopausal women. Int. J. Obes. 1990, 14, 583–591. [Google Scholar] [CrossRef]
- Nadira, F.; Djamila, M.; Saida, F.; Lamia, K. Menopause and obesity. Endocr. Abstr. 2016, 41, EP791. [Google Scholar] [CrossRef]
- Ko, S.-H.; Jung, Y. Energy Metabolism Changes and Dysregulated Lipid Metabolism in Postmenopausal Women. Nutrients 2021, 13, 4556. [Google Scholar] [CrossRef] [PubMed]
- Jiang, Y.; Cao, Q.; Hong, W.; Xu, T.; Tang, M.; Li, Y.; Xu, R. Age and estimated glomerular filtration rate in Chinese older adults: A cohort study from 2014 to 2020. Front. Public Health 2024, 12, 1392903. [Google Scholar] [CrossRef]
- Oo, C.; Liu, B.; Hill, G. Change in creatinine clearance with advancing age. J. Am. Geriatr. Soc. 2002, 50, 1603–1604. [Google Scholar] [CrossRef]
- Stavrova, O. Having a Happy Spouse Is Associated With Lowered Risk of Mortality. Psychol. Sci. 2019, 30, 798–803. [Google Scholar] [CrossRef]
- Johnson, N.J.; Backlund, E.; Sorlie, P.D.; Loveless, C.A. Marital status and mortality: The national longitudinal mortality study. Ann. Epidemiol. 2000, 10, 224–238. [Google Scholar] [CrossRef]
- Murphy, M.; Grundy, E.; Kalogirou, S. The increase in marital status differences in mortality up to the oldest age in seven European countries, 1990–1999. Popul. Stud. 2007, 61, 287–298. [Google Scholar] [CrossRef]
- Goldman, N. Marriage selection and mortality patterns: Inferences and fallacies. Demography 1993, 30, 189–208. [Google Scholar] [CrossRef]
- Espinosa, J.; Evans, W.N. Heightened mortality after the death of a spouse: Marriage protection or marriage selection? J. Health Econ. 2008, 27, 1326–1342. [Google Scholar] [CrossRef] [PubMed]
- Martin, A.B.; Hartman, M.; Lassman, D.; Catlin, A. National health care spending in 2019: Steady growth for the fourth consecutive year. Health Aff. 2021, 40, 14–24. [Google Scholar] [CrossRef] [PubMed]
- Li, C.; Managi, S. Income raises human well-being indefinitely, but age consistently slashes it. Sci. Rep. 2023, 13, 5905. [Google Scholar] [CrossRef]
- Wu, H.; Wang, Q.; Liu, Q.; Zhang, Q.; Huang, Q.; Yu, Z. The Serum Tumor Markers in Combination for Clinical Diagnosis of Lung Cancer. Clin. Lab. 2020, 66, 269. [Google Scholar] [CrossRef] [PubMed]
- Bjerner, J.; Høgetveit, A.; Wold Akselberg, K.; Vangsnes, K.; Paus, E.; Bjøro, T.; Børmer, O.P.; Nustad, K. Reference intervals for carcinoembryonic antigen (CEA), CA125, MUC1, Alfa-foeto-protein (AFP), neuron-specific enolase (NSE) and CA19.9 from the NORIP study. Scand. J. Clin. Lab. Investig. 2008, 68, 703–713. [Google Scholar] [CrossRef]
- Krøll, J.; Saxtru, O. On the use of regression analysis for the estimation of human biological age. Biogerontology 2000, 1, 363–368. [Google Scholar] [CrossRef]
- Diemar, S.S.; Møllehave, L.T.; Quardon, N.; Lylloff, L.; Thuesen, B.H.; Linneberg, A.; Jørgensen, N.R. Effects of age and sex on osteocalcin and bone-specific alkaline phosphatase—Reference intervals and confounders for two bone formation markers. Arch. Osteoporos. 2020, 15, 26. [Google Scholar] [CrossRef]
- Hunt, L.C.; Demontis, F. Age-Related Increase in Lactate Dehydrogenase Activity in Skeletal Muscle Reduces Life Span in Drosophila. J. Gerontol. A Biol. 2022, 77, 259–267. [Google Scholar] [CrossRef]


| Ordinal Variable (Unit) | N (%) | Interval Variable (Unit) | Mean ± SD | |
|---|---|---|---|---|
| Education level | Illiterate | 2663 (22.50%) | WBC: White blood cells (×103/μL) | 5.85 ± 1.52 |
| Elementary school | 5118 (43.24%) | Hb: Hemoglobin (g/dL) | 13.24 ± 1.07 | |
| Secondary | 1245 (10.52%) | Plt: Platelets (×103/μL) | 234.99 ± 57.95 | |
| High school | 1462 (12.35%) | FPG: Fasting plasma glucose (mg/dL) | 97.85 ± 9.60 | |
| College | 636 (5.37%) | TB: Total bilirubin (mg/dL) | 0.74 ± 0.29 | |
| The University | 600 (5.07%) | Alb: Albumin (g/dL) | 4.41 ± 0.26 | |
| Graduate School | 113 (0.95%) | Glo: Globulin (g/dL) | 3.18 ± 0.39 | |
| Marriage | Unmarried | 2913 (24.61%) | ALP: Alkaline phosphatase (U/L) | 152.47 ± 56.17 |
| Married | 8924 (75.39%) | SGOT: Serum glutamic-oxaloacetic transaminase (IU/L) | 24.66 ± 15.62 | |
| Income (NTD) | ≤200,000 | 6501 (54.92%) | SGPT: Serum glutamic-pyruvic transaminase (IU/L) | 23.92 ± 23.49 |
| 200,001–400,000 | 3010 (25.43%) | r-GT: Gamma glutamyl transpeptidase (IU/L) | 19.88 ± 22.86 | |
| 400,001–800,000 | 1492 (12.60%) | LDH: Lactate dehydrogenase (IU/L) | 323.02 ± 78.09 | |
| 800,001–1,200,000 | 599 (5.06%) | Cr: Creatinine (mg/dL) | 0.84 ± 0.28 | |
| 1,200,001–1,600,000 | 132 (1.12%) | UA: Uric acid (mg/dL) | 5.50 ± 1.32 | |
| 1,600,001–2,000,000 | 47 (0.40%) | TG: Triglycerides (mg/dL) | 110.58 ± 43.37 | |
| >2,000,000 | 56 (0.47%) | HDL-C: High-density lipoprotein- cholesterol (mg/dL) | 58.58 ± 13.73 | |
| Sleep time (hours) | <4 | NA | LDL-C: Low-density lipoprotein- cholesterol (mg/dL) | 128.78 ± 29.08 |
| 4–6 | 335 (2.83%) | Ca: plasma calcium level (mg/dL) | 9.24 ± 0.41 | |
| 6–7 | 3476 (29.37%) | P: plasma phosphate level (mg/dL) | 3.73 ± 0.45 | |
| 7–8 | 7067 (59.70%) | AFP: Alpha-fetoprotein (ng/mL) | 3.40 ± 10.31 | |
| 8–9 | 959 (8.10%) | CEA: Carcinoembryonic antigen (ng/mL) | 1.76 ± 5.97 | |
| >9 | NA | TSH: Thyroid-stimulating hormone (μIU/mL) | 1.82 ± 3.43 | |
| CRP: C-reactive protein (mg/dL) | 0.25 ± 0.55 | |||
| Age (years) | 57.96 ± 6.50 | FEV1: Forced expiratory volume in one second | 1.65 ± 0.41 | |
| SBP: Systolic blood pressure (mmHg) | 126.37 ± 16.54 | BMD: Bone mass density | 0.58 ± 0.11 | |
| DBP: Diastolic blood pressure (mmHg) | 73.57 ± 9.49 | Drink area | 0.91 ± 6.09 | |
| WHR: Waist–hip ratio (%) | 0.80 ± 0.06 | Smoke area | 0.87 ± 6.00 | |
| PR: Pulse rate (time/min) | 72.58 ± 9.86 | Sport area | 6.05 ± 8.05 | |
| RR: Respiratory rate (time/min) | 17.54 ± 1.52 | |||
| Metric | Description | Calculation |
|---|---|---|
| RAE | Relative absolute error | |
| RRSE | Root relative squared error | |
| RMSE | Root mean squared error |
| Methods | RAE | RRSE | RMSE |
|---|---|---|---|
| MARS | 1.234 | 1.263 | 7.879 |
| MLR | 1.253 | 1.411 | 8.805 |
| Corresponding Equations of the Model | ||
|---|---|---|
| Equation | Coefficients | |
| Intercept | - | 60.494 |
| BFs | ||
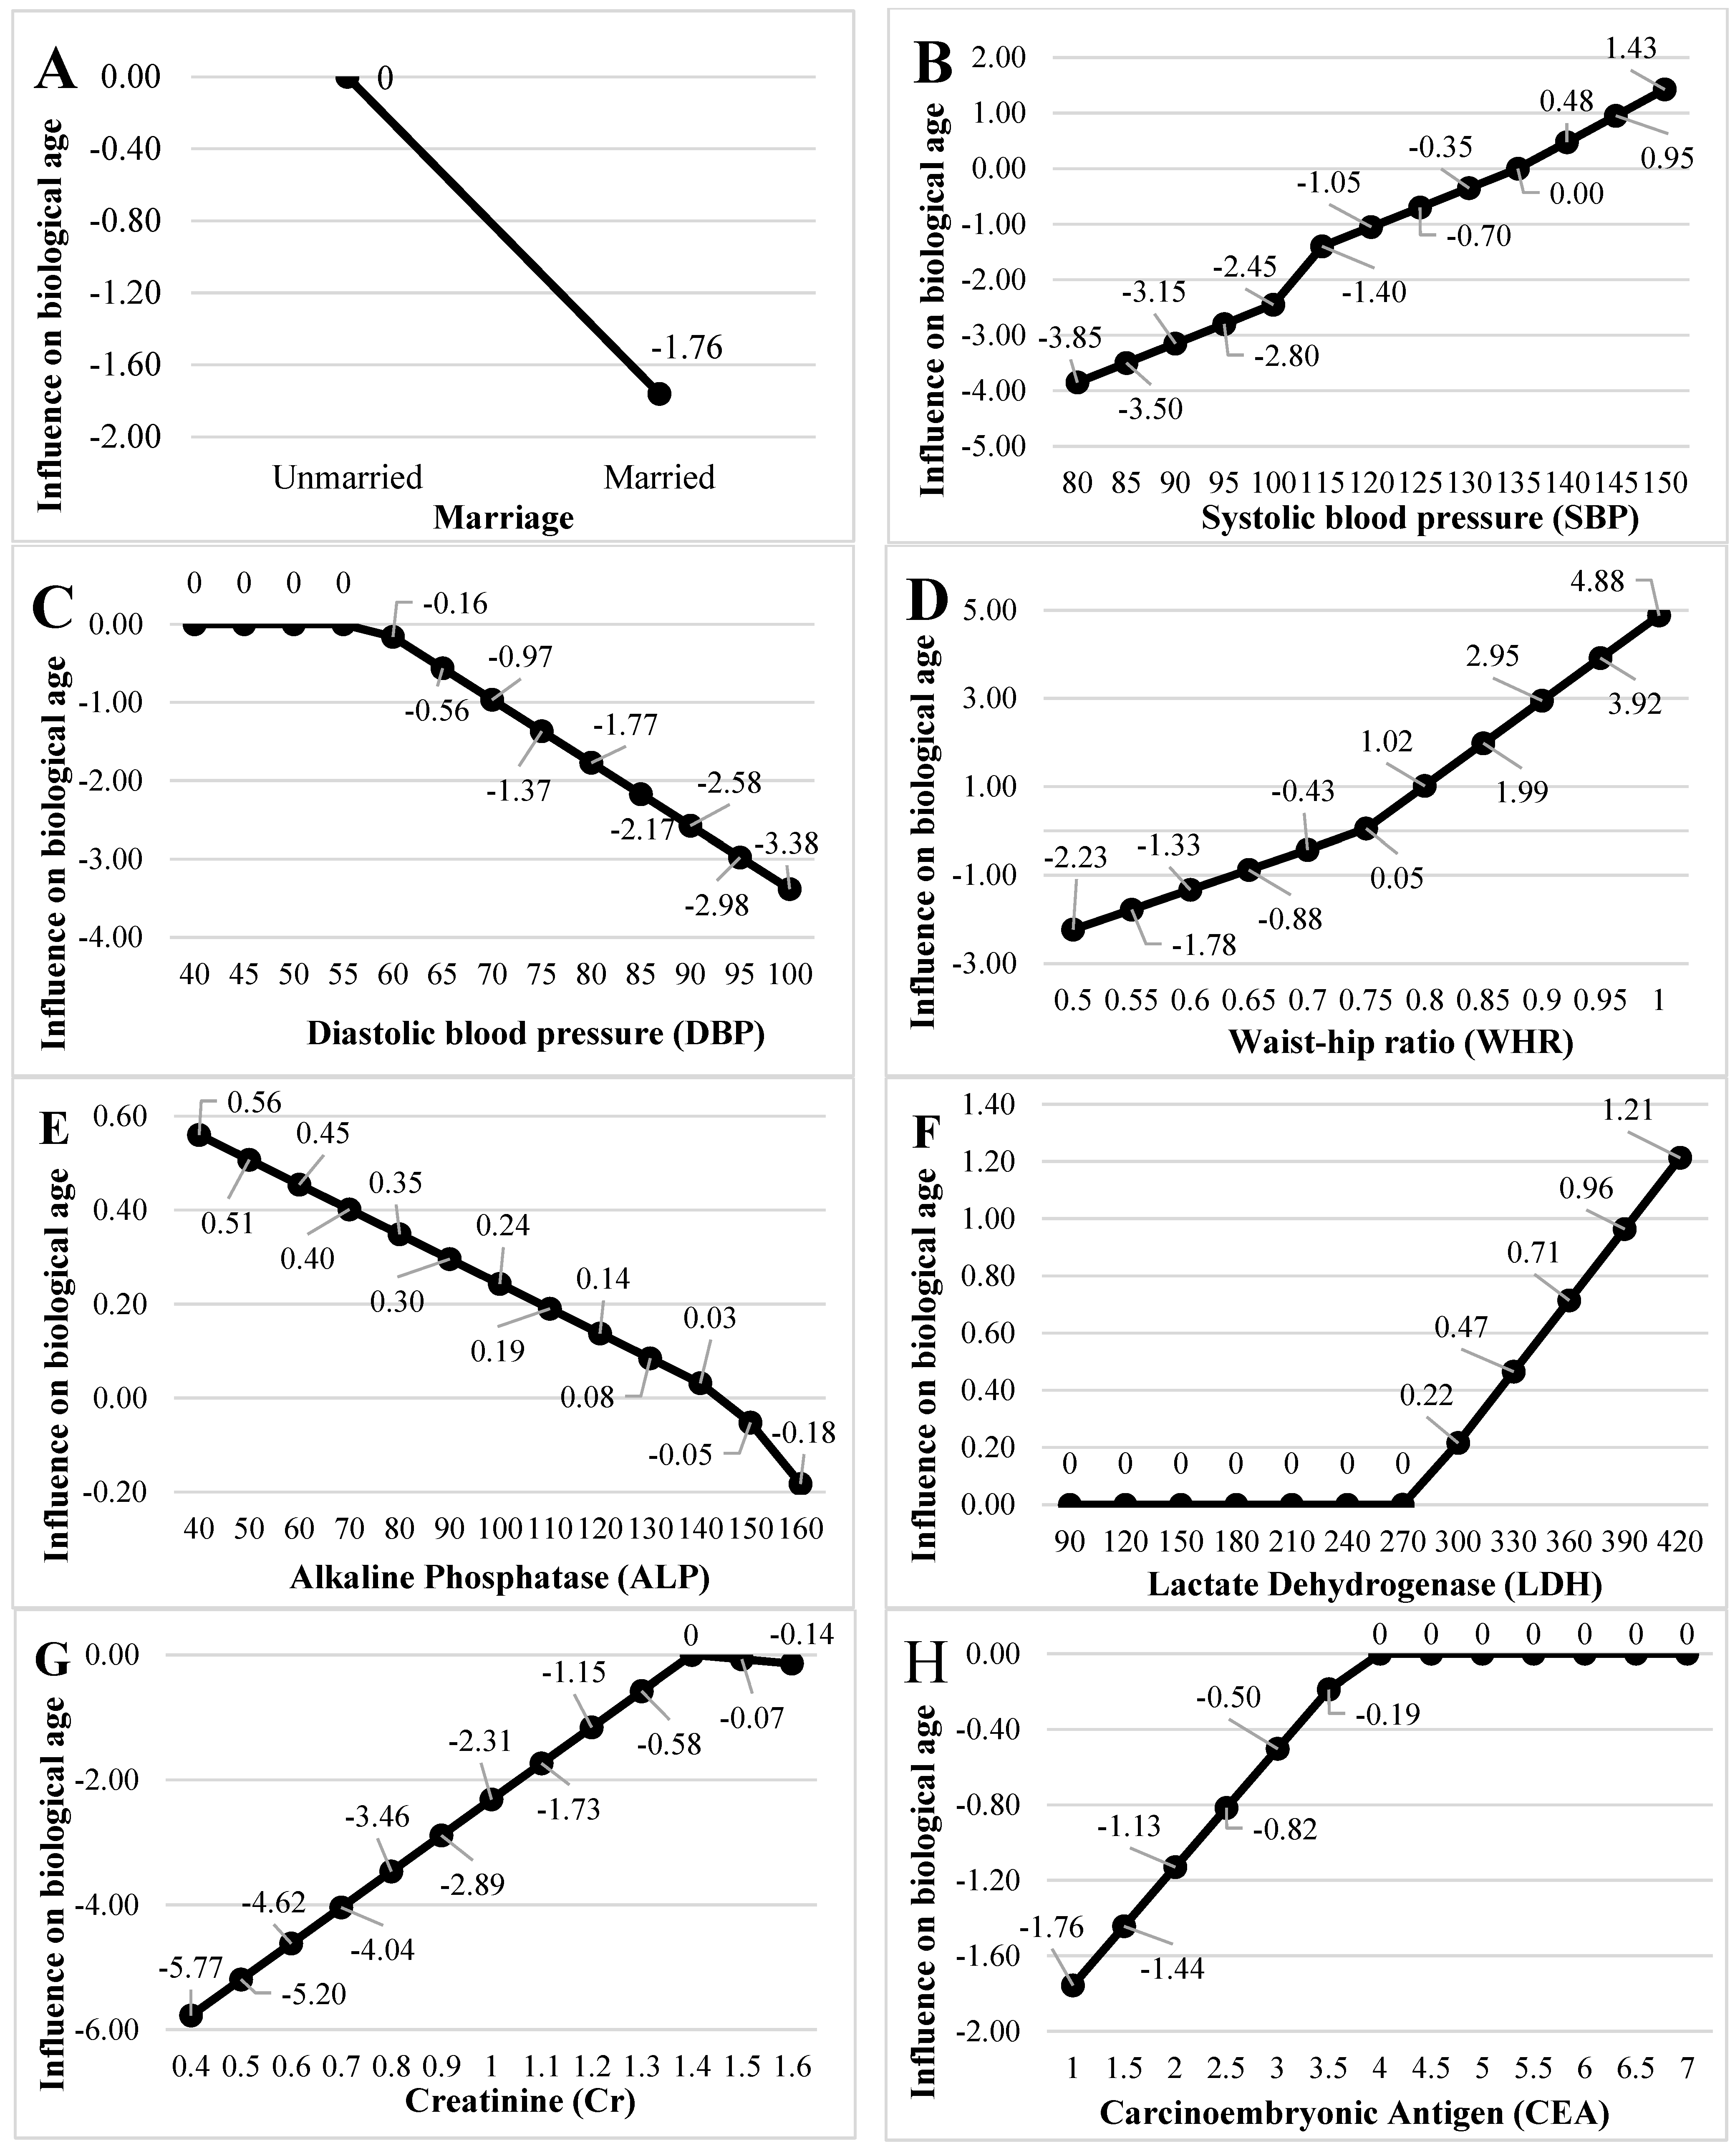
| BF1 | Max(0, Marriage) | −1.761 |
| BF2 | Max(0, 135-SBP) | −0.070 |
| BF3 | Max(0, SBP-135) | 0.095 |
| BF4 | Max(0, DBP-58) | −0.081 |
| BF5 | Max(0, 0.747-WHR) | −9.012 |
| BF6 | Max(0, WHR-0.747) | 19.321 |
| BF7 | Max(0, 146-ALP) | 0.005 |
| BF8 | Max(0, ALP-146) | −0.013 |
| BF9 | Max(0, LDH-274) | 0.008 |
| BF10 | Max(0, 1.4-Cr) | −5.774 |
| BF11 | Max(0, Cr-1.4) | −0.693 |
| BF12 | Max(0, 3.8-CEA) | −0.627 |
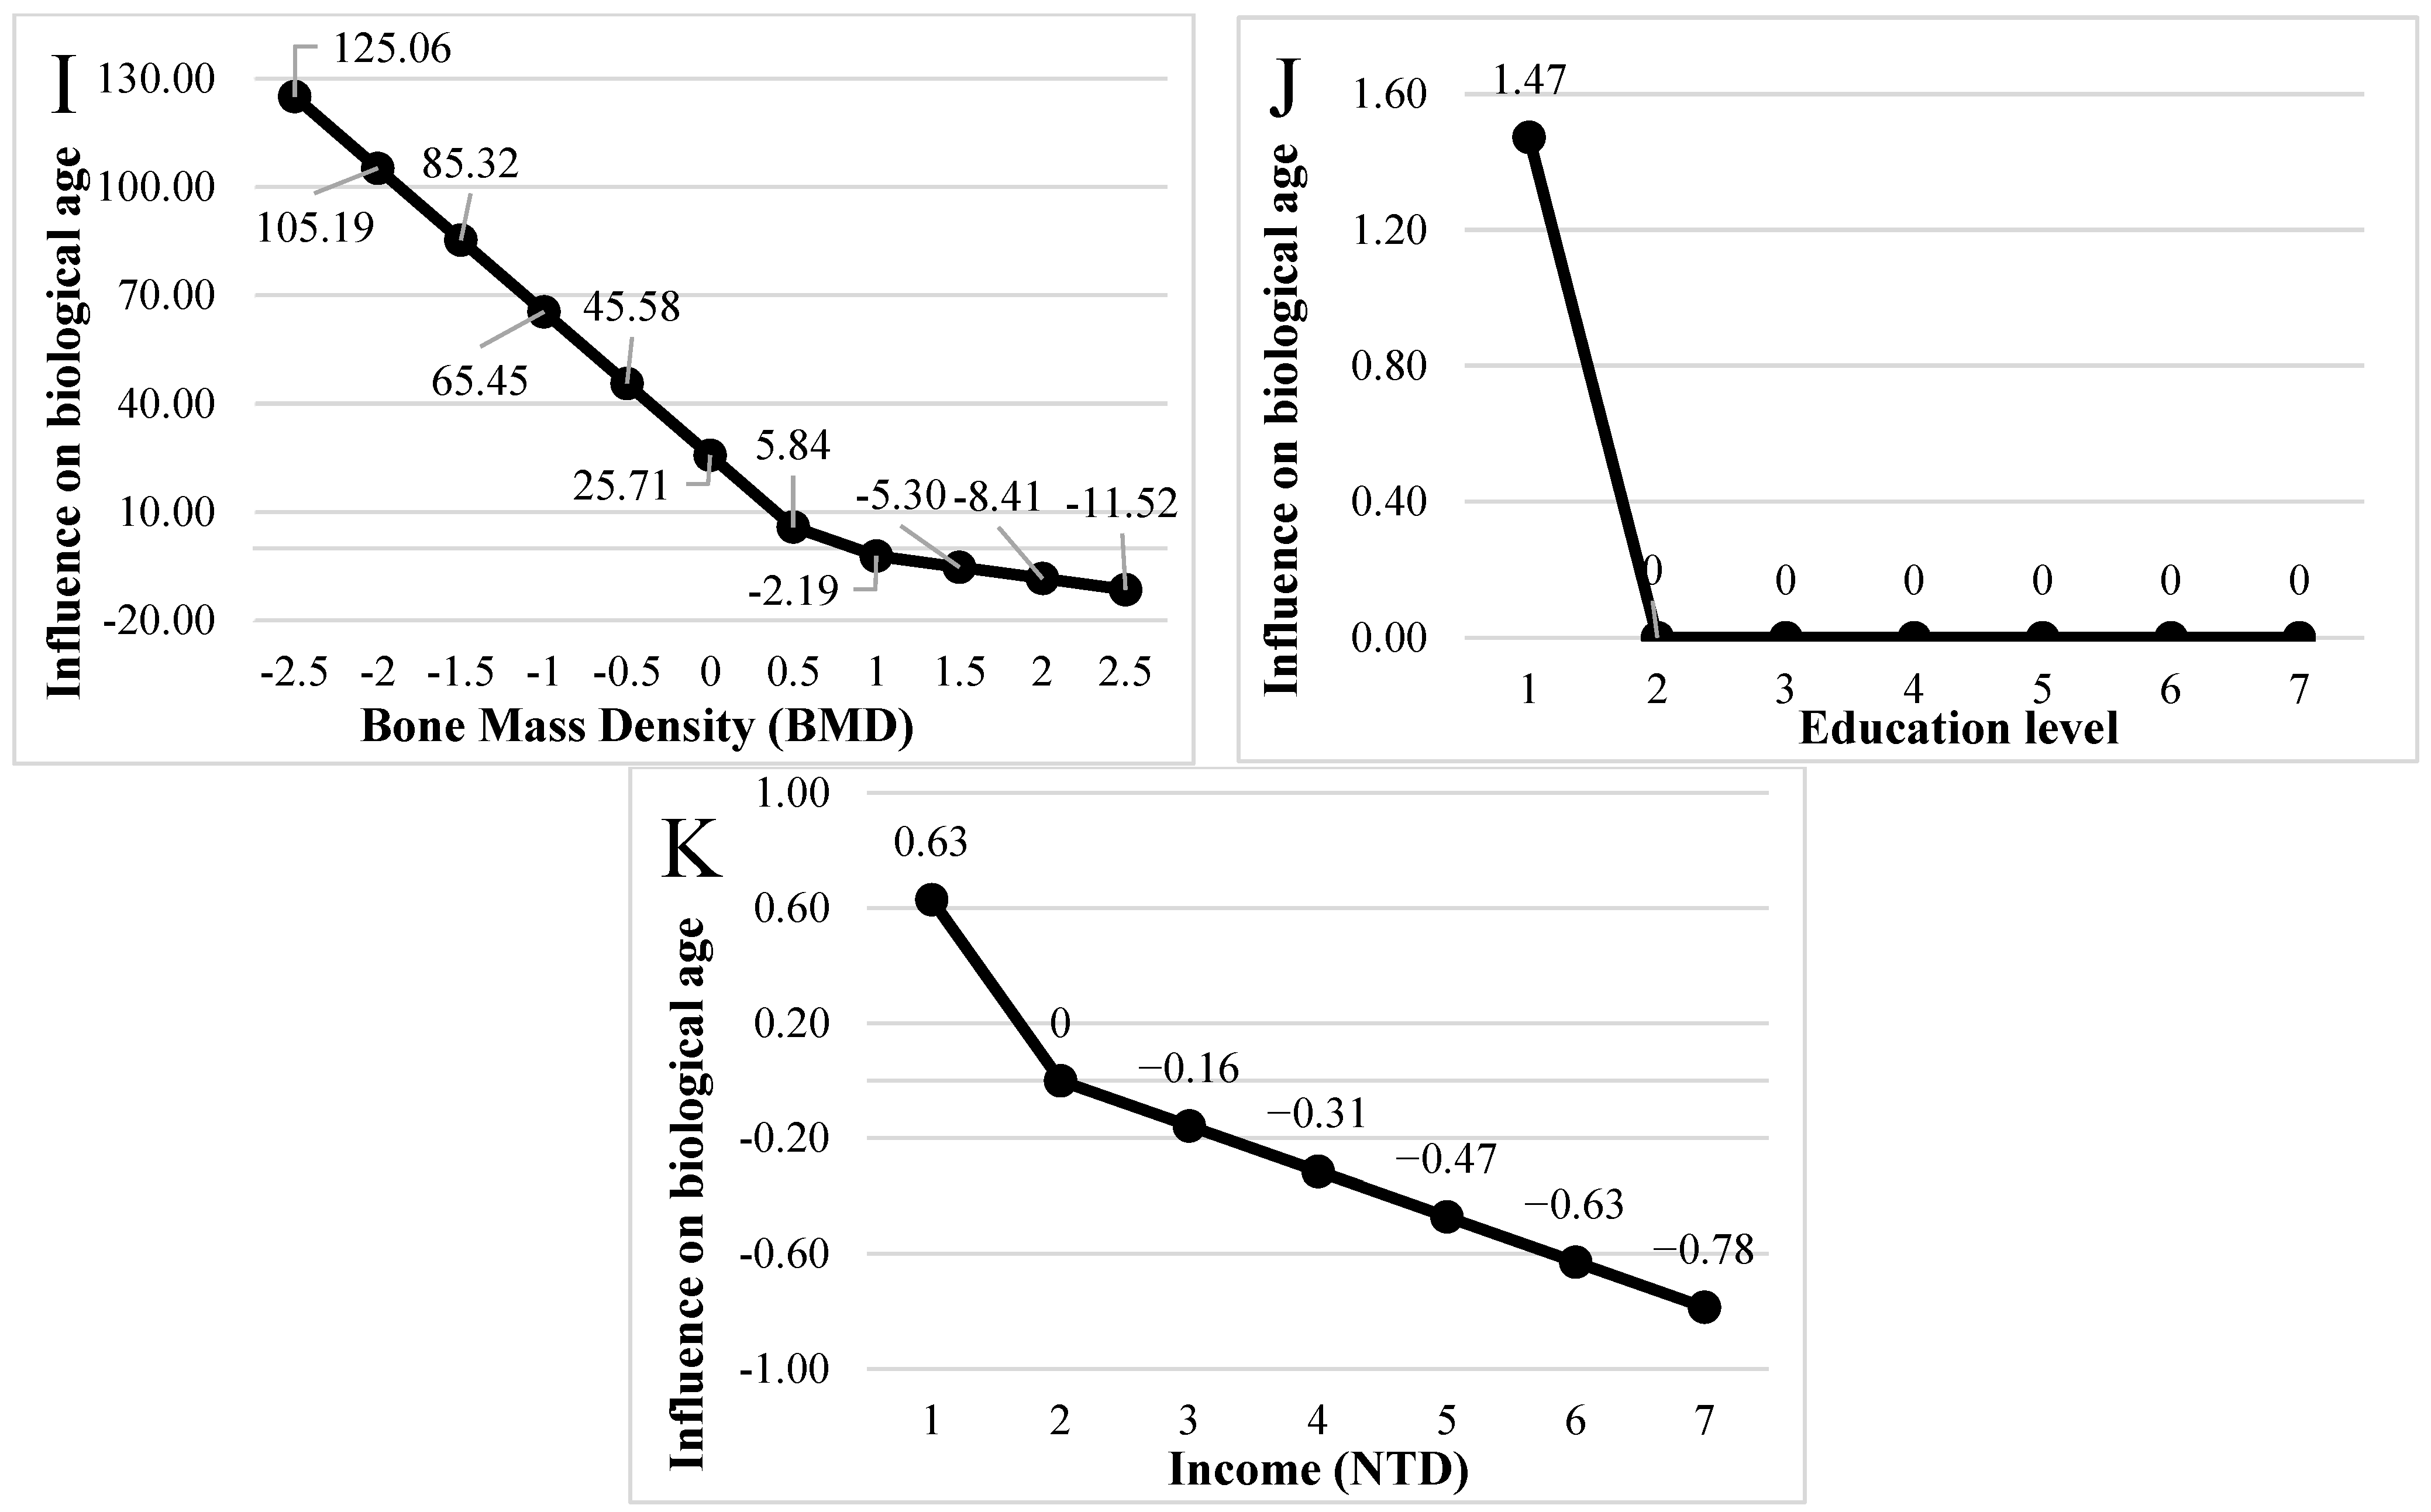
| BF13 | Max(0, 0.647-BMD) | 39.739 |
| BF14 | Max(0, BMD-0.647) | −6.217 |
| BF15 | Max(0, 2-Education level) | 1.473 |
| BF16 | Max(0, 2-Income) | 0.629 |
| BF17 | Max(0, Income-2) | −0.157 |
| A | B | C | |
|---|---|---|---|
| 1 | Type Marriage | =MAX(0, A1) | =−1.761 × B1 |
| 2 | Type SBP | =MAX(0, 135-A2) | =−0.070 × B2 |
| 3 | =MAX(0, A2-135) | =0.095 × B3 | |
| 4 | Type DBP | =MAX(0, A4-58) | =−0.081 × B4 |
| 5 | Type WHR | =MAX(0, 0.747-A5) | =−9.012 × B5 |
| 6 | =MAX(0, A5-0.747) | =19.321 × B6 | |
| 7 | Type ALP | =MAX(0, 146-A7) | =0.005 × B7 |
| 8 | =MAX(0, A7-146) | =−0.013 × B8 | |
| 9 | Type LDH | =MAX(0, A9-274) | =0.008 × B9 |
| 10 | Type Cr | =MAX(0, 1.4-A10) | =−5.774 × B10 |
| 11 | =MAX(0, A10-1.4) | =−0.693 × B11 | |
| 12 | Type CEA | =MAX(0, 3.8-A12) | =−0.627 × B12 |
| 13 | Type BMD | =MAX(0, 0.647-A13) | =39.739 × B13 |
| 14 | =MAX(0, A13-0.647) | =−6.217 × B14 | |
| 15 | Type Education level | =MAX(0, 2-A15) | =1.473 × B15 |
| 16 | Type Income level | =MAX(0, 2-A16) | =0.629 × B16 |
| 17 | =MAX(0, A16-2) | =−0.157 × B17 | |
| 18 | |||
| 19 | BA | ||
| 20 | =60.494 + SUM(C1:C17) |
Disclaimer/Publisher’s Note: The statements, opinions and data contained in all publications are solely those of the individual author(s) and contributor(s) and not of MDPI and/or the editor(s). MDPI and/or the editor(s) disclaim responsibility for any injury to people or property resulting from any ideas, methods, instructions or products referred to in the content. |
© 2025 by the authors. Licensee MDPI, Basel, Switzerland. This article is an open access article distributed under the terms and conditions of the Creative Commons Attribution (CC BY) license (https://creativecommons.org/licenses/by/4.0/).
Share and Cite
Chang, C.-F.; Chu, T.-W.; Liu, C.-H.; Wu, S.-T.; Yang, C.-C. Equation Built by Multiple Adaptive Regression Spline to Estimate Biological Age in Healthy Postmenopausal Women in Taiwan. Diagnostics 2025, 15, 1147. https://doi.org/10.3390/diagnostics15091147
Chang C-F, Chu T-W, Liu C-H, Wu S-T, Yang C-C. Equation Built by Multiple Adaptive Regression Spline to Estimate Biological Age in Healthy Postmenopausal Women in Taiwan. Diagnostics. 2025; 15(9):1147. https://doi.org/10.3390/diagnostics15091147
Chicago/Turabian StyleChang, Chun-Feng, Ta-Wei Chu, Chi-Hao Liu, Sheng-Tang Wu, and Chung-Chi Yang. 2025. "Equation Built by Multiple Adaptive Regression Spline to Estimate Biological Age in Healthy Postmenopausal Women in Taiwan" Diagnostics 15, no. 9: 1147. https://doi.org/10.3390/diagnostics15091147
APA StyleChang, C.-F., Chu, T.-W., Liu, C.-H., Wu, S.-T., & Yang, C.-C. (2025). Equation Built by Multiple Adaptive Regression Spline to Estimate Biological Age in Healthy Postmenopausal Women in Taiwan. Diagnostics, 15(9), 1147. https://doi.org/10.3390/diagnostics15091147