
The Impact of Quality of Life on Cardiac Arrhythmias: A Clinical, Demographic, and AI-Assisted Statistical Investigation

 ,
,  , ,
, ,
Abstract
1. Introduction
1.1. General Context of Cardiac Arrhythmias and Quality of Life
1.2. Impact of Depression and Mental Health on Cardiovascular Diseases (CVDs)
1.3. Importance of SF-36 and PHQ-9 Questionnaires in Assessing QoL
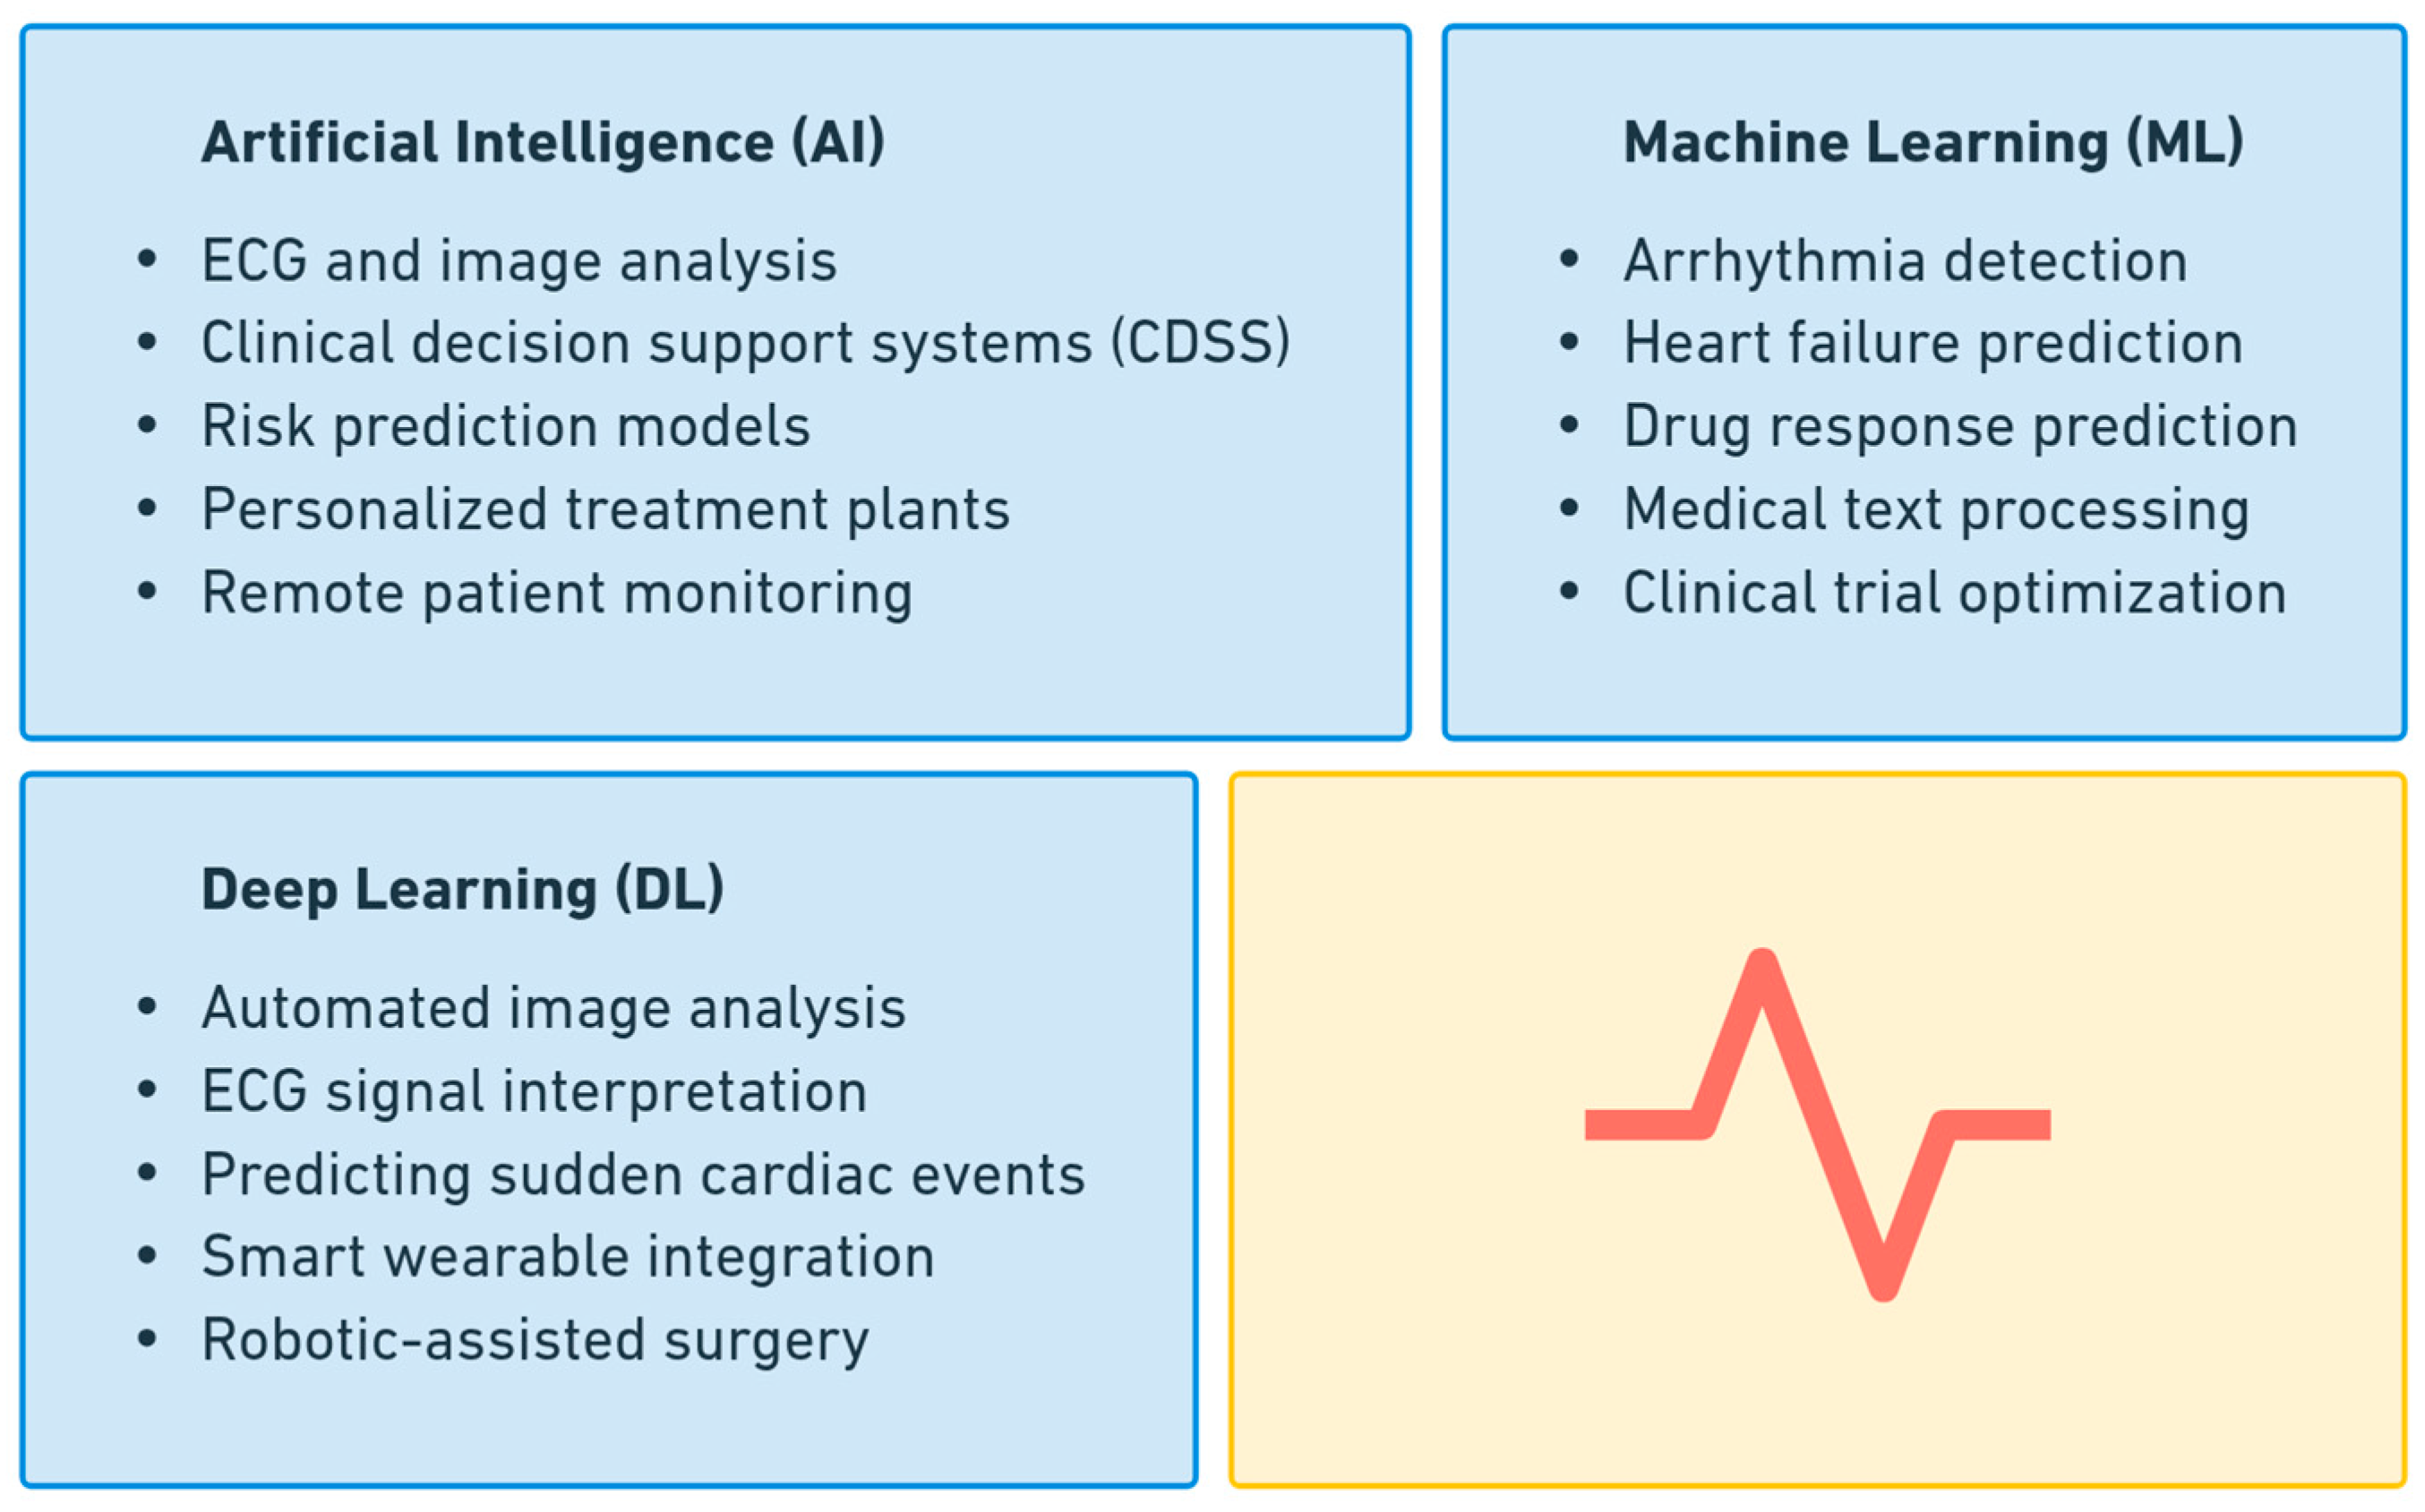
1.4. Role of AI in Analyzing Medical Data Related to Cardiac Conditions
2. Materials and Methods
2.1. Data Collection
- Group 1: Adults diagnosed with cardiac arrhythmias without any associated cardiovascular comorbidities, receiving medication-based treatment.
- Group 2: Adults diagnosed with cardiac arrhythmias accompanied by other cardiovascular conditions, also receiving medication-based treatment.
2.2. Clinical Statistics
2.2.1. Descriptive Statistical Analysis of Clinical Scores
2.2.2. Normality Test: Shapiro–Wilk
2.2.3. Group Comparisons: Mann–Whitney U Test
2.2.4. Association Analysis: Chi-Square Test
2.2.5. Kruskal–Wallis Test for Comparing Clinical Scores Across Multiple Groups
2.2.6. Spearman’s Correlation for the Relationship Between SF-36 and PHQ-9 Scores
2.2.7. Linear Regression to Analyze the Influence of Disease Duration on QoL Scores
2.2.8. Factor Analysis for Identifying Common Dimensions in SF-36 and PHQ-9
2.3. Demographic Statistics
2.3.1. Descriptive Analysis of Demographic Data (Age, Gender, Disease Duration)
2.3.2. Chi-Square Test for the Relationship Between Gender/Age Groups and Depression Scores
2.3.3. Trend Test for Variation of Scores Based on Age or Disease Duration
2.3.4. Linear Regression to Evaluate the Impact of Demographic Factors on Clinical Scores
2.3.5. Principal Component Analysis (PCA) for Dimensionality Reduction and Identification of Relevant Demographic Variables
2.4. AI-Assisted Statistics
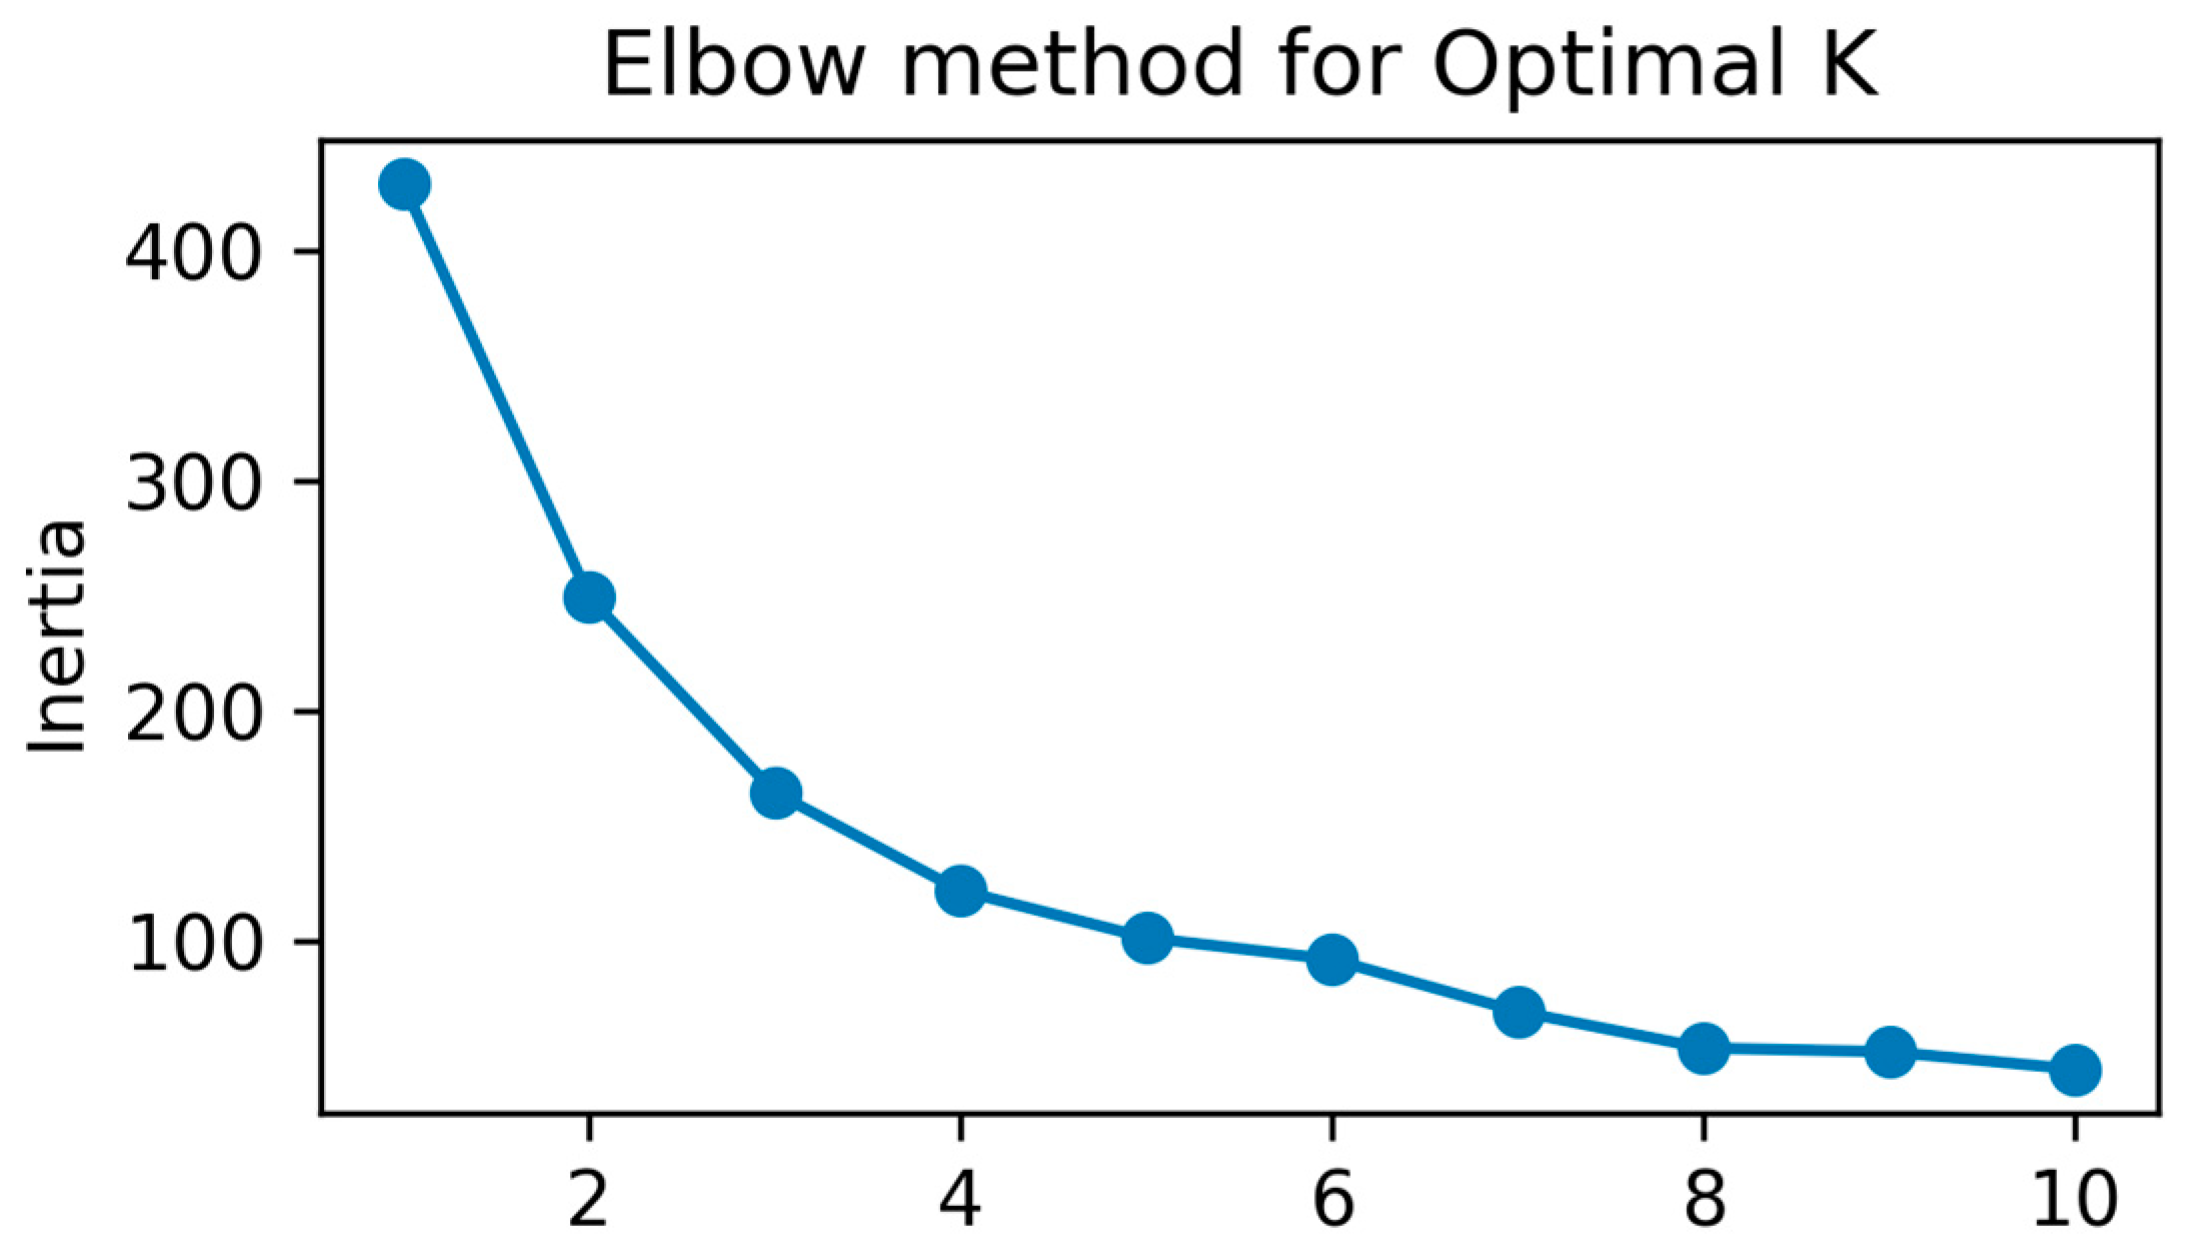
2.4.1. Cluster Analysis (k-Means) for Grouping Patients Based on Demographic Variables
2.4.2. Multivariable Logistic Regression for Predicting Depression Based on Clinical and Demographic Data
2.4.3. XGBoost for Robust Predictive Models and Receiver-Operating Characteristic Curve (ROC) Analysis for Evaluating Performance
3. Results
3.1. SF-36 and PHQ-9 Scores
3.1.1. SF-36
3.1.2. PHQ-9
3.1.3. Correlation Between Tests
3.2. Clinical Results
3.2.1. Descriptive Statistical Analysis of Clinical Scores
3.2.2. Normality Test, Group Comparisons, and Association Analysis
3.2.3. Kruskal–Wallis Test, and Spearman’s Correlation
3.2.4. Linear Regression to Analyze the Influence of Disease Duration on QoL Scores
3.3. Demographic Characteristics
3.3.1. Descriptive Analysis of Demographic Data (Age, Gender, Disease Duration)
3.3.2. Chi-Square Test for the Relationship Between Gender/Age Groups and Depression Scores
3.3.3. Trend Test for Variation of Scores Based on Age or Disease Duration
3.3.4. Linear Regression to Evaluate the Impact of Demographic Factors on Clinical Scores
3.3.5. PCA for Dimensionality Reduction and Identification of Relevant Demographic Variables
3.4. AI Analysis: Models, Performance, Validation
3.4.1. K-Means for Grouping Patients Based on Demographic Variables
- Cluster 0: 34 patients with an average age of 47.7 years, predominantly female (gender mean close to 0), and a mean disease duration of 1.91 years.
- Cluster 1: 93 patients with an average age of 52.9 years, predominantly male (gender mean = 1), and a mean disease duration of 3.24 years.
- Cluster 2: 16 patients with an average age of 68.4 years, a mixed gender distribution (mean = 0.44), and a notably longer mean disease duration of 9.19 years.
3.4.2. Multivariable Logistic Regression for Predicting Depression Based on Clinical and Demographic Data
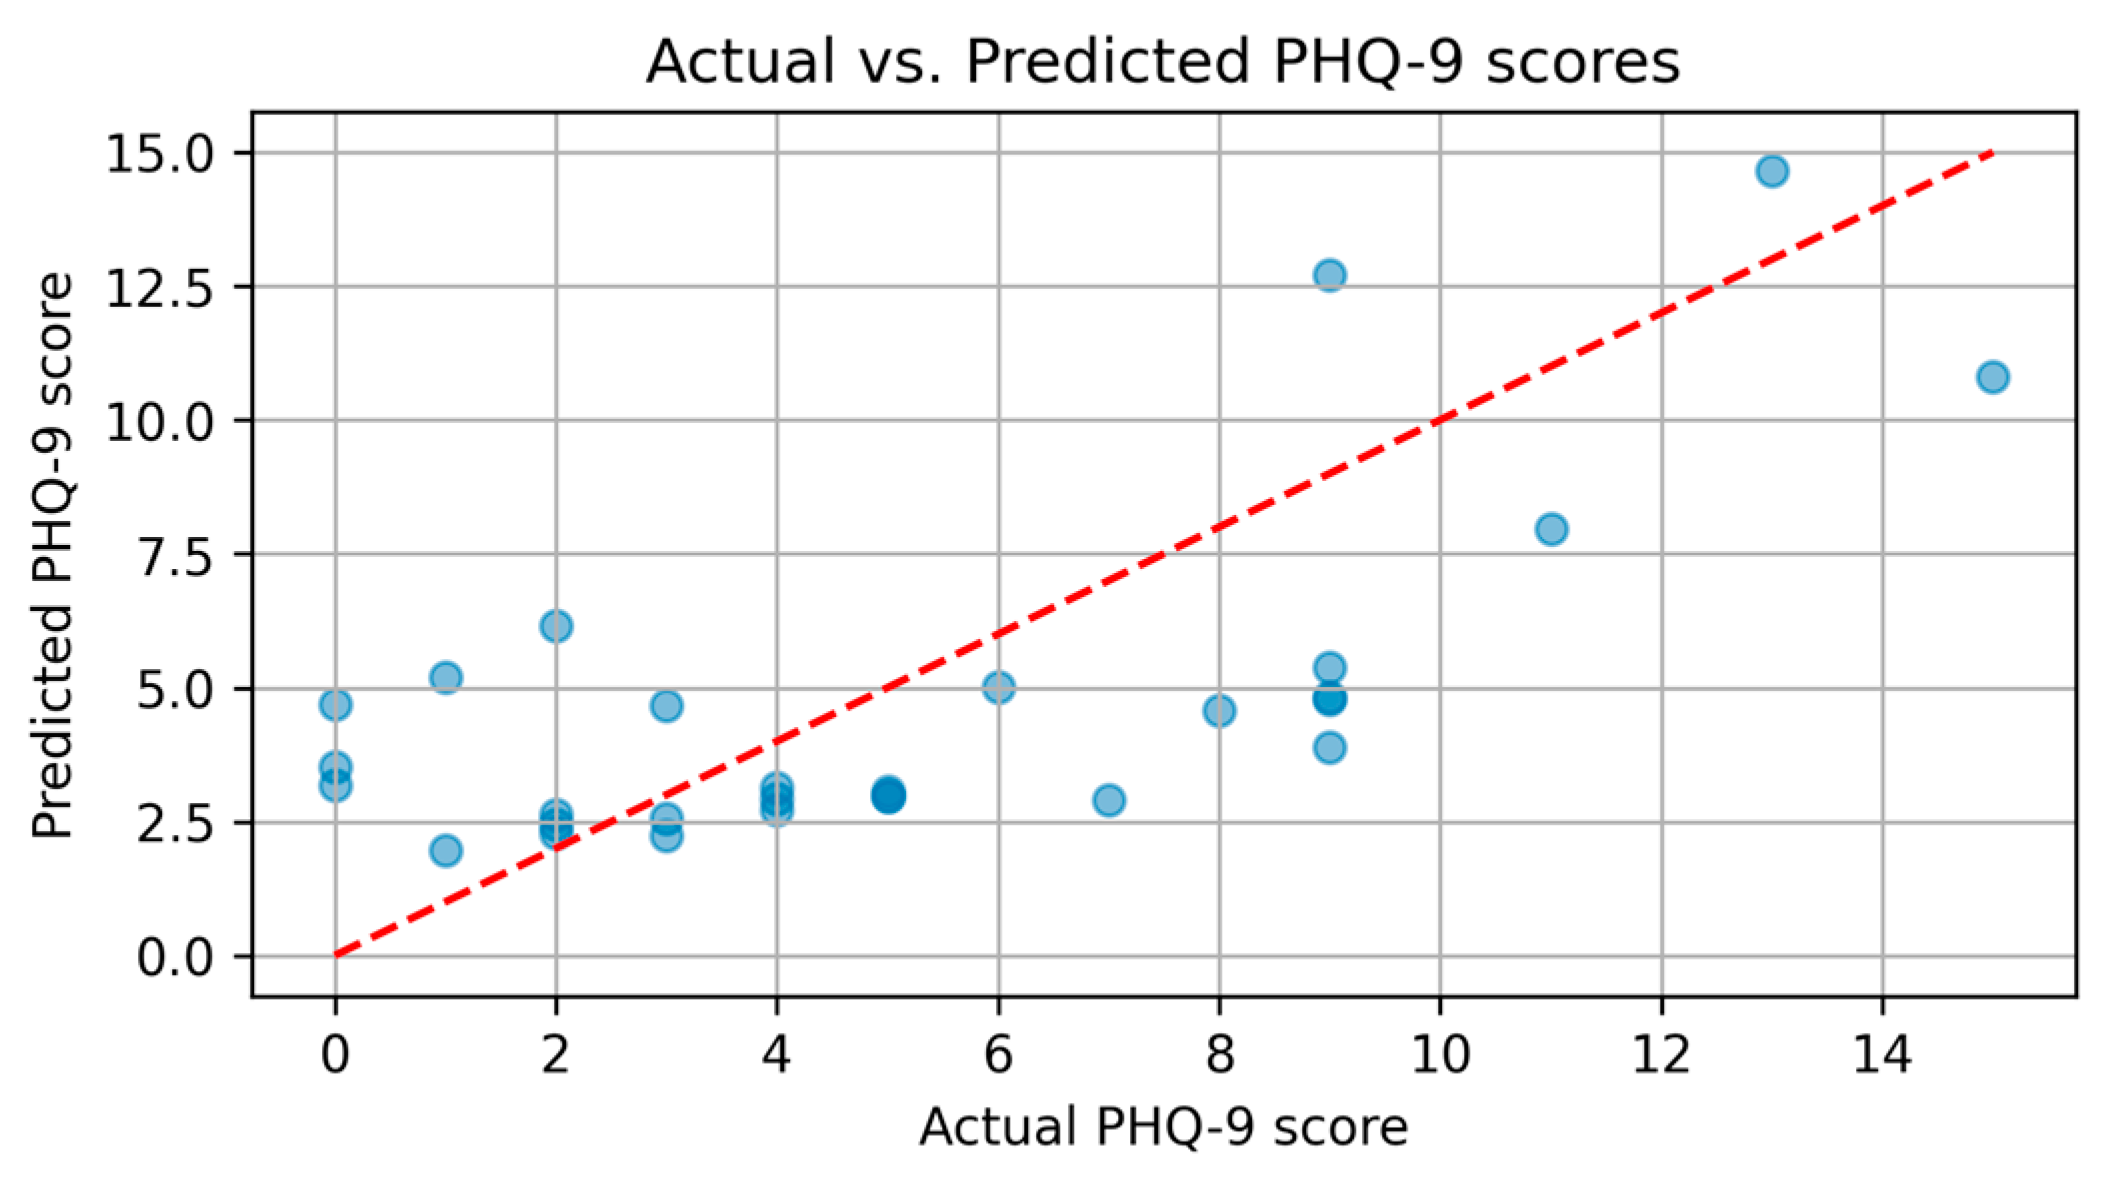
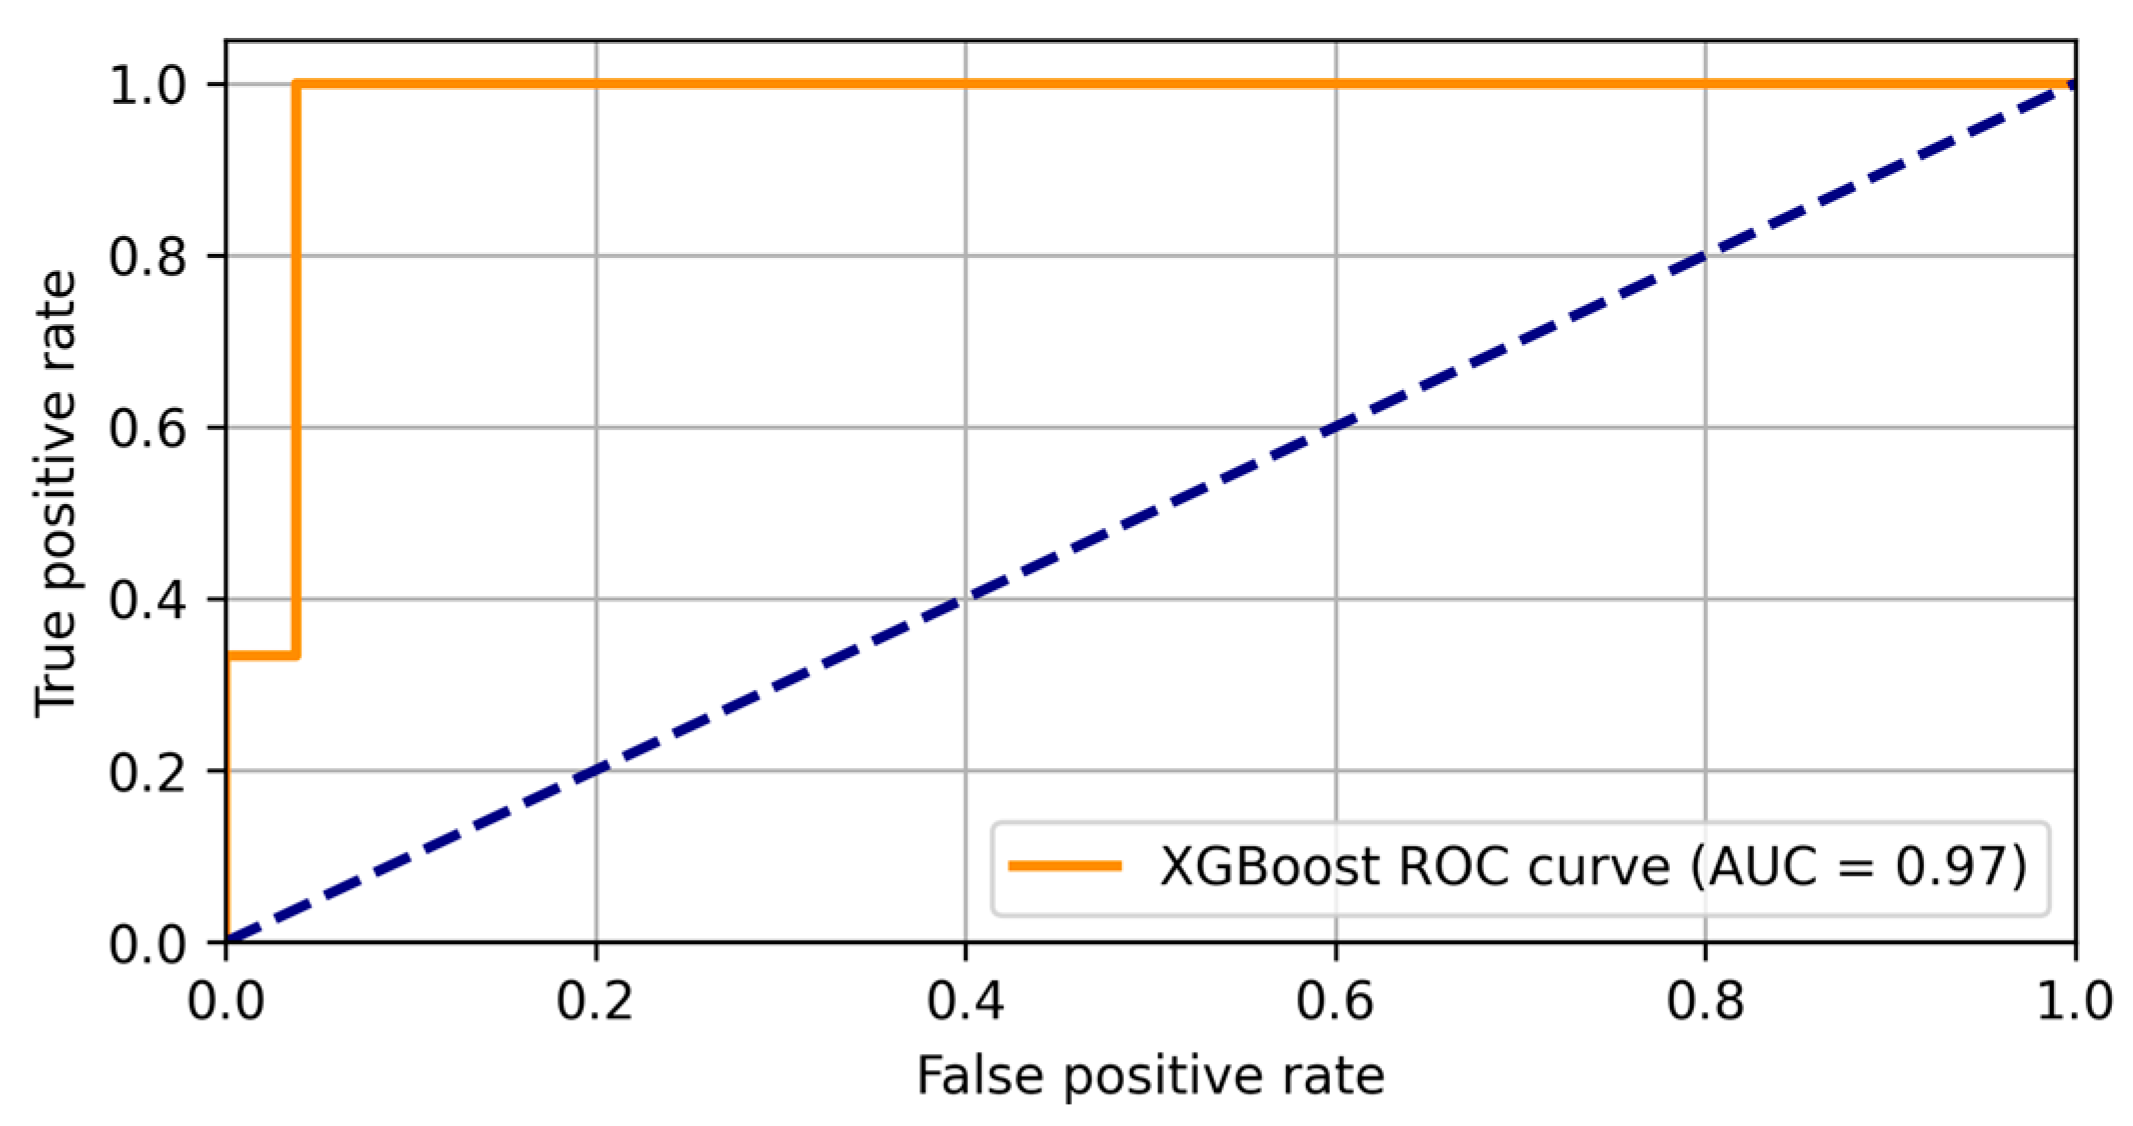
3.4.3. XGBoost for Robust Predictive Models and ROC Analysis for Evaluating Performance
3.5. Additional Age-Stratified Analysis
3.5.1. Multivariable Logistic Regression for Predicting Depression Based on Clinical and Demographic Data
- Ages 20–40 (n = 40): The mean PHQ-9 score in this younger subgroup was 3.8 (SD = 2.2), reflecting generally mild depressive symptoms. Correspondingly, SF-36 domain scores were relatively high, with physical health averaging around 73.4 and mental health around 76.1. Vitality and emotional well-being also scored notably better than in older age categories.
- Ages 41–60 (n = 70): Participants in this middle-aged range showed a moderate rise in PHQ-9 scores (mean 5.2, SD = 3.6) compared to the youngest group, coupled with slightly lower SF-36 scores—particularly in physical functioning (about 67.9) and energy/fatigue. Although these differences were not profoundly large, they suggest a progressive impact of age on QoL and depressive symptoms. AI-powered analytics: The incorporation of machine learning enhanced predictive accuracy and patient subgroup identification.
- Ages > 60 (n = 35): Older adults in this category had the highest average PHQ-9 score, around 7.1 (SD = 4.0), indicating mild-to-moderate depressive symptomatology, as well as the lowest SF-36 domain scores (physical health often near 60.3 and mental health around 62.9). Statistically significant differences (p < 0.05) emerged compared with the 20–40 age group across multiple SF-36 dimensions, underscoring a greater vulnerability to both depression and reduced QoL in later life.
3.5.2. Implications and Future Directions
4. Discussion
4.1. The Impact of QoL on Cardiac Arrhythmias
4.2. AI-Driven Insights into QoL and Cardiac Arrhythmias
4.3. Clinical Implications
- Patients with mild arrhythmias but high depression scores (Cluster 0) may benefit from cognitive-behavioral therapy and psychosocial support;
- Patients with multiple cardiovascular comorbidities and low SF-36 scores (Cluster 2) may require comprehensive lifestyle interventions alongside pharmacological treatment;
- Middle-aged patients with moderate arrhythmia burden (Cluster 1) may need a combination of lifestyle modifications and pharmacological therapy.
4.4. AI Integration and Future Perspectives in Daily Practice
4.4.1. Utility of AI for Early Detection and Management
- Stratify risk: Instead of relying solely on periodic clinical evaluation, AI models provide continuous updates on which individuals are at higher risk for depression or deteriorating QoL.
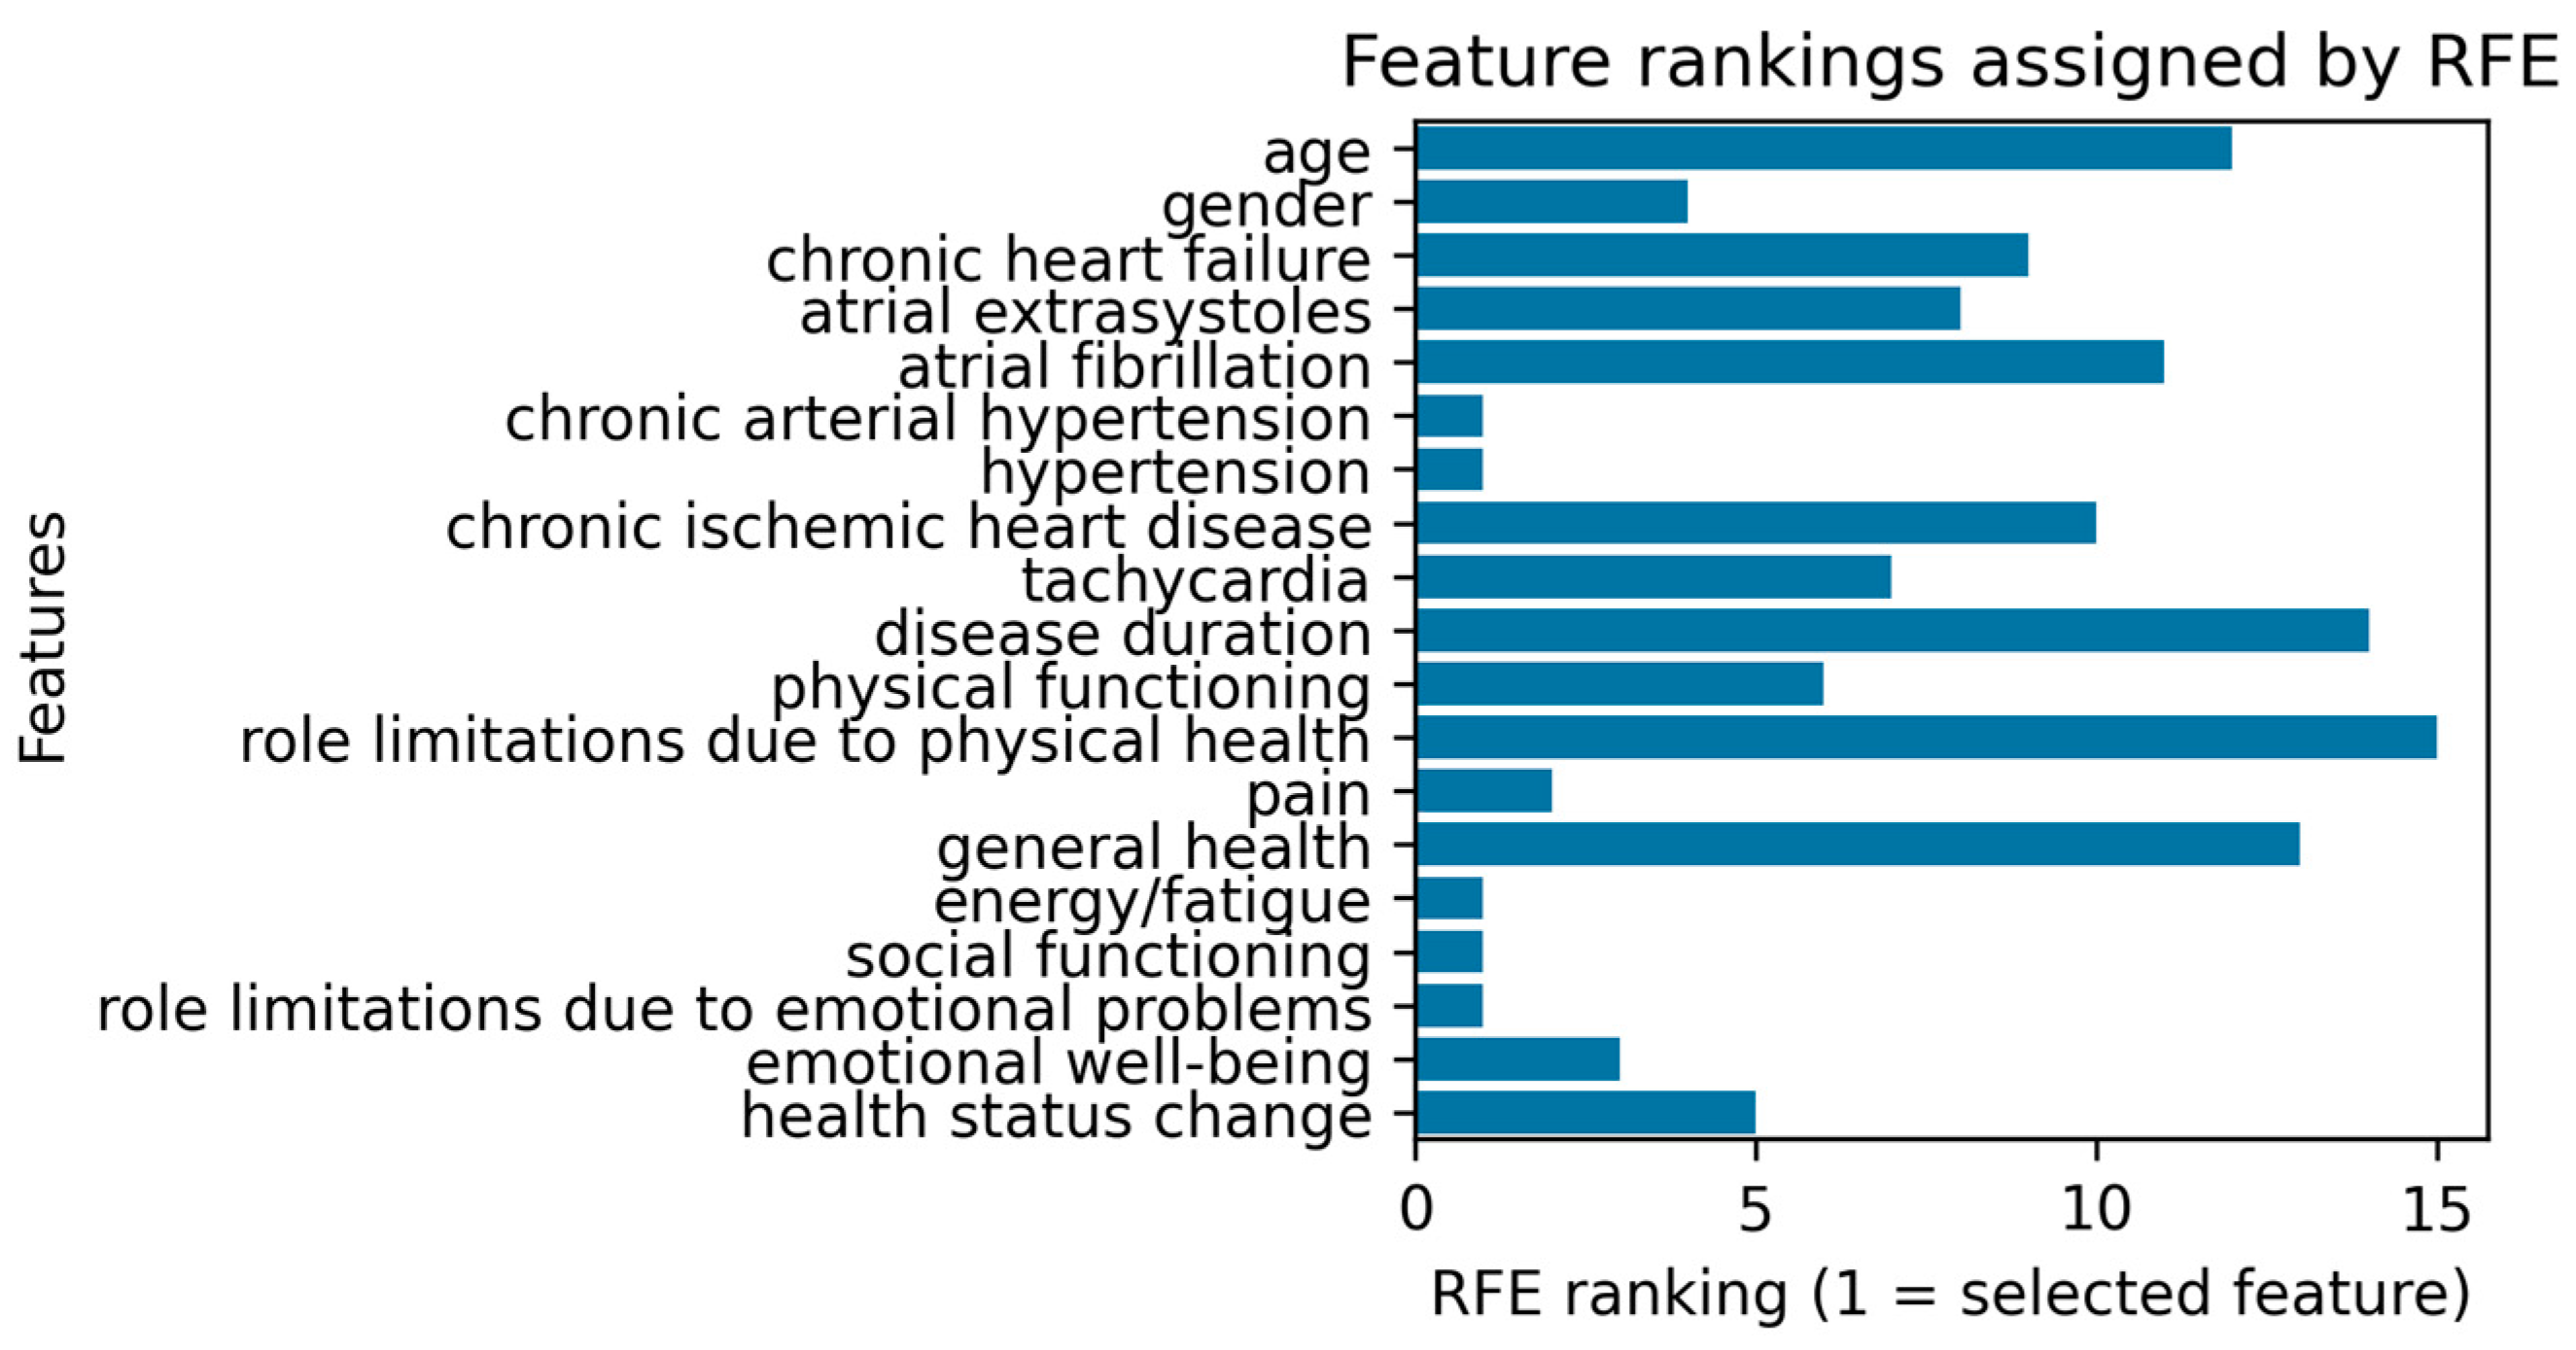
- Guide personalized care: By highlighting variables most influential to depression (e.g., fatigue, role limitations due to emotional problems), the models can inform targeted interventions such as cognitive behavioral therapy, counseling, or closer monitoring for arrhythmia decompensations.
- Optimize resource allocation: Healthcare systems can concentrate psychosocial support on patients with the greatest immediate need, thereby improving outcomes and potentially reducing hospital admissions.
4.4.2. Incorporating AI into Routine Practice
- Implementation in EHR systems: Embedding logistic regression and XGBoost algorithms directly into EHRs to automatically evaluate PHQ-9 or SF-36 data once entered.
- Interdisciplinary collaboration: Encouraging psychiatrists, psychologists, and cardiologists to jointly review AI-generated risk scores, ensuring comprehensive care plans.
- Patient education and engagement: Providing user-friendly dashboards or mobile apps that visualize risk levels and recommended actions, motivating patients to adhere to therapy and lifestyle modifications.
- Continuous refinement: Periodic re-training of models with new patient data to maintain predictive accuracy and adapt to evolving patient profiles over time.
4.4.3. Limitations and Outlook
5. Conclusions
Author Contributions
Funding
Institutional Review Board Statement
Informed Consent Statement
Data Availability Statement
Conflicts of Interest
Abbreviations
| AI | Artificial intelligence |
| AUC | Area under the curve |
| CVDs | Cardiovascular diseases |
| DL | Deep learning |
| ECG | Electrocardiogram |
| HPA | Hypothalamic-pituitary-adrenal |
| HTA | Hypertension (arterial) |
| IQR | Interquartile range |
| K-means | K-means clustering |
| ML | Machine learning |
| MCS | Mental component summary (from SF-36) |
| PCA | Principal component analysis |
| PCS | Physical component summary (from SF-36) |
| PHQ-9 | Patient health questionnaire-9 |
| QoL | Quality of life |
| ROC | Receiver operating characteristic |
| RFE | Recursive feature elimination |
| SD | Standard deviation |
| SF-36 | Short form-36 health survey |
| SMOTE | Synthetic minority over-sampling technique |
| XGBoost | Extreme gradient boosting |
References
- Nagpal, A.K.; Pundkar, A.; Singh, A.; Gadkari, C. Cardiac Arrhythmias and Their Management: An In-Depth Review of Current Practices and Emerging Therapies. Cureus 2024, 16, e66549. [Google Scholar] [CrossRef] [PubMed] [PubMed Central]
- Antzelevitch, C.; Burashnikov, A. Overview of Basic Mechanisms of Cardiac Arrhythmia. Card. Electrophysiol. Clin. 2011, 3, 23–45. [Google Scholar] [CrossRef] [PubMed] [PubMed Central]
- Garg, K.; Satti, D.I.; Yadav, R.; Brumfield, J.; Akwanalo, C.O.; Mesubi, O.O.; Cooper, L.A.; Nabih, M.A.; Sogade, F.; Bloomfield, G.S.; et al. Global Health Inequities in Electrophysiology Care: A State-of-the-Art Review. JACC Adv. 2024, 3, 101387. [Google Scholar] [CrossRef] [PubMed] [PubMed Central]
- Peacock, J.; Whang, W. Psychological distress and arrhythmia: Risk prediction and potential modifiers. Prog. Cardiovasc. Dis. 2013, 55, 582–589. [Google Scholar] [CrossRef] [PubMed] [PubMed Central]
- Srinivas, S.; Rk, B.V.; Ayinapudi, V.N.; Govindarajan, A.; Sundaram, S.S.; Priyathersini, N. Neurological Consequences of Cardiac Arrhythmias: Relationship Between Stroke, Cognitive Decline, and Heart Rhythm Disorders. Cureus 2024, 16, e57159. [Google Scholar] [CrossRef] [PubMed] [PubMed Central]
- Hickey, K.T.; Reiffel, J.; Sciacca, R.R.; Whang, W.; Biviano, A.; Baumeister, M.; Castillo, C.; Talathothi, J.; Garan, H. Correlating perceived arrhythmia symptoms and quality of life in an older population with heart failure: A prospective, single centre, urban clinic study. J. Clin. Nurs. 2013, 22, 434–444. [Google Scholar] [CrossRef] [PubMed] [PubMed Central]
- Megari, K. Quality of Life in Chronic Disease Patients. Health Psychol. Res. 2013, 1, e27. [Google Scholar] [CrossRef] [PubMed] [PubMed Central]
- Fulga, I.; Musat, C.; Crassas, R.; Ceavdari, N. Child Sexual Abuse: Offender’s Modus Operandi Aspects in Intra-Aggressional Period. Rom. J. Leg. Med. 2008, 16, 31. [Google Scholar] [CrossRef]
- Wang, J.; Wang, Q.; Bao, Z.; Peng, Y.; Liu, S.; Yu, T.; Wang, L.; Yang, G.; Gao, M.; Sun, G. The Combined Effects of Patient Activation and Relational Aspects on the Quality of Life in Atrial Fibrillation Patients. Front. Psychol. 2021, 12, 761149. [Google Scholar] [CrossRef]
- Légaré, F.; Adekpedjou, R.; Stacey, D.; Turcotte, S.; Kryworuchko, J.; Graham, I.D.; Lyddiatt, A.; Politi, M.C.; Thomson, R.; Elwyn, G.; et al. Interventions for increasing the use of shared decision making by healthcare professionals. Cochrane Database Syst. Rev. 2018, 2018, CD006732. [Google Scholar] [CrossRef] [PubMed] [PubMed Central]
- Jenkinson, C.; Coulter, A.; Wright, L. Short form 36 (SF36) health survey questionnaire: Normative data for adults of working age. BMJ 1993, 306, 1437–1440. [Google Scholar] [CrossRef] [PubMed] [PubMed Central]
- Kroenke, K.; Spitzer, R.L.; Williams, J.B. The PHQ-9: Validity of a brief depression severity measure. J. Gen. Intern. Med. 2001, 16, 606–613. [Google Scholar] [CrossRef] [PubMed] [PubMed Central]
- Brown, N.; Melville, M.; Gray, D.; Young, T.; Skene, A.; Hampton, J. Comparison of the SF-36 health survey questionnaire with the Nottingham Health Profile in long-term survivors of a myocardial infarction. J. Public Health 2000, 22, 167–175. [Google Scholar] [CrossRef] [PubMed]
- Borkowski, P.; Borkowska, N. Understanding Mental Health Challenges in Cardiovascular Care. Cureus 2024, 16, e54402. [Google Scholar] [CrossRef] [PubMed] [PubMed Central]
- Pizzi, C.; Santarella, L.; Costa, M.G.; Manfrini, O.; E Flacco, M.; Capasso, L.; Chiarini, S.; Di Baldassarre, A.; Manzoli, L. Pathophysiological mechanisms linking depression and atherosclerosis: An overview. J. Biol. Regul. Homeost. Agents 2012, 26, 775–782. [Google Scholar] [PubMed]
- BBonnet, F.; Irving, K.; Terra, J.-L.; Nony, P.; Berthezène, F.; Moulin, P. Anxiety and depression are associated with unhealthy lifestyle in patients at risk of cardiovascular disease. Atherosclerosis 2005, 178, 339–344. [Google Scholar] [CrossRef] [PubMed]
- Agarwal, S.; Birk, J.L.; Abukhadra, S.L.; Rojas, D.A.; Cornelius, T.M.; Bergman, M.; Chang, B.P.; Edmondson, D.E.; Kronish, I.M. Psychological Distress After Sudden Cardiac Arrest and Its Impact on Recovery. Curr. Cardiol. Rep. 2022, 24, 1351–1360. [Google Scholar] [CrossRef] [PubMed] [PubMed Central]
- Jha, M.K.; Qamar, A.; Vaduganathan, M.; Charney, D.S.; Murrough, J.W. Screening and Management of Depression in Patients with Cardiovascular Disease: JACC State-of-the-Art Review. J. Am. Coll. Cardiol. 2019, 73, 1827–1845. [Google Scholar] [CrossRef] [PubMed] [PubMed Central]
- Ware, J.E., Jr.; Sherbourne, C.D. The MOS 36-item short-form health survey (SF-36). I. Conceptual framework and item selection. Med. Care 1992, 30, 473–483. [Google Scholar] [PubMed]
- Farivar, S.S.; E Cunningham, W.; Hays, R.D. Correlated physical and mental health summary scores for the SF-36 and SF-12 Health Survey, V.I. Health Qual. Life Outcomes 2007, 5, 54. [Google Scholar] [CrossRef] [PubMed] [PubMed Central]
- Ford, J.; Thomas, F.; Byng, R.; McCabe, R. Use of the Patient Health Questionnaire (PHQ-9) in Practice: Interactions between patients and physicians. Qual. Health Res. 2020, 30, 2146–2159. [Google Scholar] [CrossRef] [PubMed] [PubMed Central]
- Pantelidis, P.; Oikonomou, E.; Gialamas, I.; Goliopoulou, A.; Sarantos, S.; Zakynthinos, G.E.; Anastasiou, A.; Gounaridi, M.I.; Kalogeras, K.; Siasos, G. Decoding the heart: How artificial intelligence is transforming cardiology. J. Med Artif. Intell. 2025, 8, 9. [Google Scholar] [CrossRef]
- Nechita, L.C.; Nechita, A.; Voipan, A.E.; Voipan, D.; Debita, M.; Fulga, A.; Fulga, I.; Musat, C.L. AI-Enhanced ECG Applications in Cardiology: Comprehensive Insights from the Current Literature with a Focus on COVID-19 and Multiple Cardiovascular Conditions. Diagnostics 2024, 14, 1839. [Google Scholar] [CrossRef] [PubMed]
- Nechita, L.C.; Tutunaru, D.; Nechita, A.; Voipan, A.E.; Voipan, D.; Ionescu, A.M.; Drăgoiu, T.S.; Musat, C.L. A Resting ECG Screening Protocol Improved with Artificial Intelligence for the Early Detection of Cardiovascular Risk in Athletes. Diagnostics 2025, 15, 477. [Google Scholar] [CrossRef] [PubMed]
- Iyortsuun, N.K.; Kim, S.-H.; Jhon, M.; Yang, H.-J.; Pant, S. A Review of Machine Learning and Deep Learning Approaches on Mental Health Diagnosis. Healthcare 2023, 11, 285. [Google Scholar] [CrossRef]
- Cooksey, R.W. Descriptive Statistics for Summarising Data. In Illustrating Statistical Procedures: Finding Meaning in Quantitative Data; Springer: Singapore, 2020; pp. 61–139. [Google Scholar] [CrossRef] [PubMed Central]
- Manikandan, S. Measures of central tendency: Median and mode. J. Pharmacol. Pharmacother. 2011, 2, 214–215. [Google Scholar] [CrossRef] [PubMed] [PubMed Central]
- Jones, P.R. Detecting statistical outliers in psychophysical data. Atten. Percept. Psychophys. 2019, 81, 1189–1196. [Google Scholar] [CrossRef]
- Rochon, J.; Gondan, M.; Kieser, M. To test or not to test: Preliminary assessment of normality when comparing two independent samples. BMC Med Res. Methodol. 2012, 12, 81. [Google Scholar] [CrossRef]
- Ghasemi, A.; Zahediasl, S. Normality tests for statistical analysis: A guide for non-statisticians. Int. J. Endocrinol. Metab. 2012, 10, 486–489. [Google Scholar] [CrossRef] [PubMed] [PubMed Central]
- Zhang, B.; Zhang, Y. Mann-Whitney U test and Kruskal-Wallis test should be used for comparisons of differences in medians, not means: Comment on the article by van der Helm-van Mil et al. Arthritis Rheum. 2009, 60, 1565. [Google Scholar] [CrossRef]
- Rivas-Ruiz, R.; Moreno-Palacios, J.; Talavera, J.O. Investigación clínica XVI. Diferencias de medianas con la U de Mann-Whitney [Clinical research XVI. Differences between medians with the Mann-Whitney U test]. Rev. Med. Inst. Mex. Seguro Soc. 2013, 51, 414–419. (In Spanish) [Google Scholar] [PubMed]
- McHugh, M.L. The chi-square test of independence. Biochem. Med. 2013, 23, 143–149. [Google Scholar] [CrossRef] [PubMed] [PubMed Central]
- Griffin, M.; Mitchell-Gillespie, B.; Hashim, H.; AlHeresh, R. Predicting Depression among Jordanian Adults with Disabilities According to the International Classification of Functioning, Disability and Health: A Pilot Study. Disabilities 2021, 1, 450–458. [Google Scholar] [CrossRef]
- Ostertagová, E.; Ostertag, O.; Kováč, J. Methodology and Application of the Kruskal-Wallis Test. Appl. Mech. Mater. 2014, 611, 115–120. [Google Scholar] [CrossRef]
- Pearce, G.; Frisbie, D. Statistical evaluation of biomedical studies. Osteoarthr. Cartil. 2010, 18, S117–S122. [Google Scholar] [CrossRef]
- Galper, D.I.; Trivedi, M.H.; Barlow, C.E.; Dunn, A.L.; Kampert, J.B. Inverse Association between Physical Inactivity and Mental Health in Men and Women. Med. Sci. Sports Exerc. 2006, 38, 173–178. [Google Scholar] [CrossRef]
- Zar, J.H. Spearman Rank Correlation. In Encyclopedia of Biostatistics; Wiley: Hoboken, NJ, USA, 2005. [Google Scholar] [CrossRef]
- Hao, J.; Wang, Y.; Wang, Y.; Zhang, J.; Gao, J.; Kang, L.; Wang, X.; Yang, J.; Zhang, L.; Liu, J. Analysis of influencing factors on quality of life in patients with chronic kidney disease undergoing maintenance haemodialysis. Heliyon 2024, 10, e25817. [Google Scholar] [CrossRef] [PubMed]
- Tavakol, M.; Wetzel, A. Factor Analysis: A means for theory and instrument development in support of construct validity. Int. J. Med Educ. 2020, 11, 245–247. [Google Scholar] [CrossRef] [PubMed] [PubMed Central]
- Karamizadeh, S.; Abdullah, S.M.; Manaf, A.A.; Zamani, M.; Hooman, A. An Overview of Principal Component Analysis. J. Signal Inf. Process. 2013, 4, 173–175. [Google Scholar] [CrossRef]
- Wu, J. Cluster Analysis and K-means Clustering: An Introduction. In Advances in K-Means Clustering; Springer: Berlin/Heidelberg, Germany, 2012. [Google Scholar] [CrossRef]
- Mohammadi, T.; D′Ascenzo, F.; Pepe, M.; Zanghì, S.B.; Bernardi, M.; Spadafora, L.; Frati, G.; Peruzzi, M.; De Ferrari, G.M.; Biondi-Zoccai, G. Unsupervised Machine Learning with Cluster Analysis in Patients Discharged after an Acute Coronary Syndrome: Insights from a 23,270-Patient Study. Am. J. Cardiol. 2023, 193, 44–51. [Google Scholar] [CrossRef]
- Yadav, A. A Survey on Unsupervised Clustering Algorithm based on K-Means Clustering. Int. J. Comput. Appl. 2017, 156, 975–8887. [Google Scholar] [CrossRef]
- Maalouf, M. Logistic regression in data analysis: An overview. Int. J. Data Anal. Tech. Strat. 2011, 3, 281–299. [Google Scholar] [CrossRef]
- Shaha, T.R.; Begum, M.; Uddin, J.; Torres, V.Y.; Iturriaga, J.A.; Ashraf, I.; Samad, A. Feature group partitioning: An approach for depression severity prediction with class balancing using machine learning algorithms. BMC Med. Res. Methodol. 2024, 24, 123. [Google Scholar] [CrossRef] [PubMed] [PubMed Central]
- Bentéjac, C.; Csörgő, A.; Martínez-Muñoz, G. A Comparative Analysis of XGBoost. arXiv 2019, arXiv:911.01914. [Google Scholar]
- Nickson, D.; Meyer, C.; Walasek, L.; Toro, C. Prediction and diagnosis of depression using machine learning with electronic health records data: A systematic review. BMC Med. Inform. Decis. Mak. 2023, 23, 271. [Google Scholar] [CrossRef] [PubMed] [PubMed Central]
- Musat, C.L.; Mereuta, C.; Nechita, A.; Tutunaru, D.; Voipan, A.E.; Voipan, D.; Mereuta, E.; Gurau, T.V.; Gurău, G.; Nechita, L.C. Diagnostic Applications of AI in Sports: A Comprehensive Review of Injury Risk Prediction Methods. Diagnostics 2024, 14, 2516. [Google Scholar] [CrossRef]
- Antoun, I.; Layton, G.R.; Nizam, A.; Barker, J.; Abdelrazik, A.; Eldesouky, M.; Koya, A.; Lau, E.Y.M.; Zakkar, M.; Somani, R.; et al. Hypertension and Atrial Fibrillation: Bridging the Gap Between Mechanisms, Risk, and Therapy. Medicina 2025, 61, 362. [Google Scholar] [CrossRef]
- Senoo, K.; Yukawa, A.; Ohkura, T.; Iwakoshi, H.; Nishimura, T.; Teramukai, S.; Narumoto, J.; Matoba, S. Depression and quality of life in older adults with atrial fibrillation: A cross-sectional community-based study. Geriatr. Gerontol. Int. 2022, 22, 505–510. [Google Scholar] [CrossRef]
- Fang, S.; Zhang, W. Heart–Brain Axis: A Narrative Review of the Interaction between Depression and Arrhythmia. Biomedicines 2024, 12, 1719. [Google Scholar] [CrossRef]


| Subsection | Analysis/Method | Results |
|---|---|---|
| 3.1.1. SF-36 | SF-36 questionnaire analysis | Group 1: Physical health = 67.72 (SD), Mental health = 73.79 (SD); |
| Group 2: Physical health = 61.48 (SD), Mental health = 66.37 (SD) | ||
| 3.1.2. PHQ-9 | PHQ-9 depression severity analysis | Group 1: Mean PHQ-9 score = 4.81 (mild); |
| Group 2: Mean PHQ-9 score = 6.19 (moderate) | ||
| 3.1.3. Correlation between tests | Correlation analysis between SF-36 and PHQ-9 | Negative correlation: PHQ-9 & SF-36 Physical Health (−0.32); PHQ-9 & SF-36 Mental Health (−0.44) |
| Section | Analysis/Method | Results |
|---|---|---|
| 3.2.1. Descriptive statistical analysis | Descriptive statistics | Physical functioning: Mean = 76.77 (SD = 28.74), Median = 90.0, IQR = 35.0; PHQ-9: Mean = 5.03 (SD = 4.55), Median = 4.0, IQR = 5.0 |
| 3.2.2. Normality test, group comparisons, and association analysis | Shapiro–Wilk test | All clinical scores non-normal (p ≤ 0.05) |
| Mann–Whitney U test | Significant differences (p ≤ 0.05) between patients with and without depression across all SF-36 dimensions except health status change. | |
| Chi-square test | No significant association (p > 0.05) between depression and arrhythmia types | |
| 3.2.3. Kruskal–Wallis test, and Spearman’s correlation | Kruskal–Wallis test | Significant differences (p ≤ 0.05) in all SF-36 dimensions across PHQ-9 categories |
| Spearman’s correlation | Significant negative correlations (p ≤ 0.05) between PHQ-9 and SF-36 dimensions, strongest in energy/fatigue (ρ = −0.45), social functioning (ρ = −0.47), and role limitations due to emotional problems (ρ = −0.48) | |
| 3.2.4. Linear regression analysis | Regression model | Disease duration influenced QoL scores; Mean disease duration = 3.04 years (SD = 2.70), Mean age = 51.27 years (SD = 12.11), Sample: 102 females, 41 males |
| Section | Analysis/Method | Results |
|---|---|---|
| 3.3.1. Descriptive analysis of demographic data | Descriptive statistics (age, gender, disease duration) | Mean age: 51.27 years (SD = 12.11), Range: 24–80 years, IQR: 16.5 years; Mean disease duration: 3.04 years (SD = 2.70), Range: 1–12 years, IQR: 3.0 years; Gender: Female (102, 71.3%), Male (41, 28.7%) |
| 3.3.2. Chi-square test | Association between gender, age groups, and depression severity | No significant association between gender and depression (χ2 = 2.36, p = 0.67); Significant association between age groups and depression severity (χ2 = 16.30, p = 0.038) |
| 3.3.3. Trend test | Kruskal–Wallis test for variation of PHQ-9 scores by age and disease duration | Significant variation in depression scores by age (χ2 = 8.46, p = 0.015); No significant variation based on disease duration (χ2 = 7.11, p = 0.068) |
| 3.3.4. Linear regression analysis | Impact of demographic factors on clinical scores | Age significantly predicted PHQ-9 scores (χ2 = 8.46, p = 0.015); Disease duration had no significant effect on PHQ-9 scores (χ2 = 7.11, p = 0.068) |
| 3.3.5. PCA | Dimensionality reduction to identify key demographic variables | First three PCs explained 58.65%, 26.92%, and 14.43% of variance; Disease duration and gender were the most influential demographic factors. |
| Metric | Class 0 (No Depression) | Class 1 (Depression) | Macro Average | Weighted Average |
|---|---|---|---|---|
| Precision | 1.00 | 0.60 | 0.80 | 0.96 |
| Recall | 0.92 | 1.00 | 0.96 | 0.93 |
| F1-score | 0.96 | 0.75 | 0.85 | 0.94 |
| Accuracy | 0.93 | |||
| AI Model | Key Findings | Performance Metrics |
|---|---|---|
| 3.4.1. K-means clustering | Identified three patient clusters based on age, gender, and disease duration. | Cluster 0: Age 47.7, Disease Duration 1.91 years, Predominantly Female |
| Cluster 1: Age 52.9, Disease Duration 3.24 years, Predominantly Male | ||
| Cluster 2: Age 68.4, Disease Duration 9.19 years, Mixed Gender | ||
| 3.4.2. Logistic regression | Achieved 93% accuracy in predicting depression based on clinical and demographic data. | Precision: 1.00 (No depression), 0.60 (Depression) |
| Recall: 0.92 (No depression), 1.00 (Depression) | ||
| F1-score: 0.96 (No depression), 0.75 (Depression) | ||
| 3.4.3. XGBoost regression | Achieved AUC of 0.97, demonstrating strong predictive capability for depression severity. | AUC: 0.97 Strong classification ability, effectively distinguishing between depressed and non-depressed patients. |
Disclaimer/Publisher’s Note: The statements, opinions and data contained in all publications are solely those of the individual author(s) and contributor(s) and not of MDPI and/or the editor(s). MDPI and/or the editor(s) disclaim responsibility for any injury to people or property resulting from any ideas, methods, instructions or products referred to in the content. |
© 2025 by the authors. Licensee MDPI, Basel, Switzerland. This article is an open access article distributed under the terms and conditions of the Creative Commons Attribution (CC BY) license (https://creativecommons.org/licenses/by/4.0/).
Share and Cite
Nechita, L.C.; Tupu, A.E.; Nechita, A.; Voipan, D.; Voipan, A.E.; Tutunaru, D.; Musat, C.L. The Impact of Quality of Life on Cardiac Arrhythmias: A Clinical, Demographic, and AI-Assisted Statistical Investigation. Diagnostics 2025, 15, 856. https://doi.org/10.3390/diagnostics15070856
Nechita LC, Tupu AE, Nechita A, Voipan D, Voipan AE, Tutunaru D, Musat CL. The Impact of Quality of Life on Cardiac Arrhythmias: A Clinical, Demographic, and AI-Assisted Statistical Investigation. Diagnostics. 2025; 15(7):856. https://doi.org/10.3390/diagnostics15070856
Chicago/Turabian StyleNechita, Luiza Camelia, Ancuta Elena Tupu, Aurel Nechita, Daniel Voipan, Andreea Elena Voipan, Dana Tutunaru, and Carmina Liana Musat. 2025. "The Impact of Quality of Life on Cardiac Arrhythmias: A Clinical, Demographic, and AI-Assisted Statistical Investigation" Diagnostics 15, no. 7: 856. https://doi.org/10.3390/diagnostics15070856
APA StyleNechita, L. C., Tupu, A. E., Nechita, A., Voipan, D., Voipan, A. E., Tutunaru, D., & Musat, C. L. (2025). The Impact of Quality of Life on Cardiac Arrhythmias: A Clinical, Demographic, and AI-Assisted Statistical Investigation. Diagnostics, 15(7), 856. https://doi.org/10.3390/diagnostics15070856