
Association Between Mandibular Cortical Erosion and Bone Mineral Density Assessed by Phalangeal Ultrasound and Dual Energy X-Ray Absorptiometry in Spanish Women

 , , , , ,
  , , and
Abstract
1. Introduction
2. Methods
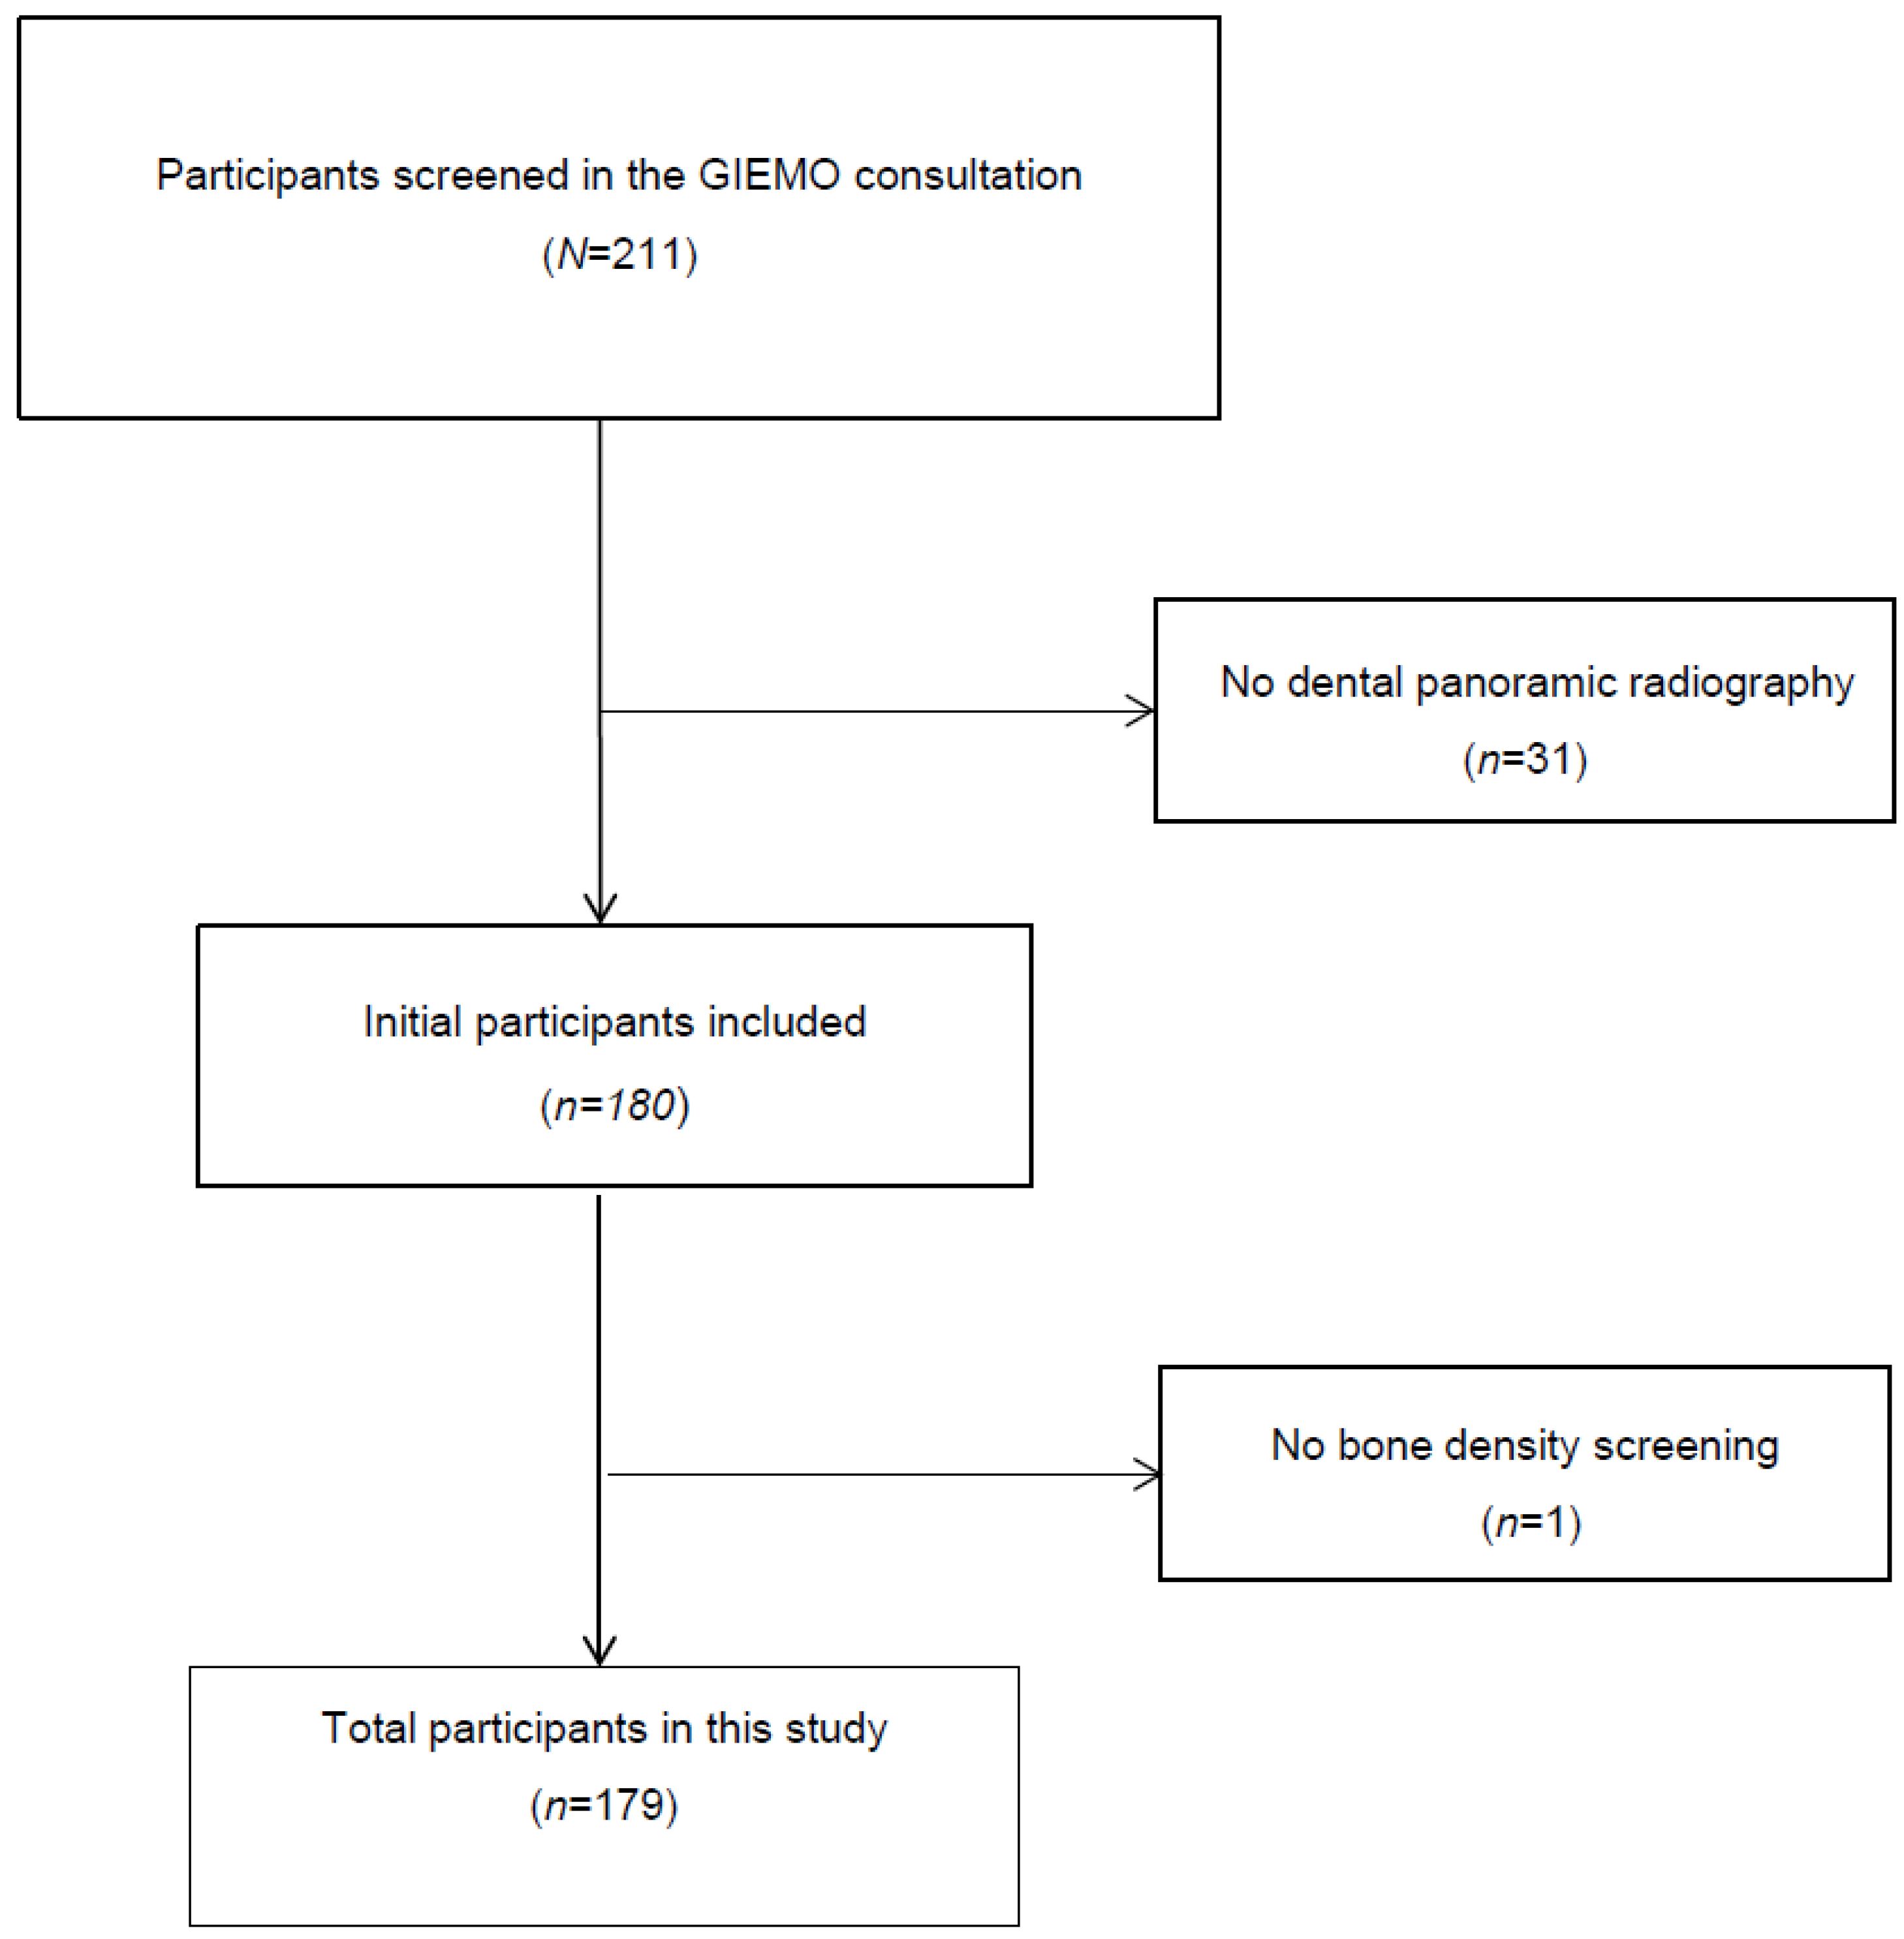
2.1. Study Sample
2.2. Study Variables
2.3. Mandibular Cortical Assessment
2.4. Bone Mineral Density Assessments
2.5. Statistical Analysis
3. Results
4. Discussion
5. Conclusions
Author Contributions
Funding
Institutional Review Board Statement
Informed Consent Statement
Data Availability Statement
Conflicts of Interest
References
- Consensus Development Conference on Osteoporosis. Hong Kong, April 1–2, 1993. Am. J. Med. 1993, 95, 1S–78S.
- NIH Consensus Development Panel on Osteoporosis Prevention, Diagnosis, and Therapy, March 7–29, 2000: Highlights of the Conference. South Med. J. 2001, 94, 569–573. [CrossRef]
- Slart, R.H.J.A.; Punda, M.; Ali, D.S.; Bazzocchi, A.; Bock, O.; Camacho, P.; Carey, J.J.; Colquhoun, A.; Compston, J.; Engelke, K.; et al. Updated Practice Guideline for Dual-Energy X-Ray Absorptiometry (DXA). Eur. J. Nucl. Med. Mol. Imaging 2025, 52, 539–563. [Google Scholar] [CrossRef] [PubMed]
- Khan, A.A.; Slart, R.H.J.A.; Ali, D.S.; Bock, O.; Carey, J.J.; Camacho, P.; Engelke, K.; Erba, P.A.; Harvey, N.C.; Lems, W.F.; et al. Osteoporotic Fractures: Diagnosis, Evaluation, and Significance From the International Working Group on DXA Best Practices. Mayo Clin. Proc. 2024, 99, 1127–1141. [Google Scholar] [CrossRef]
- Kanis, J.A.; Cooper, C.; Rizzoli, R.; Reginster, J.Y. European Guidance for the Diagnosis and Management of Osteoporosis in Postmenopausal Women. Osteoporos. Int. 2019, 30, 3–44. [Google Scholar] [CrossRef]
- Marín, F.; González-Macías, J.; Díez-Pérez, A.; Palma, S.; Delgado-Rodríguez, M. Relationship between Bone Quantitative Ultrasound and Fractures: A Meta-Analysis. J. Bone Miner. Res. 2006, 21, 1126–1135. [Google Scholar] [CrossRef]
- Dobnig, H.; Piswanger-Sölkner, J.C.; Obermayer-Pietsch, B.; Tiran, A.; Strele, A.; Maier, E.; Maritschnegg, P.; Riedmüller, G.; Brueck, C.; Fahrleitner-Pammer, A. Hip and Nonvertebral Fracture Prediction in Nursing Home Patients: Role of Bone Ultrasound and Bone Marker Measurements. J. Clin. Endocrinol. Metab. 2007, 92, 1678–1686. [Google Scholar] [CrossRef]
- Lee, S.J.; Graffy, P.M.; Zea, R.D.; Ziemlewicz, T.J.; Pickhardt, P.J. Future Osteoporotic Fracture Risk Related to Lumbar Vertebral Trabecular Attenuation Measured at Routine Body CT. J. Bone Miner. Res. 2018, 33, 860–867. [Google Scholar] [CrossRef]
- Cortet, B.; Dennison, E.; Diez-Perez, A.; Locquet, M.; Muratore, M.; Nogués, X.; Ovejero Crespo, D.; Quarta, E.; Brandi, M.L. Radiofrequency Echographic Multi Spectrometry (REMS) for the Diagnosis of Osteoporosis in a European Multicenter Clinical Context. Bone 2021, 143, 115786. [Google Scholar] [CrossRef]
- Calciolari, E.; Donos, N.; Park, J.C.; Petrie, A.; Mardas, N. Panoramic Measures for Oral Bone Mass in Detecting Osteoporosis: A Systematic Review and Meta-Analysis. J. Dent. Res. 2015, 94, 17S–27S. [Google Scholar] [CrossRef]
- Kinalski, M.A.; Boscato, N.; Damian, M.F. The Accuracy of Panoramic Radiography as a Screening of Bone Mineral Density in Women: A Systematic Review. Dentomaxillofacial Radiol. 2020, 49, 20190149. [Google Scholar] [CrossRef] [PubMed]
- Mupparapu, M.; Akintoye, S.O. Application of Panoramic Radiography in the Detection of Osteopenia and Osteoporosis—Current State of the Art. Curr. Osteoporos. Rep. 2023, 21, 354–359. [Google Scholar] [CrossRef]
- Tounta, T.S. Diagnosis of Osteoporosis in Dental Patients. J. Frailty Sarcopenia Falls 2017, 2, 21–27. [Google Scholar] [CrossRef]
- Klemetti, E.; Kolmakow, S. Morphology of the Mandibular Cortex on Panoramic Radiographs as an Indicator of Bone Quality. Dentomaxillofacial Radiol. 1997, 26, 22–25. [Google Scholar] [CrossRef]
- Taguchi, A.; Tanaka, R.; Kakimoto, N.; Morimoto, Y.; Arai, Y.; Hayashi, T.; Kurabayashi, T.; Katsumata, A.; Asaumi, J. Clinical Guidelines for the Application of Panoramic Radiographs in Screening for Osteoporosis. Oral Radiol. 2021, 37, 189–208. [Google Scholar] [CrossRef]
- Grocholewicz, K.; Janiszewska-Olszowska, J.; Aniko-Włodarczyk, M.; Preuss, O.; Trybek, G.; Sobolewska, E.; Lipski, M. Panoramic Radiographs and Quantitative Ultrasound of the Radius and Phalanx III to Assess Bone Mineral Status in Postmenopausal Women. BMC Oral Health 2018, 18, 127. [Google Scholar] [CrossRef]
- Leite, A.F.; Figueiredo, P.T.d.S.; Guia, C.M.; Melo, N.S.; de Paula, A.P. Correlations between Seven Panoramic Radiomorphometric Indices and Bone Mineral Density in Postmenopausal Women. Oral Surg. Oral Med. Oral Pathol. Oral Radiol. 2010, 109, 449–456. [Google Scholar] [CrossRef]
- Craig, C.L.; Marshall, A.L.; Sjöström, M.; Bauman, A.E.; Booth, M.L.; Ainsworth, B.E.; Pratt, M.; Ekelund, U.; Yngve, A.; Sallis, J.F.; et al. International Physical Activity Questionnaire: 12-Country Reliability and Validity. Med. Sci. Sports Exerc. 2003, 35, 1381–1395. [Google Scholar] [CrossRef]
- Salas-Salvadó, J.; Rubio, M.A.; Barbany, M.; Moreno, B.; Aranceta, J.; Bellido, D.; Blay, V.; Carraro, R.; Formiguera, X.; Foz, M.; et al. SEEDO 2007 Consensus for the Evaluation of Overweight and Obesity and the Establishment of Therapeutic Intervention Criteria. Med. Clin. 2007, 128, 184–196. [Google Scholar] [CrossRef]
- World Health Organization. Assessment of Fracture Risk and Its Application to Screening for Postmenopausal Osteoporosis. Report of a WHO Study Group. World Health Organ. Tech. Rep. Ser. 1994, 843, 1–129. [Google Scholar]
- Riancho, J.A.; Peris, P.; González-Macías, J.; Pérez-Castrillón, J.L. Executive Summary Clinical Practice Guideline of Postmenopausal, Glucocortcioid-Induced and Male Osteoporosis (2022 Update). Spanish Society for Bone and Mineral Metabolism Investigation (SEIOMM). Rev. Clínica Española (Engl. Ed.) 2022, 222, 432–439. [Google Scholar] [CrossRef]
- Dimai, H.P.; Muschitz, C.; Amrein, K.; Bauer, R.; Cejka, D.; Gasser, R.W.; Gruber, R.; Haschka, J.; Hasenöhrl, T.; Kainberger, F.; et al. Osteoporose—Definition, Risikoerfassung, Diagnose, Prävention Und Therapie (Update 2024): Leitlinie Der Österreichischen Gesellschaft Für Knochen- Und Mineralstoffwechsel. Wien. Klin. Wochenschr. 2024, 136, 599–668. [Google Scholar] [CrossRef] [PubMed]
- Corrao, G.; Biffi, A.; Porcu, G.; Ronco, R.; Adami, G.; Alvaro, R.; Bogini, R.; Caputi, A.P.; Cianferotti, L.; Frediani, B.; et al. Executive Summary: Italian Guidelines for Diagnosis, Risk Stratification, and Care Continuity of Fragility Fractures 2021. Front. Endocrinol. 2023, 14, 1137671. [Google Scholar] [CrossRef] [PubMed]
- Hodson, J.; Marsh, J. Quantitative Ultrasound and Risk Factor Enquiry as Predictors of Postmenopausal Osteoporosis: Comparative Study in Primary Care. Br. Med. J. 2003, 326, 1250–1251. [Google Scholar] [CrossRef] [PubMed]
- Stewart, A.; Reid, D.M. Quantitative Ultrasound or Clinical Risk Factors—Which Best Identifies Women at Risk of Osteoporosis? Br. J. Radiol. 2000, 73, 165–171. [Google Scholar] [CrossRef]
- Hans, D.; Métrailler, A.; Rodriguez, E.G.; Lamy, O.; Shevroja, E. Quantitative Ultrasound (QUS) in the Management of Osteoporosis and Assessment of Fracture Risk: An Update. Adv. Exp. Med. Biol. 2022, 1364, 7–34. [Google Scholar] [CrossRef]

| C1 (n = 48) | C2 (n = 97) | C3 (n = 34) | p-Value | |
|---|---|---|---|---|
| Age (years) | 56.0 [51.0–60.0] | 59 [55–63.5] | 62.5 [58.5–67.8] | 0.001 b,† |
| Gonadal status (%) | ||||
| Premenopausal | 9 (18.8%) | 13 (13.4%) | 1 (2.9%) | 0.105 ‡ |
| Postmenopausal | 39 (81.3%) | 84 (86.6%) | 33 (97.1%) | |
| Menarche age (years) | 12 [11–14] | 13 [12–14] | 12 [7.5–17.3] | 0.384 † |
| Years with menopause (years) | 5 [2–10] | 9 [4–13.8] | 12 [7.5–17.3] | 0.002 b,† |
| Gravidity (n) | 2 [0–3] | 2 [1.5–3] | 2 [0–3] | 0.253 † |
| Births (n) | 2 [0–2] | 2 [1,2] | 2 [0–2.3] | 0.270 † |
| Breastfeeding (months) | 3 [0–6.8] | 4 [0–10] | 3 [0–10] | 0.410 † |
| BMI (kg/m2) | 25.81 ± 4.21 | 27.31 ± 4.92 | 26.87 ± 4.58 | 0.205 * |
| Obesity (%) | 8 (16.7%) | 25 (25.8%) | 7 (20.6%) | 0.447 ‡ |
| WHR | 0.82 ± 0.06 | 0.82 ± 0.07 | 0.81 ± 0.06 | 0.660 * |
| % Body fat | 34.45 ± 6.28 | 35.99 ± 7.26 | 35.97 ± 6.71 | 0.438 * |
| Ca Supplementation (%) | 8 (16.7%) | 14 (14.4%) | 4 (11.8%) | 0.872 ‡ |
| Vitamin D Supplementation (%) | 9 (18.8%) | 9 (9.3%) | 2 (5.9%) | 0.298 ‡ |
| Current smoking (%) | 9 (18.8%) | 16 (16.5%) | 6 (17.6%) | 0.943 ‡ |
| Physical Activity (%) | ||||
| Sedentary | 15 (31.3%) | 28 (28.9%) | 7 (20.6%) | 0.825 ‡ |
| Moderate | 9 (18.8%) | 20 (20.6%) | 9 (26.5%) | |
| Active | 24 (50.0%) | 49 (50.5%) | 18 (52.9%) | |
| Tooth loss (n) | 0 [0–3.8] | 0 [0–5.5] | 5.5 [0–10.5] | 0.016 b,† |
| C1 (n = 48) | C2 (n = 97) | C3 (n = 34) | p-Value | p-Value & | |
|---|---|---|---|---|---|
| Quantitative bone ultrasound | |||||
| Ad-SOS (m/s) | 2073.52 ± 74.59 | 2022.41 ± 90.80 | 1975.43 ± 98.72 | <0.001 a,b,c,* | 0.007 a,b |
| UBPI | 0.66 ± 0.16 | 0.56 ± 0.18 | 0.47 ± 0.17 | <0.001 a,b,c,* | 0.005 a,b |
| BTT (μs) | 1.43 ± 0.22 | 1.34 ± 0.24 | 1.25 ± 0.29 | 0.007 b,* | 0.328 |
| BMD (gr/cm2) | |||||
| BMD femur neck | 0.804 ± 0.088 | 0.780 ± 0.110 | 0.714 ± 0.107 | <0.001 b,c,* | 0.012 b |
| BMD trochanter | 0.632 ± 0.081 | 0.630 ± 0.100 | 0.578 ± 0.091 | 0.014 b,c,* | 0.048 b |
| BMD lumbar spine (L2-L4) | 0.944 ± 0.128 | 0.936 ± 0.179 | 0.850 ± 0.167 | 0.020 b,c,* | 0.027 b |
| Osteoporosis diagnosis (%) | 5 (10.4%) | 24 (24.7%) | 15 (44.1%) | 0.002 a,b,c,‡ | - |
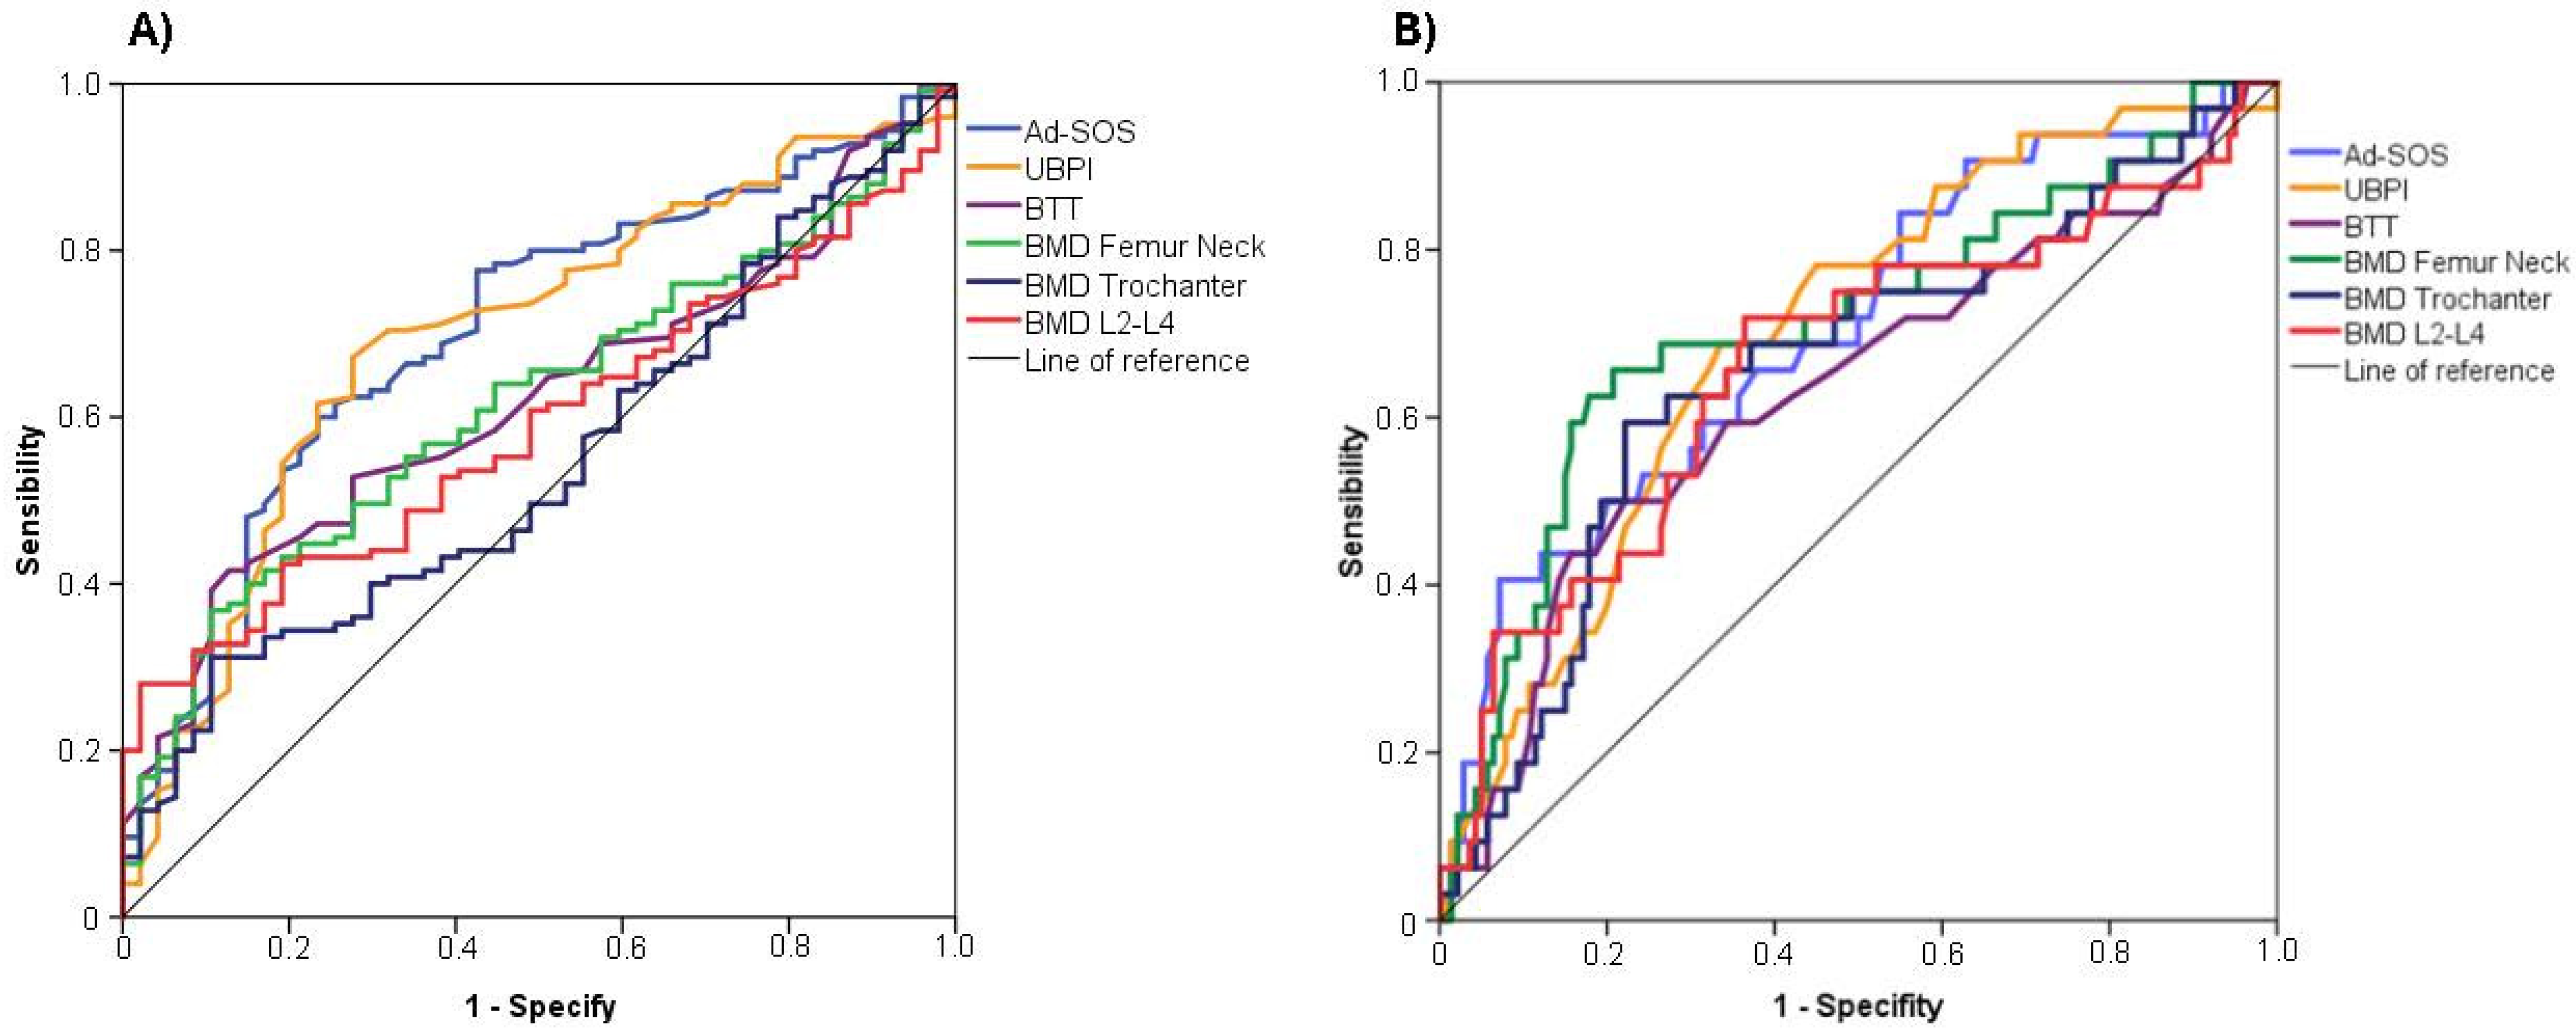
| Moderate or Severe Cortical Erosion (Klemetti Index = C2 or C3) | Severe Cortical Erosion (Klemetti Index = C3) | |||||||||||
|---|---|---|---|---|---|---|---|---|---|---|---|---|
| AUC (95%IC) | p-Value | Sensitivity | Specificity | Youden’s Index | Cut-Off | AUC (95%IC) | p-Value | Sensitivity | Specificity | Youden’s Index | Cut-Off | |
| Quantitative bone ultrasound | ||||||||||||
| Ad-SOS (m/s) | 0.702 (0.618–0.786) | <0.001 | 0.631 | 0.729 | 1.360 | <2037.5 | 0.703 (0.600–0.806) | <0.001 | 0.382 | 0.931 | 1.313 | <1929.00 |
| UBPI | 0.695 (0.609–0.782) | <0.001 | 0.672 | 0.723 | 1.395 | <0.605 | 0.699 (0.602–0.796) | <0.001 | 0.688 | 0.664 | 1.352 | <0.505 |
| BTT (μs) | 0.619 (0.534–0.705) | 0.016 | 0.416 | 0.872 | 1.288 | <1.240 | 0.632 (0.517–0.748) | 0.020 | 0.438 | 0.843 | 1.281 | <1.160 |
| BMD (gr/cm2) | ||||||||||||
| BMD femur neck | 0.617 (0.531–0.704) | 0.018 | 0.382 | 0.896 | 1.278 | <0.714 | 0.719 (0.615–0.823) | <0.001 | 0.647 | 0.821 | 1.468 | <0.703 |
| BMD trochanter | 0.543 (0.454–0.633) | 0.373 | 0.313 | 0.896 | 1.209 | <0.557 | 0.671 (0.565–0.777) | 0.002 | 0.618 | 0.786 | 1.404 | <0.566 |
| BMD lumbar spine (L2-L4) | 0.583 (0.499–0.66) | 0.090 | 0.290 | 0.979 | 1.269 | <0.779 | 0.677 (0.567–0.787) | 0.001 | 0.735 | 0.634 | 1.369 | <0.882 |
| Univariate | Multivariate | |||
|---|---|---|---|---|
| OR (CI%95) | p-Value | aOR (CI%95) | p-Value | |
| Age (1-year increase) | 1.07 (1.02–1.12) | 0.003 | 1.01 (0.93–1.08) | 0.879 |
| Postmenopausal status (%) | 8.37 (1.09–64.03) | 0.041 | 3.52 (0.33–37.53) | 0.297 |
| Menarche age (1-year increase) | 1.31 (1.03–1.68) | 0.028 | 1.29 (0.98–1.70) | 0.064 |
| Years with menopause (1-year increase) | 1.05 (1.01–1.09) | 0.005 | 1.01 (0.95–1.07) | 0.665 |
| Gravity (1-pregnancy increase) | 1.09 (0.87–1.37) | 0.429 | - | - |
| Births ≥ 1 (1-birth increase) | 1.15 (0.88–1.50) | 0.302 | - | - |
| Breastfeeding (1-month increase) | 1.00 (0.96–1.03) | 0.908 | - | - |
| BMI ≥ 30 kg/m2 | 0.71 (0.30–1.79) | 0.446 | - | - |
| WHR ≥ 0.85 | 1.17 (0.58–2.38) | 0.646 | - | - |
| % Body fat (1% increase) | 1.00 (0.95–1.05) | 0.964 | - | - |
| Ca supplementation (%) | 3.24 (1.36–7.68) | 0.008 | 1.73 (0.53–5.61) | 0.358 |
| Vitamin D supplementation (%) | 2.89 (1.11–7.55) | 0.029 | 3.91 (1.01–15.19) | 0.049 |
| Physical activity (%) | ||||
| Sedentary | 1.00 Ref | 1.00 Ref | ||
| Moderate | 2.13 (0.76–5.99) | 0.148 | - | - |
| Active | 1.98 (0.82–4.81) | 0.128 | - | - |
| Current smoking (%) | 0.87 (0.34–2.19) | 0.776 | - | - |
| Mandibular inferior cortex—Klemetti index | ||||
| C1 | 1.00 Ref | 1.00 Ref | ||
| C2 | 2.82 (1.01–7.95) | 0.045 | 3.70 (1.12–12.18) | 0.031 |
| C3 | 6.78 (2.15–21.38) | 0.001 | 7.88 (2.03–30.52) | 0.003 |
| Tooth loss (1-tooth loss) | 1.06 (1.01–1.10) | 0.006 | 1.03 (0.98–1.08) | 0.226 |
Disclaimer/Publisher’s Note: The statements, opinions and data contained in all publications are solely those of the individual author(s) and contributor(s) and not of MDPI and/or the editor(s). MDPI and/or the editor(s) disclaim responsibility for any injury to people or property resulting from any ideas, methods, instructions or products referred to in the content. |
© 2025 by the authors. Licensee MDPI, Basel, Switzerland. This article is an open access article distributed under the terms and conditions of the Creative Commons Attribution (CC BY) license (https://creativecommons.org/licenses/by/4.0/).
Share and Cite
Canal-Macías, M.L.; Vera-Rodríguez, V.; Leal-Hernández, O.; Calderón-García, J.F.; Roncero-Martín, R.; García-Blázquez, F.; Rico-Martín, S.; López-Espuela, F.; Morán, J.M.; Fabregat-Fernández, J.; et al. Association Between Mandibular Cortical Erosion and Bone Mineral Density Assessed by Phalangeal Ultrasound and Dual Energy X-Ray Absorptiometry in Spanish Women. Diagnostics 2025, 15, 507. https://doi.org/10.3390/diagnostics15040507
Canal-Macías ML, Vera-Rodríguez V, Leal-Hernández O, Calderón-García JF, Roncero-Martín R, García-Blázquez F, Rico-Martín S, López-Espuela F, Morán JM, Fabregat-Fernández J, et al. Association Between Mandibular Cortical Erosion and Bone Mineral Density Assessed by Phalangeal Ultrasound and Dual Energy X-Ray Absorptiometry in Spanish Women. Diagnostics. 2025; 15(4):507. https://doi.org/10.3390/diagnostics15040507
Chicago/Turabian StyleCanal-Macías, Maria L., Vicente Vera-Rodríguez, Olga Leal-Hernández, Julián Fernando Calderón-García, Raúl Roncero-Martín, Francisco García-Blázquez, Sergio Rico-Martín, Fidel López-Espuela, José M. Morán, Juan Fabregat-Fernández, and et al. 2025. "Association Between Mandibular Cortical Erosion and Bone Mineral Density Assessed by Phalangeal Ultrasound and Dual Energy X-Ray Absorptiometry in Spanish Women" Diagnostics 15, no. 4: 507. https://doi.org/10.3390/diagnostics15040507
APA StyleCanal-Macías, M. L., Vera-Rodríguez, V., Leal-Hernández, O., Calderón-García, J. F., Roncero-Martín, R., García-Blázquez, F., Rico-Martín, S., López-Espuela, F., Morán, J. M., Fabregat-Fernández, J., Lavado-García, J. M., & Pedrera-Canal, M. (2025). Association Between Mandibular Cortical Erosion and Bone Mineral Density Assessed by Phalangeal Ultrasound and Dual Energy X-Ray Absorptiometry in Spanish Women. Diagnostics, 15(4), 507. https://doi.org/10.3390/diagnostics15040507