
Dynamic Distance Mapping Enhances Hallux Valgus Progression Visualization
 ,
,  , and
, and
Abstract
1. Introduction
2. Materials and Methods
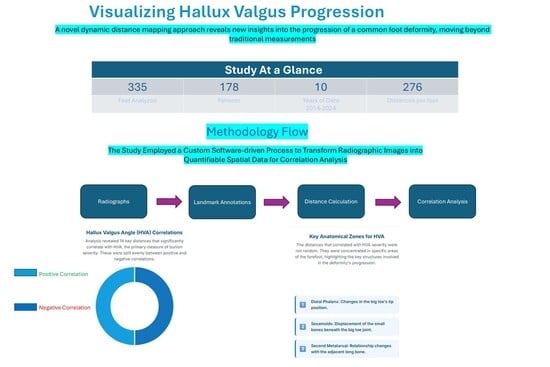
2.1. Study Population
2.2. Data Acquisition and Retrieval
2.3. Landmark Annotation and Feature Extraction
2.4. Geometrical Calculations
3. Results
3.1. Cohort Characteristics
3.2. Standard Radiographic Angles
3.3. Distance-Based Morphometric Analysis
3.4. Correlation Analysis
- Color Scale: The gradient ranges from dark blue (−0.6) to dark red (0.6), indicating the strength and direction of correlation (negative to positive).
- Correlation Coefficients: Values are color-coded, with significant correlations (p < 0.05) highlighted. Notable ranges include r > 0.4 for HVA and IMA, and r > 0.3 for DMAA and HIA.
- Annotations: Specific distances (e.g., “2nd metatarsal head to proximal phalanx head,” “Medial sesamoid to proximal phalanx base”) are labeled to reflect anatomical relationships.
3.5. Visualization of Geometric Progression
- Distances Correlated with Hallux Valgus Angle (HVA)
- Distances Correlated with Intermetatarsal Angles (IMA)

- Distances Correlated with Intermetatarsal Angle (IMA)

- Distances Correlated with Distal Metatarsal Articular Angle (DMAA)

- Distances Correlated with Hallux Interphalangeal Angle (HIA)
4. Discussion
5. Conclusions
Author Contributions
Funding
Institutional Review Board Statement
Informed Consent Statement
Data Availability Statement
Acknowledgments
Conflicts of Interest
Abbreviations
| 2D | Two-Dimensional |
| DMAADMAA | Distal Metatarsal Articular Angle |
| HIA | Hallux Interphalangeal Angle |
| HVA | Hallux Valgus Angle |
| IMA | Intermetaphyseal Angle |
References
- Nix, S.; Smith, M.; Vicenzino, B. Prevalence of hallux valgus in the general population: A systematic review and meta-analysis. J. Foot Ankle Res. 2010, 3, 21. [Google Scholar] [CrossRef] [PubMed]
- Coughlin, M.J.; Jones, C.P. Hallux valgus: Demographics, etiology, and radiographic assessment. Foot Ankle Int. 2007, 28, 759–777. [Google Scholar] [CrossRef] [PubMed]
- Kimura, T.; Kubota, M.; Suzuki, T. Three-dimensional analysis of hallux valgus deformity using weightbearing CT. J. Orthop. Sci. 2020, 25, 312–318. [Google Scholar] [CrossRef]
- Geng, X.; Zhang, C.; Ma, X.; Wang, X.; Huang, J.; Xu, J.; Wang, C. Lateral sesamoid position relative to the second metatarsal in feet with and without hallux valgus: A prospective study. J. Foot Ankle Surg. 2016, 55, 136–139. [Google Scholar] [CrossRef] [PubMed]
- Kanemitsu, M.; Nakasa, T.; Ikuta, Y.; Sumii, J.; Nekomoto, A.; Kawabata, S.; Otei, M.; Adachi, N. Morphology and deformity of the distal phalanx in hallux valgus. J. Orthop. Sci. 2023, 28, 1370–1375. [Google Scholar] [CrossRef] [PubMed]
- Mansur, N.S.B.; Lalevee, M.; Schmidt, E.; Dibbern, K.; Wagner, P.; Wagner, E.; Nery, C.; de Cesar Netto, C. Correlation between indirect radiographic parameters of first metatarsal rotation in hallux valgus and values on weight-bearing computed tomography. Int. Orthop. 2021, 45, 3111–3118. [Google Scholar] [CrossRef]
- Perera, A.M.; Mason, L.; Stephens, M.M. The pathogenesis of hallux valgus. J. Bone Joint Surg. Am. 2011, 93, 1650–1661. [Google Scholar] [CrossRef] [PubMed]
- Robinson, A.H.; Limbers, J.P. Modern concepts in the treatment of hallux valgus. J. Bone Joint Surg. Br. 2005, 87, 1038–1045. [Google Scholar] [CrossRef] [PubMed]
- Patel, T.J.; Conti, M.S.; Caolo, K.C.; Miller, M.C.; Conti, S.F.; Ellis, S.J. Pronation on weightbearing radiographs does not correlate with pronation from weightbearing CT scans. Foot Ankle Surg. 2022, 28, 763–769. [Google Scholar] [CrossRef]
- Kim, J.; Ellis, S.; Carrino, J.A. Weight-Bearing Computed Tomography of the Foot and Ankle-What to Measure? Foot Ankle Clin. 2023, 28, 619–640. [Google Scholar] [CrossRef] [PubMed]
- Conti, M.S.; Patel, T.J.; Caolo, K.C.; Amadio, J.M.; Miller, M.C.; Costigliola, S.V.; Ellis, S.J.; Conti, S.F. Correlation of Different Methods of Measuring Pronation of the First Metatarsal on Weightbearing CT Scans. Foot Ankle Int. 2021, 42, 1049–1059. [Google Scholar] [CrossRef]
- Richter, M.; Seidl, B.; Zech, S.; Hahn, S. PedCAT for 3D-imaging in standing position allows for more accurate bone position (angle) measurement than radiographs or CT. Foot Ankle Surg. 2014, 20, 201–207. [Google Scholar] [CrossRef]


| Structure | Landmarks |
|---|---|
| 1st Metatarsal | 9 points: Head center; medial; lateral and midpoint of head surface; medial and lateral base points; medial and lateral curvature points |
| 2nd Metatarsal | 5 points: Head Center; medial; lateral; and midpoint of base; head midpoint |
| Sesamoids (medial and lateral) | 2 points each: Center and medial edge |
| Proximal Phalanx | 2 points: Tip and base midpoint |
| Distal Phalanx | 2 points: Tip and base midpoint |
| Patient Demographics Summary | ||||
|---|---|---|---|---|
| Sex | Patients (n) | Feet (n) | Age (Mean ± SD) | Age Range |
| F | 133 | 249 | 54.9 ± 15.9 | 18–86 |
| M | 45 | 86 | 45.6 ± 18.9 | 18–78 |
| Total | 178 | 335 | 52.5 ± 17.1 | 18–86 |
| Severity | HVA Severity | HVA (n, %) | IMA Severity | IMA (n, %) | DMAA Severity | DMAA (n, %) | HIA Severity | HIA (n, %) |
|---|---|---|---|---|---|---|---|---|
| Mild | 15–20° | 89 (26.6%) | 9–11° | 167 (49.9%) | 8–10° | 172 (51.3%) | <10° | 236 (70.4%) |
| Moderate | 21–40° | 206 (61.5%) | 12–17° | 136 (37.7%) | 11–15° | 68 (20.3%) | 10–13° | 87 (26.0%) |
| Severe | >40° | 38 (11.3%) | >17° | 40 (12.0%) | >15° | 93 (28.4%) | >13° | 10 (3.0%) |
Disclaimer/Publisher’s Note: The statements, opinions and data contained in all publications are solely those of the individual author(s) and contributor(s) and not of MDPI and/or the editor(s). MDPI and/or the editor(s) disclaim responsibility for any injury to people or property resulting from any ideas, methods, instructions or products referred to in the content. |
© 2025 by the authors. Licensee MDPI, Basel, Switzerland. This article is an open access article distributed under the terms and conditions of the Creative Commons Attribution (CC BY) license (https://creativecommons.org/licenses/by/4.0/).
Share and Cite
Robinson, D.; Murad, H.; Khatib, M.; Mahamid, M.K.; Lavon, E.; Yassin, M. Dynamic Distance Mapping Enhances Hallux Valgus Progression Visualization. Diagnostics 2025, 15, 2791. https://doi.org/10.3390/diagnostics15212791
Robinson D, Murad H, Khatib M, Mahamid MK, Lavon E, Yassin M. Dynamic Distance Mapping Enhances Hallux Valgus Progression Visualization. Diagnostics. 2025; 15(21):2791. https://doi.org/10.3390/diagnostics15212791
Chicago/Turabian StyleRobinson, Dror, Hamza Murad, Muhammad Khatib, Muhamad Kiwan Mahamid, Eitan Lavon, and Mustafa Yassin. 2025. "Dynamic Distance Mapping Enhances Hallux Valgus Progression Visualization" Diagnostics 15, no. 21: 2791. https://doi.org/10.3390/diagnostics15212791
APA StyleRobinson, D., Murad, H., Khatib, M., Mahamid, M. K., Lavon, E., & Yassin, M. (2025). Dynamic Distance Mapping Enhances Hallux Valgus Progression Visualization. Diagnostics, 15(21), 2791. https://doi.org/10.3390/diagnostics15212791