
Radiomics with Clinical Data and [18F]FDG-PET for Differentiating Between Infected and Non-Infected Intracavitary Vascular (Endo)Grafts: A Proof-of-Concept Study

 ,
,  ,
,  , , , ,
  ,
,  ,
,  ,
,  and
and
Abstract
1. Introduction
2. Methods
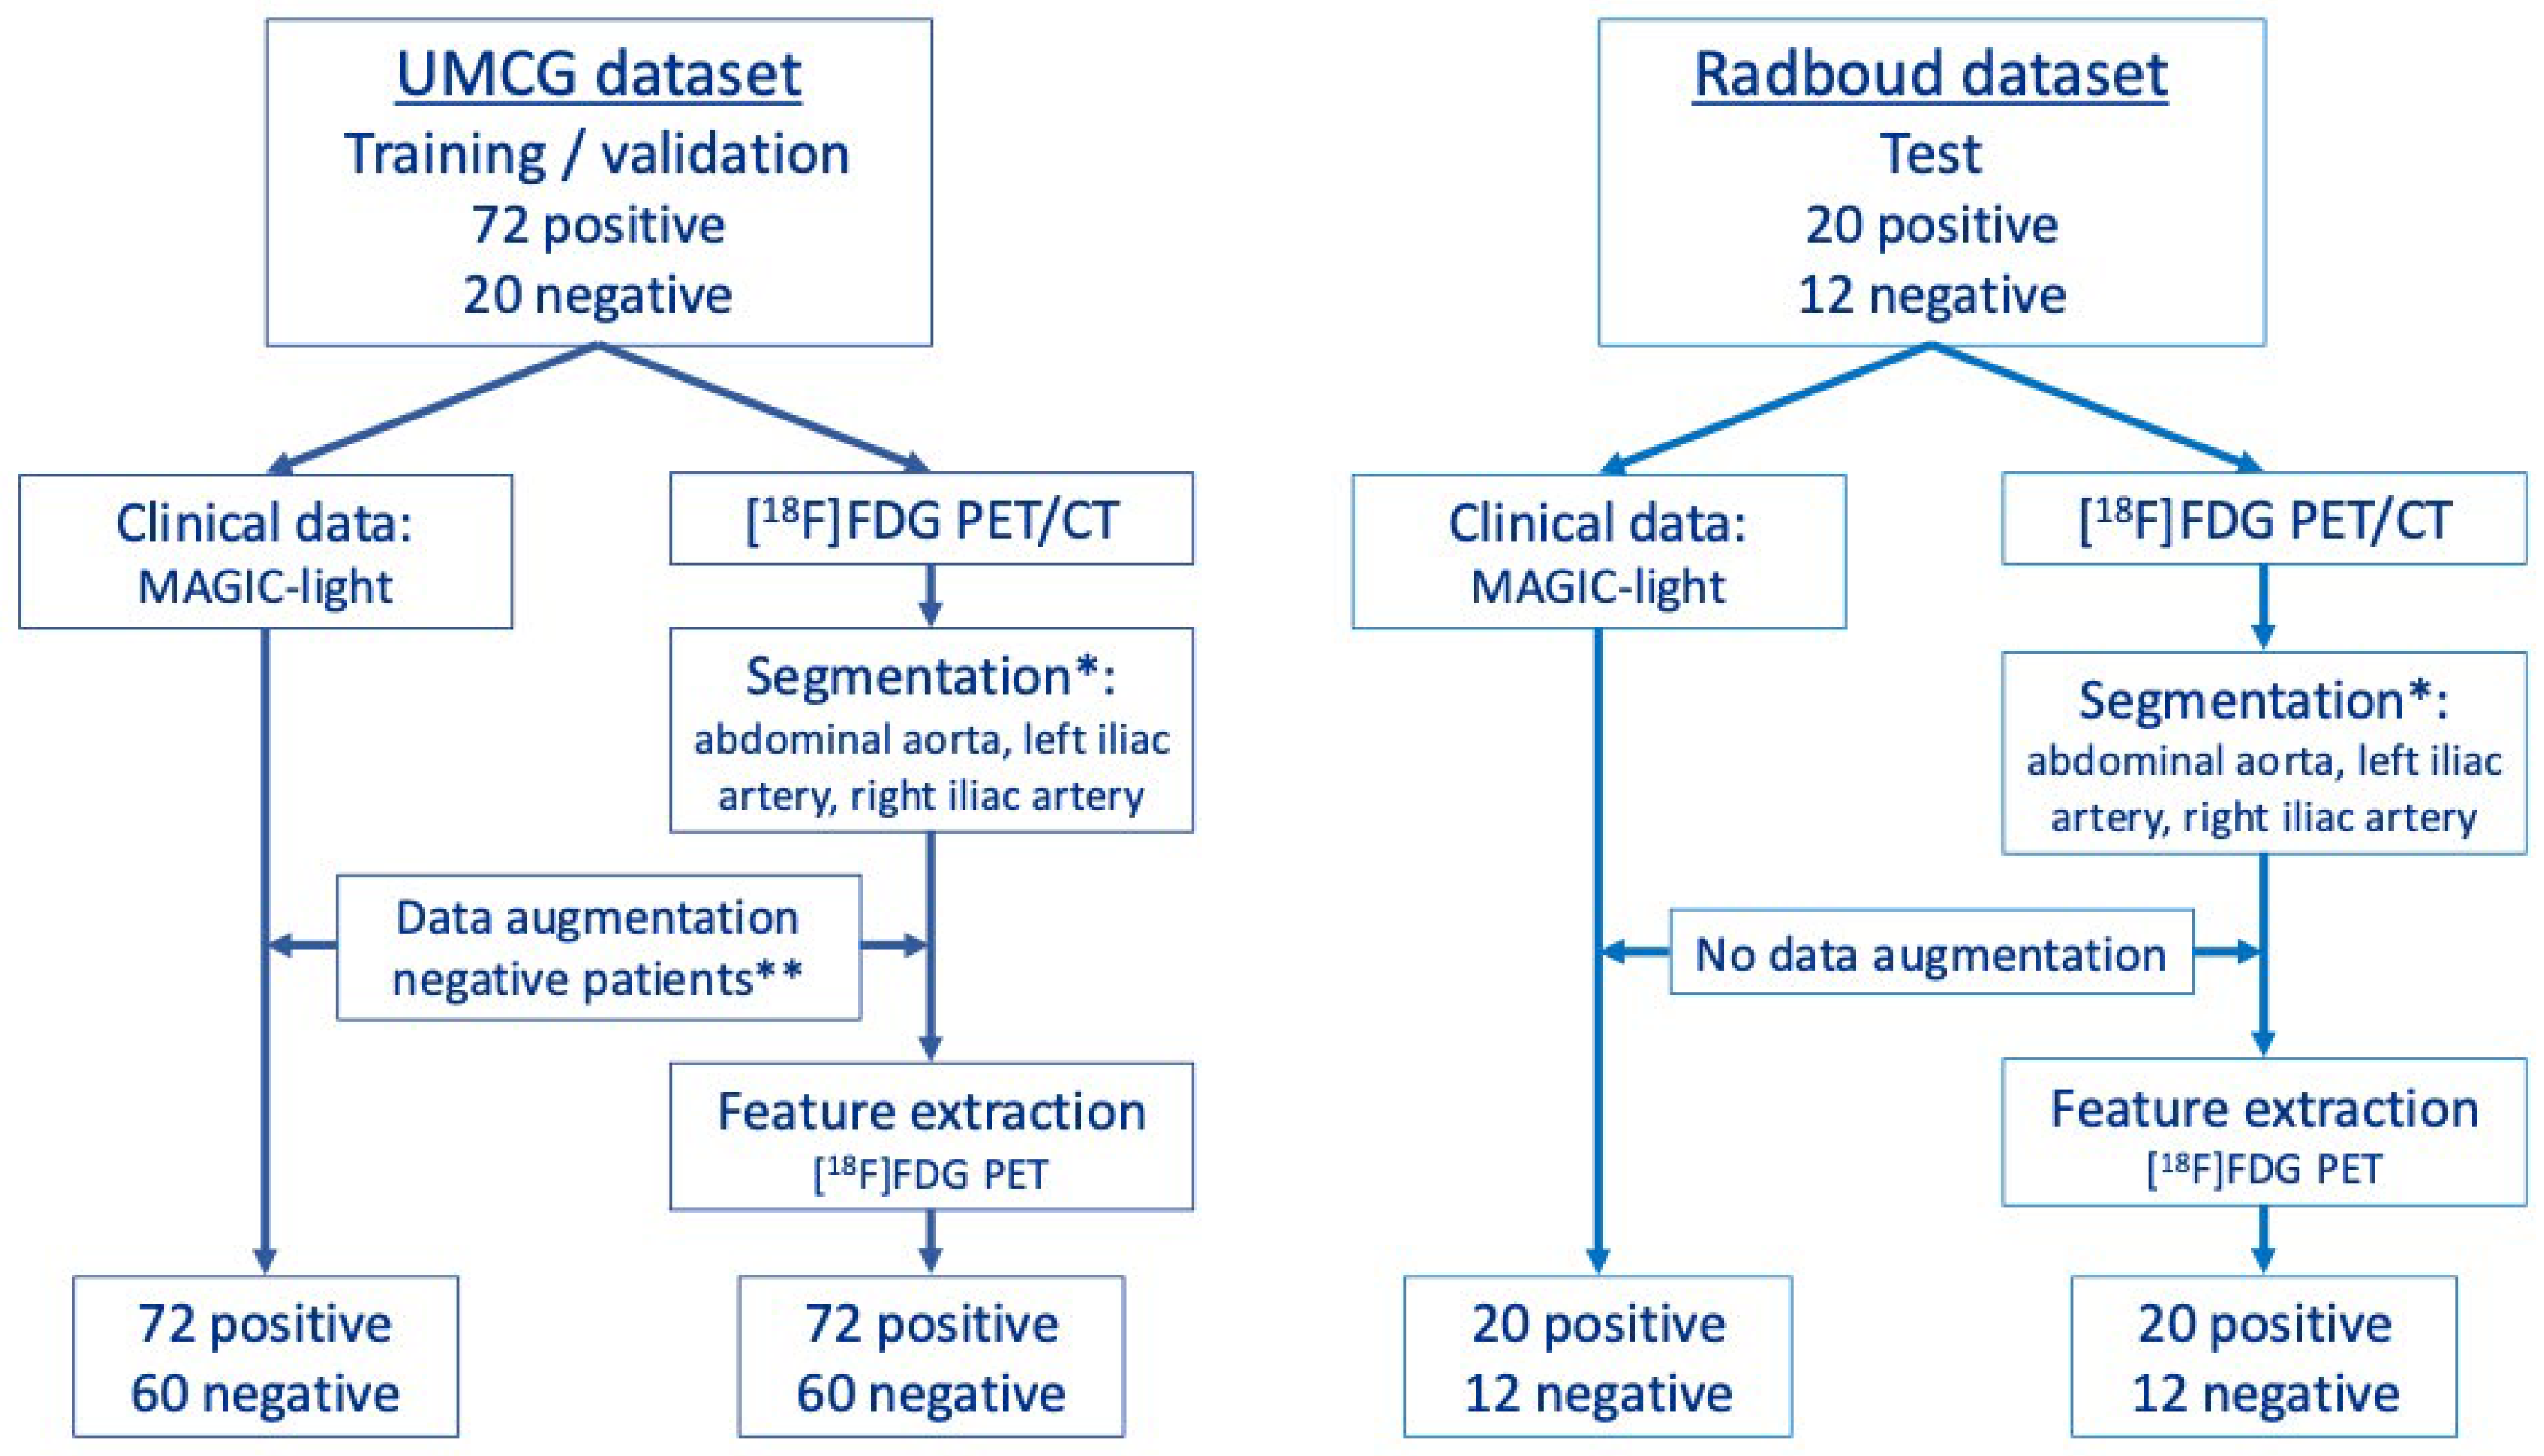
2.1. Study Population
2.2. Machine-Learning Models of MAGIC-Light and PET-Radiomics Data
2.3. Image Acquisition and Reconstruction
2.4. Segmentation
2.5. Data Augmentation
2.6. Radiomics Feature Extraction
2.7. Machine-Learning Models
2.8. Statistical Analysis
3. Results
3.1. ML Model
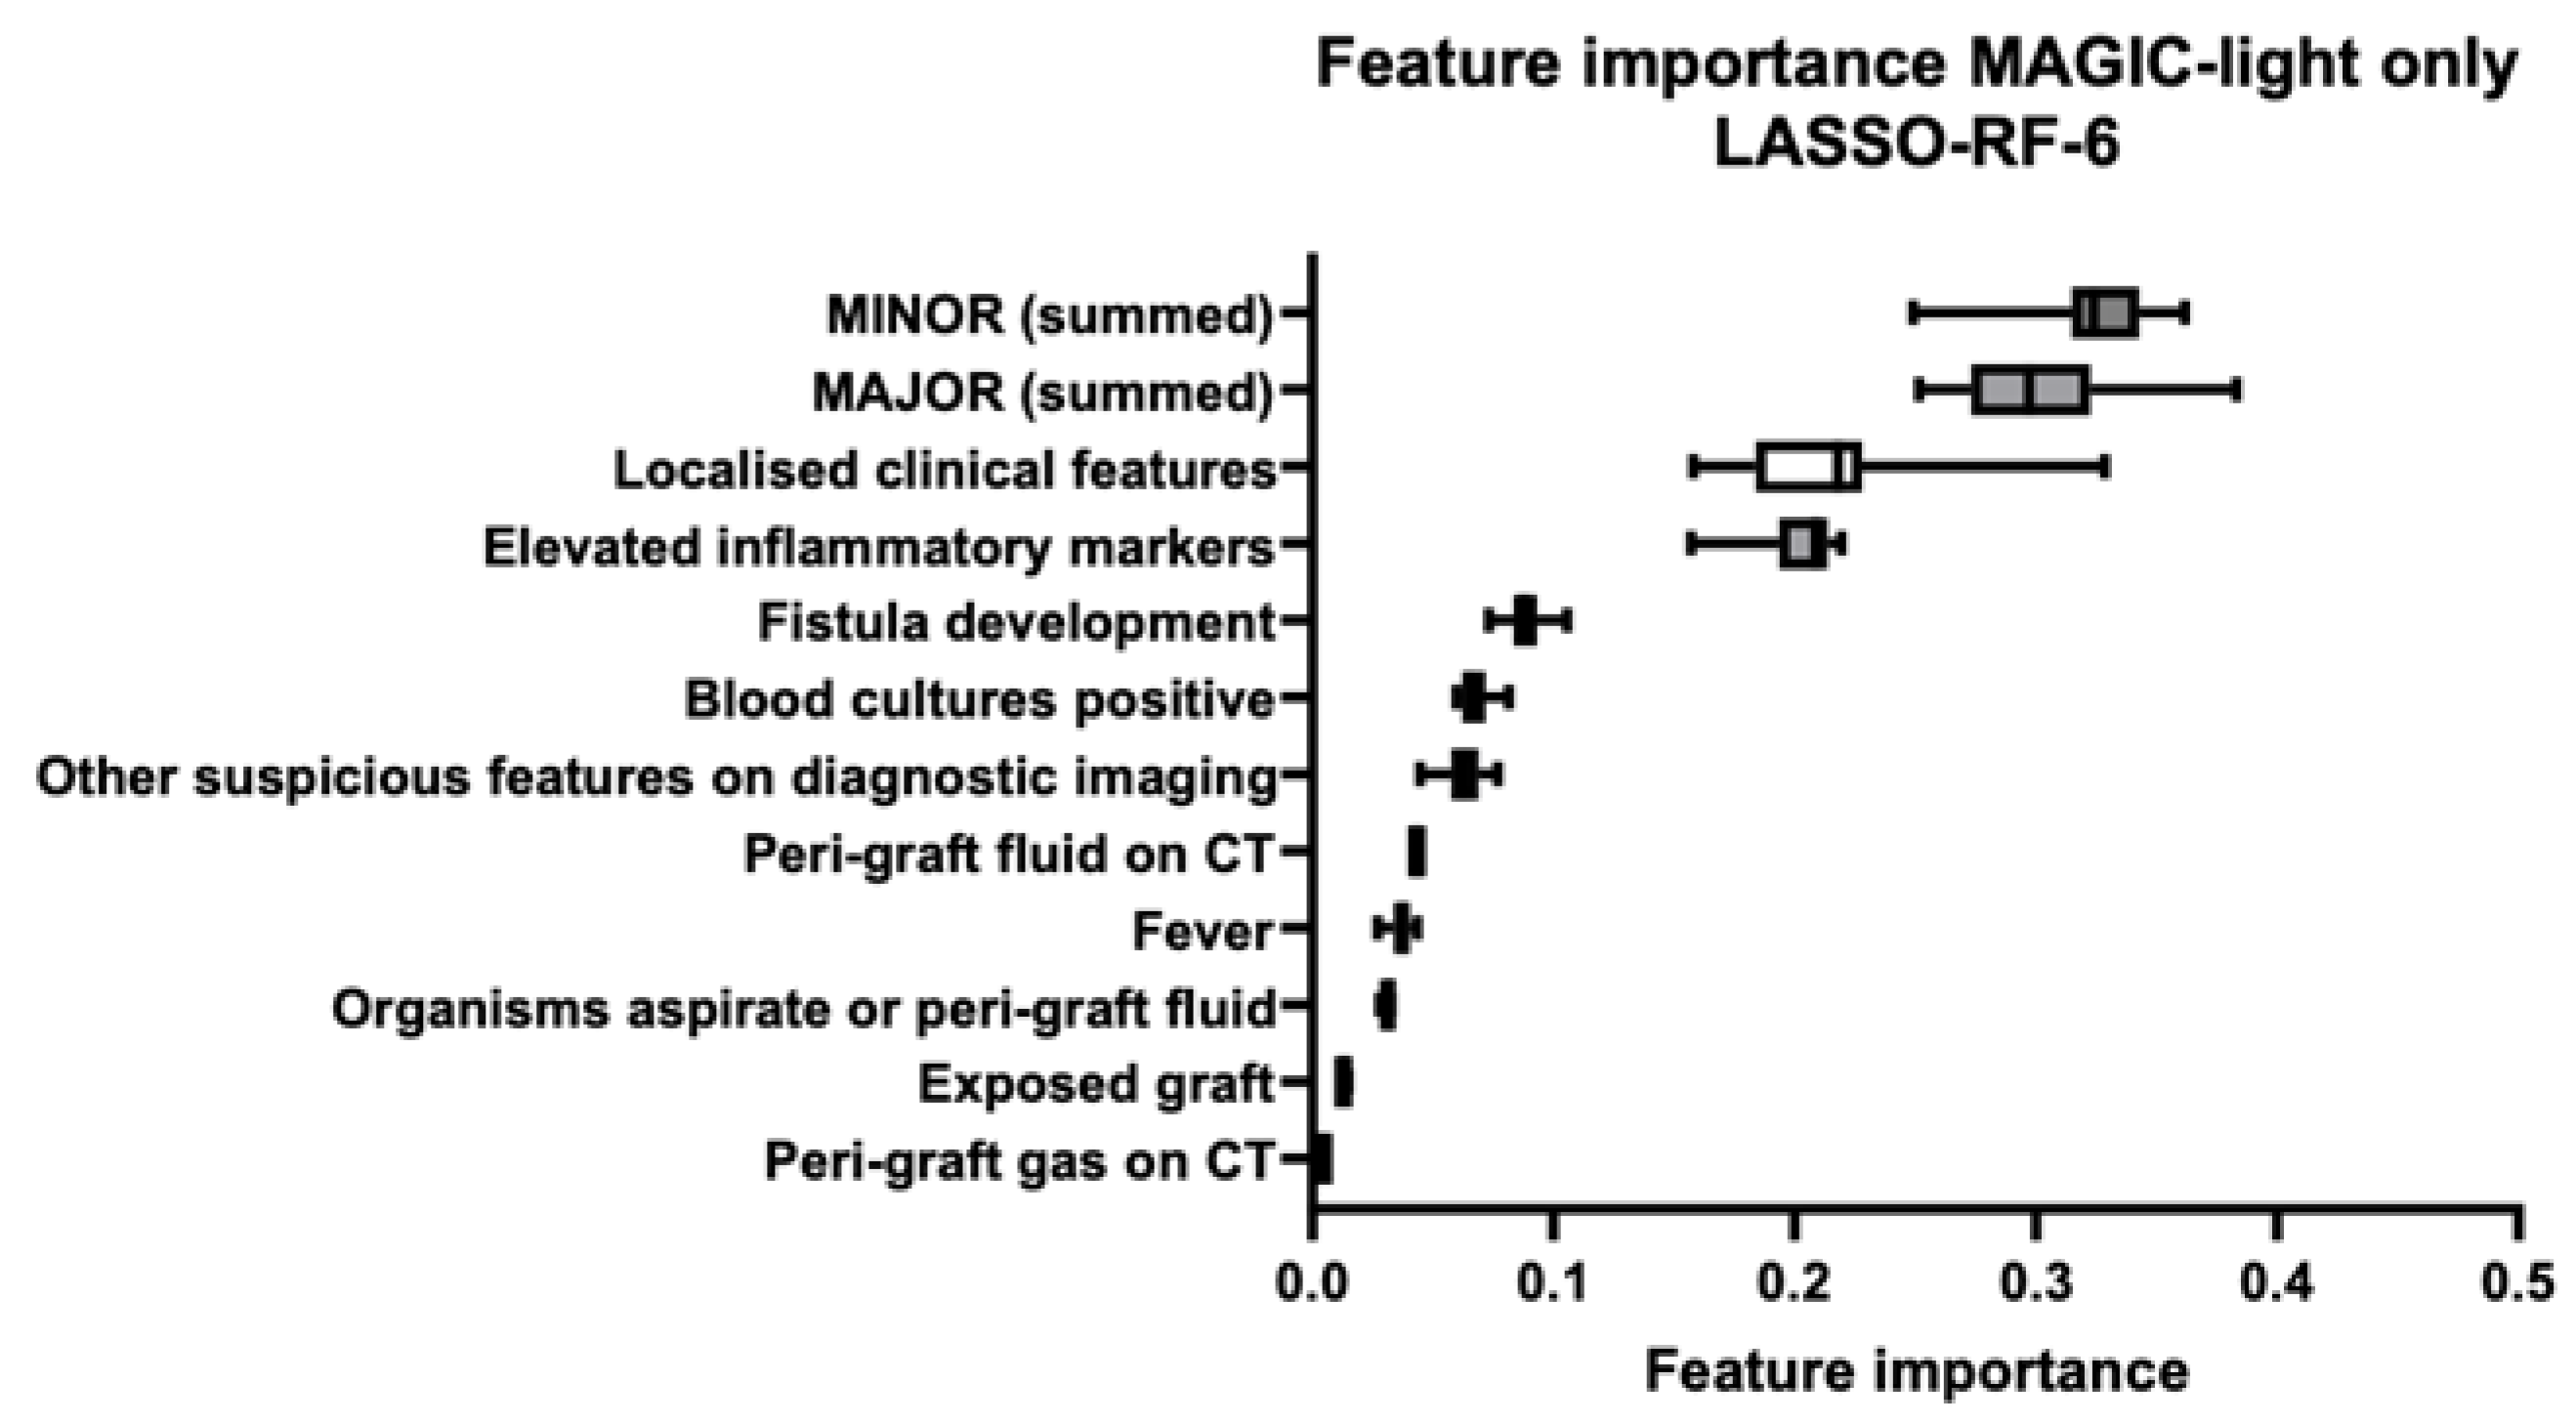
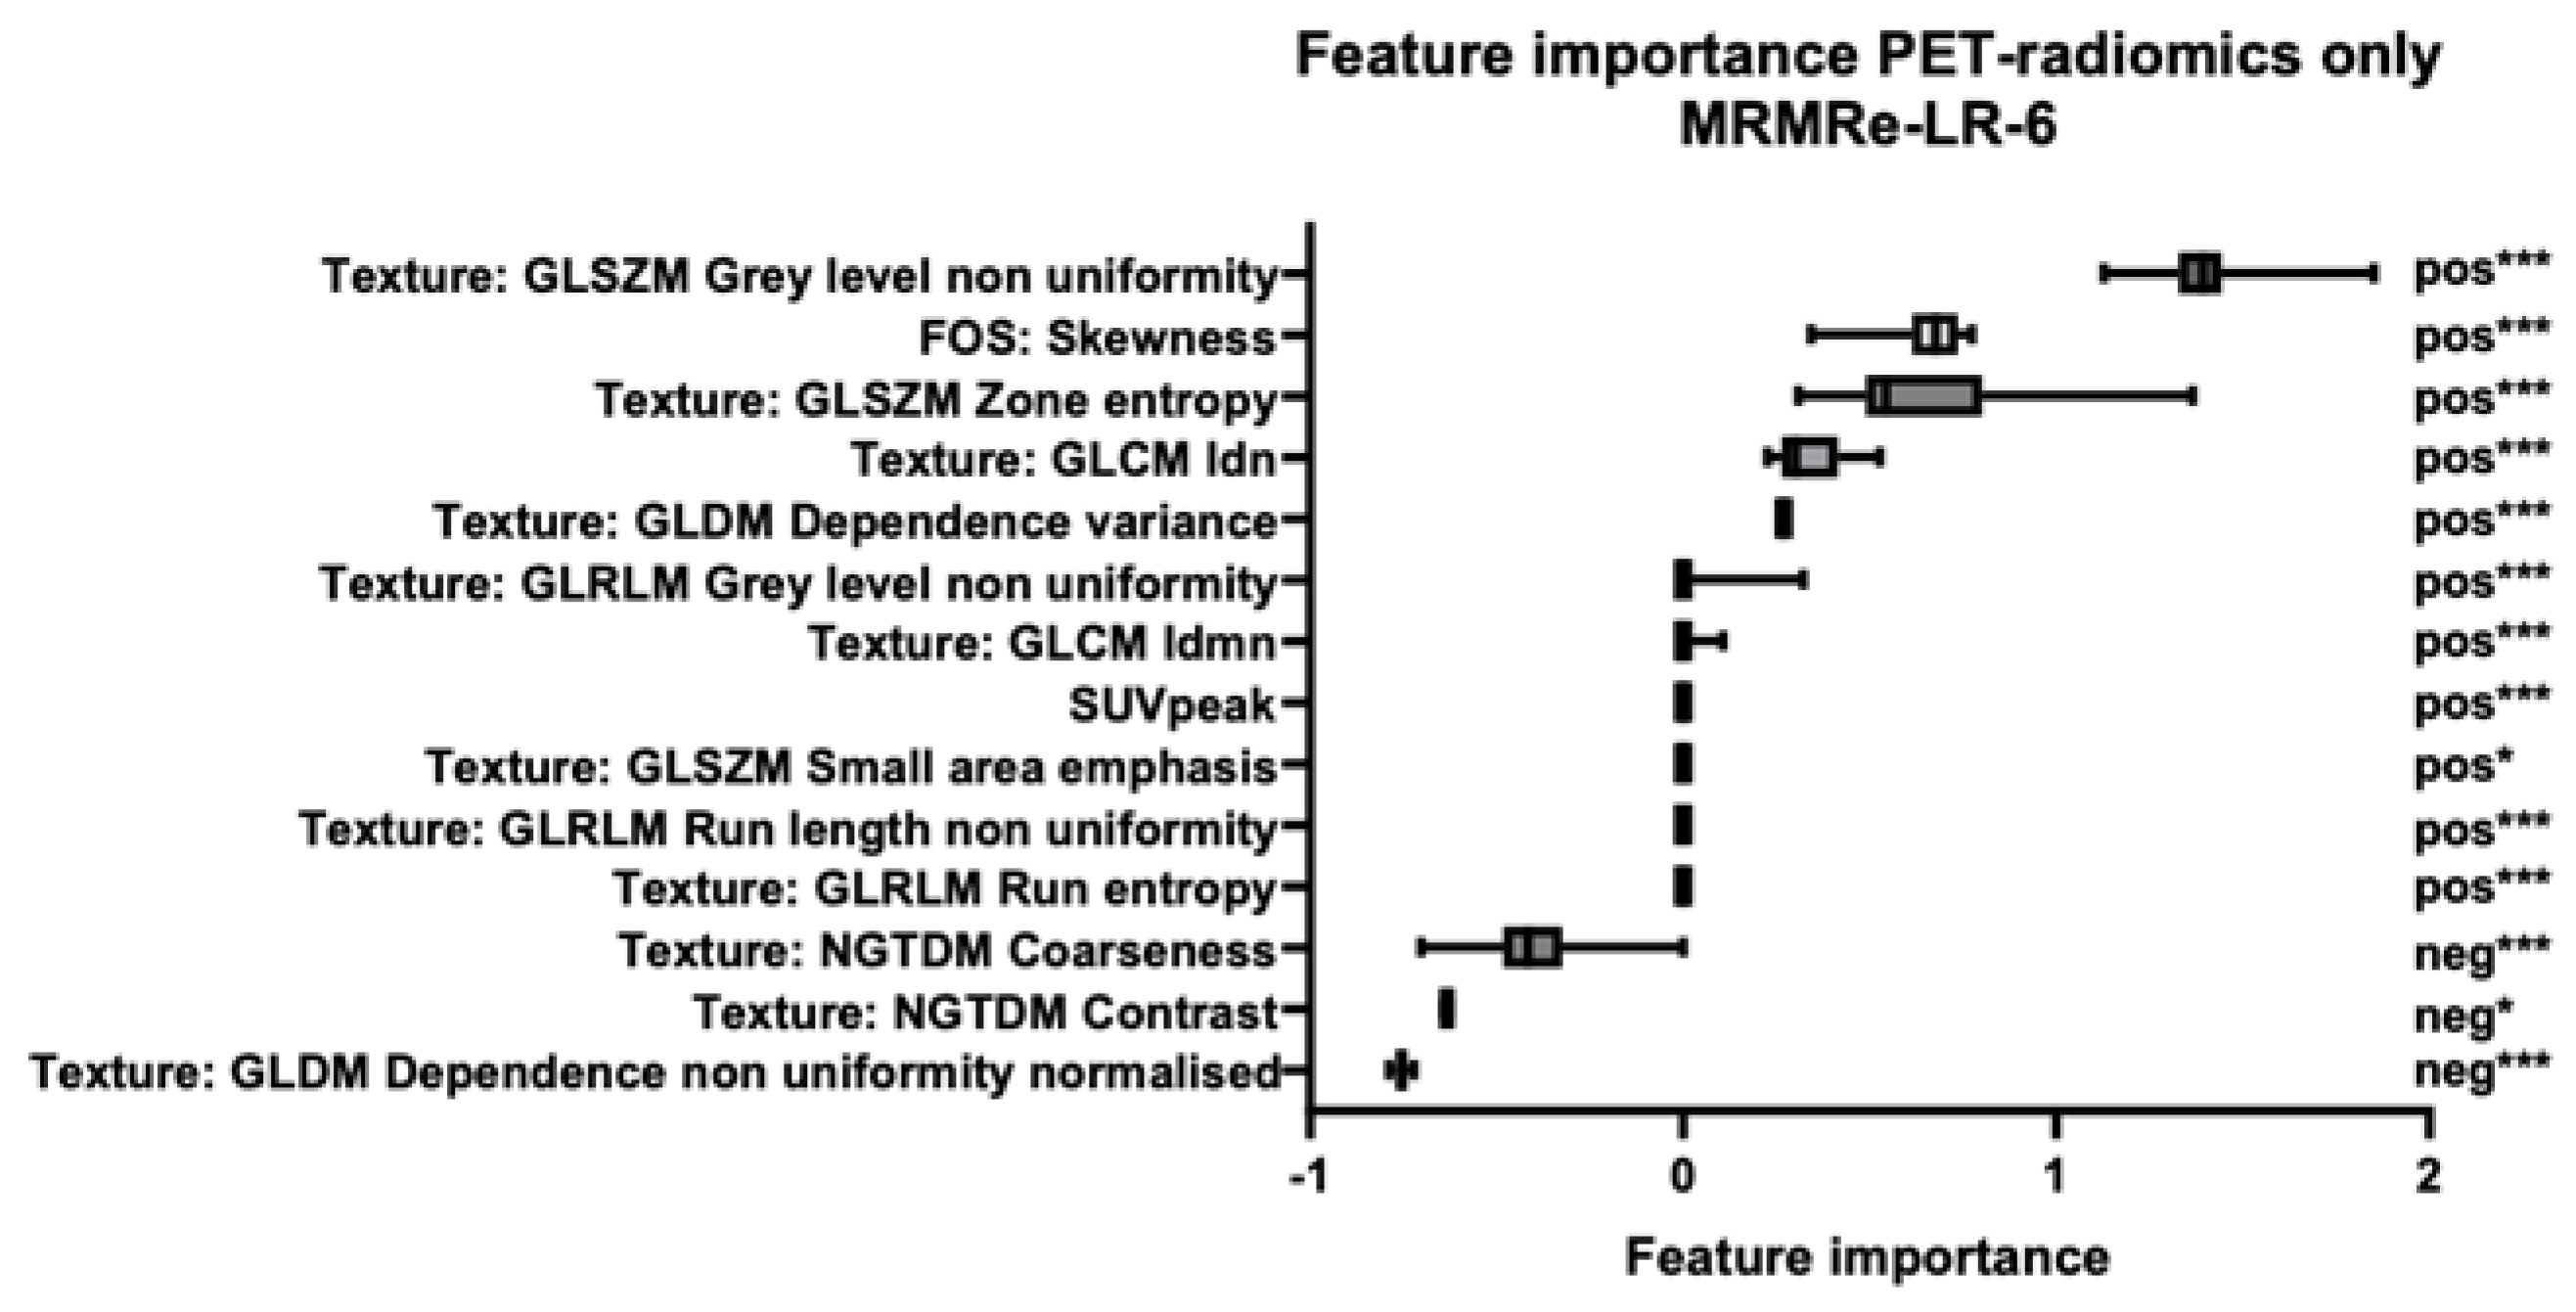
3.2. Feature Importance
3.3. Interobserver Variability
4. Discussion
Supplementary Materials
Author Contributions
Funding
Institutional Review Board Statement
Informed Consent Statement
Data Availability Statement
Acknowledgments
Conflicts of Interest
References
- Baddour, L.M.; Bettmann, M.A.; Bolger, A.F.; Epstein, A.E.; Ferrieri, P.; Gerber, M.A.; Gewitz, M.H.; Jacobs, A.K.; Levison, M.E.; Newburger, J.W.; et al. Nonvalvular cardiovascular device–related infections. Circulation 2003, 108, 2015–2031. [Google Scholar] [CrossRef]
- Bruls, S.; El Hassani, I.; Hultgren, R.; Hustinx, R.; Courtois, A.; Dumortier, A.; Defraigne, J.-O.; Sakalihasan, N. [18F]FDG PET/CT can improve the diagnostic accuracy for aortic endograft infection. Acta Cardiol. 2021, 77, 399–407. [Google Scholar] [CrossRef]
- Anagnostopoulos, A.; Ledergerber, B.; Kuster, S.P.; Scherrer, A.U.; Näf, B.; Greiner, M.A.; Rancic, Z.; Kobe, A.; Bettex, D.; Hasse, B.; et al. Inadequate perioperative prophylaxis and postsurgical complications after graft implantation are important risk factors for subsequent vascular graft infections: Prospective results from the vascular graft infection cohort study. Clin. Infect. Dis. 2018, 69, 621–630. [Google Scholar] [CrossRef]
- Chakfé, N.; Diener, H.; Lejay, A.; Assadian, O.; Berard, X.; Caillon, J.; Fourneau, I.; Glaudemans, A.W.J.M.; Koncar, I.; Lindholt, J.; et al. Editor’s choice-european society for vascular surgery (ESVS) 2020 clinical practice guidelines on the management of vascular graft and endograft infections. Eur. J. Vasc. Endovasc. Surg. 2020, 59, 339–384. [Google Scholar] [CrossRef]
- Lyons, O.T.A.; Baguneid, M.; Barwick, T.D.; Bell, R.E.; Foster, N.; Homer-Vanniasinkam, S.; Hopkins, S.; Hussain, A.; Katsanos, K.; Modarai, B.; et al. Diagnosis of aortic graft infection: A case definition by the management of aortic graft infection collaboration (MAGIC). Eur. J. Vasc. Endovasc. Surg. 2016, 52, 758–763. [Google Scholar] [CrossRef]
- Anagnostopoulos, A.; Mayer, F.; Ledergerber, B.; Bergadà-Pijuan, J.; Husmann, L.; Mestres, C.A.; Rancic, Z.; Hasse, B. Editor’s choice–validation of the management of aortic graft infection collaboration (MAGIC) criteria for the diagnosis of vascular graft/endograft infection: Results from the prospective vascular graft cohort study. Eur. J. Vasc. Endovasc. Surg. 2021, 62, 251–257. [Google Scholar] [CrossRef]
- Folmer, E.I.R.; Von Meijenfeldt, G.C.I.; Van der Laan, M.J.; Glaudemans, A.W.J.M.; Slart, R.H.J.A.; Saleem, B.R.; Zeebregts, C.J. Diagnostic imaging in vascular graft infection: A systematic review and meta-analysis. Eur. J. Vasc. Endovasc. Surg. 2018, 56, 719–729. [Google Scholar] [CrossRef]
- Folmer, E.I.R.; von Meijenfeldt, G.C.I.; Scholten, R.S.t.R.o.g.; van der Laan, M.J.; Glaudemans, A.W.J.M.; Slart, R.H.J.A.; Zeebregts, C.J.; Saleem, B.R. A systematic review and meta-analysis of 18F-fluoro-d-deoxyglucose positron emission tomography interpretation methods in vascular graft and endograft infection. J. Vasc. Surg. 2020, 72, 2174–2185.e2. [Google Scholar] [CrossRef]
- Liesker, D.J.; Legtenberg, S.; Erba, P.A.; Glaudemans, A.W.J.M.; Zeebregts, C.J.; De Vries, J.-P.P.M.; Chakfé, N.; Saleem, B.R.; Slart, R.H.J.A. Variability of [18F]FDG-PET/LDCT reporting in vascular graft and endograft infection. Eur. J. Nucl. Med. Mol. Imaging 2023, 50, 3880–3889. [Google Scholar] [CrossRef]
- Tingen, H.S.A.; van Praagh, G.D.; Nienhuis, P.H.; Tubben, A.; van Rijsewijk, N.D.; Hove, D.T.; A Mushari, N.; Martinez-Lucio, T.S.; I Mendoza-Ibañez, O.; van Sluis, J.; et al. The clinical value of quantitative cardiovascular molecular imaging: A step towards precision medicine. Br. J. Radiol. 2023, 96, 20230704. [Google Scholar] [CrossRef]
- Gillies, R.J.; Kinahan, P.E.; Hricak, H. Radiomics: Images are more than pictures, they are data. Radiology 2016, 278, 563–577. [Google Scholar] [CrossRef] [PubMed]
- Saleem, B.R.; Beukinga, R.J.; Boellaard, R.; Glaudemans, A.W.J.M.; Reijnen, M.M.P.J.; Zeebregts, C.J.; Slart, R.H.J.A. Textural features of 18F-fluorodeoxyglucose positron emission tomography scanning in diagnosing aortic prosthetic graft infection. Eur. J. Nucl. Med. Mol. Imaging 2017, 44, 886–894. [Google Scholar] [CrossRef]
- Hatt, M.; Krizsan, A.K.; Rahmim, A.; Bradshaw, T.J.; Costa, P.F.; Forgacs, A.; Seifert, R.; Zwanenburg, A.; El Naqa, I.; Kinahan, P.E.; et al. Joint EANM/SNMMI guideline on radiomics in nuclear medicine. Eur. J. Nucl. Med. Mol. Imaging 2023, 50, 352–375. [Google Scholar] [CrossRef]
- Jamar, F.; Buscombe, J.; Chiti, A.; Christian, P.E.; Delbeke, D.; Donohoe, K.J.; Israel, O.; Martin-Comin, J.; Signore, A. EANM/SNMMI guideline for 18 F-FDG use in inflammation and infection. J. Nucl. Med. 2013, 54, 647–658. [Google Scholar] [CrossRef]
- Kaalep, A.; Sera, T.; Oyen, W.; Krause, B.J.; Chiti, A.; Liu, Y.; Boellaard, R. EANM/EARL FDG-PET/CT accreditation-summary results from the first 200 accredited imaging systems. Eur. J. Nucl. Med. Mol. Imaging 2018, 45, 412–422. [Google Scholar] [CrossRef]
- van Praagh, G.D.; Nienhuis, P.H.; Reijrink, M.; Davidse, M.E.J.; Duff, L.M.; Spottiswoode, B.S.; Mulder, D.J.; Prakken, N.H.J.; Scarsbrook, A.F.; Morgan, A.W.; et al. Automated multiclass segmentation, quantification, and visualization of the diseased aorta on hybrid PET/CT–SEQUOIA. Med. Phys. 2024, 51, 4297–4310. [Google Scholar] [CrossRef]
- Wasserthal, J.; Breit, H.-C.; Meyer, M.T.; Pradella, M.; Hinck, D.; Sauter, A.W.; Heye, T.; Boll, D.T.; Cyriac, J.; Yang, S.; et al. TotalSegmentator: Robust segmentation of 104 anatomic structures in CT images. Radiol. Artif. Intell. 2023, 5, e230024. [Google Scholar] [CrossRef]
- Chawla, N.V.; Bowyer, K.W.; Hall, L.O.; Kegelmeyer, W.P. SMOTE: Synthetic minority over-sampling technique. J. Artif. Intell. Res. 2002, 16, 321–357. [Google Scholar] [CrossRef]
- van Griethuysen, J.J.M.; Fedorov, A.; Parmar, C.; Hosny, A.; Aucoin, N.; Narayan, V.; Beets-Tan, R.G.H.; Fillion-Robin, J.-C.; Pieper, S.; Aerts, H.J.W.L. Computational radiomics system to decode the radiographic phenotype. Cancer Res. 2017, 77, e104–e107. [Google Scholar] [CrossRef]
- Zwanenburg, A.; Vallières, M.; Abdalah, M.A.; Aerts, H.J.W.L.; Andrearczyk, V.; Apte, A.; Ashrafinia, S.; Bakas, S.; Beukinga, R.J.; Boellaard, R.; et al. The image biomarker standardization initiative: Standardized quantitative radiomics for high-throughput image-based phenotyping. Radiology 2020, 295, 328–338. [Google Scholar] [CrossRef] [PubMed]
- Bommert, A.; Sun, X.; Bischl, B.; Rahnenführer, J.; Lang, M. Benchmark for filter methods for feature selection in high-dimensional classification data. Comput. Stat. Data Anal. 2020, 143, 106839. [Google Scholar] [CrossRef]
- Robin, X.; Turck, N.; Hainard, A.; Tiberti, N.; Lisacek, F.; Sanchez, J.-C.; Müller, M. pROC: An open-source package for R and S+ to analyze and compare ROC curves. BMC Bioinform. 2011, 12, 77. [Google Scholar] [CrossRef] [PubMed]
- Keidar, Z.; Pirmisashvili, N.; Leiderman, M.; Nitecki, S.; Israel, O. 18F-FDG uptake in noninfected prosthetic vascular grafts: Incidence, patterns, and changes over time. J. Nucl. Med. 2014, 55, 392–395. [Google Scholar] [CrossRef] [PubMed]
- Mitra, A.; Pencharz, D.; Davis, M.; Wagner, T. Determining the diagnostic value of 18F-fluorodeoxyglucose positron emission/computed tomography in detecting prosthetic aortic graft infection. Ann. Vasc. Surg. 2018, 53, 78–85. [Google Scholar] [CrossRef]
- Dong, W.; Li, Y.; Zhu, J.; Xia, J.; He, L.; Yun, M.; Jiao, J.; Zhu, G.; Hacker, M.; Wei, Y.; et al. Detection of aortic prosthetic graft infection with 18F-FDG PET/CT imaging, concordance with consensus MAGIC graft infection criteria. J. Nucl. Cardiol. 2021, 28, 1005–1016. [Google Scholar] [CrossRef]
- Godefroy, T.; Frécon, G.; Asquier-Khati, A.; Mateus, D.; Lecomte, R.; Rizkallah, M.; Piriou, N.; Jamet, B.; Le Tourneau, T.; Pallardy, A.; et al. 18G-FDG-based radiomics and machine learning: Useful help for aortic prosthetic valve infective endocarditis diagnosis? JACC Cardiovasc. Imaging 2023, 16, 951–961. [Google Scholar] [CrossRef]
- Hove, D.T.; Slart, R.H.J.A.; Glaudemans, A.W.J.M.; Postma, D.F.; Gomes, A.; Swart, L.E.; Tanis, W.; van Geel, P.P.; Mecozzi, G.; Budde, R.P.J.; et al. Using machine learning to improve the diagnostic accuracy of the modified Duke/ESC 2015 criteria in patients with suspected prosthetic valve endocarditis-a proof of concept study. Eur. J. Nucl. Med. Mol. Imaging 2024, 51, 3924–3933. [Google Scholar] [CrossRef]
- Van Timmeren, J.E.; Cester, D.; Tanadini-Lang, S.; Alkadhi, H.; Baessler, B. Radiomics in medical imaging—“how-to” guide and critical reflection. Insights Imaging 2020, 11, 91. [Google Scholar] [CrossRef]
- Erb, S.; Sidler, J.A.; Elzi, L.; Gurke, L.; Battegay, M.; Widmer, A.F.; Weisser, M.; Bueno, V. Surgical and antimicrobial treatment of prosthetic vascular graft infections at different surgical sites: A retrospective study of treatment outcomes. PLoS ONE 2014, 9, e112947. [Google Scholar] [CrossRef]


| Clinical | Radiology | Laboratory | ||||
|---|---|---|---|---|---|---|
| Major Criteria | Minor Criteria | Major Criteria | Minor Criteria | Major Criteria | Minor Criteria | |
| Graft insertion in infected site | Localised clinical features | Peri-graft fluid on CT | Other suspicious features on diagnostic imaging | Organisms recovered from percutaneous aspirate | Elevated inflammatory markers | Summed major criteria |
| Exposed graft | Fever | Peri-graft gas on CT | Positive blood cultures | Summed minor criteria | ||
| Fistula development | Increase in peri-graft gas volume | |||||
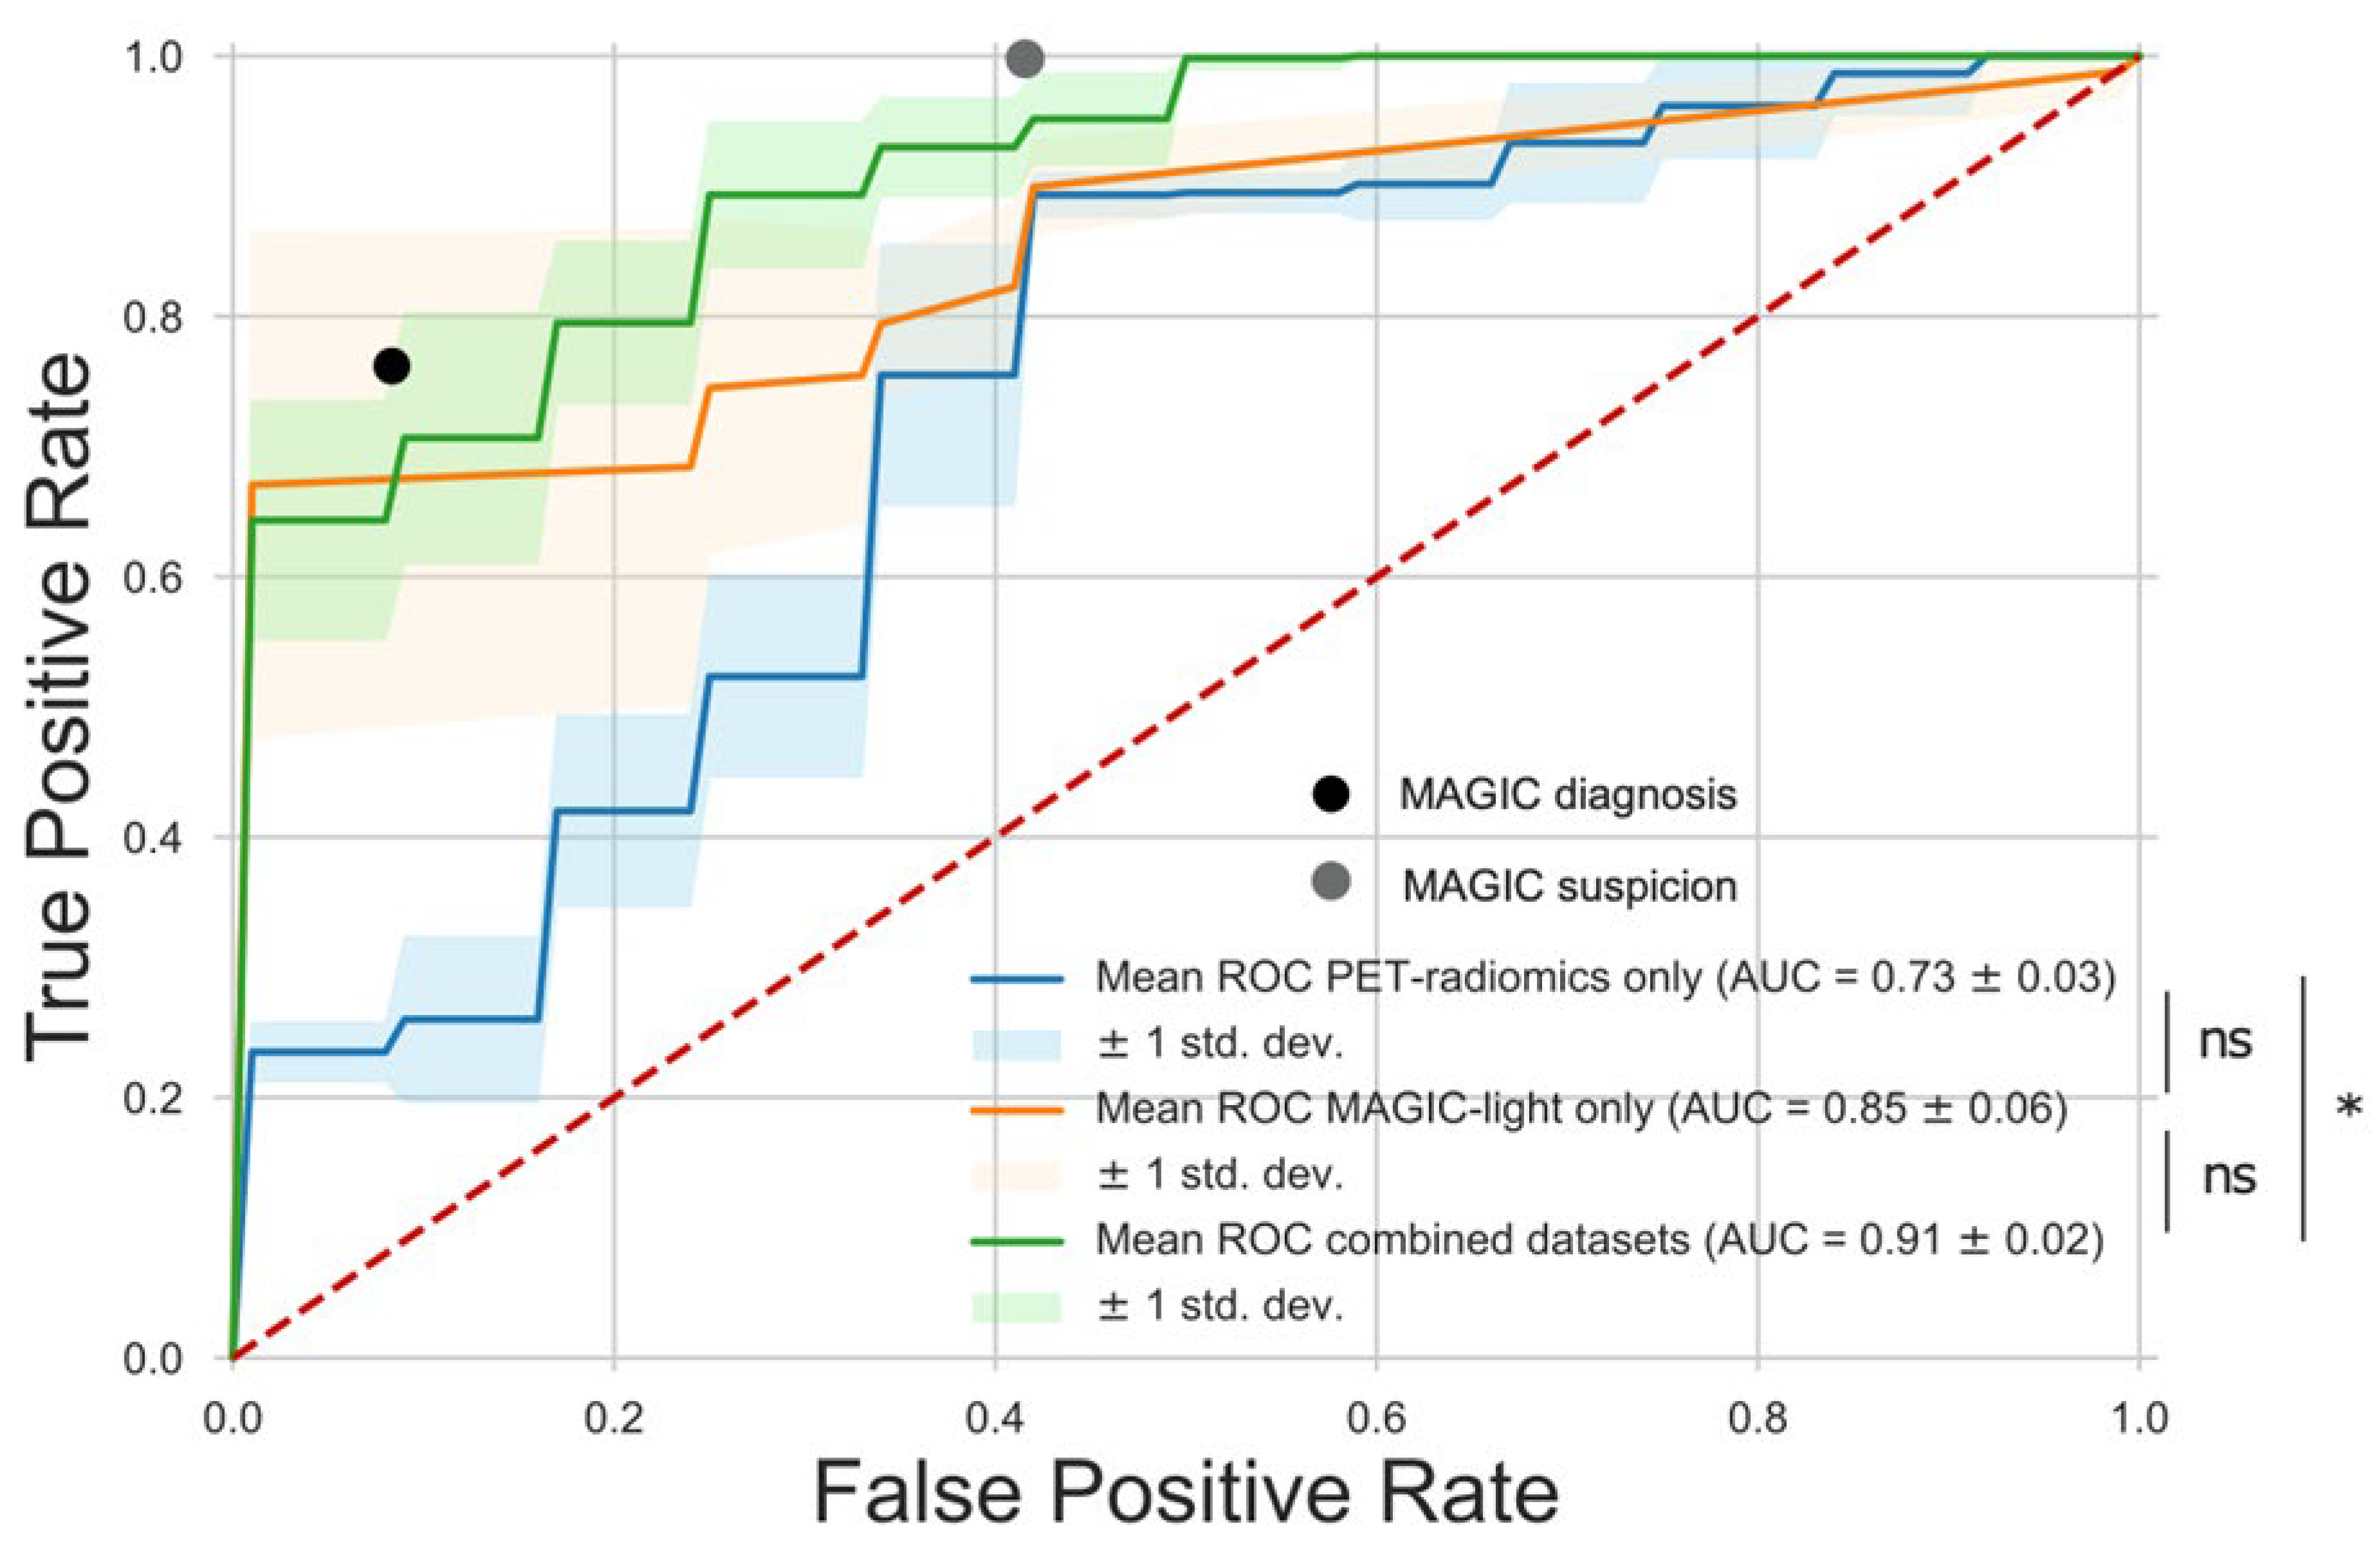
| Model | AUC ± SD | Accuracy | Sensitivity | Specificity |
|---|---|---|---|---|
| MAGIC diagnosis | - | 0.82 | 0.76 | 0.92 |
| MAGIC suspicion | - | 0.85 | 1.00 | 0.58 |
| MAGIC-light-only | 0.85 ± 0.06 | 0.78 | 0.65 | 1.00 |
| PET-radiomics-only | 0.73 ± 0.03 | 0.78 | 0.90 | 0.58 |
| Combined | 0.91 ± 0.02 | 0.91 | 0.70 | 1.00 |
| Feature | ICC | 95% CI |
|---|---|---|
| SUVmean | 0.99 | [0.96 1.00] |
| Texture: GLDM Dependence Variance | 0.99 | [0.95 1.00] |
| Texture: GLSZM Zone Entropy | 0.97 | [0.89 0.99] |
| Texture: GLRLM Run Entropy | 0.97 | [0.88 0.99] |
| Volume | 0.97 | [0.87 0.99] |
| Texture: NGTDM Contrast | 0.96 | [0.86 0.99] |
| SUVpeak | 0.96 | [0.83 0.99] |
| FOS: Skewness | 0.96 | [0.83 0.99] |
| Texture: NGTDM Coarseness | 0.95 | [0.82 0.99] |
| Texture: GLRLM Run-Length Non-Uniformity | 0.94 | [0.79 0.99] |
| Texture: GLDM Dependence Non-Uniformity Normalised | 0.92 | [0.71 0.98] |
| Texture: GLRLM Grey-Level Non-Uniformity | 0.92 | [0.71 0.98] |
| Texture: GLCM IDN | 0.91 | [0.69 0.98] |
| Texture: GLSZM Grey-Level Non-Uniformity | 0.90 | [0.66 0.98] |
| Texture: GLCM IDMN | 0.88 | [0.59 0.97] |
| Texture: GLSZM Small Area Emphasis | 0.62 | [0.04 0.89] |
Disclaimer/Publisher’s Note: The statements, opinions and data contained in all publications are solely those of the individual author(s) and contributor(s) and not of MDPI and/or the editor(s). MDPI and/or the editor(s) disclaim responsibility for any injury to people or property resulting from any ideas, methods, instructions or products referred to in the content. |
© 2025 by the authors. Licensee MDPI, Basel, Switzerland. This article is an open access article distributed under the terms and conditions of the Creative Commons Attribution (CC BY) license (https://creativecommons.org/licenses/by/4.0/).
Share and Cite
van Praagh, G.D.; Vos, F.; Legtenberg, S.; Wouthuyzen-Bakker, M.; Kouijzer, I.J.E.; Aarntzen, E.H.J.G.; de Vries, J.-P.P.M.; Slart, R.H.J.A.; Alic, L.; Sinha, B.; et al. Radiomics with Clinical Data and [18F]FDG-PET for Differentiating Between Infected and Non-Infected Intracavitary Vascular (Endo)Grafts: A Proof-of-Concept Study. Diagnostics 2025, 15, 1944. https://doi.org/10.3390/diagnostics15151944
van Praagh GD, Vos F, Legtenberg S, Wouthuyzen-Bakker M, Kouijzer IJE, Aarntzen EHJG, de Vries J-PPM, Slart RHJA, Alic L, Sinha B, et al. Radiomics with Clinical Data and [18F]FDG-PET for Differentiating Between Infected and Non-Infected Intracavitary Vascular (Endo)Grafts: A Proof-of-Concept Study. Diagnostics. 2025; 15(15):1944. https://doi.org/10.3390/diagnostics15151944
Chicago/Turabian Stylevan Praagh, Gijs D., Francine Vos, Stijn Legtenberg, Marjan Wouthuyzen-Bakker, Ilse J. E. Kouijzer, Erik H. J. G. Aarntzen, Jean-Paul P. M. de Vries, Riemer H. J. A. Slart, Lejla Alic, Bhanu Sinha, and et al. 2025. "Radiomics with Clinical Data and [18F]FDG-PET for Differentiating Between Infected and Non-Infected Intracavitary Vascular (Endo)Grafts: A Proof-of-Concept Study" Diagnostics 15, no. 15: 1944. https://doi.org/10.3390/diagnostics15151944
APA Stylevan Praagh, G. D., Vos, F., Legtenberg, S., Wouthuyzen-Bakker, M., Kouijzer, I. J. E., Aarntzen, E. H. J. G., de Vries, J.-P. P. M., Slart, R. H. J. A., Alic, L., Sinha, B., & Saleem, B. R. (2025). Radiomics with Clinical Data and [18F]FDG-PET for Differentiating Between Infected and Non-Infected Intracavitary Vascular (Endo)Grafts: A Proof-of-Concept Study. Diagnostics, 15(15), 1944. https://doi.org/10.3390/diagnostics15151944