
Leaky Gut Biomarkers as Predictors of Depression and Suicidal Risk: A Systematic Review and Meta-Analysis

 , , ,
, , ,
Abstract
1. Background
- i)
- Biomarkers indicative of increased intestinal permeability and bacterial translocation are positively associated with the severity of depressive symptoms;
- ii)
- These biomarkers are also elevated in individuals with a history or risk of suicidality, independently of diagnostic classification.
2. Methods
3. Quality of Evidence
4. Outcomes
5. Results

| Study | Marker (Sample) | Subjects | Gender (%F) | Age in Years (SD) | Stage of Mental Disorder/Severity | Scales | Assessment Scores (SD) | Psychiatric Comorbidity | Somatic Comorbidity | BMI (SD) | Smoking | Drinking | Main Findings |
|---|---|---|---|---|---|---|---|---|---|---|---|---|---|
| Ohlsson et al., 2019 [31] | I-FABP (Plasma) Zonulin (Plasma) sCD14 (Plasma) | MDD = 13 rSA = 54 HC = 17 | MDD = 53.8% rSA = 55.5% HC = 47.1% | MDD = 34.5 (11.5) rSA = 38.5 (14.5) HC = 34.4 (11.4) | Acute/Moderate to Severe (Depression); Mild to Severe Risk (Suicidality) | MADRS SUAS | MADRS MDD = 28.7 (7.6) rSA = 21.0 (11.7) HC = 0.8 (1.5) SUAS MDD = 28.3 (6.3) rSA = 38.8 (16.9) HC = 0.8 (2.2) | Only for rSA | Multiple | MDD = 25.9 (8.7) rSA = 25.7 (4.4) HC = 23.1 (3.1) | NR | NR | 1. ↓ Zonulin in rSA vs. HC/MDD 2. ↑ I-FABP in rSA vs. HC/MDD 3. = Zonulin, I-FABP, and sCD14 in MDD vs. HC 4. = sCD14 in all groups |
| Alvarez-Mon et al., 2019 [60] | I-FABP (Serum) Zonulin (Serum) LBP (Serum) | MDD = 22 HC = 14 | MDD = 59.1% HC = 57.1% | MDD = 40.3 (8.9) HC = 40.8 (10.5) | Chronic/Mild | HAM-D-17 | NR | None | NR | MDD = 26.45 (4.04) HC = 25.26 (3.87) | MDD = 22.7 % HC = 21.4 % | MDD = 13.6 % HC = 7.1 % | 1. ↑ I-FABP in MDD vs. HC 2. ↑ LBP in MDD vs. HC 3. = Zonulin in MDD vs. HC |
| Alvarez-Mon et al., 2021 [61] | I-FABP (Serum) Zonulin (Serum) LBP (Serum) | MDD = 30 HC = 20 | MDD = 63.3% HC = 60% | MDD = 43.26 (13.14) HC = 40.4 (12.46) | Chronic/Mild | HAM-D-17 | NR | None | NR | MDD = 26.74 (5.41) HC = 25.5 (5.36) | MDD = 33.3% HC = 15% | MDD = 10% HC = 5% | 1. ↑ I-FABP in MDD vs. HC 2. ↑LBP in MDD vs. HC 3. = Zonulin in MDD vs. HC |
| Wu et al., 2023 [62] | I-FABP (Plasma) Zonulin (Plasma) LBP (Plasma) | MDD = 50 HC = 40 | MDD = 70% HC = 67.5% | MDD = 16 (range: 14–16) HC = 15 (range: 14–16) | Chronic/Moderate to Severe | HAM-D-17 | MDD = 22.5 (range: 19–26) HC = 2 (range: 0–3) | None | None | MDD = 19.78 (range: 17.56–23.44) HC = 20.20 (range: 18.34–23.88) | NR | NR | ↑ I-FABP, Zonulin, LBP in MDD vs. HC |
| Osuna et al., 2024 [63] | I-FABP (Unclear) | MDD = 95 HC = 95 | MDD = 58% HC = 58% | MDD = 16.1 (range: 14.9–17.2) HC = 16.0 (range: 14.9–17.1) | Mixed/Moderate to severe | CDRS-R | MDD = 56 (range: 50–62) HC = 18 (range: 17–20) | None | NR | MDD = 0.25 (1.05) (BMI-for-age z-score) HC = 0.16 (1.02) (BMI-for-age z-score) | NR | NR | ↑ I-FABP in MDD vs. HC |
| Chen and Wu [64] | I-FABP (Plasma) sCD14 (Plasma) | nsMDD = 34 sMDD = 44 HC = 42 | nsMDD = 64.7% sMDD = 63.6% HC = 54.8% | nsMDD = 43.7 (11.2) sMDD = 41.7 (12.6) HC = 33.6 (12.2) | Chronic/Mild (Depression); Mild to Moderate Risk (Sucidality) | HAM-D BSSI HADS-D PHQ-9 | HAM-D nsMDD = 5.8 (4.5) sMDD = 11.5 (5.1) HC = 0.5 (1.2) BSSI nsMDD = 1.3 (3.1) sMDD = 12.5 (7.7) HC = 0.02 (0.2) HADS-D nsMDD = 6.7 (4.9) sMDD = 11.9 (4.5) HC = 2.6 (2.5) PHQ-9 nsMDD = 6.7 (5.6) sMDD = 16.0 (6.0) HC = 2.5 (2.8) | NR (Exclusion criteria = mental retardation, BD, SCZ) | NR | nsMDD = 43.7 (11.2) sMDD = 41.7 (12.6) HC = 33.6 (12.2) | NR | NR | = I-FABP and sCD14 in all groups |
| Zhong et al., 2022 [65] | I-FABP (Plasma) LBP (Plasma) sCD14 (Plasma) | PSD = 48 HC = 48 | PSD = 64.6% HC = 72.9% | PSD = 63 (10) HC = 66 (9.3) | Chronic/Mild | HAM-D-24 | PSD = 16.71 (6.56) HC = 4.52 (1.68) | None | PSD Hypertension = 64.6% Diabetes mellitus = 20.8% Pregress stroke = 4.1% HC none | PSD = 26.65 (2.61) HC = 26.26 (2.46) | NR | NR | ↑ I-FABP in PSD vs. HC = LBP and sCD14 in PSD vs. HC |
| Wang et al., 2023 [66] | I-FABP (Plasma) | PSD = 91 nPSD * = 208 | PSD = 28.6% nPSD = 29.3 | PSD = 65.6 (15.3) nPSD = 63.1 (14.3) | Chronic/Mild | HAM-D-24 | PSD = 14.1 (5.5) nPSD = 3.0 (1.7) | None | All participants = ischemic or haemorrhagic stroke PSD Hypertension = 75.2% Diabetes mellitus = 36.3% nPSD Hypertension = 67.8% Diabetes mellitus = 34.6% | NR | PSD = 34.1% nPSD = 34.6% | PSD = 33% nPSD = 43.7% | ↑ I-FABP in PSD vs. nPSD |
| Chojnacki et al., 2022 [21] | Calprotectin (Fecal) | SIBO = 40 HC = 40 | SIBO = 57.5% HC = 62.5% | SIBO = 45.2 (9.4) HC = 44.7 (7.3) | Chronic/Mild to Moderate | HAM-D | SIBO = 26.3 (4.26) HC = 9.85 (2.21) | NR | NR | SIBO = 22.4 (2.1) HC = 23.8 (1.6) | NR | NR | ↑ Fecal-C in SIBO vs. HC |
| Papakostas et al., 2013 [67] | A-1-AT (Serum) | MDD = 36 HC = 43 | MDD = 36.1% HC = 67.4% | MDD = 42.5 (9.8) HC = 30.0 (8.6) | Chronic/Severe | HAM-D-17 | MDD = 21.4 (4.4) HC = NA | NR (Exclusion criteria = BD or SCZ) | NR | MDD = 27.7 (5.8) HC = 24.4 (3.5) | NR | NR | ↑ A-1-AT in MDD vs. HC |
| Brouillet et al., 2023—male [68] | I-FABP (Plasma) LBP (Plasma) LPS (Plasma) Calprotectin (Plasma) | nsBD/MDD = 64 sBD/MDD = 40 | nsBD/MDD = 0% sBD/MDD = 0% | nsBD/MDD = 44.4 (13.8) sBD/MDD = 45.1 (14.1) | Acute/Unclear | IDS-C30 | nsBD/MDD = 22.7 (14.3) sBD/MDD = 24.9 (13.4) | NR | NR (Exclusion criteria = any acute inflammatory condition) | nsBD/MDD = 25.0 (4.0) sBD/MDD = 27.8 (5.8) | nsBD/MDD = 33.9% sBD/MDD = 46.7% | nsBD/MDD = 30.2% sBD/MDD = 46.2% | = Plasma-C and I-FABP in nsBD/MDD vs. sBD/MDD ↓ LBP in nsBD/MDD vs. sBD/MDD ↑ LPS in nsBD/MDD vs. sBD/MDD |
| Brouillet et al., 2023—female [68] | I-FABP (Plasma) LBP (Plasma) LPS (Plasma) Calprotectin (Plasma) | nsBD/MDD = 108 sBD/MDD = 93 | nsBD/MDD = 100% sBD/MDD = 100% | nsBD/MDD = 40.1 (14.1) sBD/MDD = 40.1 (12.8) | Acute/Unclear | IDS-C30 | nsBD/MDD = 24.7 (15.7) sBD/MDD = 31.7 (13.5) | NR | NR (Exclusion criteria = any acute inflammatory condition) | nsBD/MDD = 23.8 (6.3) sBD/MDD = 24.3 (5.3) | nsBD/MDD = 40.4% sBD/MDD = 51.8% | nsBD/MDD = 14.3% sBD/MDD = 30.0% | ↓ Plasma-C and LBP in nsBD/MDD vs. sBD/MDD = I-FABP and LPS in nsBD/MDD vs. sBD/MDD |
| Stewart et al., 2020—HIV+ [69] | sCD14 (Serum) | DAP = 348 nDAP = 1179 | DAP = 3% nDAP = 3% | DAP = 51.1 (7.6) nDAP = 51.9 (8.4) | NA | PHQ-9 | DAP = 15.9 (5.2) nDAP = 2.7 (2.9) | HIV+; DAP = ↑ hepatitis C infection vs. nDAP | DAP = ↑ cocaine abuse/dependence vs. nDAP | NR | DAP = 61% nDAP = 47% | DAP = 51% nDAP = 40% | ↑ sCD14 in DAP vs. nDAP |
| Stewart et al., 2020—HIV− [69] | sCD14 (Serum) | DAP = 263 nDAP = 574 | DAP = 12% nDAP = 9% | DAP = 52.0 (7.9) nDAP = 54.2 (9.8) | NA | PHQ-9 | DAP = 16.1 (4.9) nDAP = 2.9 (2.9) | DAP = ↑ hepatitis C infection, diabetes, triglycerides vs. nDAP | DAP = ↑ cocaine abuse/dependence vs. nDAP | NR | DAP = 57% nDAP = 43% | DAP = 49% nDAP = 44% | = sCD14 in DAP vs. nDAP |
| Just et al., 2024 [70] | LBP (Serum) | AAD = 395 HC = 102 | AAD = 78% HC = 70.6% | AAD = 21.4 (2.2) HC = 25.6 (9.1) | Mixed/Mild to Moderate | MADRS-S | AAD = 22.8 (9.3) HC = 6.7 (5.6) | NR | AAD = Multiple comorbidity | AAD = 23.5 (4.9) HC = 22.6 (3.0) | AAD = 25.32% HC = 0.98% | AAD = 10.13% HC = 4.9% | = LBP in AAD vs. HC |
| Musil et al., 2011 [71] | sCD14 (Serum) | MDD = 32 HC = 20 | MDD = 50% HC = 25% | MDD = 44.6 (11.7) HC = 40.0 (10.4) | Acute/Severe | HAM-D-17 | MDD = 24.5 (4.75) HC = NA | None | NR | MDD = 71.1 (15.1) HC = 65.4 (12.3) | MDD = 46.88% HC = 55% | NR | = sCD14 in MDD vs. HC |
| Zengil and Laloğlu 2022 [72] | Zonulin (Serum) Occludin (Serum) | BD-D = 7 (from BD = 44) HC = 44 | BD-D = NR HC = NR | BD-D = NR HC = 41.2 (13.1) | Chronic/Unclear | HAM-D-17 | BD-D = NR HC = NR | BD | NR | BD-D = NR HC = 22.6 (3.3) | BD-D = NR HC = 40.9% | BD-D = NR HC = 6.81% | ↑ Zonulin in BD-D (and BD) vs. HC ↑ Occludin in BD-D (and BD) vs. HC |
| Lee et al., 2024 [73] | Zonulin (Serum) I-FABP (Serum) | MD ** = 43 HC = 262 | MD = 100% HC = 100% | MD = 46 HC = 46 | Unclear | BDI-II | MD = NR HC = NR | NR | MD = 25 PCOS- MD+ = 18, PCOS-MD- = 84 | MD = 28.82 (5.75) HC = 27.74 (5.40) | MD = NR HC = NR | MD = NR HC = NR | ↓ Zonulin in MD vs. HC ↑ I-FABP in MD vs. HC |
| Maes et al., 2013 [74] | IgA to LPS (Serum) IgM to LPS (Serum) | MDD = 90 HC = 26 | MDD = NR HC = NR | MDD = 43.5 (11.3) HC = 40.3 (11.6) | Acute/Unclear | None | None | MDD = none HC = none | MDD = none HC = none | MDD = NR HC = NR | MDD = NR HC = NR | MDD = NR HC = NR | ↑ IgA to LPS in MDD vs. HC ↑ IgM to LPS in MDD vs. HC |
| Zhou et al., 2018 [75] | LPS (Plasma) | MDD = 14 HC = 14 | MDD = 100% HC = 100% | MDD = 29 (range: 23–33) HC = 30 (range: 25–32) | Acute (at first prenatal visit, 8–12 w)/Unclear | EPDS | NR | None | None | MDD = 32.5 (range: 25.5–37.3) HC = 33.0 (range: 26.3–38.3) | MDD = 7.1% HC = 0% | MDD = 0% HC = 0% | ↑ LPS in MDD vs. HC |
| Bai et al., 2021 [76] | A-1-AT (Serum) | nsMDD = 53 sMDD = 20 HC = 86 | nsMDD = 60% sMDD = 62.3% HC = 60.5% | nsMDD = 37.34 (13.18) sMDD = 32.34 (14.43) HC = 37.35(13.94) | Acute/Severe (Depression); Mild to Moderate Risk (Sucidality) | HAM-D BSSI | HAM-D nsMDD = 26.80 (7.11) sMDD = 32.34 (8.50) HC = 1.35 (1.48) BSSI nsMDD = 7.55 (1.43) sMDD = 12.64 (2.65) HC = 0.47 (0.88) | None except anxiety disorder | None | nsMDD = 24.61 (1.81) sMDD = 23.41 (2.37) HC = 23.09 (2.14) | nsMDD = 20% sMDD-SI = 30.2% HC = 30.2% | NR | ↓ A-1-AT in nsMDD and sMDD vs. HC ↓ A-1-AT in sMDD vs. nsMDD |
| Bai et al., 2022 [77] | A-1-AT (Serum) | MDD = 56 HC = 56 | MDD = 67.8% HC = 64.3% | MDD = 35.11 (16.79) HC = 35.71 (15.99) | Unclear/Severe | HAM-D | MDD = 24.86 (5.94) HC = 0.71 (0.95) | NR | NR | MDD = 20.94 (2.37) HC = 21.23 (4.27) | NR | NR | ↓ A-1-AT in MDD vs. HC |
| Karaoulanis et al., 2014 [78] | A-1-AT (Serum) | MDD = 39 HC = 26 | MDD = 100% HC = 100% | MDD = 50.10 (3.95) HC = 48.29 (10.95) | Unclear/Moderate to Severe | HAM-D-17 | MDD = 16.85 (5.02) HC = 5.68 (2.52) | MDD = none HC = none | All sample = perimenopausal phase, characterized by the presence of irregular cycles or amenorrhea for less than 12 months | MDD = NR HC = NR | MDD = 36.6% HC = 29.2% | MDD = 0.02% HC = 0 | = A-1-AT in MDD vs. HC |
| Maget et al., 2021 [79] | Zonulin (Serum) | P-Dep *** = 55 P-Eut = 37 | P-Dep = 25% P-Eut = 37.8% | P-Dep = P-Eut = | Mixed/Mild to Moderate | HAM-D | P-Dep = 16.25 (4.90) P-Eut = 3.84 (3.24) | P-Dep = BD 81.1% P-Eut = BD 14.3% | NR | P-Dep = 27.81 (5.87) P-Eut = 28.36 (6.57) | P-Dep = 45.3% P-Eut = 42.9% | NR | = Zonulin in P-Dep vs. P-Eut |
| Dickerson et al., 2017 [80] | IgA to LPS (Plasma) | p-nSA **** = 95 p-pSA = 95 p-rSA = 20 HC = 72 | p-nSA = 43% p-pSA = 46% p-rSA = 65% HC = 64% | p-nSA = 35.4 (13.4) p-pSA = 39.3 (13.2) p-rSA = 37.0 (14.7) HC = 33.1 (11.4) | Mixed/Moderate to Severe | BPRS | p-nSA = 48.1 (8.7) p-pSA = 50.0 (7.9) p-rSA = 50.8 (6.4) HC = NA | p-nSA SZ = 39 (41%), BD = 37 (39%), MDD = 19 (20%) p-pSA SZ = 50 (53%), BD = 29 (31%), MDD = 16 (17%) p-rSA SZ = 1 (5%), BD = 6 (30%), MDD = 13 (65%) | NR | p-nSA = 30.7 (8.7) p-pSA = 32.1 (9.5) p-rSA = 29.2 (4.6) HC = 28.1 (7.3) | NR | p-nSA = 13 (14%) p-pSA = 22 (23%) p-rSA = 7 (35%) HC = NA | ↑ LPS in p-rSA vs. HC |
| Maes et al., 2008 [58] | IgM and IgA to LPS (of 6 enterobacteria) (Serum) | MDD = 28 HC = 23 | MDD = 60.7 HC = 69.6 | MDD = 44.3 (11.2) HC = 40.0 (12.9) | Unclear/Unclear | None | NA | None | Unclear | NR | NR | NR | ↑ IgM/IgA to LPS in MDD vs. HC |
| Maes et al., 2019 [59] | IgM and IgA to LPS (of 6 Gram- bacteria) (Serum) | MD = 22 HC = 96 | MD = 46.9 HC = 36.4 | MD = 42.4 (13.2) HC = 38.2 (13.3) | Acute/Severe | HAM-D | NR | MD BP1 = 27, BP2 = 25, MDD = 44 | Unclear | MD = 25.4 (2.8) HC = 25.3 (3.8) | NR | NR | ↑ IgM/IgA to LPS in MD vs. HC |
| Stevens et al., 2018 [81] | LPS (Plasma) Zonulin (Plasma) I-FABP (Plasma) | DEP/ANX = 22 HC = 28 | DEP/ANX = 56% HC = 56% | NR | Unclear/Unclear | None | NA | Unclear | Unclear (but asymptomatic for GI disorders) | NR | NR | NR | ↑ LPS, Zonulin, I-FABP in DEP/ANX vs. HC |
| Study | Marker (Sample) | Subjects | Gender (%F) | Age in Years | Stage of Mental Disorder/Severity | Scales | Assesment Scores | Psychiatric Comorbidity | Somatic Comorbidity | BMI | Smoking | Drinking | Correlation Type/Value |
|---|---|---|---|---|---|---|---|---|---|---|---|---|---|
| Iordache et al., 2022 [82] | I-FABP (Serum) LBP (Serum) Zonulin (Serum) Calprotectin (Fecal) | IBD = 30 | 50% | Almost 50% in the range 40–60 | Unclear | PHQ-9 | 6.50 [6.00] (median [IQR]) | NR | CD = 40%, UC = 60% | NR | 26.67% | 66.67% | I-FABP ρ = −0.059 (p = 0.755) LBP ρ = 0.398 (p = 0.029) Zonulin ρ = 0.016 (p = 0.934) Calprotectin ρ = 0.416 (p = 0.022) |
| Liśkiewicz et al., 2021 [83] | I-FABP (Plasma) LBP (Serum) Zonulin (Serum) Calprotectin (Fecal) | MDD = 16 | 50% | 44.0 [34.3–56.3] (median [IQR]) | Acute/Moderate to Severe | HAM-D-24 | 23.0 (21.0–28.5) (median [IQR]) | NR | NR | 25.0 (22.4–26.7) (median [IQR]) | NR | NR | I-FABP ρ = 0 (p > 0.05) LBP ρ = 0.2 (p > 0.05) Zonulin ρ = 0.15 (p > 0.05) Calprotectin ρ = 0.1 (p > 0.05) |
| Rajkovaca Latic et al., 2024 [84] | Calprotectin (Fecal) Beta-defensin 2 (Fecal) sIgA (Fecal) Zonulin (Fecal) Lactoferrin (Fecal) | Parkinson’s disease = 64 | 25% | 66 [57–70] (median [IQR]) | Unclear | BDI-II | NR | NR | NR | NR | NR | NR | Calprotectin ρ = 0.255 (p = 0.04) Beta-defensin 2 ρ = 0.117 (p = 0.36) sIgA ρ = 0.255 (p = 0.04) Zonulin ρ = −0.192 (p = 0.13) Lactoferrin ρ = −0.060 (p = 0.64) |
| Brouillet et al., 2023 male [68] | Calprotectin (Plasma) I-FABP (Plasma) LBP (Plasma) LPS (Plasma) | MDD = 104 | 0% | Unclear (range: 19–79) | Acute/Unclear | IDS-C30 | Unclear (range: 0–58) | BD = almost half of participants | NR | Unclear (range: 16.3–41.8) | Unclear | Unclear | Calprotectin ρ = 0.12 (p > 0.05) I-FABP ρ = −0.2 (p > 0.05) LBP ρ = −0.5 (p > 0.05) LPS ρ = −0.22 (p < 0.05) |
| Brouillet et al., 2023 female [68] | Calprotectin (Plasma) I-FABP (Plasma) LBP (Plasma) LPS (Plasma) | MDD = 201 | 100% | Unclear (range: 18–70) | Acute/Unclear | IDS-C30 | Unclear (range: 0–61) | BD = almost half of participants | NR | Unclear (range: 12.9–53.6) | Unclear | Unclear | Calprotectin ρ = 0.12 (p > 0.05) I-FABP ρ = −0.12 (p > 0.05) LBP ρ = −0.09 (p > 0.05) LPS ρ = −0.08 (p > 0.05) |
| Hussain et al., 2023 [85] | sCD14 (Plasma) | HIV+ = 82 (current depression in 7.4% of the sample) | 13.4% | 53.2 [9.0] (mean [SD]) | Unclear | CES-D | 19.4 [8.3] (mean [SD]) | Current Substance Abuse (% yes) 7.4%; Lifetime Substance Use Disorderc (% yes) 59.8% | Multiple (mostly metabolic) | NR | NR | NR | sCD14 ρ = 0.03 (p = 0.76) |
| Oktayoglu et al., 2015 [86] | Calprotectin (Serum) | Behçet’s disease = 48 | 47.9% | 35.5 [12.2] (mean [SD]) | Unclear | HADS-D | 6 [4–8] (median [IQR]) | NR | Behçet’s disease | NR | NR | NR | Calprotectin ρ = 0.148 (p = 0.315) |
| Madison et al., 2020 [87] | LBP (Serum) sCD14 (Serum) | Patients at Breast Unit = 305 (with malign = 209 and benign = 106 diagnosis) | 100 | 55.8 [11.1] (mean [SD]) | Unclear | CES-D | Unclear (range: 0−49) | NR | Breast Cancer Survivors = 209 | 28.7 [7.37] (mean [SD]) | 11.33% | NR | LBP r = 0.111 (p > 0.05) sCD14 r = 0.051 (p > 0.05) |
| Bellei et al., 2019 [88] | A-1-AT (Plasma) | HS-RLS = 14 | 71.4% | 45.3 [6.7] (mean [SD]) | Unclear | BDI | Unclear | NR | NR | NR | 57.1% | NR | A-1-AT ρ = 0.053 (p = 0.857) |
| Hirten et al., 2021 [89] | Calprotectin (Fecal) | UC = 15 | 60% | 33 (median) | Unclear | PSS-4 | 5 [5–11] (median [IQR]) | NR | Multiple | 26 (median) | 0 | NR | Calprotectin PSS-4 not significantly associated with FC |
| Kiecolt-Glaser et al., 2018 [90] | LBP (Serum) sCD14 (Serum) | Married couples = 43 (total participants = 86) | 50% | 38.22 [8.18] (mean [SD]) | NA | CES-D | Unclear | Past mood disorder = 16; Current mood disorder = 2 (MDD = 1, Dysthymia = 1) | No chronic illnesses | 32.07 [5.83] (mean [SD]) | 0% | NR | Regression model LBP n.s. sCD14 n.s. |
| Cai et al., 2024 [91] | I-FABP (Serum) | Chronic insomnia disorder = 75 | 60% | 42.00 (27.5–53.0) (median [IQR]) | NA | HAM-D | 6 [3–7.5] (median [IQR]) | None | No severe physical illnesses | 21.99 [2.90] (mean [SD]) | NR | NR | I-FABP ρ = −0.22 (p = 0.057) |
| Lundgren et al., 2016 [92] | Calprotectin (Fecal) | UC = 55 | 45% | 49 [14.2] (mean [SD]) | NA | HADS-D | 3.29 [2.69] (mean [SD]) | NR | NR | NR | NR | NR | Calprotectin ρ = 0.103 (p = 0.317) |
| Yee et al., 2017 [93] | A-1-AT gene (Whole blood) | FEP = 43 | 51.2% | 29.4 [8.0] (mean [SD]) | Unclear | PANSS-D | 6.6 [3.5] (mean [SD]) | NR | NR | 22.8 [5.1] (mean [SD]) | 25.6% | NR | Regression model Beta = 0.380, p = 0.016 (when adjusted for age, gender, smoking status, and chlorpromazine equivalents) |
| Brys et al., 2020 [94] | LPS (Serum) | Patients on a chronic haemodialysis treatment = 59 | 36% | 61 [15] (mean [SD]) | NA | GDS | 9.7 [6.3] (mean [SD]) | Unclear | NR | 25.8 [8.3] (mean [SD]) | NR | NR | LPS ρ = 0.21 [−0.04, 0.44], p = n.s. |
| Işık et al., 2020 [95] | Zonulin (Serum) | OCD = 24 | 45.8% | 14.3 [2] (mean [SD]) | Unclear | RCADS-CV MDD | 10.6 [7.6] (mean [SD]) | NR | NR | 56.84 [31.37] (mean [SD])—percentile | NR | NR | Zonulin ρ = –0.016 (p = 0.942) |
| Kılıç et al., 2020 [96] | Zonulin (Serum) | BD = 41 | 56% | 36.3 [11.8] (mean [SD]) | FR = 21, ME = 20 | HAM-D | 4.54 [3.20] (mean [SD]) | NR | NR | 26.4 [2.9] (mean [SD]) | 44% | NR | Zonulin ρ = NR, p = n.s. |
| Meinitzer et al., 2020 [97] | Zonulin (Serum) | Outpatients admitted to CMA testing (=251; CMA+ = 115, CMA− = 136) | 63.7% | 40:6 [14.5] (mean [SD]) | NA | BDI-II | 10 [3.20] (median [IQR]) | Unclear | Half of 115 CMA with lactose and/or fructosemalabsorption | NR | NR | NR | Zonulin ρ = 0.012, p = 0.854 |
| Varanoske et al., 2022 [98] | LBP (Serum) | Male U.S. Marines = 68 | 0% | 25 [3] (mean [SD]) | NA | PHQ-9 | 0.0 [2.0] (mean [SD]) | Unclear | Unclear | 26.3 [2.1] (mean [SD]) | NR | NR | LBP ρ = −0.374, p = 0.013 |
| Louzada and Ribeiro 2020 [99] | I-FABP (Plasma) LPS (Plasma) | Apparently healthy participants = 74 | NR | 65–90 (range) | NA | GDS-15 | NR | NR | NR | NR | NR | NR | Regression model I-FABP Beta = 0.08, p = 0.55 LPS Beta = 0.05, p = 0.74 |
6. Differences in Biomarkers in Depressive Patients vs. Controls
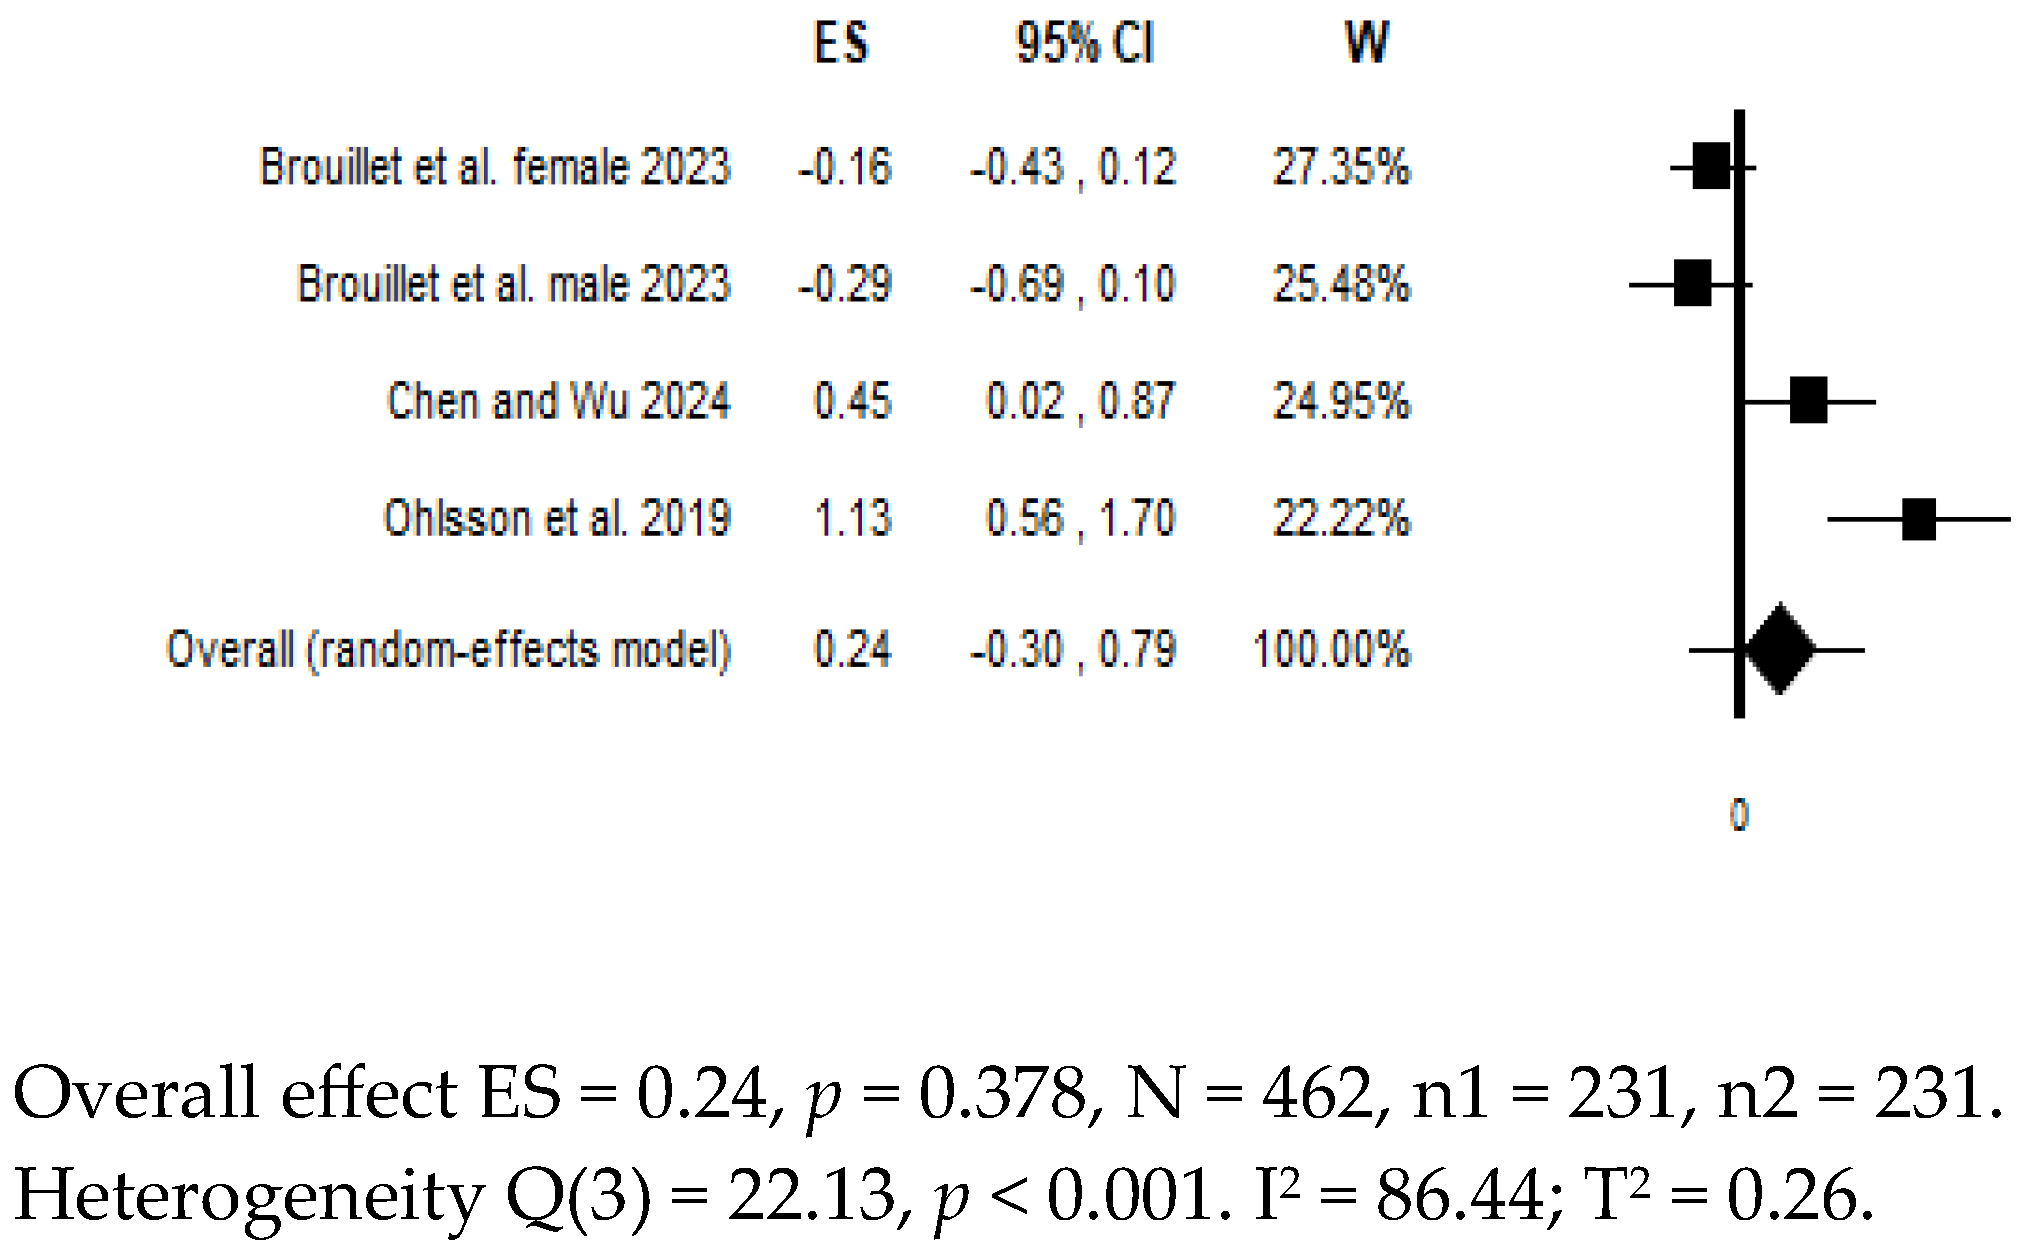
7. Differences in Biomarkers in Suicidal Patients vs. Controls
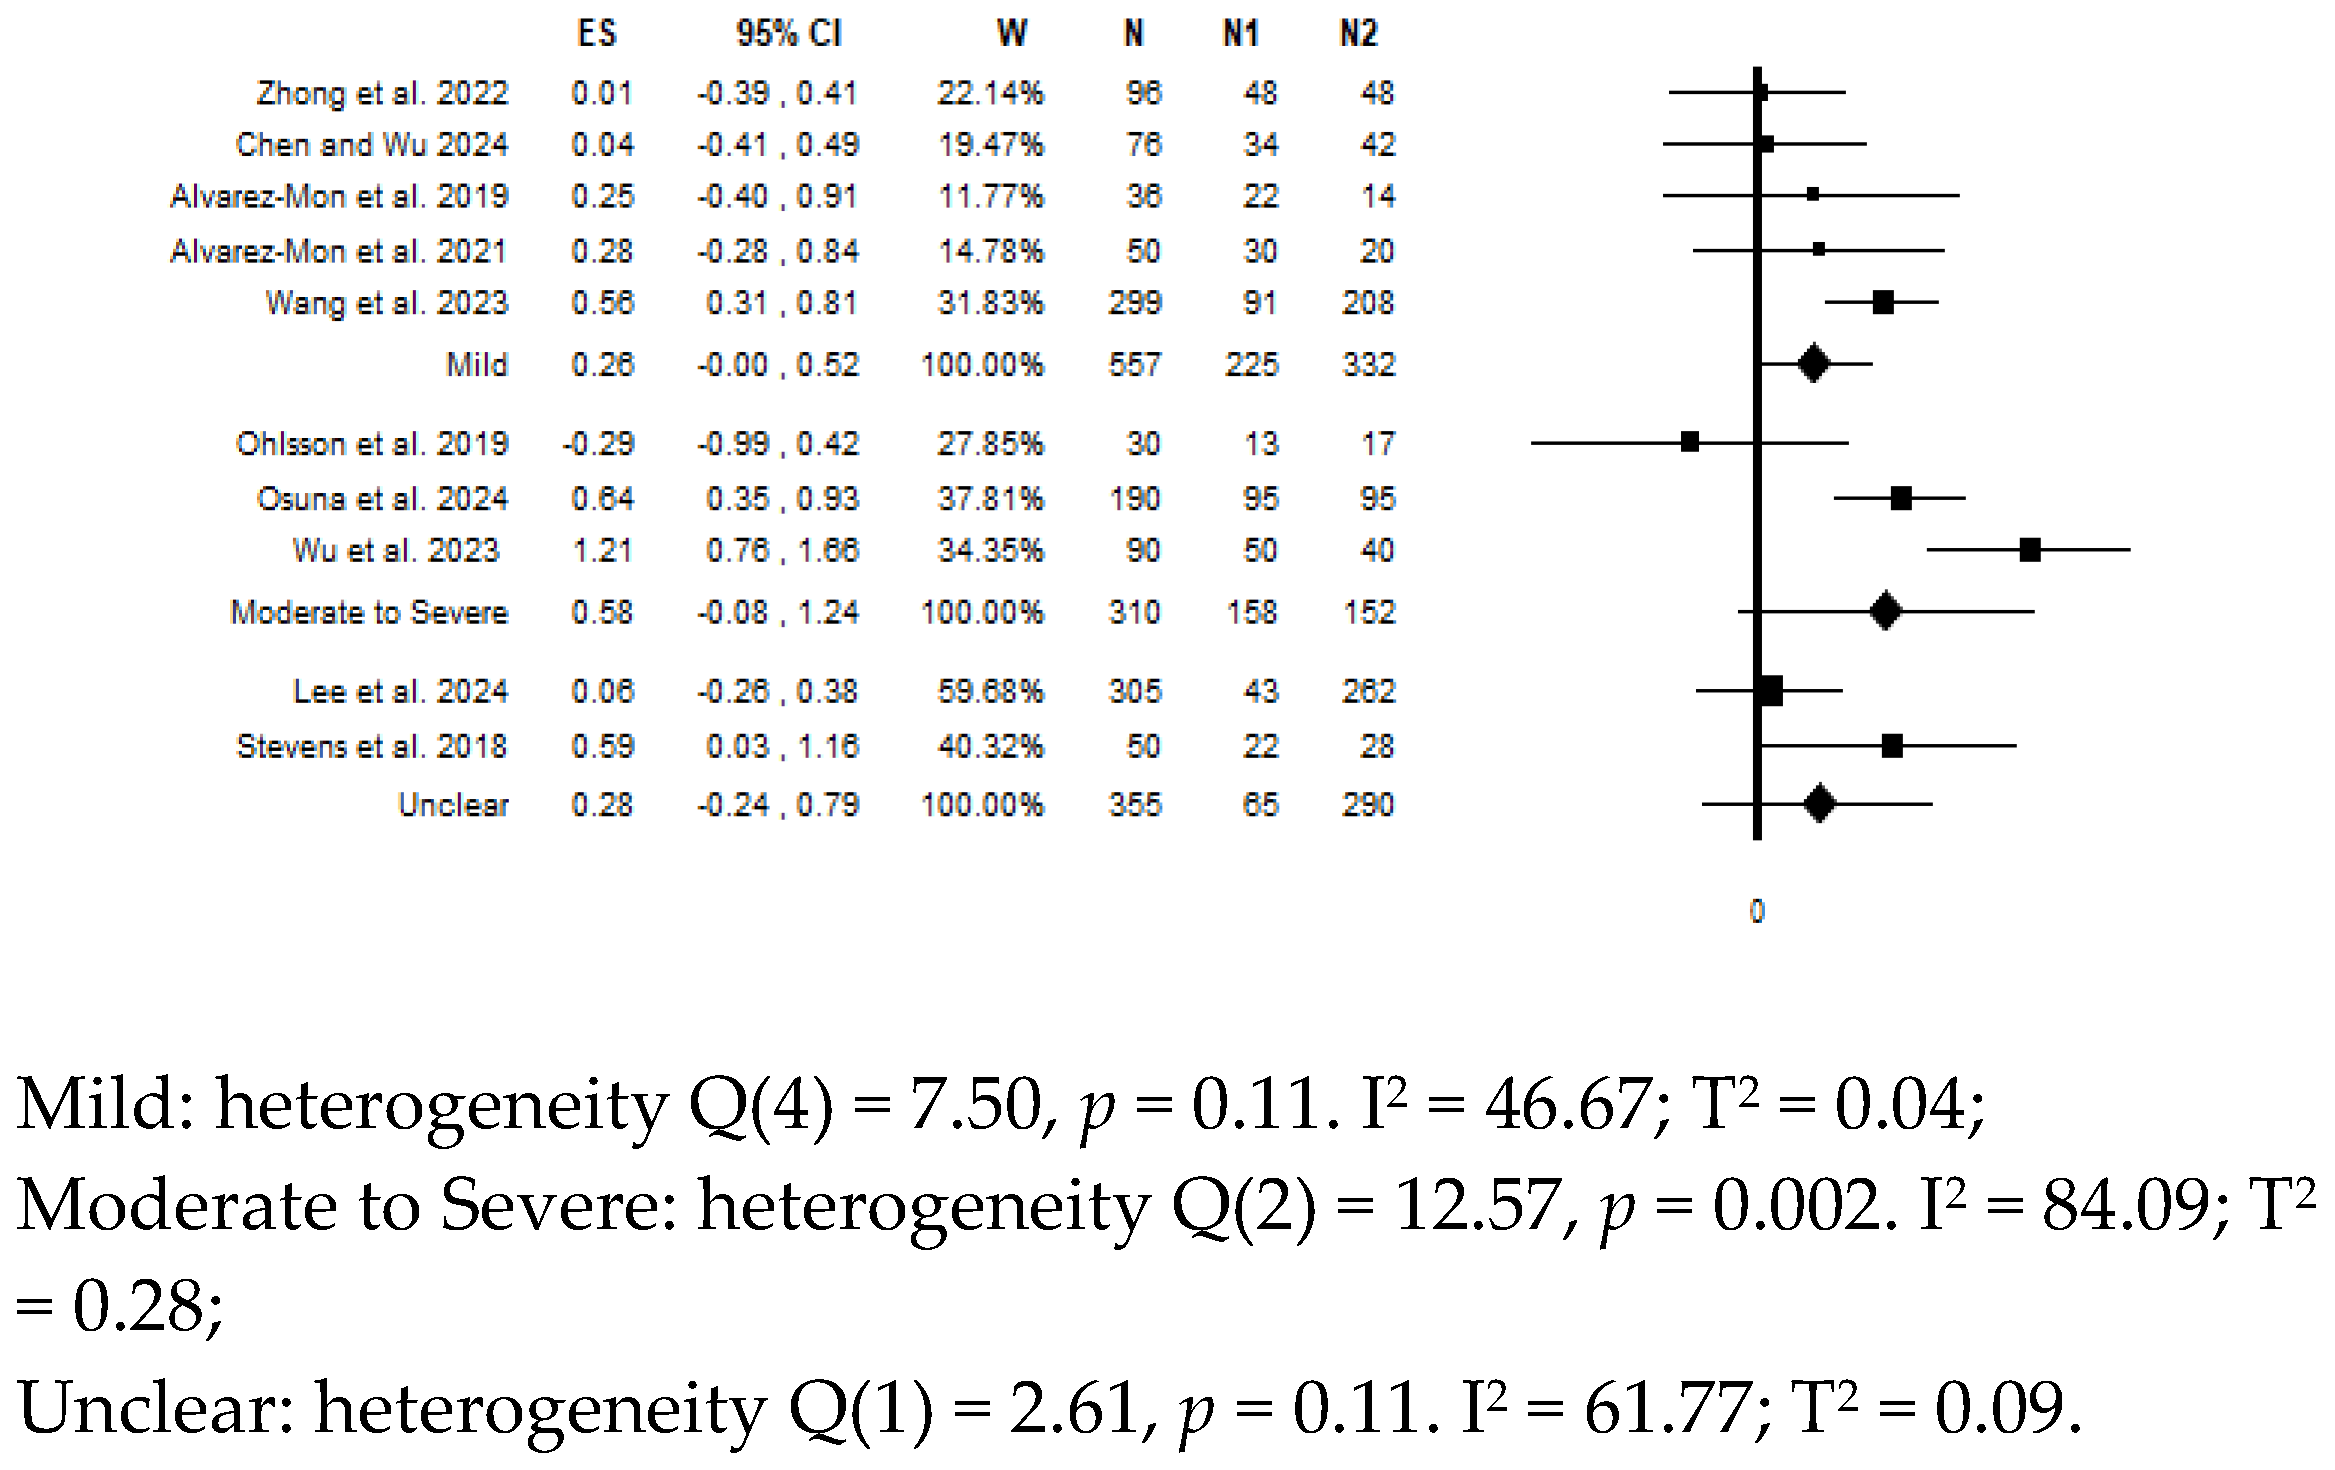
8. Moderator Analysis for Depressive Symptoms Severity
9. Other Studies Not Included in the Meta-Analysis
10. Studies on the Correlation Between Depressive Symptoms and Levels of Proxy Biomarkers
11. Discussion
12. Limits
13. Conclusions
Supplementary Materials
Author Contributions
Funding
Institutional Review Board Statement
Informed Consent Statement
Data Availability Statement
Acknowledgments
Conflicts of Interest
Abbreviations
References
- World Health Organization. World Mental Health Report: Transforming Mental Health for All; World Health Organization: Geneva, Switzerland, 2022.
- GBD 2021 Diseases and Injuries Collaborators. Global incidence, prevalence, years lived with disability (YLDs), disability-adjusted life-years (DALYs), and healthy life expectancy (HALE) for 371 diseases and injuries in 204 countries and territories and 811 subnational locations, 1990–2021: A systematic analysis for the Global Burden of Disease Study 2021. Lancet 2024, 403, 2133–2161. [Google Scholar]
- Cui, L.; Li, S.; Wang, S.; Wu, X.; Liu, Y.; Yu, W.; Wang, Y.; Tang, Y.; Xia, M.; Li, B. Major depressive disorder: Hypothesis, mechanism, prevention and treatment. Signal Transduct. Target. Ther. 2024, 9, 30. [Google Scholar] [CrossRef] [PubMed]
- Delgado, P.L.; Price, L.H.; Miller, H.L.; Salomon, R.M.; Aghajanian, G.K.; Heninger, G.R.; Charney, D.S. Serotonin and the neurobiology of depression. Effects of tryptophan depletion in drug-free depressed patients. Arch. Gen. Psychiatry 1994, 51, 865–874. [Google Scholar] [CrossRef] [PubMed]
- Schildkraut, J.J. The catecholamine hypothesis of affective disorders: A review of supporting evidence. Am. J. Psychiatry 1965, 122, 509–522. [Google Scholar] [CrossRef] [PubMed]
- Nestler, E.J.; Carlezon, W.A. The mesolimbic dopamine reward circuit in depression. Biol. Psychiatry 2006, 59, 1151–1159. [Google Scholar] [CrossRef]
- Zarate, C.A., Jr.; Singh, J.B.; Carlson, P.J.; Brutsche, N.E.; Ameli, R.; Luckenbaugh, D.A.; Charney, D.S.; Manji, H.K. A Randomized Trial of an N-methyl-D-aspartate Antagonist in Treatment-Resistant Major Depression. Arch. Gen. Psychiatry 2006, 63, 856–864. [Google Scholar] [CrossRef]
- Duman, R.S.; Monteggia, L.M. A neurotrophic model for stress-related mood disorders. Biol. Psychiatry 2006, 59, 1116–1127. [Google Scholar] [CrossRef]
- Pariante, C.M.; Lightman, S.L. The HPA axis in major depression: Classical theories and new developments. Trends Neurosci. 2008, 31, 464–468. [Google Scholar] [CrossRef]
- Miller, A.H.; Raison, C.L. The role of inflammation in depression: From evolutionary imperative to modern treatment target. Nat. Rev. Immunol. 2016, 16, 22–34. [Google Scholar] [CrossRef]
- O’Brien, S.M.; Scott, L.V.; Dinan, T.G. Cytokines: Abnormalities in major depression and implications for pharmacological treatment. Hum. Psychopharmacol. 2004, 19, 397–403. [Google Scholar] [CrossRef]
- Sekar, A.; Bialas, A.R.; de Rivera, H.; Davis, A.; Hammond, T.R.; Kamitaki, N.; Tooley, K.; Presumey, J.; Baum, M.; Van Doren, V.; et al. Schizophrenia risk from complex variation of complement component 4. Nature 2016, 530, 177–183. [Google Scholar] [CrossRef] [PubMed]
- Troubat, R.; Barone, P.; Leman, S.; Desmidt, T.; Cressant, A.; Atanasova, B.; Brizard, B.; El Hage, W.; Surget, A.; Belzung, C.; et al. Neuroinflammation and depression: A review. Eur. J. Neurosci. 2021, 53, 151–171. [Google Scholar] [CrossRef]
- Mayer, E.A.; Nance, K.; Chen, S. The Gut–Brain Axis. Annu. Rev. Med. 2022, 73, 439–453. [Google Scholar] [CrossRef] [PubMed]
- Milaneschi, Y.; Lamers, F.; Berk, M.; Penninx, B.W.J.H. Depression Heterogeneity and Its Biological Underpinnings: Toward Immunometabolic Depression. Biol. Psychiatry 2020, 88, 369–380. [Google Scholar] [CrossRef] [PubMed]
- Agirman, G.; Yu, K.B.; Hsiao, E.Y. Signaling inflammation across the gut-brain axis. Science 2021, 374, 1087–1092. [Google Scholar] [CrossRef]
- Richardson, B.; MacPherson, A.; Bambico, F. Neuroinflammation and neuroprogression in depression: Effects of alternative drug treatments. Brain Behav. Immun.-Health 2022, 26, 100554. [Google Scholar] [CrossRef]
- Borgiani, G.; Possidente, C.; Fabbri, C.; Oliva, V.; Bloemendaal, M.; Arias Vasquez, A.; Dinan, T.G.; Vieta, E.; Menchetti, M.; De Ronchi, D.; et al. The bidirectional interaction between antidepressants and the gut microbiota: Are there implications for treatment response? Int. Clin. Psychopharmacol. 2025, 40, 3–26. [Google Scholar] [CrossRef]
- Raison, C.L.; Capuron, L.; Miller, A.H. Cytokines sing the blues: Inflammation and the pathogenesis of depression. Trends Immunol. 2006, 27, 24–31. [Google Scholar] [CrossRef]
- Furness, J.B. The enteric nervous system and neurogastroenterology. Nat. Rev. Gastroenterol. Hepatol. 2012, 9, 286–294. [Google Scholar] [CrossRef]
- Chojnacki, C.; Konrad, P.; Błońska, A.; Medrek-Socha, M.; Przybylowska-Sygut, K.; Chojnacki, J.; Poplawski, T. Altered Tryptophan Metabolism on the Kynurenine Pathway in Depressive Patients with Small Intestinal Bacterial Overgrowth. Nutrients 2022, 15, 3217. [Google Scholar] [CrossRef]
- Di Vincenzo, F.; Del Gaudio, A.; Petito, V.; Lopetuso, L.R.; Scaldaferri, F. Gut microbiota, intestinal permeability, and systemic inflammation: A narrative review. Intern. Emerg. Med. 2024, 19, 275–293. [Google Scholar] [CrossRef]
- Rogers, G.B.; Keating, D.J.; Young, R.L.; Wong, M.-L.; Licinio, J.; Wesselingh, S. From gut dysbiosis to altered brain function and mental illness: Mechanisms and pathways. Mol. Psychiatry 2016, 21, 738–748. [Google Scholar] [CrossRef] [PubMed]
- Wong, M.-L.; Inserra, A.; Lewis, M.D.; Mastronardi, C.A.; Leong, L.; Choo, J.; Kentish, S.; Xie, P.; Morrison, M.; Wesselingh, S.L.; et al. Inflammasome signaling affects anxiety- and depressive-like behavior and gut microbiome composition. Mol. Psychiatry 2016, 21, 797–805. [Google Scholar] [CrossRef] [PubMed]
- Zheng, P.; Zeng, B.; Zhou, C.; Liu, M.; Fang, Z.; Xu, X.; Zeng, L.; Chen, J.; Fan, S.; Du, X.; et al. Gut microbiome remodeling induces depressive-like behaviors through a pathway mediated by the host’s metabolism. Mol. Psychiatry 2016, 21, 786–796. [Google Scholar] [CrossRef] [PubMed]
- Góralczyk-Bińkowska, A.; Szmajda-Krygier, D.; Kozłowska, E. The Microbiota-Gut-Brain Axis in Psychiatric Disorders. Int. J. Mol. Sci. 2022, 23, 11245. [Google Scholar] [CrossRef]
- Weiss, G.A.; Hennet, T. Mechanisms and consequences of intestinal dysbiosis. Cell Mol. Life Sci. 2017, 74, 2959–2977. [Google Scholar] [CrossRef]
- Cao, S.; Zhang, Q.; Wang, C.; Wu, H.; Jiao, L.; Hong, Q.; Hu, C. LPS challenge increased intestinal permeability, disrupted mitochondrial function and triggered mitophagy of piglets. Innate Immun. 2018, 24, 221–230. [Google Scholar] [CrossRef]
- Chang, L.; Wei, Y.; Hashimoto, K. Brain-gut-microbiota axis in depression: A historical overview and future directions. Brain Res. Bull. 2022, 182, 44–56. [Google Scholar] [CrossRef]
- Doney, E.; Cadoret, A.; Dion-Albert, L.; Lebel, M.; Menard, C. Inflammation-driven brain and gut barrier dysfunction in stress and mood disorders. Eur. J. Neurosci. 2022, 55, 2851–2894. [Google Scholar] [CrossRef]
- Ohlsson, L.; Gustafsson, A.; Lavant, E.; Suneson, K.; Brundin, L.; Westrin, Å.; Ljunggren, L.; Lindqvist, D. Leaky gut biomarkers in depression and suicidal behavior. Acta Psychiatr. Scand. 2019, 139, 185–193. [Google Scholar] [CrossRef]
- Obrenovich, M.E.M. Leaky Gut, Leaky Brain? Microorganisms 2018, 6, 107. [Google Scholar] [CrossRef] [PubMed]
- Braniste, V.; Al-Asmakh, M.; Kowal, C.; Anuar, F.; Abbaspour, A.; Tóth, M.; Korecka, A.; Bakocevic, N.; Ng, L.G.; Kundu, P.; et al. The gut microbiota influences blood-brain barrier permeability in mice. Sci. Transl. Med. 2014, 6, 263ra158. [Google Scholar] [CrossRef]
- Morris, G.; Fernandes, B.S.; Puri, B.K.; Walker, A.J.; Carvalho, A.F.; Berk, M. Leaky brain in neurological and psychiatric disorders: Drivers and consequences. Aust. N. Z. J. Psychiatry 2018, 52, 924–948. [Google Scholar] [CrossRef]
- Spadoni, I.; Zagato, E.; Bertocchi, A.; Paolinelli, R.; Hot, E.; Di Sabatino, A.; Caprioli, F.; Bottiglieri, L.; Oldani, A.; Viale, G.; et al. A gut-vascular barrier controls the systemic dissemination of bacteria. Science 2015, 350, 830–834. [Google Scholar] [CrossRef]
- Carloni, S.; Bertocchi, A.; Mancinelli, S.; Bellini, M.; Erreni, M.; Borreca, A.; Braga, D.; Giugliano, S.; Mozzarelli, A.M.; Manganaro, D.; et al. Identification of a choroid plexus vascular barrier closing during intestinal inflammation. Science 2021, 374, 439–448. [Google Scholar] [CrossRef]
- Verhoeven, J.E.; Wolkowitz, O.M.; Barr Satz, I.; Conklin, Q.; Lamers, F.; Lavebratt, C.; Lin, J.; Lindqvist, D.; Mayer, S.E.; Melas, P.A.; et al. The researcher’s guide to selecting biomarkers in mental health studies. BioEssays 2024, 46, e2300246. [Google Scholar] [CrossRef] [PubMed]
- Gururajan, A.; Clarke, G.; Dinan, T.G.; Cryan, J.F. Molecular biomarkers of depression. Neurosci. Biobehav. Rev. 2016, 64, 101–133. [Google Scholar] [CrossRef] [PubMed]
- Serretti, A. Clinical Utility of Fluid Biomarker in Depressive Disorder. Clin. Psychopharmacol. Neurosci. 2022, 20, 585–591. [Google Scholar] [CrossRef]
- Neupane, S.P.; Daray, F.M.; Ballard, E.D.; Galfalvy, H.; Itzhaky, L.; Segev, A.; Shelef, A.; Tene, O.; Rizk, M.M.; Mann, J.J.; et al. Immune-related biomarkers and suicidal behaviors: A meta-analysis. Eur. Neuropsychopharmacol. 2023, 75, 15–30. [Google Scholar] [CrossRef]
- Morena, D.; Turillazzi, E.; Fineschi, V. Peripheral Biomarkers and Suicide: The Role of Neurotransmission, Neurotrophism, Neuroinflammation, and Neuroplasticity Dysregulation. FBL 2024, 29, 346. [Google Scholar] [CrossRef]
- Ali, S.; Santomauro, D.; Ferrari, A.J.; Charlson, F. Excess mortality in severe mental disorders: A systematic review and meta-regression. J. Psychiatr. Res. 2022, 149, 97–105. [Google Scholar] [CrossRef] [PubMed]
- Cho, S.-E.; Na, K.-S.; Cho, S.-J.; Im, J.-S.; Kang, S.-G. Geographical and temporal variations in the prevalence of mental disorders in suicide: Systematic review and meta-analysis. J. Affect. Disord. 2016, 190, 704–713. [Google Scholar] [CrossRef]
- Lovero, K.L.; Dos Santos, P.F.; Come, A.X.; Wainberg, M.L.; Oquendo, M.A. Suicide in Global Mental Health. Curr. Psychiatry Rep. 2023, 25, 255–262. [Google Scholar] [CrossRef]
- Safadi, J.M.; Quinton, A.M.G.; Lennox, B.R.; Burnet, P.W.J.; Minichino, A. Gut dysbiosis in severe mental illness and chronic fatigue: A novel trans-diagnostic construct? A systematic review and meta-analysis. Mol. Psychiatry 2022, 27, 141–153. [Google Scholar] [CrossRef] [PubMed]
- Angst, J.; Sellaro, R.; Merikangas, K.R. Depressive spectrum diagnoses. Compr. Psychiatry 2000, 41 (Suppl. S1), 39–47. [Google Scholar] [CrossRef] [PubMed]
- Bowins, B. Depression: Discrete or continuous? Psychopathology 2015, 48, 69–78. [Google Scholar] [CrossRef]
- Misiak, M.; Kurpas, D. Checklists for reporting research in Advances in Clinical and Experimental Medicine: How to choose a proper one for your manuscript? Adv. Clin. Exp. Med. 2022, 31, 1065–1072. [Google Scholar] [CrossRef]
- Long, H.A.; French, D.P.; Brooks, J.M. Optimising the value of the critical appraisal skills programme (CASP) tool for quality appraisal in qualitative evidence synthesis. Res. Methods Med. Health Sci. 2020, 1, 31–42. [Google Scholar] [CrossRef]
- Wan, X.; Wang, W.; Liu, J.; Tong, T. Estimating the sample mean and standard deviation from the sample size, median, range and/or interquartile range. BMC Med. Res. Methodol. 2014, 14, 135. [Google Scholar] [CrossRef]
- Borenstein, M.; Hedges, L.V.; Higgins, J.P.T.; Rothstein, H.R. Introduction to Meta-Analysis; John Wiley & Sons: Hoboken, NJ, USA, 2021. [Google Scholar]
- Hedges, L.V.; Vevea, J.L. Fixed- and random-effects models in meta-analysis. Psychol. Methods 1998, 3, 486–504. [Google Scholar] [CrossRef]
- Brydges, C.R. Effect Size Guidelines, Sample Size Calculations, and Statistical Power in Gerontology. Innov. Aging 2019, 3, igz036. [Google Scholar] [CrossRef] [PubMed]
- Hedges, L.V. Distribution Theory for Glass’s Estimator of Effect Size and Related Estimators. J. Educ. Stat. 1981, 6, 107–128. [Google Scholar] [CrossRef]
- Crocetti, E. Systematic reviews with meta-analysis: Why, when, and how? Emerg. Adulthood 2016, 4, 3–18. [Google Scholar] [CrossRef]
- Egger, M.; Davey Smith, G.; Schneider, M.; Minder, C. Bias in meta-analysis detected by a simple, graphical test. BMJ 1997, 315, 629–634. [Google Scholar] [CrossRef]
- Duval, S. The Trim and Fill Method. In Publication Bias in Meta-Analysis; John Wiley & Sons, Ltd.: Hoboken, NJ, USA, 2005; pp. 127–144. [Google Scholar]
- Maes, M.; Kubera, M.; Leunis, J.-C. The gut-brain barrier in major depression: Intestinal mucosal dysfunction with an increased translocation of LPS from gram negative enterobacteria (leaky gut) plays a role in the inflammatory pathophysiology of depression. Neuro Endocrinol. Lett. 2008, 29, 117–124. [Google Scholar] [PubMed]
- Maes, M.; Simeonova, D.; Stoyanov, D.; Leunis, J.-C. Upregulation of the nitrosylome in bipolar disorder type 1 (BP1) and major depression, but not BP2: Increased IgM antibodies to nitrosylated conjugates are associated with indicants of leaky gut. Nitric Oxide 2019, 91, 67–76. [Google Scholar] [CrossRef]
- Alvarez-Mon, M.A.; Gómez, A.M.; Orozco, A.; Lahera, G.; Sosa, M.D.; Diaz, D.; Auba, E.; Albillos, A.; Monserrat, J.; Alvarez-Mon, M. Abnormal Distribution and Function of Circulating Monocytes and Enhanced Bacterial Translocation in Major Depressive Disorder. Front. Psychiatry 2019, 10, 812. [Google Scholar] [CrossRef] [PubMed]
- Alvarez-Mon, M.A.; Gomez-Lahoz, A.M.; Orozco, A.; Lahera, G.; Sosa-Reina, M.D.; Diaz, D.; Albillos, A.; Quintero, J.; Molero, P.; Monserrat, J.; et al. Blunted Expansion of Regulatory T Lymphocytes Is Associated with Increased Bacterial Translocation in Patients with Major Depressive Disorder. Front. Psychiatry 2021, 11, 591962. [Google Scholar] [CrossRef]
- Wu, H.; Wang, J.; Teng, T.; Yin, B.; He, Y.; Jiang, Y.; Liu, X.; Yu, Y.; Li, X.; Zhou, X. Biomarkers of intestinal permeability and blood-brain barrier permeability in adolescents with major depressive disorder. J. Affect. Disord. 2023, 323, 659–666. [Google Scholar] [CrossRef]
- Osuna, E.; Baumgartner, J.; Wunderlin, O.; Emery, S.; Albermann, M.; Baumgartner, N.; Schmeck, K.; Walitza, S.; Strumberger, M.; Hersberger, M.; et al. Iron status in Swiss adolescents with paediatric major depressive disorder and healthy controls: A matched case-control study. Eur. J. Nutr. 2024, 63, 951–963. [Google Scholar] [CrossRef]
- Chen, V.C.-H.; Wu, S.-I. An exploratory analysis on the association between suicidal ideation and the microbiome in patients with or without major depressive disorder. J. Affect. Disord. 2025, 370, 362–372. [Google Scholar] [CrossRef]
- Zhong, J.; Chen, J.; Cao, M.; Fang, L.; Wang, Z.; Liao, J.; Chen, D.; Zhang, X.; Guo, J.; Zhao, L.; et al. Elevated plasma intestinal fatty acid binding protein and aberrant lipid metabolism predict post-stroke depression. Heliyon 2022, 8, e11848. [Google Scholar] [CrossRef] [PubMed]
- Wang, L.; Chunyou, C.; Zhu, J.; Bao, X.; Tao, X. Prediction of post-stroke depression with combined blood biomarkers IL-6, TNF-a, and fatty acid binding protein: A prospective study. J. Med. Biochem. 2023, 42, 638–644. [Google Scholar] [CrossRef]
- Papakostas, G.I.; Shelton, R.C.; Kinrys, G.; Henry, M.E.; Bakow, B.R.; Lipkin, S.H.; Pi, B.; Thurmond, L.; Bilello, J.A. Assessment of a multi-assay, serum-based biological diagnostic test for major depressive disorder: A Pilot and Replication Study. Mol. Psychiatry 2013, 18, 332–339. [Google Scholar] [CrossRef] [PubMed]
- Brouillet, J.Z.; Boltri, M.; Lengvenyte, A.; Lajnef, M.; Richard, J.-R.; Barrau, C.; Strumila, R.; Coyac, M.; Wu, C.-L.; Boukouaci, W.; et al. Association of markers of inflammation and intestinal permeability in suicidal patients with major mood disorders. J. Affect. Disord. Rep. 2023, 14, 100624. [Google Scholar] [CrossRef]
- Stewart, J.C.; Polanka, B.M.; So-Armah, K.A.; White, J.R.; Gupta, S.K.; Kundu, S.; Chang, C.C.H.; Freiberg, M.S. Associations of Total, Cognitive/Affective, and Somatic Depressive Symptoms and Antidepressant Use with Cardiovascular Disease-Relevant Biomarkers in HIV: Veterans Aging Cohort Study. Psychosom. Med. 2020, 82, 461–470. [Google Scholar] [CrossRef]
- Just, D.; Rasmusson, A.J.; Nilsson, P.; Noreland, M.; Malmström, E.; Brodin, P.; Månberg, A.; Cunningham, J.L. Autoantibodies against the C-terminus of Lipopolysaccharide binding protein are elevated in young adults with psychiatric disease. Psychoneuroendocrinology 2021, 126, 105162. [Google Scholar] [CrossRef]
- Musil, R.; Schwarz, M.J.; Riedel, M.; Dehning, S.; Cerovecki, A.; Spellmann, I.; Arolt, V.; Müller, N. Elevated macrophage migration inhibitory factor and decreased transforming growth factor-beta levels in major depression—No influence of celecoxib treatment. J. Affect. Disord. 2011, 134, 217–225. [Google Scholar] [CrossRef]
- Zengil, S.; Laloğlu, E. Evaluation of Serum Zonulin and Occludin Levels in Bipolar Disorder. Psychiatry Investig. 2023, 20, 382–389. [Google Scholar] [CrossRef]
- Lee, S.; Tejesvi, M.V.; Hurskainen, E.; Aasmets, O.; Plaza-Díaz, J.; Franks, S.; Morin-Papunen, L.; Tapanainen, J.S.; Ruuska, T.S.; Altmäe, S.; et al. Gut bacteriome and mood disorders in women with PCOS. Hum. Reprod. 2024, 39, 1291–1302. [Google Scholar] [CrossRef]
- Maes, M.; Kubera, M.; Leunis, J.-C.; Berk, M.; Geffard, M.; Bosmans, E. In depression, bacterial translocation may drive inflammatory responses, oxidative and nitrosative stress (O&NS), and autoimmune responses directed against O&NS-damaged neoepitopes. Acta Psychiatr. Scand. 2013, 127, 344–354. [Google Scholar] [PubMed]
- Zhou, Z.; Guille, C.; Ogunrinde, E.; Liu, R.; Luo, Z.; Powell, A.; Jiang, W. Increased systemic microbial translocation is associated with depression during early pregnancy. J. Psychiatr. Res. 2018, 97, 54–57. [Google Scholar] [CrossRef] [PubMed]
- Bai, S.; Fang, L.; Xie, J.; Bai, H.; Wang, W.; Chen, J.-J. Potential biomarkers for diagnosing major depressive disorder patients with suicidal ideation. J. Inflamm. Res. 2021, 14, 495–503. [Google Scholar] [CrossRef] [PubMed]
- Bai, S.; Bai, H.; Li, D.; Zhong, Q.; Xie, J.; Chen, J.-J. Gut Microbiota-Related Inflammation Factors as a Potential Biomarker for Diagnosing Major Depressive Disorder. Front. Cell. Infect. Microbiol. 2022, 12, 831186. [Google Scholar] [CrossRef]
- Karaoulanis, S.E.; Rizouli, K.A.; Rizoulis, A.A.; Angelopoulos, N.V. Lack of association of acute phase response proteins with hormone levels and antidepressant medication in perimenopausal depression. BMC Psychiatry 2014, 14, 164. [Google Scholar] [CrossRef]
- Maget, A.; Dalkner, N.; Hamm, C.; Bengesser, S.A.; Fellendorf, F.T.; Platzer, M.; Queissner, R.; Birner, A.; Lenger, M.; Mörkl, S.; et al. Sex differences in zonulin in affective disorders and associations with current mood symptoms. J. Affect. Disord. 2021, 294, 441–446. [Google Scholar] [CrossRef]
- Dickerson, F.; Adamos, M.; Katsafanas, E.; Khushalani, S.; Origoni, A.; Savage, C.; Schweinfurth, L.; Stallings, C.; Sweeney, K.; Alaedini, A.; et al. The association between immune markers and recent suicide attempts in patients with serious mental illness: A pilot study. Psychiatry Res. 2017, 255, 8–12. [Google Scholar] [CrossRef]
- Stevens, B.R.; Goel, R.; Seungbum, K.; Richards, E.M.; Holbert, R.C.; Pepine, C.J.; Raizada, M.K. Increased human intestinal barrier permeability plasma biomarkers zonulin and FABP2 correlated with plasma LPS and altered gut microbiome in anxiety or depression. Gut 2018, 67, 1555–1557. [Google Scholar] [CrossRef]
- Iordache, M.M.; Tocia, C.; Aschie, M.; Dumitru, A.; Manea, M.; Cozaru, G.C.; Petcu, L.; Vlad, S.E.; Dumitru, E.; Chisoi, A. Intestinal Permeability and Depression in Patients with Inflammatory Bowel Disease. J. Clin. Med. 2022, 11, 5121. [Google Scholar] [CrossRef]
- Liśkiewicz, P.; Kaczmarczyk, M.; Misiak, B.; Wroński, M.; Bąba-Kubiś, A.; Skonieczna-Żydecka, K.; Marlicz, W.; Bieńkowski, P.; Misera, A.; Pełka-Wysiecka, J.; et al. Analysis of gut microbiota and intestinal integrity markers of inpatients with major depressive disorder. Prog. Neuro-Psychopharmacol. Biol. Psychiatry 2021, 106, 110076. [Google Scholar] [CrossRef]
- Rajkovaca Latic, I.; Popovic, Z.; Mijatovic, K.; Sahinovic, I.; Pekic, V.; Vucic, D.; Cosic, V.; Miskic, B.; Tomic, S. Association of intestinal inflammation and permeability markers with clinical manifestations of Parkinson’s disease. Park. Relat. Disord. 2024, 123, 106948. [Google Scholar] [CrossRef]
- Hussain, M.A.; Watson, C.W.-M.; Morgan, E.E.; Heaton, R.K.; Letendre, S.L.; Jeste, D.V.; Moore, D.J.; Iudicello, J.E. Combined effects of loneliness and inflammation on depression in people with HIV. J. Neurovirology 2023, 29, 538–554. [Google Scholar] [CrossRef] [PubMed]
- Oktayoglu, P.; Mete, N.; Caglayan, M.; Bozkurt, M.; Bozan, T.; Em, S.; Nas, K. Elevated serum levels of calprotectin (MRP8/MRP14) in patients with Behçet’s disease and its association with disease activity and quality of life. Scand. J. Clin. Lab. Investig. 2015, 75, 106–112. [Google Scholar] [CrossRef]
- Madison, A.A.; Andridge, R.; Padin, A.C.; Wilson, S.; Bailey, M.T.; Alfano, C.M.; Povoski, S.P.; Lipari, A.M.; Agnese, D.M.; Carson, W.E.; et al. Endotoxemia coupled with heightened inflammation predicts future depressive symptoms. Psychoneuroendocrinology 2020, 122, 104864. [Google Scholar] [CrossRef]
- Bellei, E.; Bergamini, S.; Monari, E.; Tomasi, A.; Koseoglu, M.; Topaloglu Tuac, S.; Ozben, S. Evaluation of potential cardiovascular risk protein biomarkers in high severity restless legs syndrome. J. Neural Transm. 2019, 126, 1313–1320. [Google Scholar] [CrossRef] [PubMed]
- Hirten, R.P.; Danieletto, M.; Scheel, R.; Shervey, M.; Ji, J.; Hu, L.; Sauk, J.; Chang, L.; Arnrich, B.; Böttinger, E.; et al. Longitudinal Autonomic Nervous System Measures Correlate with Stress and Ulcerative Colitis Disease Activity and Predict Flare. Inflamm. Bowel Dis. 2021, 27, 1576–1584. [Google Scholar] [CrossRef] [PubMed]
- Kiecolt-Glaser, J.K.; Wilson, S.J.; Bailey, M.L.; Andridge, R.; Peng, J.; Jaremka, L.M.; Fagundes, C.P.; Malarkey, W.B.; Laskowski, B.; Belury, M.A. Marital distress, depression, and a leaky gut: Translocation of bacterial endotoxin as a pathway to inflammation. Psychoneuroendocrinology 2018, 98, 52–60. [Google Scholar] [CrossRef]
- Cai, Y.; Gong, D.; Xiang, T.; Zhang, X.; Pan, J. Markers of intestinal barrier damage in patients with chronic insomnia disorder. Front. Psychiatry 2024, 15, 1373462. [Google Scholar] [CrossRef]
- Lundgren, D.; Rutegård, J.; Eklöf, V.; Palmqvist, R.; Karling, P. Patients with longstanding ulcerative colitis in remission do not have more irritable bowel syndrome-like symptoms than controls. BMC Gastroenterol. 2016, 16, 139. [Google Scholar] [CrossRef]
- Yee, J.Y.; Nurjono, M.; Ng, W.Y.; Teo, S.R.; Lee, T.-S.; Lee, J. Peripheral blood gene expression of acute phase proteins in people with first episode psychosis. Brain Behav. Immun. 2017, 65, 337–341. [Google Scholar] [CrossRef]
- Brys, A.D.H.; Di Stasio, E.; Lenaert, B.; Sanguinetti, M.; Picca, A.; Calvani, R.; Marzetti, E.; Gambaro, G.; Bossola, M. Serum interleukin-6 and endotoxin levels and their relationship with fatigue and depressive symptoms in patients on chronic haemodialysis. Cytokine 2020, 125, 154823. [Google Scholar] [CrossRef] [PubMed]
- Işık, Ü.; Aydoğan Avşar, P.; Aktepe, E.; Doğuç, D.K.; Kılıç, F.; Büyükbayram, H.İ. Serum zonulin and claudin-5 levels in children with obsessive-compulsive disorder. Nord. J. Psychiatry 2020, 74, 346–351. [Google Scholar] [CrossRef] [PubMed]
- Kılıç, F.; Işık, Ü.; Demirdaş, A.; Doğuç, D.K.; Bozkurt, M. Serum zonulin and claudin-5 levels in patients with bipolar disorder. J. Affect. Disord. 2020, 266, 37–42. [Google Scholar] [CrossRef]
- Meinitzer, S.; Baranyi, A.; Holasek, S.; Schnedl, W.J.; Zelzer, S.; Mangge, H.; Herrmann, M.; Meinitzer, A.; Enko, D. Sex-Specific Associations of Trimethylamine-N-Oxide and Zonulin with Signs of Depression in Carbohydrate Malabsorbers and Nonmalabsorbers. Dis. Markers 2020, 2020, 7897240. [Google Scholar] [CrossRef]
- Varanoske, A.N.; McClung, H.L.; Sepowitz, J.J.; Halagarda, C.J.; Farina, E.K.; Berryman, C.E.; Lieberman, H.R.; McClung, J.P.; Pasiakos, S.M.; Philip Karl, J. Stress and the gut-brain axis: Cognitive performance, mood state, and biomarkers of blood-brain barrier and intestinal permeability following severe physical and psychological stress. Brain Behav. Immun. 2022, 101, 383–393. [Google Scholar] [CrossRef]
- Louzada, E.R.; Ribeiro, S.M.L. Synbiotic supplementation, systemic inflammation, and symptoms of brain disorders in elders: A secondary study from a randomized clinical trial. Nutr. Neurosci. 2020, 23, 93–100. [Google Scholar] [CrossRef] [PubMed]
- Maes, M. The cytokine hypothesis of depression: Inflammation, oxidative & nitrosative stress (IO&NS) and leaky gut as new targets for adjunctive treatments in depression. Neuro Endocrinol. Lett. 2008, 29, 287–291. [Google Scholar]
- Iordache, M.M.; Belu, A.M.; Vlad, S.E.; Aivaz, K.A.; Dumitru, A.; Tocia, C.; Dumitru, E. Calprotectin, Biomarker of Depression in Patients with Inflammatory Bowel Disease? Medicina 2023, 59, 1240. [Google Scholar] [CrossRef]
- Carabotti, M.; Scirocco, A.; Maselli, M.A.; Severi, C. The gut-brain axis: Interactions between enteric microbiota, central and enteric nervous systems. Ann. Gastroenterol. 2015, 28, 203–209. [Google Scholar]
- Huang, T.-T.; Lai, J.-B.; Du, Y.-L.; Xu, Y.; Ruan, L.-M.; Hu, S.-H. Current Understanding of Gut Microbiota in Mood Disorders: An Update of Human Studies. Front. Genet. 2019, 10, 98. [Google Scholar] [CrossRef]
- Craig, C.F.; Filippone, R.T.; Stavely, R.; Bornstein, J.C.; Apostolopoulos, V.; Nurgali, K. Neuroinflammation as an etiological trigger for depression comorbid with inflammatory bowel disease. J. Neuroinflamm. 2022, 19, 4. [Google Scholar] [CrossRef]
- Kiecolt-Glaser, J.K.; Wilson, S.J.; Shrout, M.R.; Madison, A.A.; Andridge, R.; Peng, J.; Malarkey, W.B.; Bailey, M.T. The gut reaction to couples’ relationship troubles: A route to gut dysbiosis through changes in depressive symptoms. Psychoneuroendocrinology 2021, 125, 105132. [Google Scholar] [CrossRef]
- Ludvigsson, J.F.; Olén, O.; Larsson, H.; Halfvarson, J.; Almqvist, C.; Lichtenstein, P.; Butwicka, A. Association Between Inflammatory Bowel Disease and Psychiatric Morbidity and Suicide: A Swedish Nationwide Population-Based Cohort Study with Sibling Comparisons. J. Crohn’s Colitis 2021, 15, 1824–1836. [Google Scholar] [CrossRef]
- Rojo, Ó.P.; Román, A.L.S.; Arbizu, E.A.; de la Hera Martínez, A.; Sevillano, E.R.; Martínez, A.A. Serum lipopolysaccharide-binding protein in endotoxemic patients with inflammatory bowel disease. Inflamm. Bowel Dis. 2007, 13, 269–277. [Google Scholar] [CrossRef]
- Park, B.S.; Lee, J.-O. Recognition of lipopolysaccharide pattern by TLR4 complexes. Exp. Mol. Med. 2013, 45, e66. [Google Scholar] [CrossRef]
- Kim, S.J.; Kim, H.M. Dynamic lipopolysaccharide transfer cascade to TLR4/MD2 complex via LBP and CD14. BMB Rep. 2017, 50, 55–57. [Google Scholar] [CrossRef]
- Brown, G.C. The endotoxin hypothesis of neurodegeneration. J. Neuroinflamm. 2019, 16, 180. [Google Scholar] [CrossRef]
- Qin, L.; Wu, X.; Block, M.L.; Liu, Y.; Breese, G.R.; Hong, J.-S.; Knapp, D.J.; Crews, F.T. Systemic LPS causes chronic neuroinflammation and progressive neurodegeneration. Glia 2007, 55, 453–462. [Google Scholar] [CrossRef]
- Qin, L.; Liu, Y.; Hong, J.-S.; Crews, F.T. NADPH oxidase and aging drive microglial activation, oxidative stress, and dopaminergic neurodegeneration following systemic LPS administration. Glia 2013, 61, 855–868. [Google Scholar] [CrossRef]
- O’Connor, J.C.; Lawson, M.A.; André, C.; Moreau, M.; Lestage, J.; Castanon, N.; Kelley, K.W.; Dantzer, R. Lipopolysaccharide-induced depressive-like behavior is mediated by indoleamine 2,3-dioxygenase activation in mice. Mol. Psychiatry 2009, 14, 511–522. [Google Scholar] [CrossRef]
- Yin, R.; Zhang, K.; Li, Y.; Tang, Z.; Zheng, R.; Ma, Y.; Chen, Z.; Lei, N.; Xiong, L.; Guo, P.; et al. Lipopolysaccharide-induced depression-like model in mice: Meta-analysis and systematic evaluation. Front. Immunol. 2023, 14, 1181973. [Google Scholar] [CrossRef]
- van Eeden, W.A.; van Hemert, A.M.; Carlier, I.V.E.; Penninx, B.W.J.H.; Lamers, F.; Fried, E.I.; Schoevers, R.; Giltay, E.J. Basal and LPS-stimulated inflammatory markers and the course of individual symptoms of depression. Transl. Psychiatry 2020, 10, 235. [Google Scholar] [CrossRef]
- Sandiego, C.M.; Gallezot, J.-D.; Pittman, B.; Nabulsi, N.; Lim, K.; Lin, S.-F.; Matuskey, D.; Lee, J.-Y.; O’Connor, K.C.; Huang, Y.; et al. Imaging robust microglial activation after lipopolysaccharide administration in humans with PET. Proc. Natl. Acad. Sci. USA 2015, 112, 12468–12473. [Google Scholar] [CrossRef]
- DellaGioia, N.; Hannestad, J. A critical review of human endotoxin administration as an experimental paradigm of depression. Neurosci. Biobehav. Rev. 2010, 34, 130–143. [Google Scholar] [CrossRef]
- Rudzki, L.; Maes, M. From “Leaky Gut” to Impaired Glia-Neuron Communication in Depression. In Advances in Experimental Medicine and Biology; Springer: Berlin/Heidelberg, Germany, 2021; Volume 1305, pp. 129–155. [Google Scholar]
- Chae, Y.-R.; Lee, Y.R.; Kim, Y.-S.; Park, H.-Y. Diet-Induced Gut Dysbiosis and Leaky Gut Syndrome. J. Microbiol. Biotechnol. 2024, 34, 747–756. [Google Scholar] [CrossRef]
- Cross, R.K.; Keefer, L. Chicken or Egg, Mental Health Disorders in Inflammatory Bowel Disease: Does It Matter? Gastroenterology 2022, 163, 37–39. [Google Scholar] [CrossRef]
- Gracie, D.J.; Guthrie, E.A.; Hamlin, P.J.; Ford, A.C. Bi-directionality of Brain-Gut Interactions in Patients with Inflammatory Bowel Disease. Gastroenterology 2018, 154, 1635–1646.e3. [Google Scholar] [CrossRef]
- Fairbrass, K.M.; Lovatt, J.; Barberio, B.; Yuan, Y.; Gracie, D.J.; Ford, A.C. Bidirectional brain–gut axis effects influence mood and prognosis in IBD: A systematic review and meta-analysis. Gut 2022, 71, 1773–1780. [Google Scholar] [CrossRef]
- Rog, J.; Karakuła, M.; Rząd, Z.; Fitowska, A.; Brzezińska, A.; Karakula-Juchnowicz, H. The Importance of Adverse Childhood Experiences in Depressive Symptoms and Their Biological Consequences in Healthy Adults: Results of a Polish University Student Study. J. Clin. Med. 2023, 12, 7093. [Google Scholar] [CrossRef]
- Higgins, J.; Green, S. Cochrane Handbook for Systematic Reviews of Interventions; Wiley: Hoboken, NJ, USA, 2009. [Google Scholar]
- Wiercinska-Drapalo, A.; Jaroszewicz, J.; Siwak, E.; Pogorzelska, J.; Prokopowicz, D. Intestinal fatty acid binding protein (I-FABP) as a possible biomarker of ileitis in patients with ulcerative colitis. Regul. Pept. 2008, 147, 25–28. [Google Scholar] [CrossRef]
- Ehlers, M.R. Immune-modulating effects of alpha-1 antitrypsin. Biol. Chem. 2014, 395, 1187–1193. [Google Scholar] [CrossRef]
- Zerekidze, A.; Li, M.; Refisch, A.; Shameya, J.; Sobanski, T.; Walter, M.; Wagner, G. Impact of Toxoplasma gondii and Human Microbiome on Suicidal Behavior: A Systematic Review. J. Clin. Med. 2024, 13, 593. [Google Scholar] [CrossRef]
- Black, C.; Miller, B.J. Meta-Analysis of Cytokines and Chemokines in Suicidality: Distinguishing Suicidal Versus Nonsuicidal Patients. Biol. Psychiatry 2015, 78, 28–37. [Google Scholar] [CrossRef] [PubMed]
- Daray, F.M.; Chiapella, L.C.; Grendas, L.N.; Casiani, R.I.Á.; Olaviaga, A.; Robetto, J.; Prokopez, C.R.; Carrera Silva, E.A.; Errasti, A.E.; Neupane, S.P. Peripheral blood cellular immunophenotype in suicidal ideation, suicide attempt, and suicide: A systematic review and meta-analysis. Mol. Psychiatry 2024, 29, 3874–3892. [Google Scholar] [CrossRef] [PubMed]
- Palmiere, C.; Augsburger, M. Markers for sepsis diagnosis in the forensic setting: State of the art. Croat. Med. J. 2014, 55, 103–114. [Google Scholar] [CrossRef]
- Garland, J.; Ondruschka, B.; Da Broi, U.; Palmiere, C.; Tse, R. Post mortem tryptase: A review of literature on its use, sampling and interpretation in the investigation of fatal anaphylaxis. Forensic Sci. Int. 2020, 314, 110415. [Google Scholar] [CrossRef] [PubMed]
- Ondruschka, B.; Sieber, M.; Kirsten, H.; Franke, H.; Dreßler, J. Measurement of Cerebral Biomarkers Proving Traumatic Brain Injuries in Post-Mortem Body Fluids. J. Neurotrauma 2018, 35, 2044–2055. [Google Scholar] [CrossRef]
- Bay-Richter, C.; Linderholm, K.R.; Lim, C.K.; Samuelsson, M.; Träskman-Bendz, L.; Guillemin, G.J.; Erhardt, S.; Brundin, L. A role for inflammatory metabolites as modulators of the glutamate N-methyl-D-aspartate receptor in depression and suicidality. Brain Behav. Immun. 2015, 43, 110–117. [Google Scholar] [CrossRef]
- Liu, X.; Li, S.; Yu, Y.; Hu, J.; Xu, Y. Changes in Plasma TPH2, GDNF, Trk-b, BDNF, and proBDNF in People Who Died by Suicide. Brain Sci. 2023, 13, 1096. [Google Scholar] [CrossRef]
- Smalheiser, N.R.; Lugli, G.; Rizavi, H.S.; Torvik, V.I.; Turecki, G.; Dwivedi, Y. MicroRNA expression is down-regulated and reorganized in prefrontal cortex of depressed suicide subjects. PLoS ONE 2012, 7, e33201. [Google Scholar] [CrossRef]
- Videtič Paska, A.; Alič, U.; Zupanc, T.; Kouter, K. Suicide and Changes in Expression of Neuronal miRNA Predicted by an Algorithm Search through miRNA Databases. Genes 2022, 13, 562. [Google Scholar] [CrossRef] [PubMed]
- Milic, J.; Jovic, S.; Sapic, R. Advancing Depression Management Through Biomarker Discovery with a Focus on Genetic and Epigenetic Aspects: A Comprehensive Study on Neurobiological, Neuroendocrine, Metabolic, and Inflammatory Pathways. Genes 2025, 16, 487. [Google Scholar] [CrossRef]
- Wang, C.; Wang, T.; Chen, Y.; Lie, W.; Shen, F. Ebastine in combination with low-dose antidepressants for refractory irritable bowel syndrome: A randomized controlled trial. Technol. Health Care 2025. [Google Scholar] [CrossRef] [PubMed]
- Gawlik-Kotelnicka, O.; Czarnecka-Chrebelska, K.; Margulska, A.; Pikus, E.; Wasiak, J.; Skowrońska, A.; Brzeziańska-Lasota, E.; Strzelecki, D. Associations between intestinal fatty-acid binding protein and clinical and metabolic characteristics of depression. Prog. Neuro-Psychopharmacol. Biol. Psychiatry 2025, 136, 111170. [Google Scholar] [CrossRef] [PubMed]
- Milić, J. How to design a reliable and practical biomarker: The electrophysiologic coefficient of depressiveness—δEPCD. Biomarkers 2022, 27, 711–714. [Google Scholar] [CrossRef]
- Garcia-Hernandez, V.; Quiros, M.; Nusrat, A. Intestinal epithelial claudins: Expression and regulation in homeostasis and inflammation. Ann. N. Y Acad. Sci. 2017, 1397, 66–79. [Google Scholar] [CrossRef]
- Maridaki, Z.; Syrros, G.; Gianna Delichatsiou, S.; Warsh, J.; Konstantinou, G.N. Claudin-5 and occludin levels in patients with psychiatric disorders—A systematic review. Brain Behav. Immun. 2025, 123, 865–875. [Google Scholar] [CrossRef]


| Category | Biomarker | Biological Samples * | Description | Variation in Leaky Gut |
|---|---|---|---|---|
| Structural Proteins | Zonulin | Plasma, serum, feces | A regulatory protein that modulates tight junctions, controlling intestinal permeability. | Increased: Signals dysregulation of tight junctions and barrier compromise. |
| Structural Proteins | Intestinal fatty-acid binding protein (I-FABP) | Plasma, serum | A cytoplasmic protein released by damaged enterocytes. | Increased: Indicates enterocyte damage due to intestinal barrier disruption. |
| Immune Proteins | Calprotectin | Plasma, serum, feces | Produced by neutrophils during inflammation. Its increased levels in feces indicate the recruitment of neutrophils to the intestine. | Increased: Indicates inflammation and neutrophil activity due to a compromised barrier. |
| Immune Proteins | Alpha-1 antitrypsin (A-1-AT) | Plasma, serum | A protease inhibitor that protects tissues and maintains intestinal barrier integrity. | Increased: Indicates protein loss and barrier inflammation in the gut. |
| Immune Proteins | LPS-binding protein (LBP) | Plasma, serum | Primarily produced by the liver. Acute-phase protein that binds LPS, facilitating immune recognition via CD14 and TLR4. | Increased: Signals systemic immune activation due to bacterial translocation. |
| Immune Proteins | Soluble CD14 (sCD14) | Plasma, serum | A soluble form of the CD14 protein found in plasma and biological fluids. It regulates the immune response by modulating inflammation triggered by lipopolysaccharides (LPS). | Increased: Indicates systemic immune activation due to endotoxin circulation. |
| Immune Proteins | Antibodies to endotoxins | Plasma, serum, feces | Immunoglobulins (e.g., IgA and IgM) generated in response to translocated LPS. | Increased: Indicates systemic exposure to bacterial endotoxins due to increased intestinal permeability. |
| Bacterial Endotoxins | Lipopolysaccharide (LPS) | Plasma | Endotoxin derived from cell envelope of Gram-negative bacteria. | Increased: Indicates bacterial translocation and systemic immune activation. |
Disclaimer/Publisher’s Note: The statements, opinions and data contained in all publications are solely those of the individual author(s) and contributor(s) and not of MDPI and/or the editor(s). MDPI and/or the editor(s) disclaim responsibility for any injury to people or property resulting from any ideas, methods, instructions or products referred to in the content. |
© 2025 by the authors. Licensee MDPI, Basel, Switzerland. This article is an open access article distributed under the terms and conditions of the Creative Commons Attribution (CC BY) license (https://creativecommons.org/licenses/by/4.0/).
Share and Cite
Morena, D.; Lippi, M.; Scopetti, M.; Turillazzi, E.; Fineschi, V. Leaky Gut Biomarkers as Predictors of Depression and Suicidal Risk: A Systematic Review and Meta-Analysis. Diagnostics 2025, 15, 1683. https://doi.org/10.3390/diagnostics15131683
Morena D, Lippi M, Scopetti M, Turillazzi E, Fineschi V. Leaky Gut Biomarkers as Predictors of Depression and Suicidal Risk: A Systematic Review and Meta-Analysis. Diagnostics. 2025; 15(13):1683. https://doi.org/10.3390/diagnostics15131683
Chicago/Turabian StyleMorena, Donato, Matteo Lippi, Matteo Scopetti, Emanuela Turillazzi, and Vittorio Fineschi. 2025. "Leaky Gut Biomarkers as Predictors of Depression and Suicidal Risk: A Systematic Review and Meta-Analysis" Diagnostics 15, no. 13: 1683. https://doi.org/10.3390/diagnostics15131683
APA StyleMorena, D., Lippi, M., Scopetti, M., Turillazzi, E., & Fineschi, V. (2025). Leaky Gut Biomarkers as Predictors of Depression and Suicidal Risk: A Systematic Review and Meta-Analysis. Diagnostics, 15(13), 1683. https://doi.org/10.3390/diagnostics15131683