
A Hybrid Ensemble Learning Framework for Predicting Lumbar Disc Herniation Recurrence: Integrating Supervised Models, Anomaly Detection, and Threshold Optimization

 , , , , , and
Abstract

1. Introduction
1.1. Related Work
- Handling class imbalance;
- Identifying interpretable and clinically meaningful predictors;
- Validating on institution-specific, curated datasets.
- Supervised learning (random forest, deep learning),
- Unsupervised anomaly detection (autoencoder),
- Threshold tuning to boost sensitivity for rare positive cases.
- Focuses on recurrence detection rather than broad complication prediction;
- Uses real-world data from a single neurosurgical center;
- Benchmarks both traditional classifiers and deep networks;
- Analyzes both synthetic and true recurrence cases in a hybrid interpretability framework.
1.2. Aim of the Study
- Benchmark conventional classifiers, anomaly detection, and deep learning approaches;
- Construct a stacked ensemble model to enhance sensitivity in rare-event prediction;
- Perform threshold tuning to optimize recall performance;
- Analyze key predictive features using interpretability techniques.
1.3. Structure of the Paper
- Section 2 (Materials and Methods) details the dataset characteristics, variable selection criteria, preprocessing steps, and initial statistical analyses.
- Section 3 (Results) presents the proposed machine learning pipeline, including baseline classifier benchmarks, anomaly detection, ensemble modeling strategies, threshold tuning, and performance evaluation on both real and synthetic patient profiles.
- Section 4 (Discussion) interprets the modeling results, evaluates clinical implications, compares findings with existing literature, and explores the relevance of key predictive features.
- Section 5 (Conclusions) outlines the principal limitations of the study—such as data representativeness, class imbalance, and generalizability—and proposes directions for future research and clinical application.
2. Materials and Methods
2.1. Study Population and Dataset
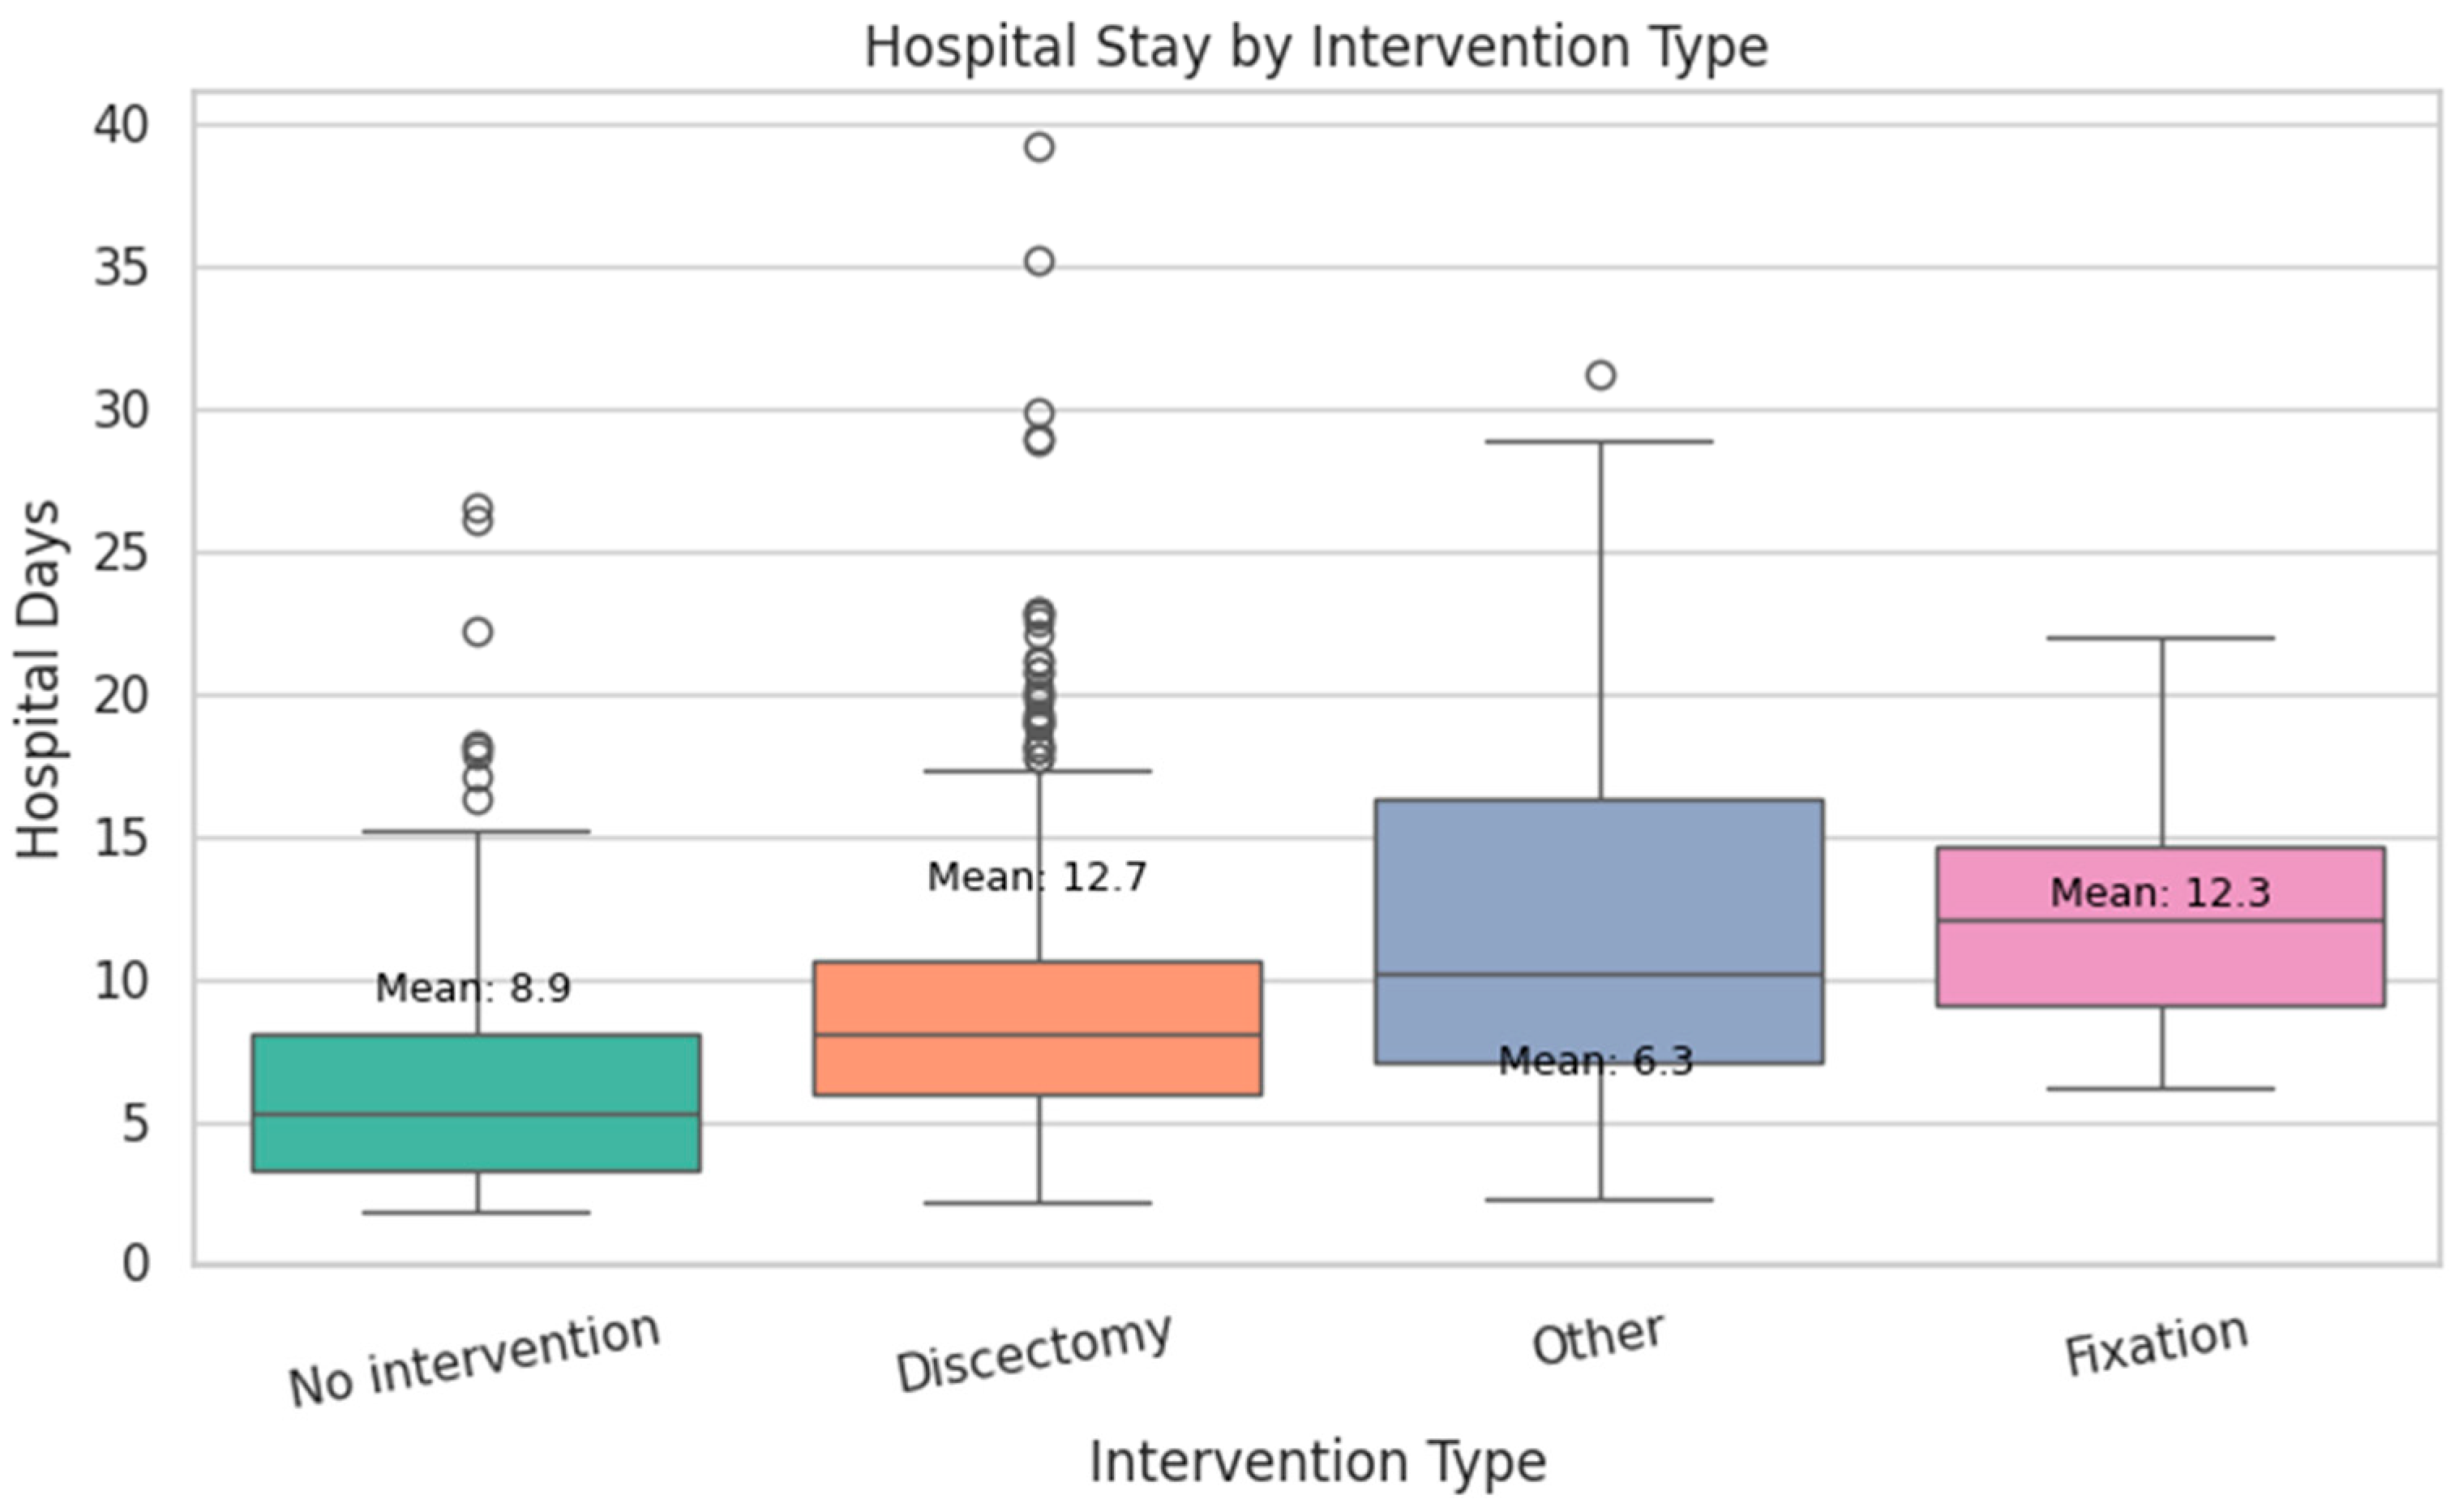
- Discectomy had the longest mean stay at 12.7 days.
- Fixation followed closely with a mean of 12.3 days.
- No intervention resulted in a shorter average stay of 8.9 days.
- Other procedures (e.g., decompression) had the shortest mean stay at 6.3 days.
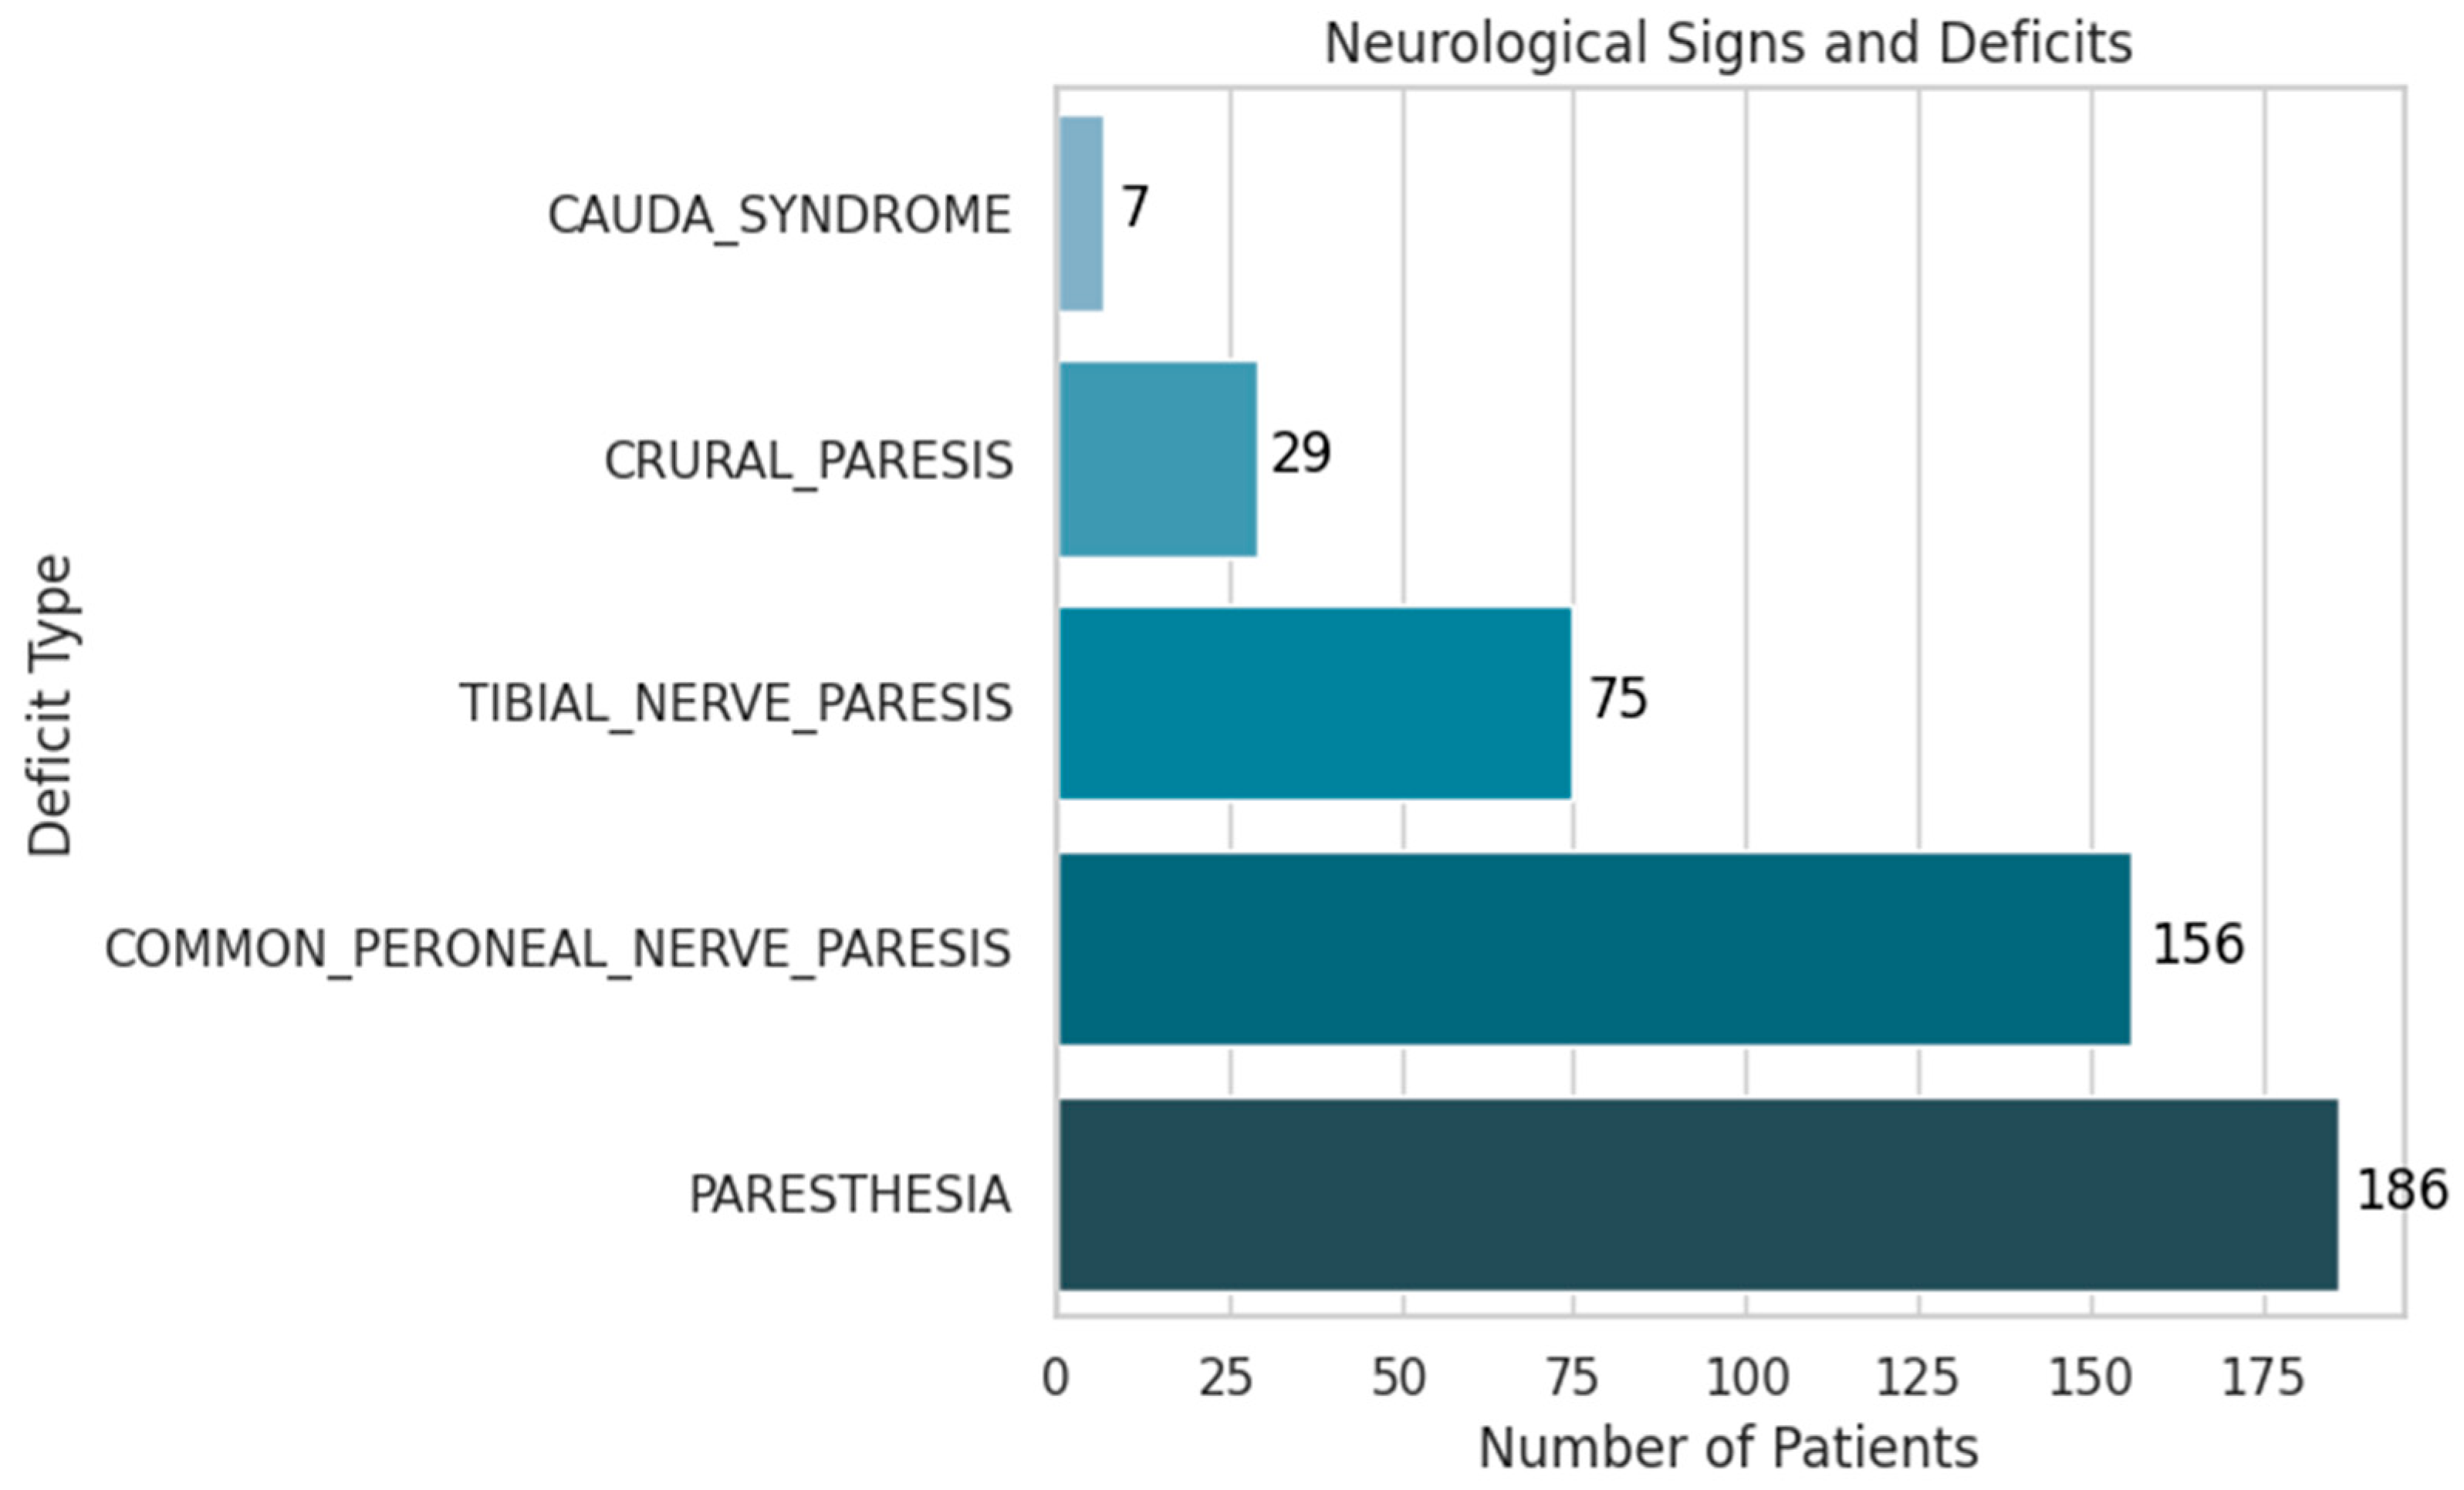
- Paresthesia was the most frequent finding, present in 19% of patients (186 cases).
- Common peroneal nerve paresis was observed in 16% (156 cases).
- Tibial nerve paresis occurred in 7.7% (75 cases).
- Crural paresis was found in 3% (29 cases).
- Cauda equina syndrome, although rare at 0.7% (7 cases), holds significant clinical importance due to its potential for severe disability.
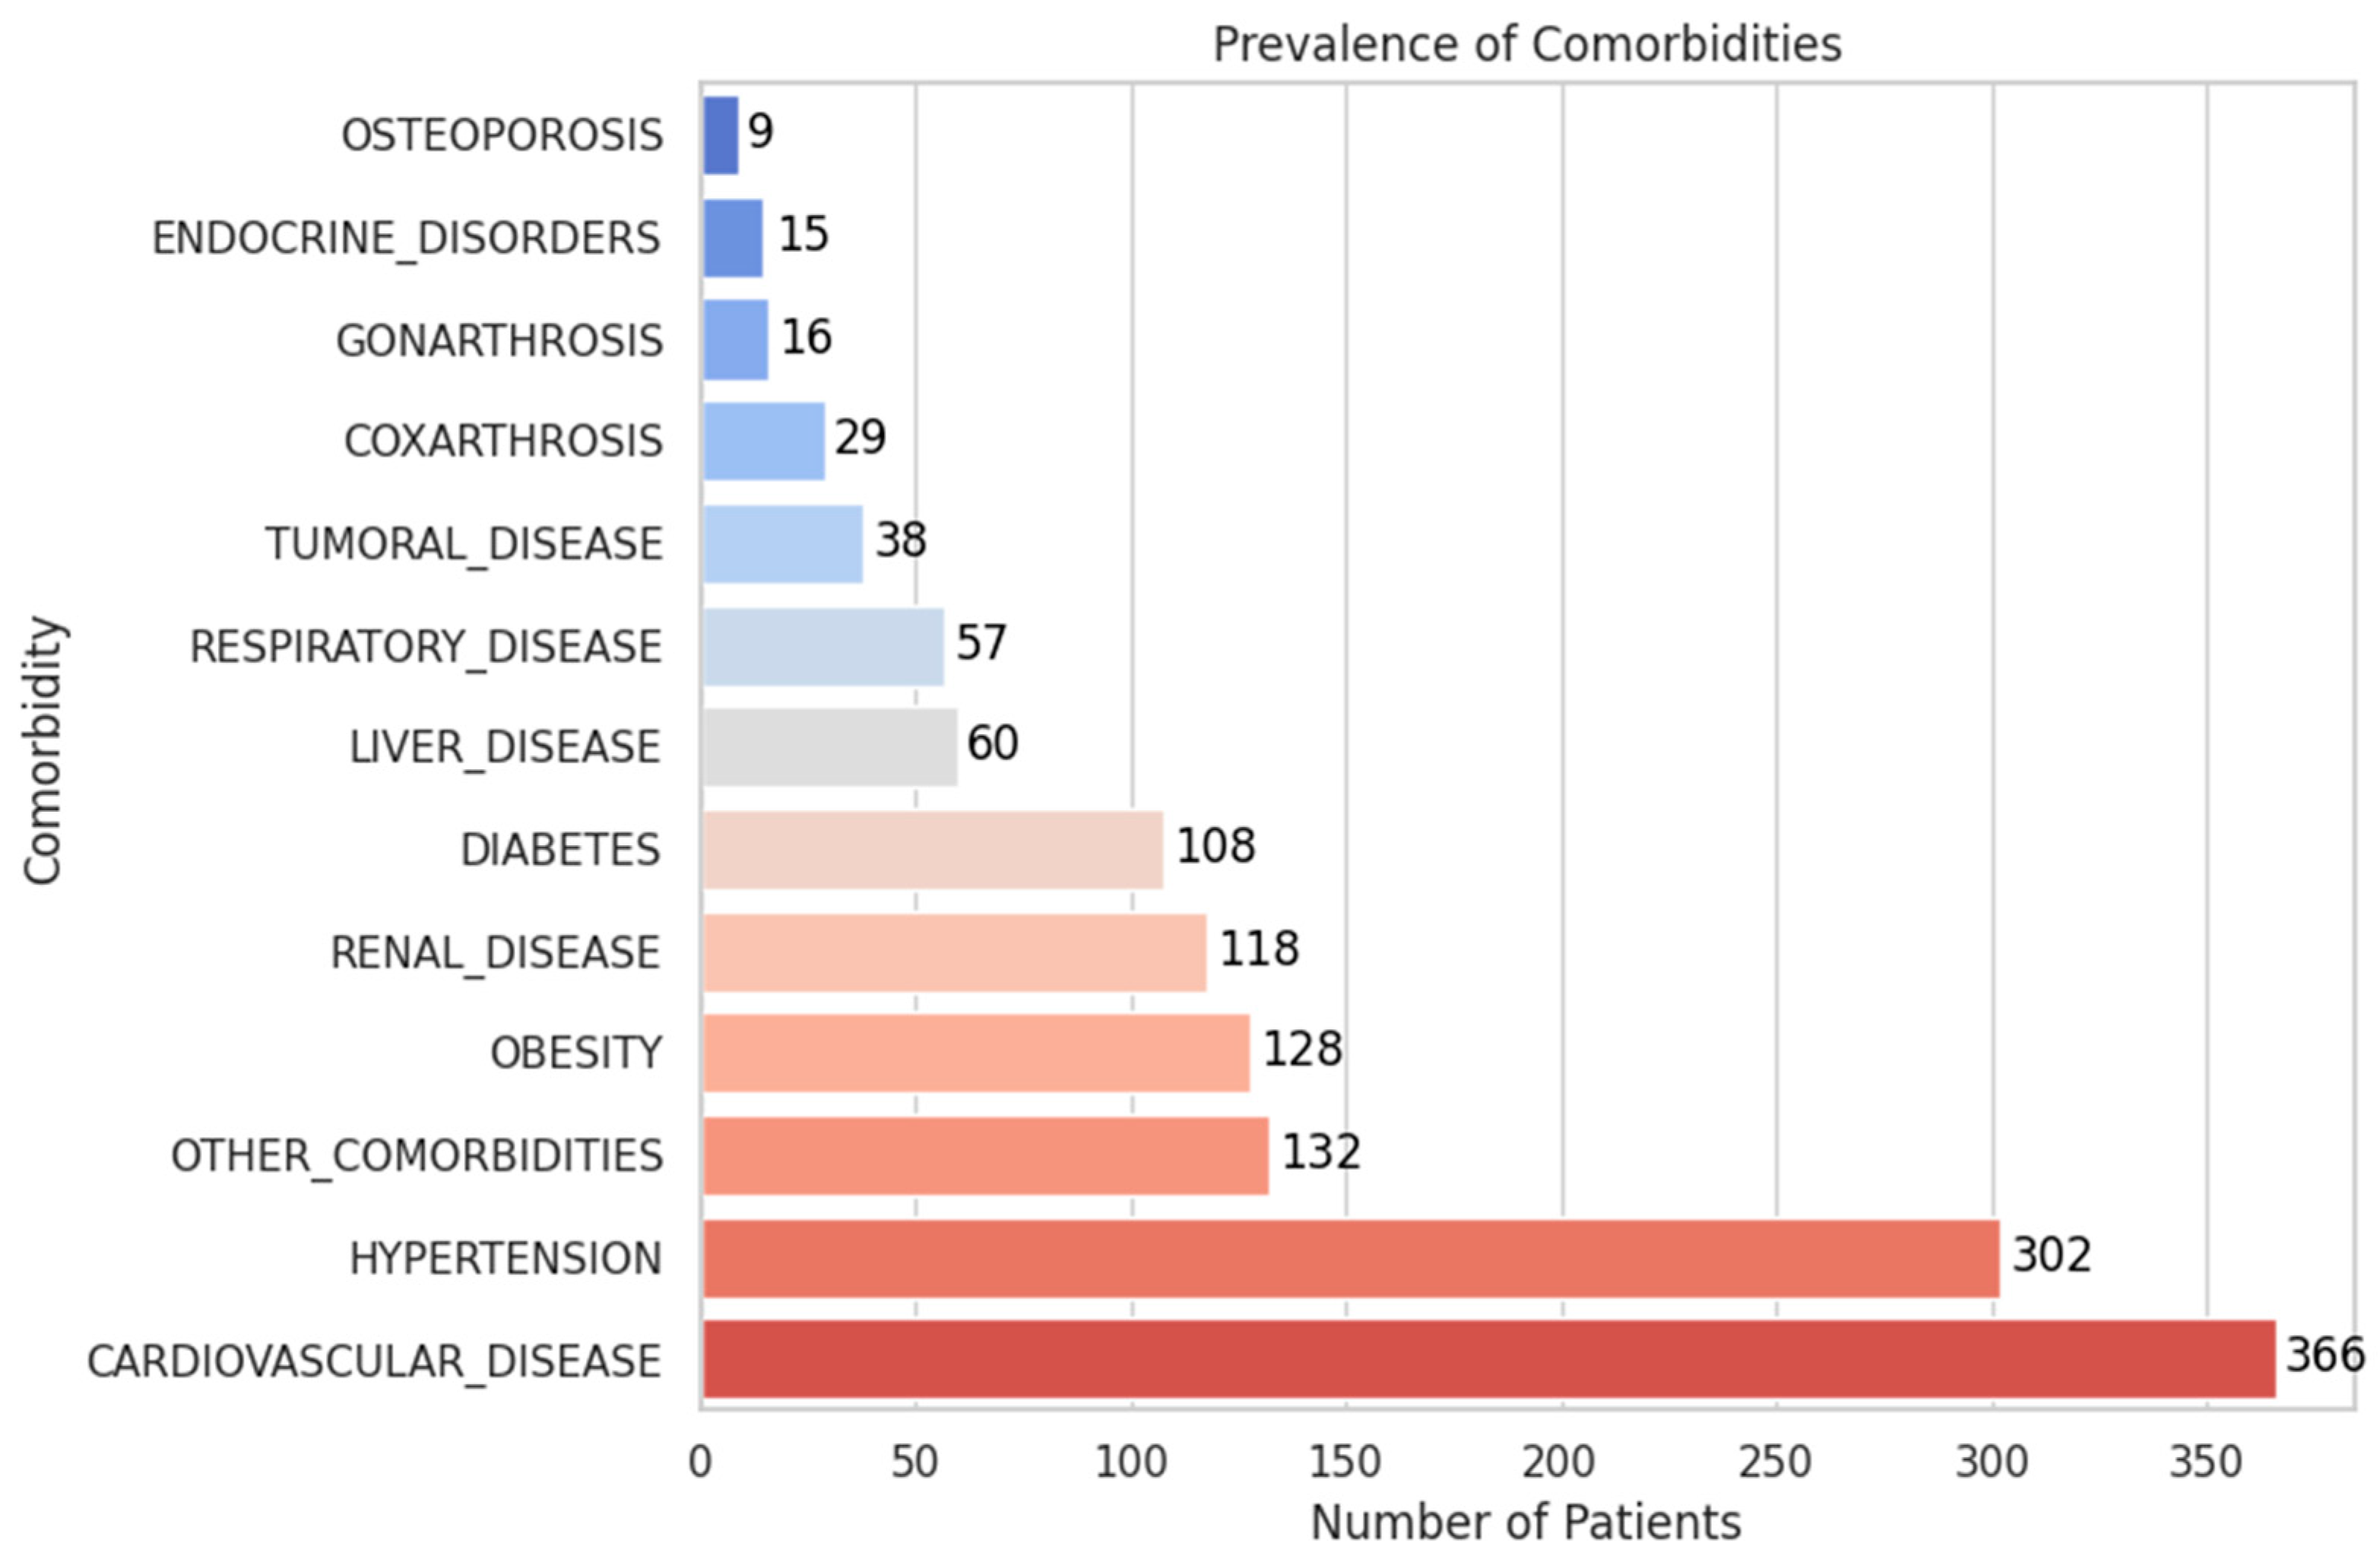
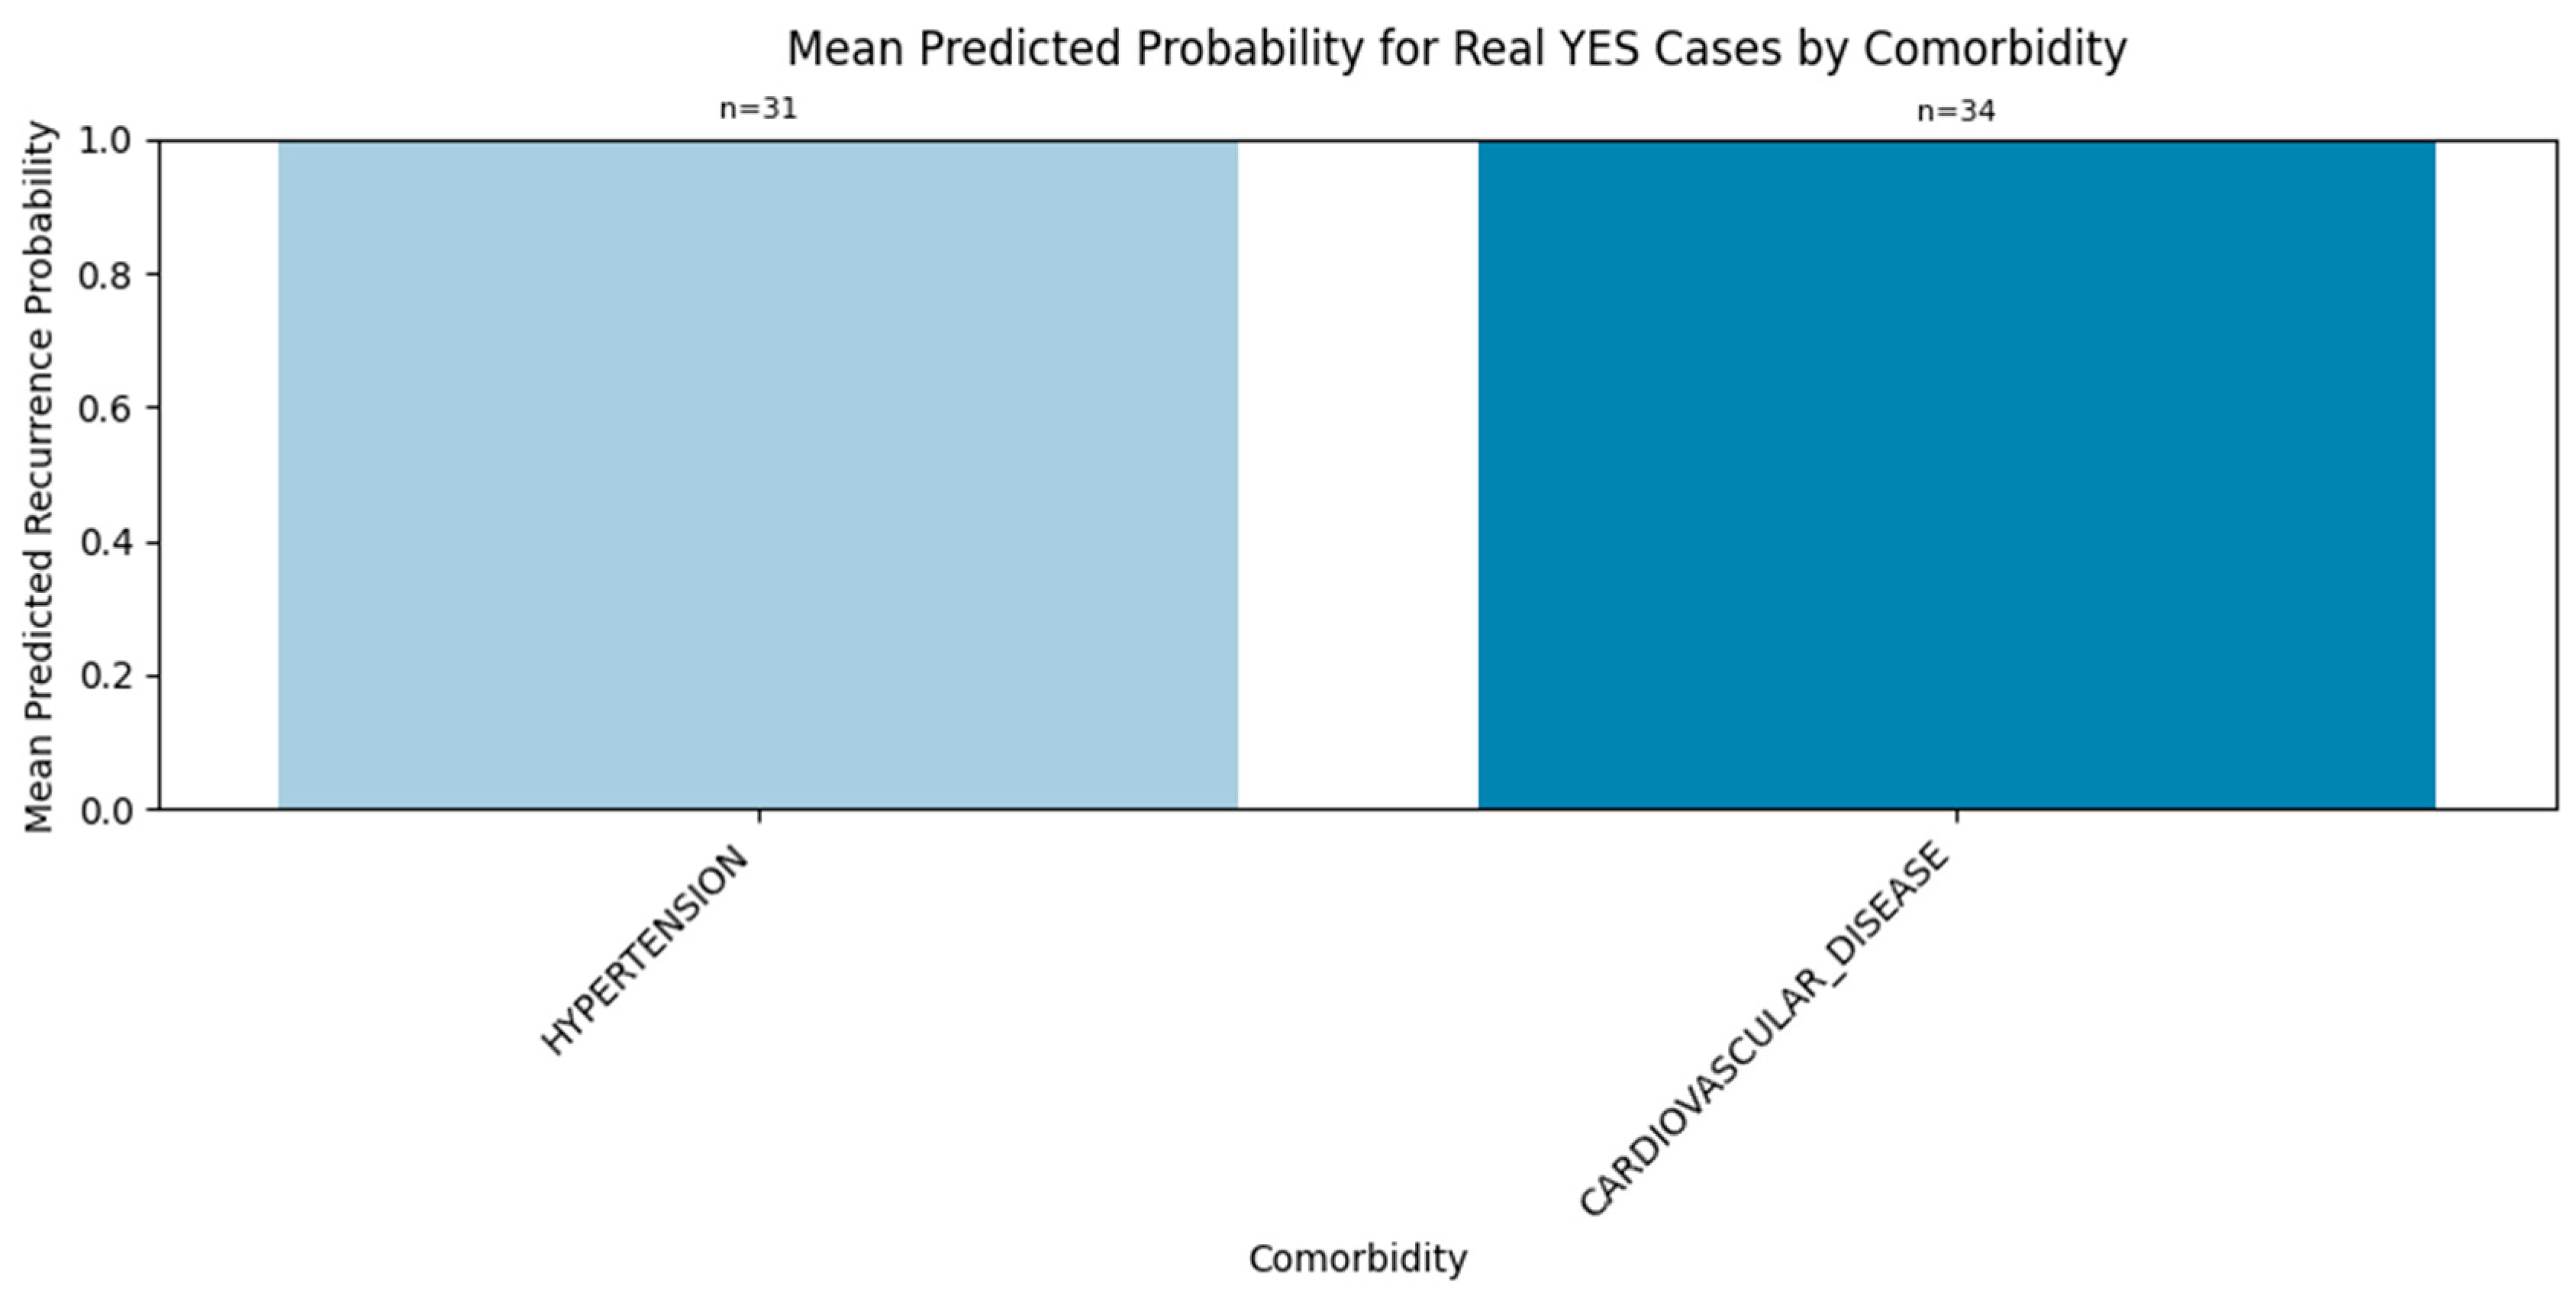
- The most frequent comorbidities were cardiovascular disease (37.5%, 366 patients) and hypertension (30.9%, 302 patients).
- Other prevalent conditions included obesity (13.1%), renal disease (12.1%), diabetes (11.1%), and liver disease (6.1%).
- Less common but clinically relevant findings included respiratory disease (5.8%), tumoral disease (3.9%), and coxarthrosis or gonarthrosis (2.9% and 1.6%, respectively).
- Endocrine disorders (1.5%) and osteoporosis (0.9%) were infrequent but may influence recovery and complication risk.
2.2. Statistical Association Analysis
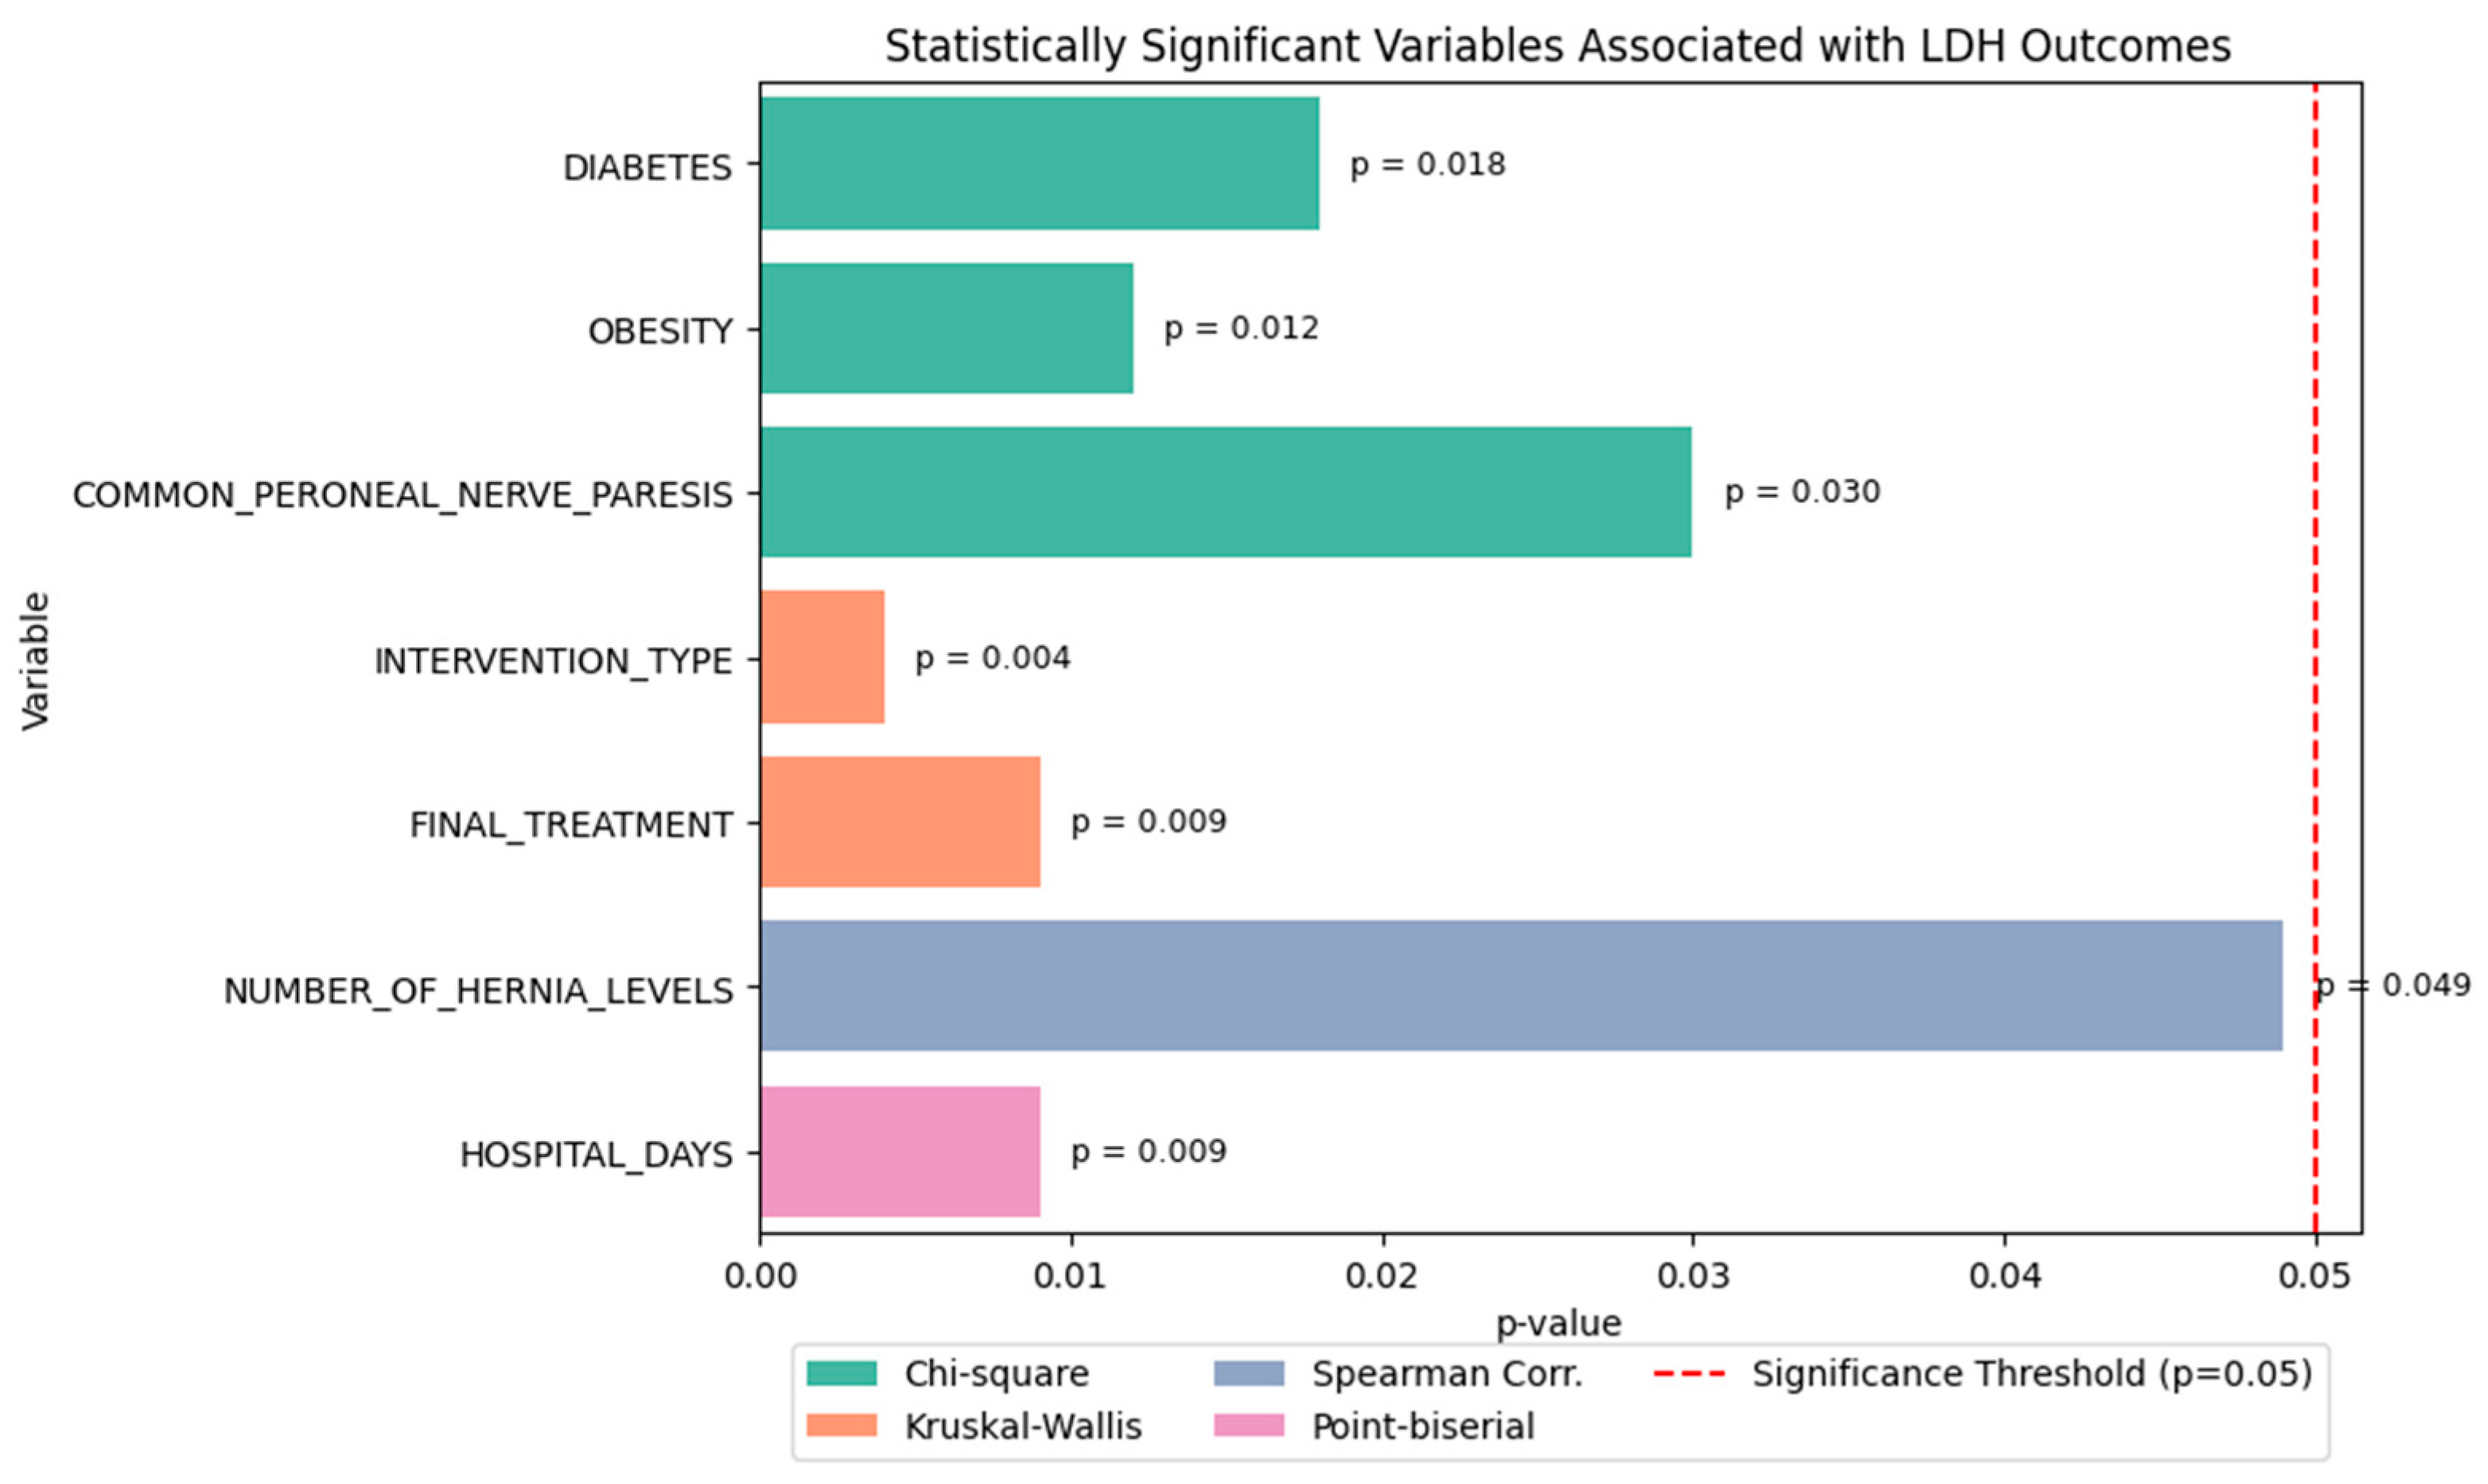
- Chi-square tests revealed that:
- ○
- Diabetes (p = 0.018),
- ○
- Obesity (p = 0.012), and
- ○
- Common peroneal nerve paresis (p = 0.030) were significantly associated with LDH recurrence.
- Kruskal–Wallis tests showed that both:
- ○
- Type of intervention (p = 0.004), and
- ○
- Final treatment approach (p = 0.009) significantly influenced the functional outcome score.
- Spearman correlation indicated a weak but statistically significant relationship between:
- ○
- Number of herniated levels and recurrence type (ρ ≈ 0.11, p = 0.049).
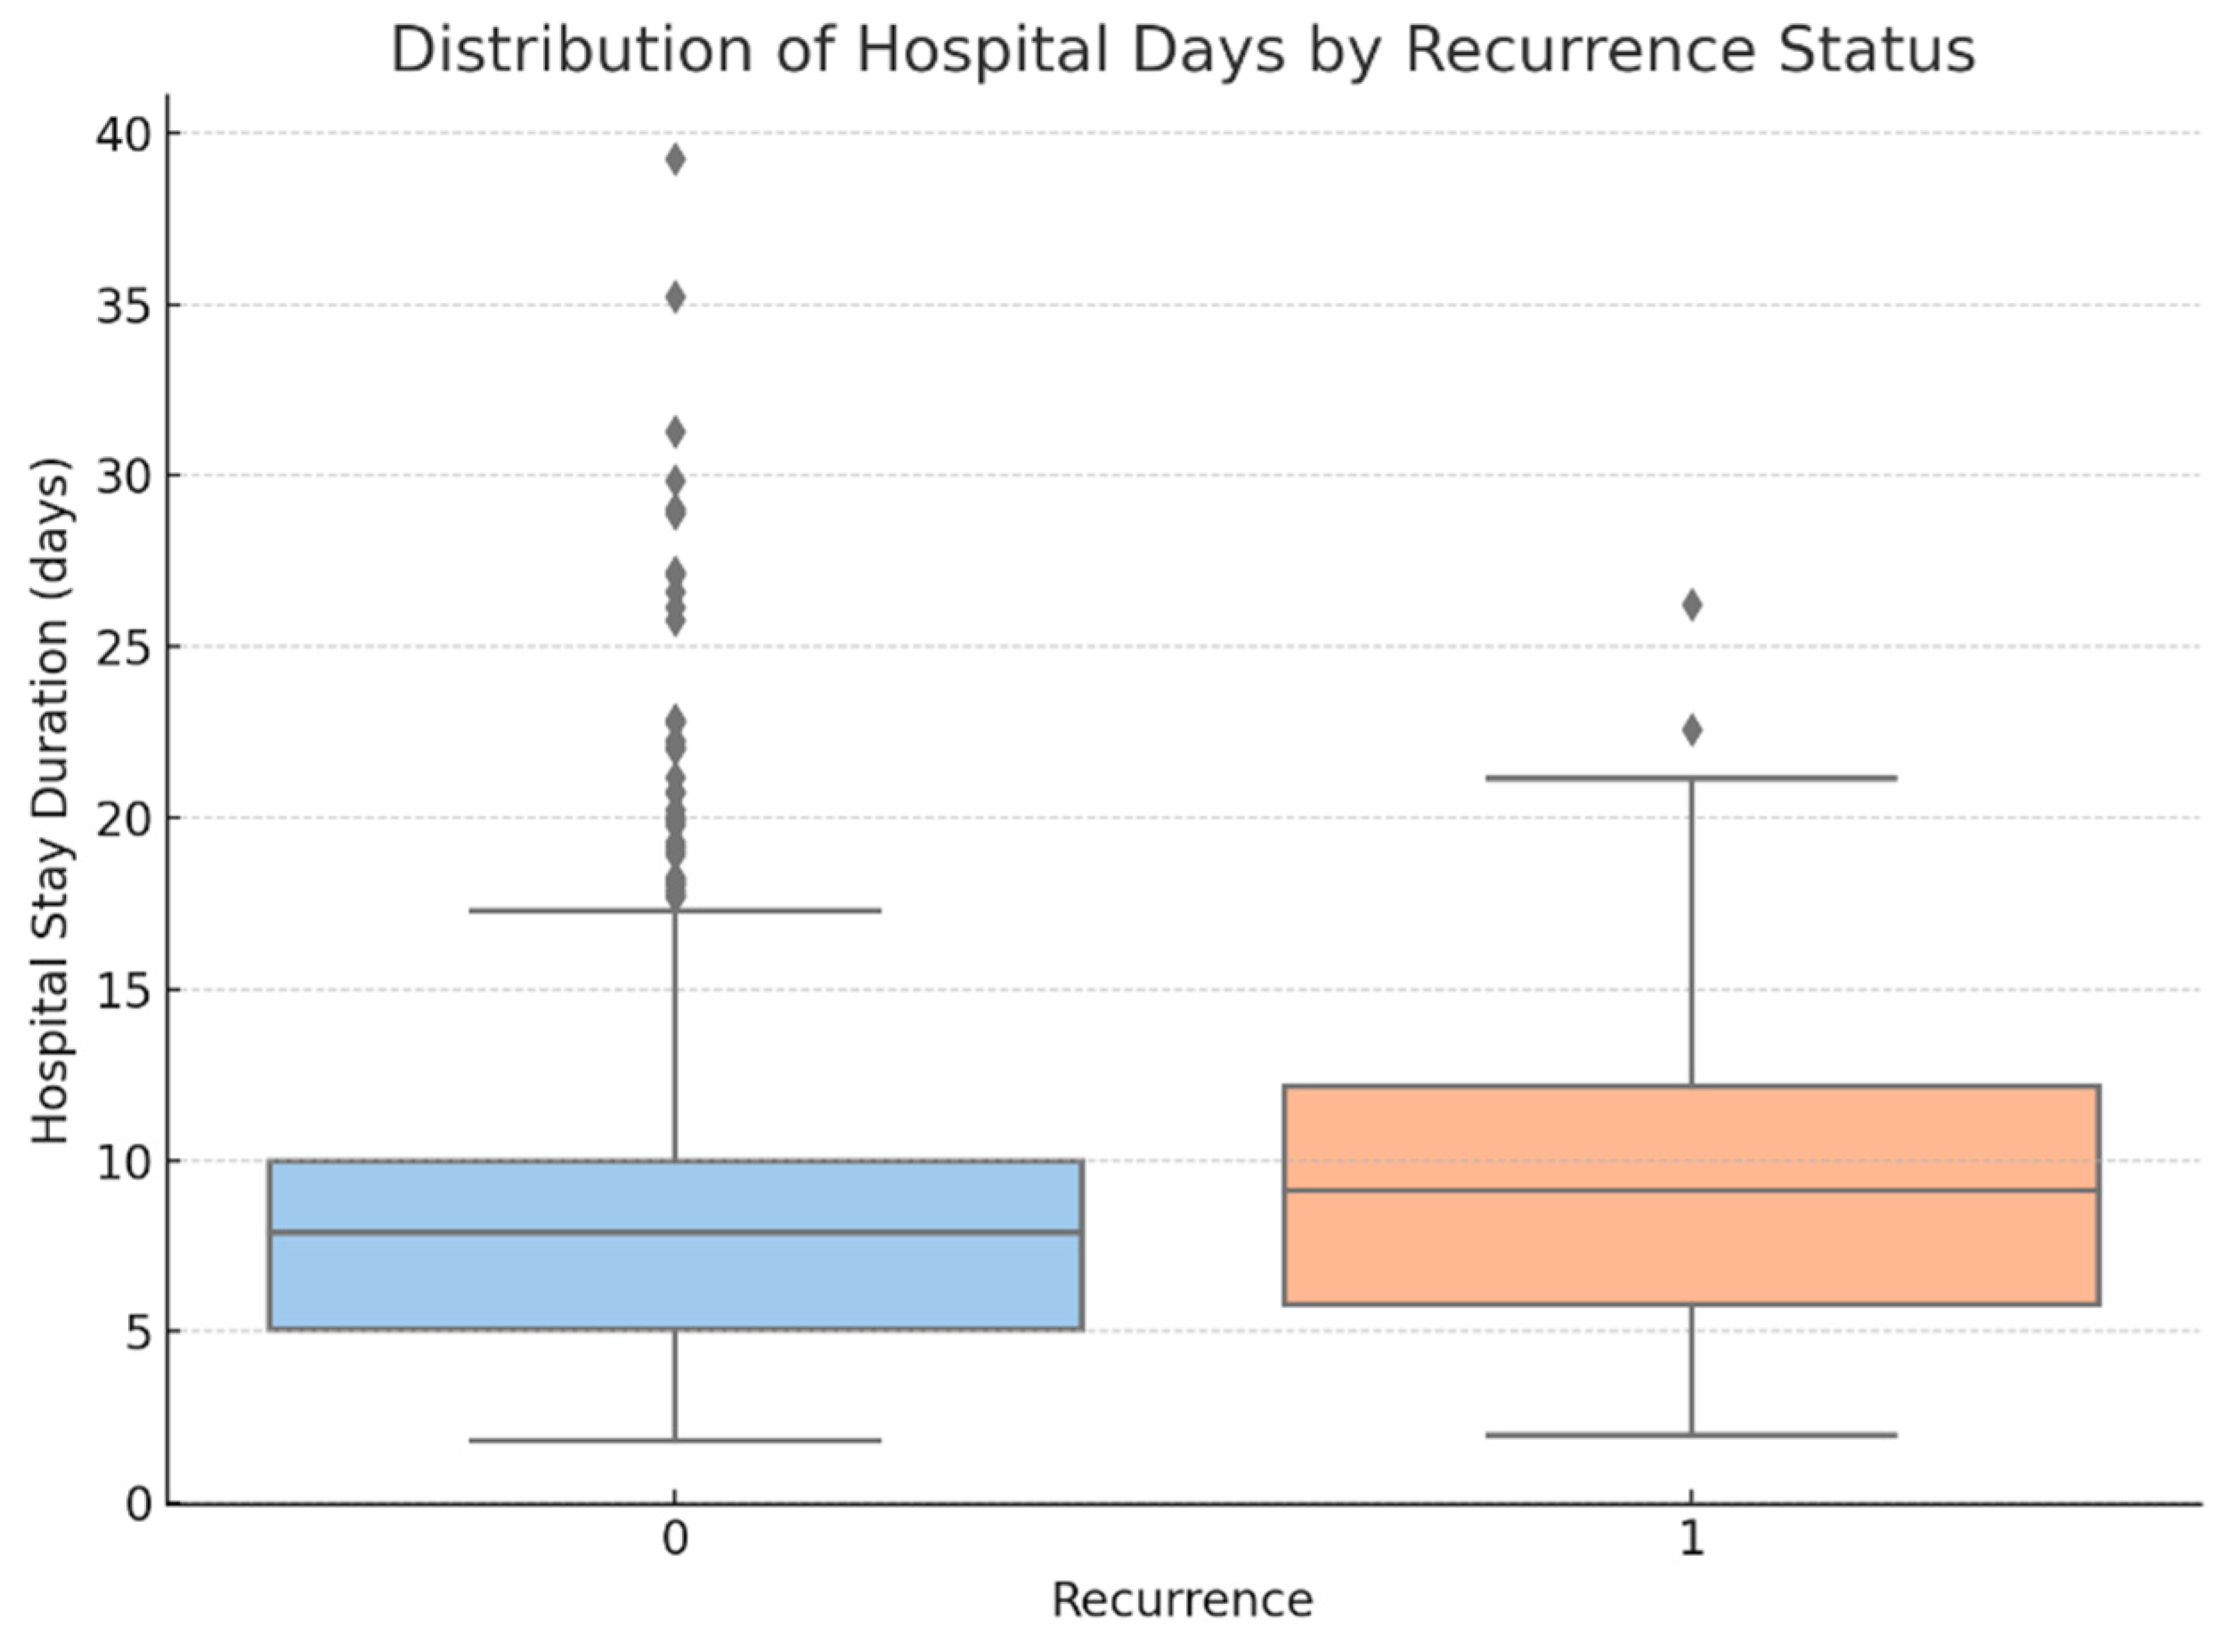
- Point-biserial correlation demonstrated that:
- ○
- Hospital stay duration was significantly longer in patients who experienced recurrence (p = 0.009) (see Figure 15).
2.3. Machine Learning Pipeline and Model Design
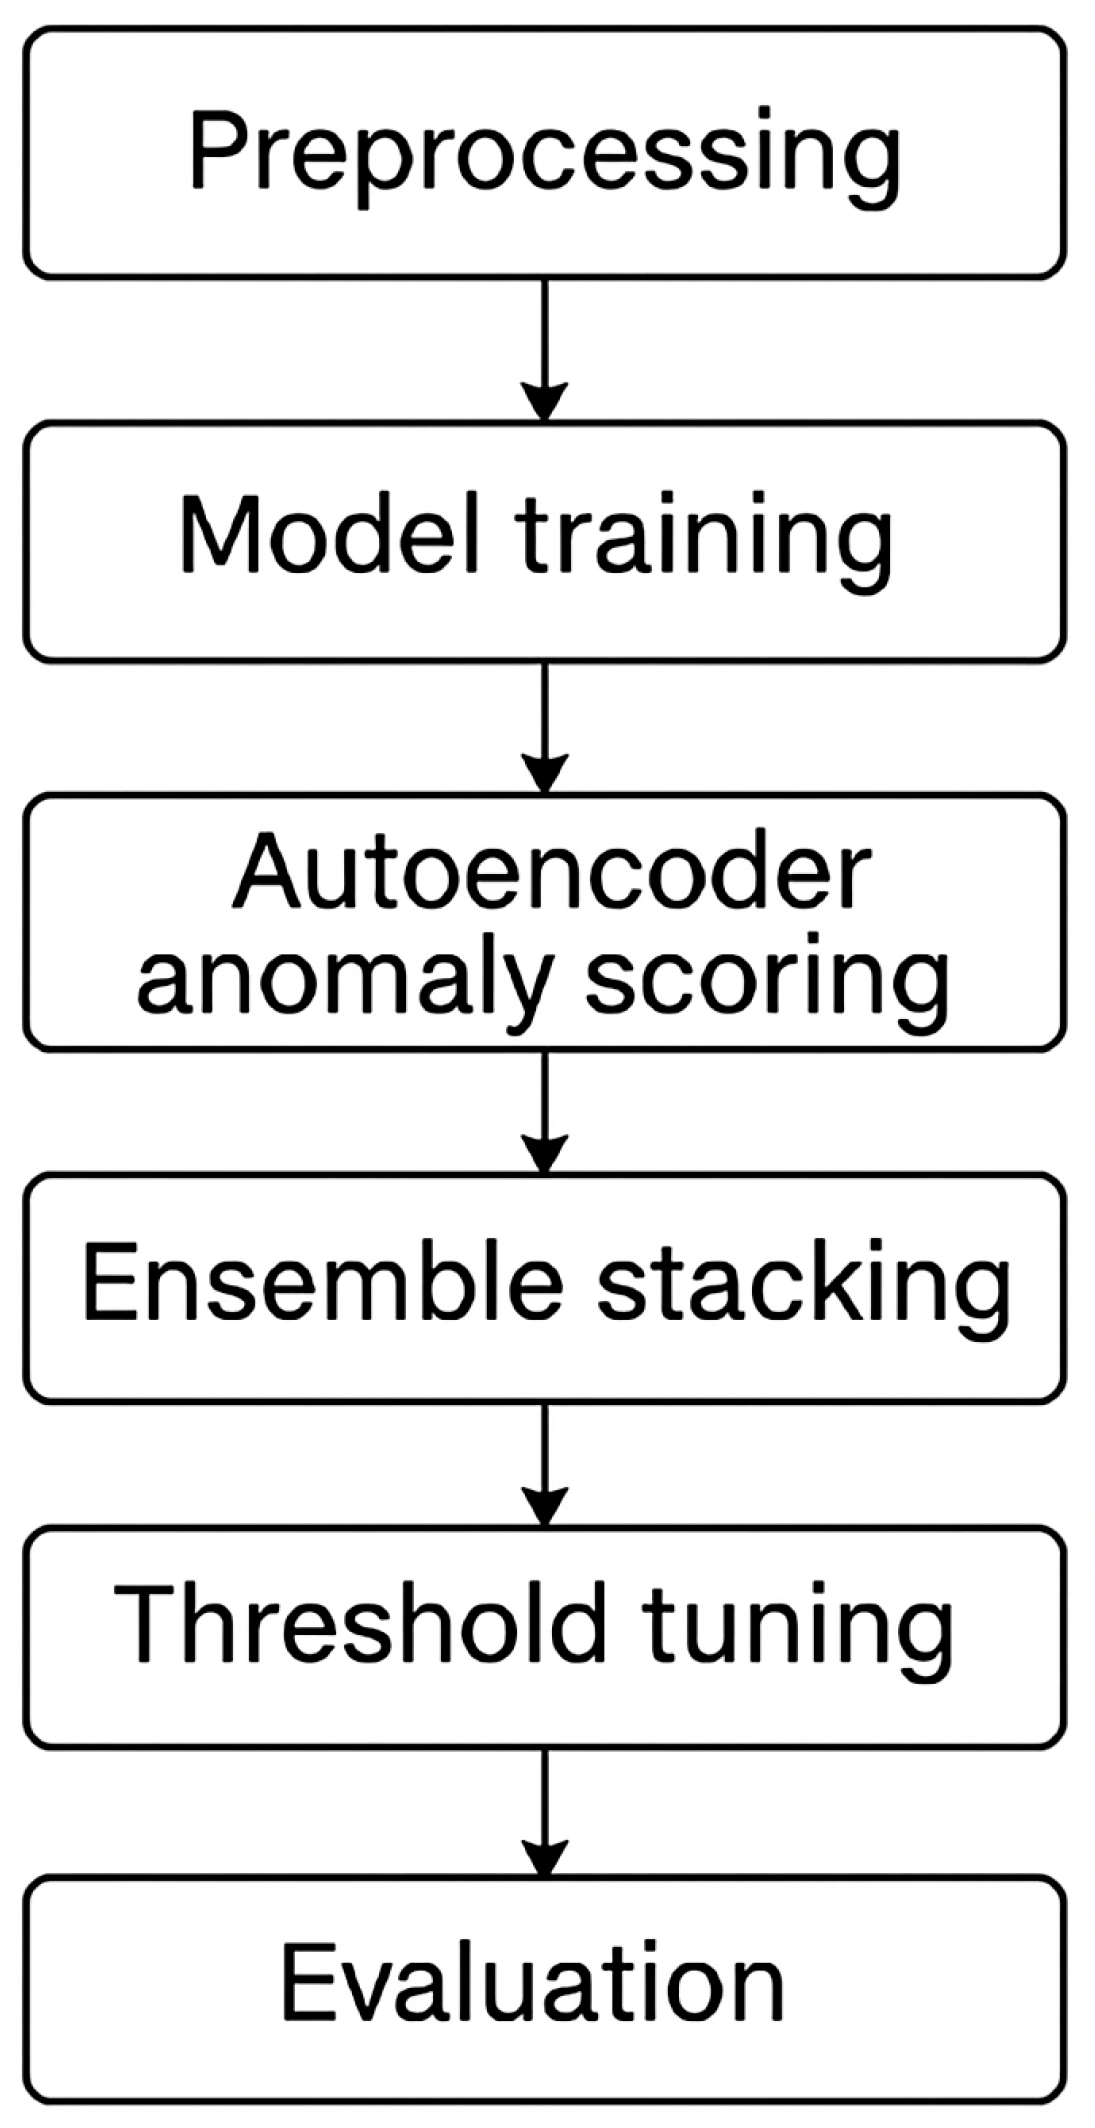
2.3.1. Pipeline Overview
2.3.2. Modeling Strategy and Workflow
Preprocessing and Feature Encoding
- Total Samples: 977
- Number of Features: 35
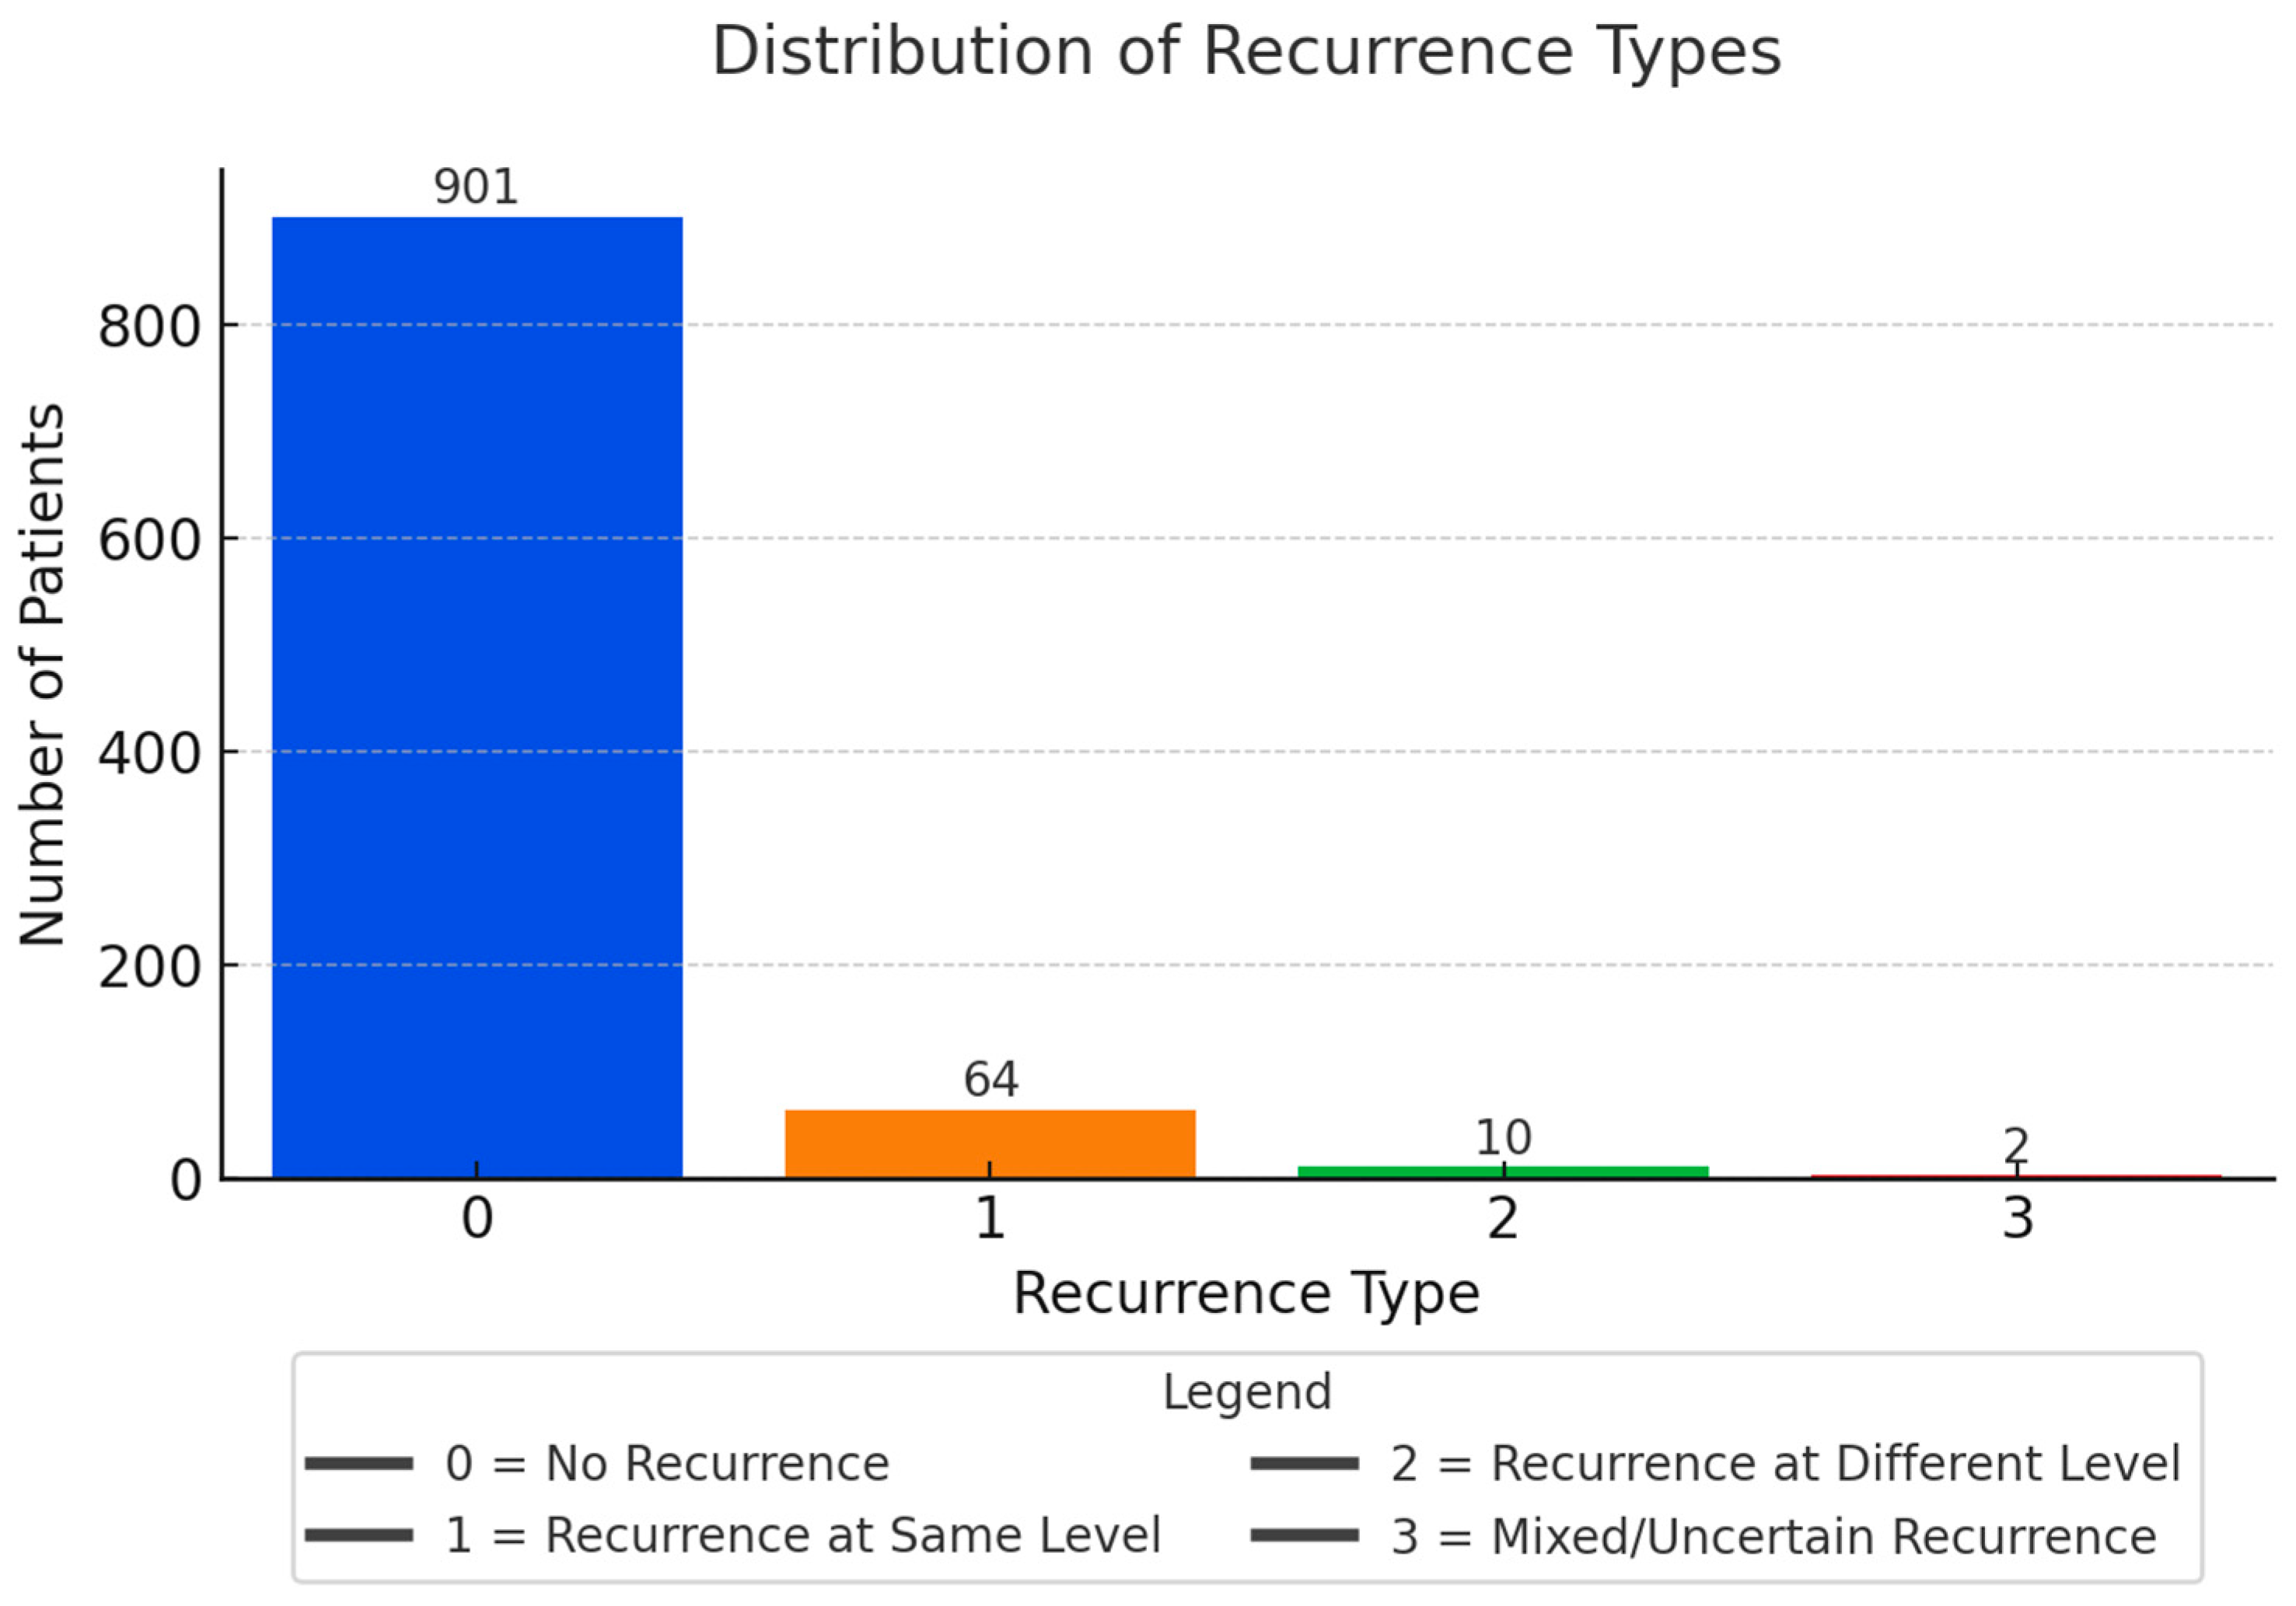
- Class Distribution: 901 NO, 76 YES
- Missing Values: None
- Feature Types: Mostly float64, 1 object column (RECURRENCE)
Exploratory Statistical Testing
- INTERVENTION_TYPE
- HOSPITAL_DAYS
- NUMBER_OF_HERNIA_LEVELS
- L4_L5
- AGE
Baseline Classifier Benchmarking
- Logistic Regression (with class weighting)
- Support Vector Machine (SVM, RBF kernel, class weighting)
- Random Forest (100 trees, class weighting)implemented using scikit-learn with n_estimators = 100, class_weight = “balanced”, and random_state = 42 to address class imbalance and ensure reproducibility. Tree depth was not manually constrained (max_depth = None), allowing full growth and letting the model naturally identify optimal splits based on the Gini impurity criterion. The number of trees was chosen to balance computational cost and model performance, as larger values yielded diminishing returns during validation.
Anomaly Detection Approaches
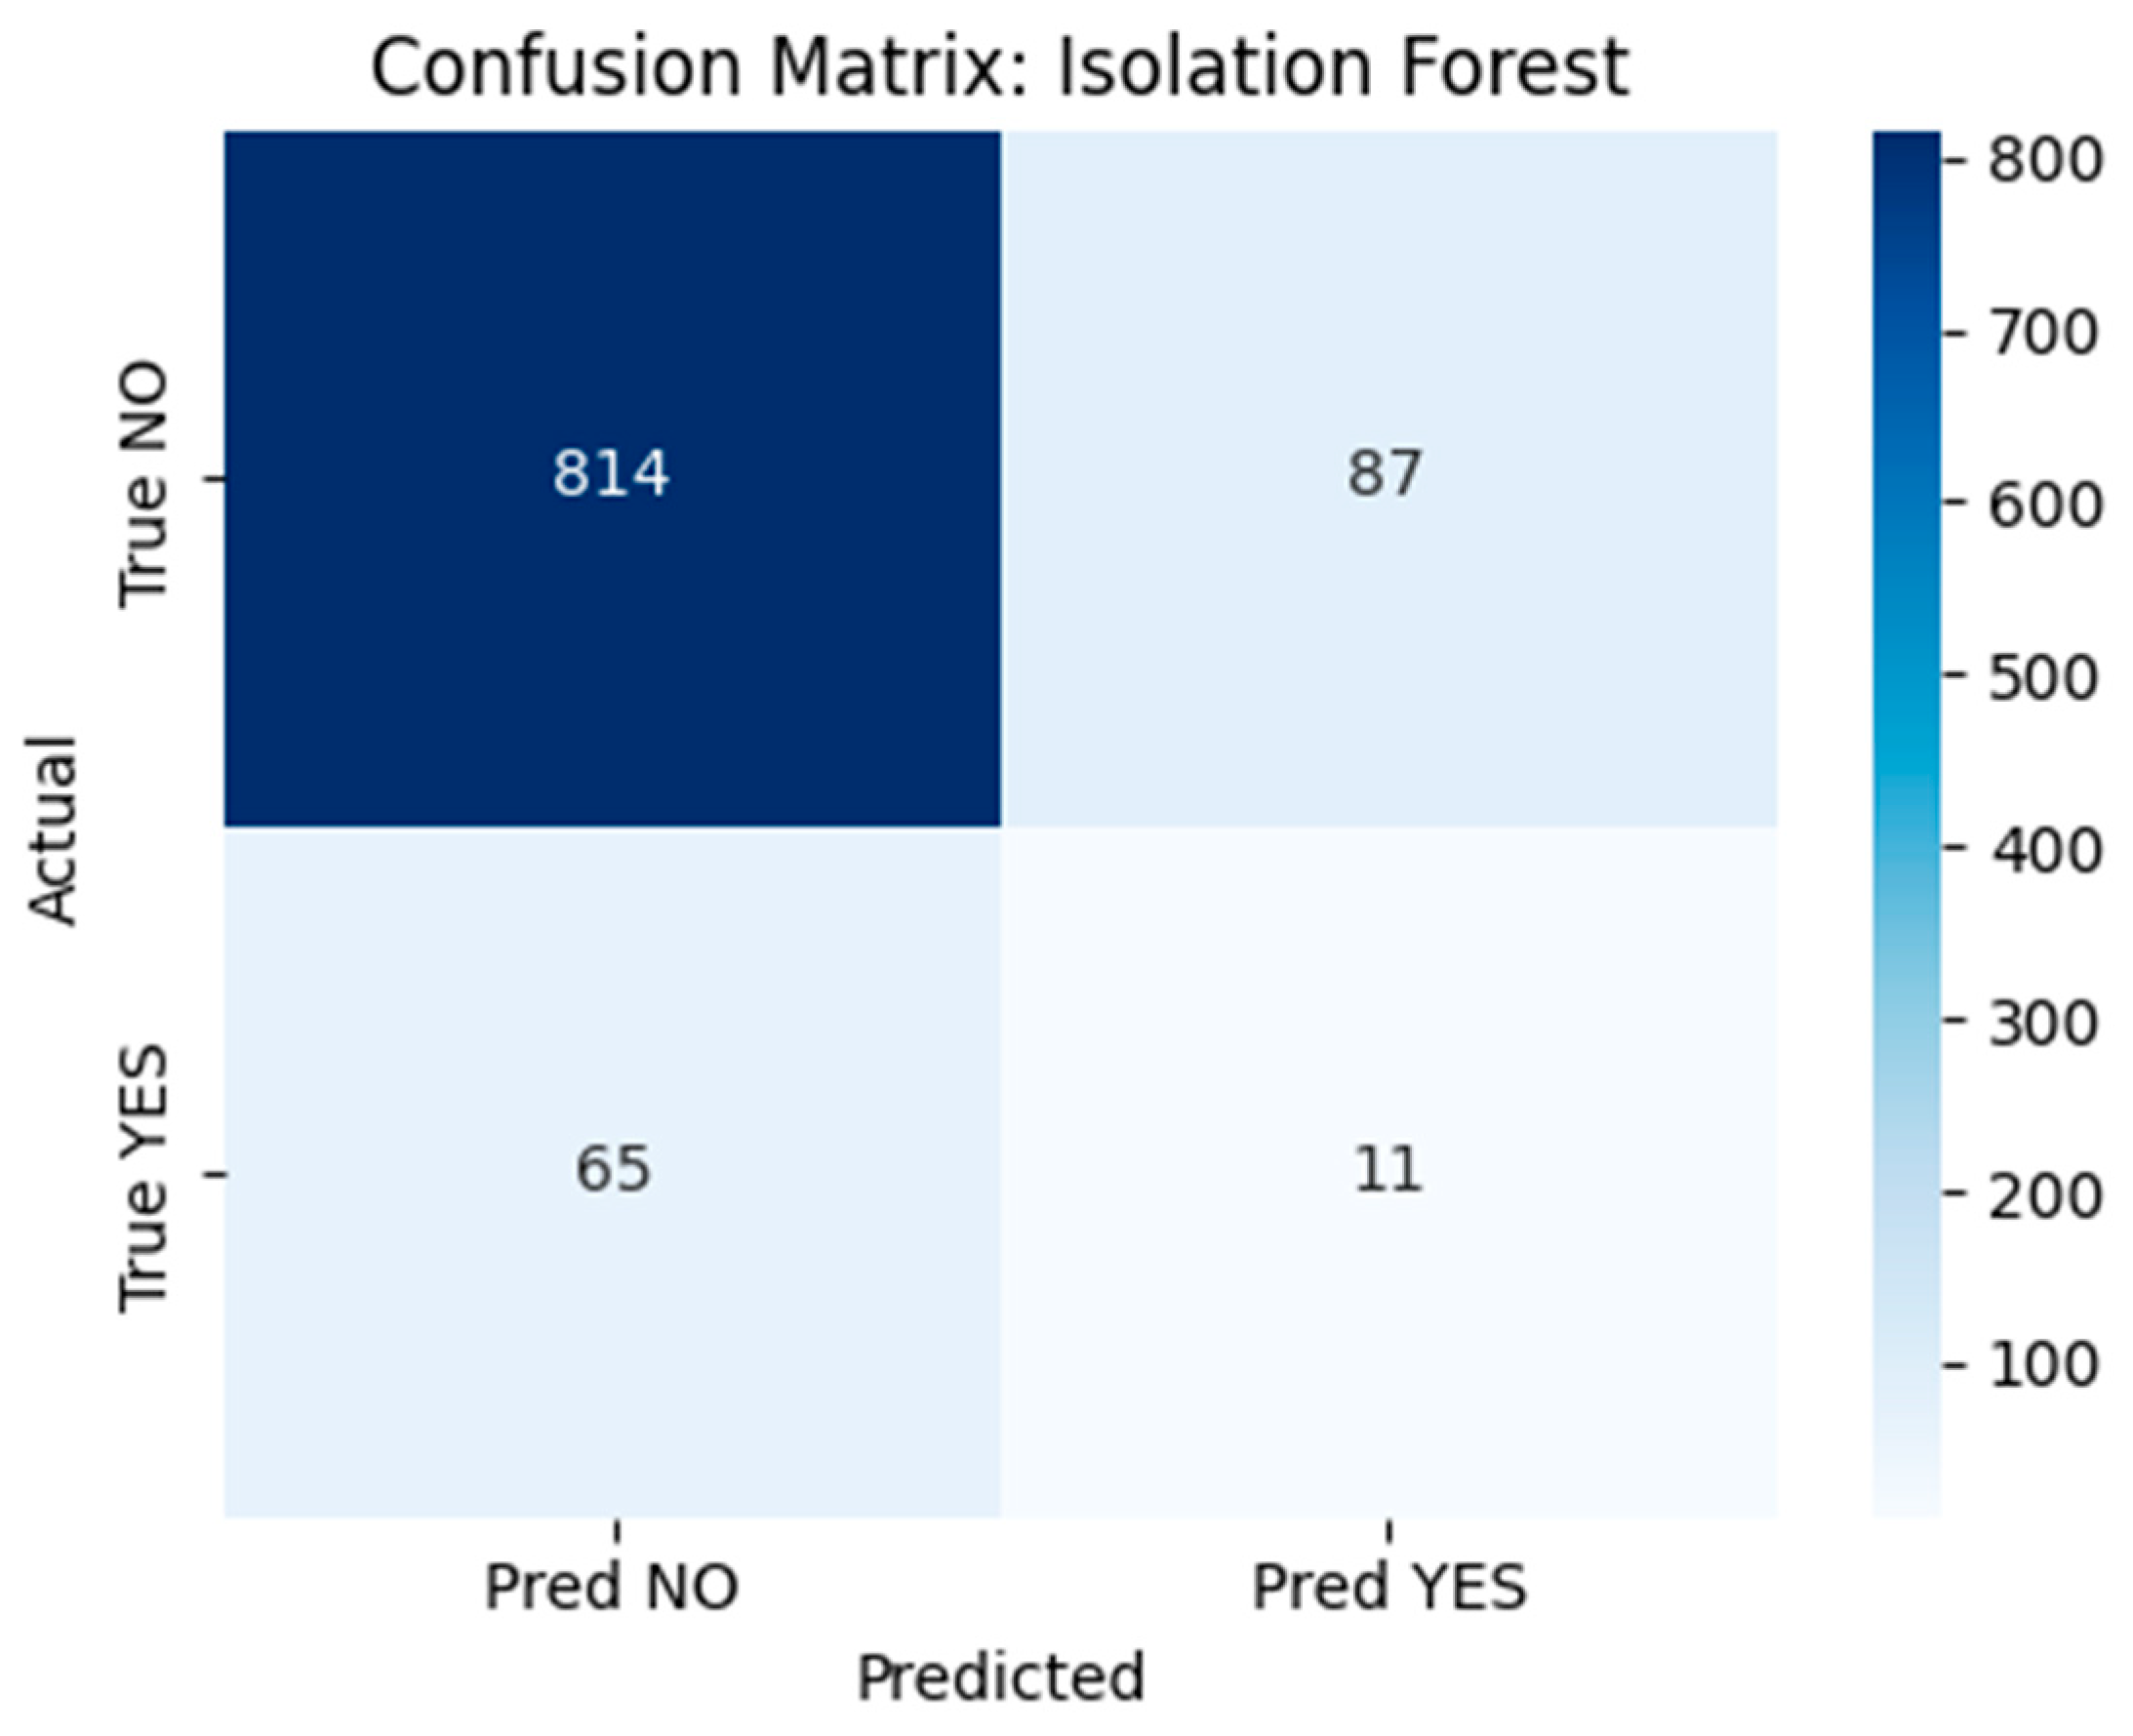
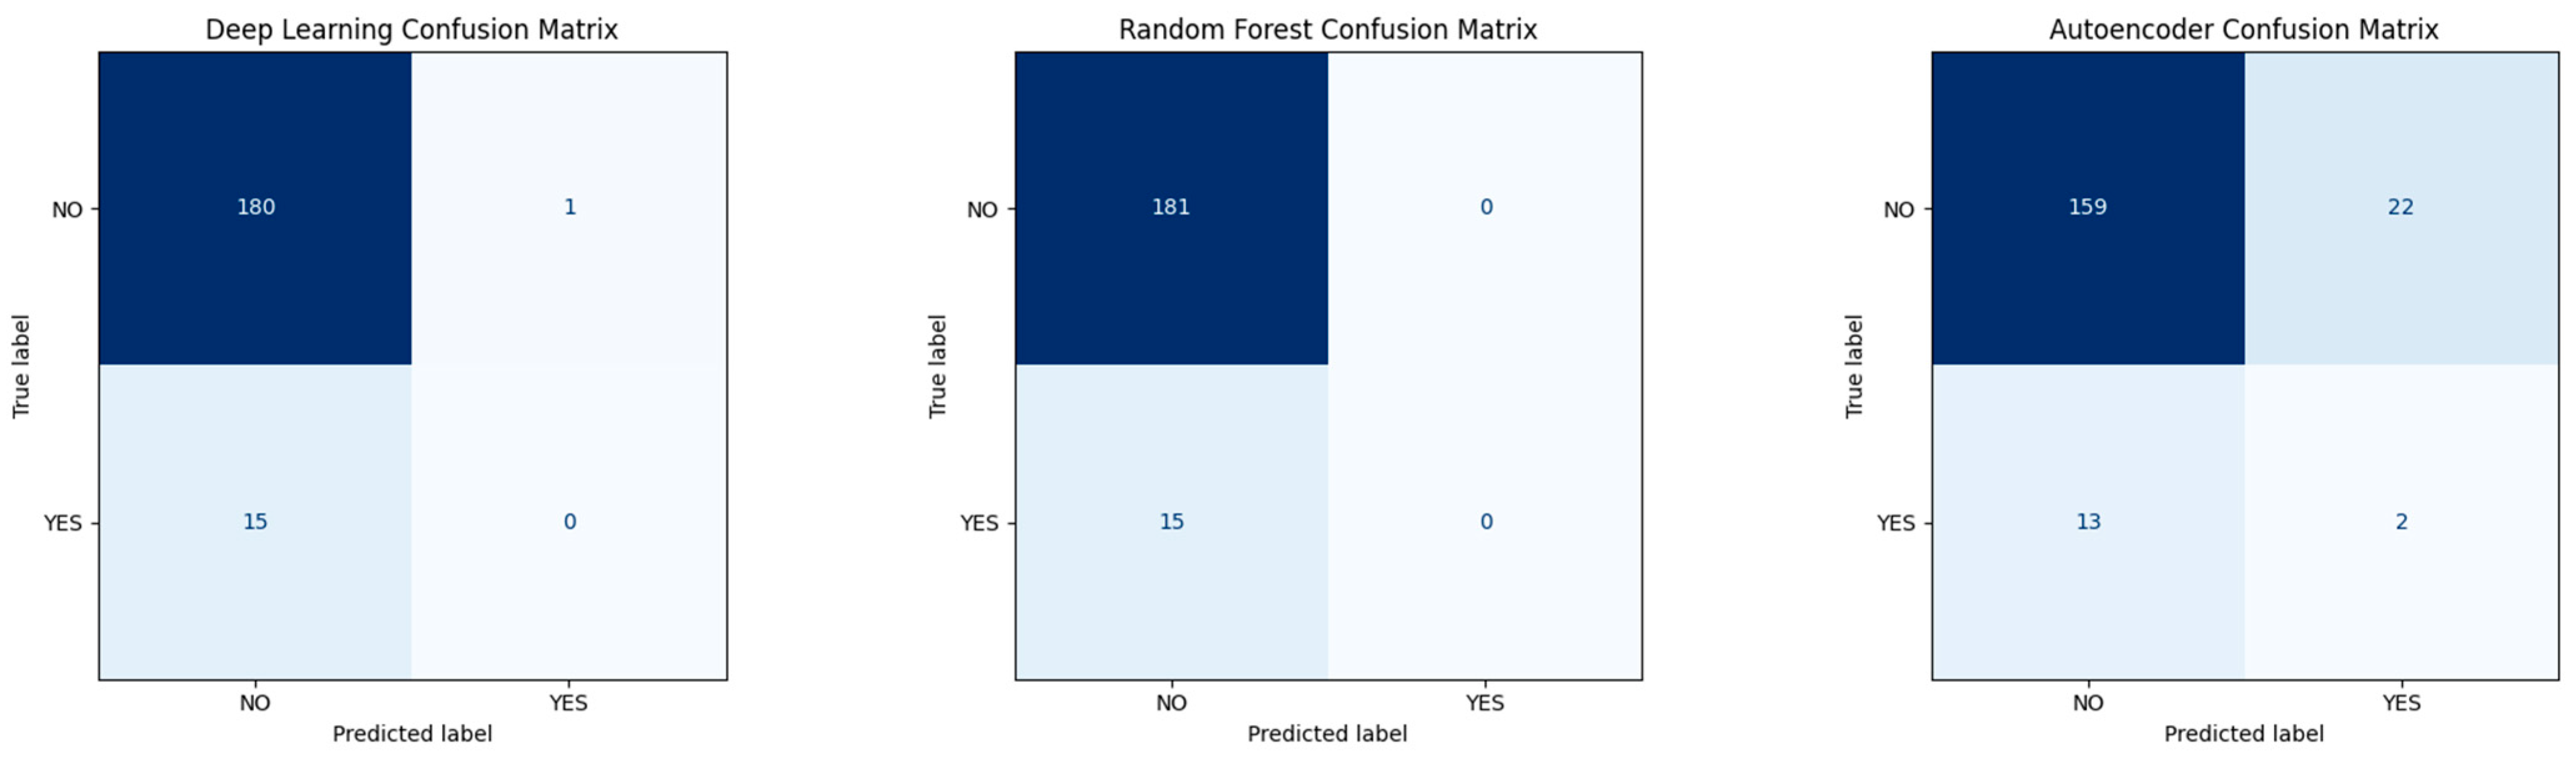
- Isolation Forest: A tree-based anomaly detection method implemented using scikit-learn’s IsolationForest class with 100 estimators, a contamination parameter set to 0.1, and random_state = 42 to ensure reproducibility. The model was trained on the full dataset without labels to detect rare postoperative profiles. Although conceptually suitable for outlier detection, performance was limited in this application. The confusion matrix (Figure 18) revealed that the model correctly flagged 11 true recurrence cases (YES), but misclassified 65 YES cases and generated 87 false positives.
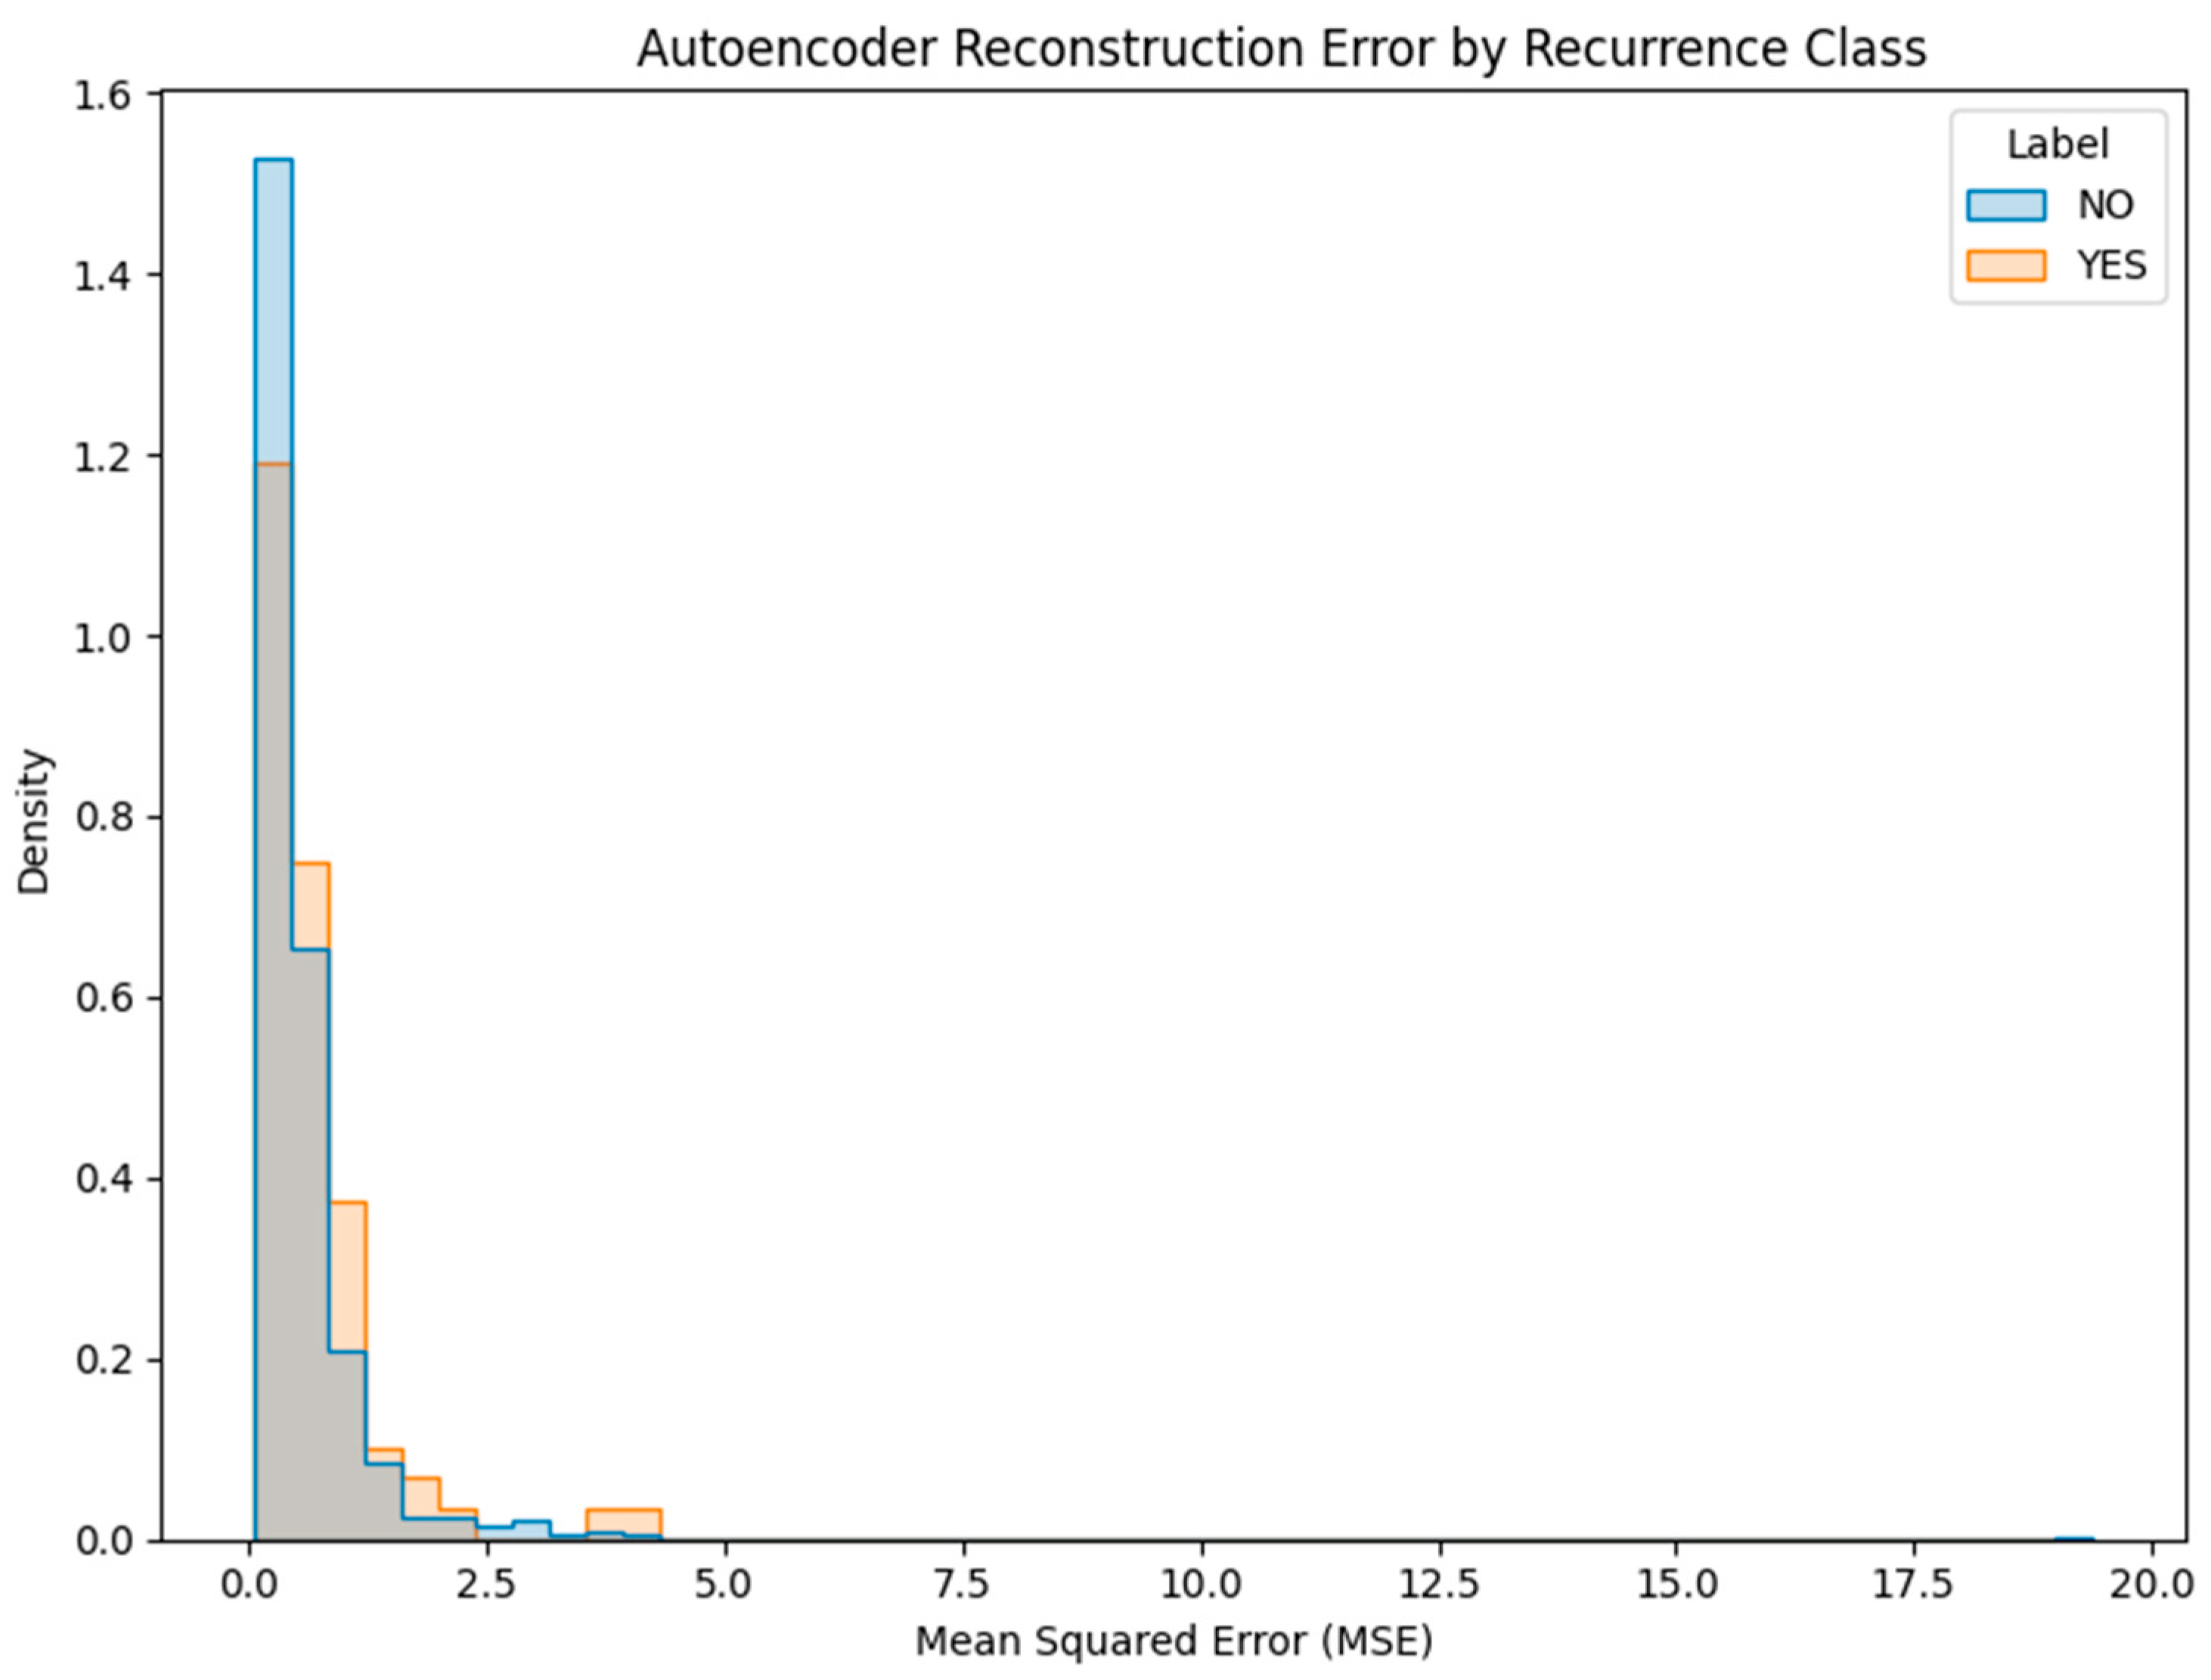
- Deep Autoencoder: A neural architecture trained exclusively on non-recurrence (NO) cases to learn a compressed representation of normal patterns. At inference time, the model reconstructs patient profiles, and samples with high reconstruction error (MSE) are flagged as anomalies (Figure 19). This approach proved more promising, with a subset of YES cases exhibiting elevated error scores.
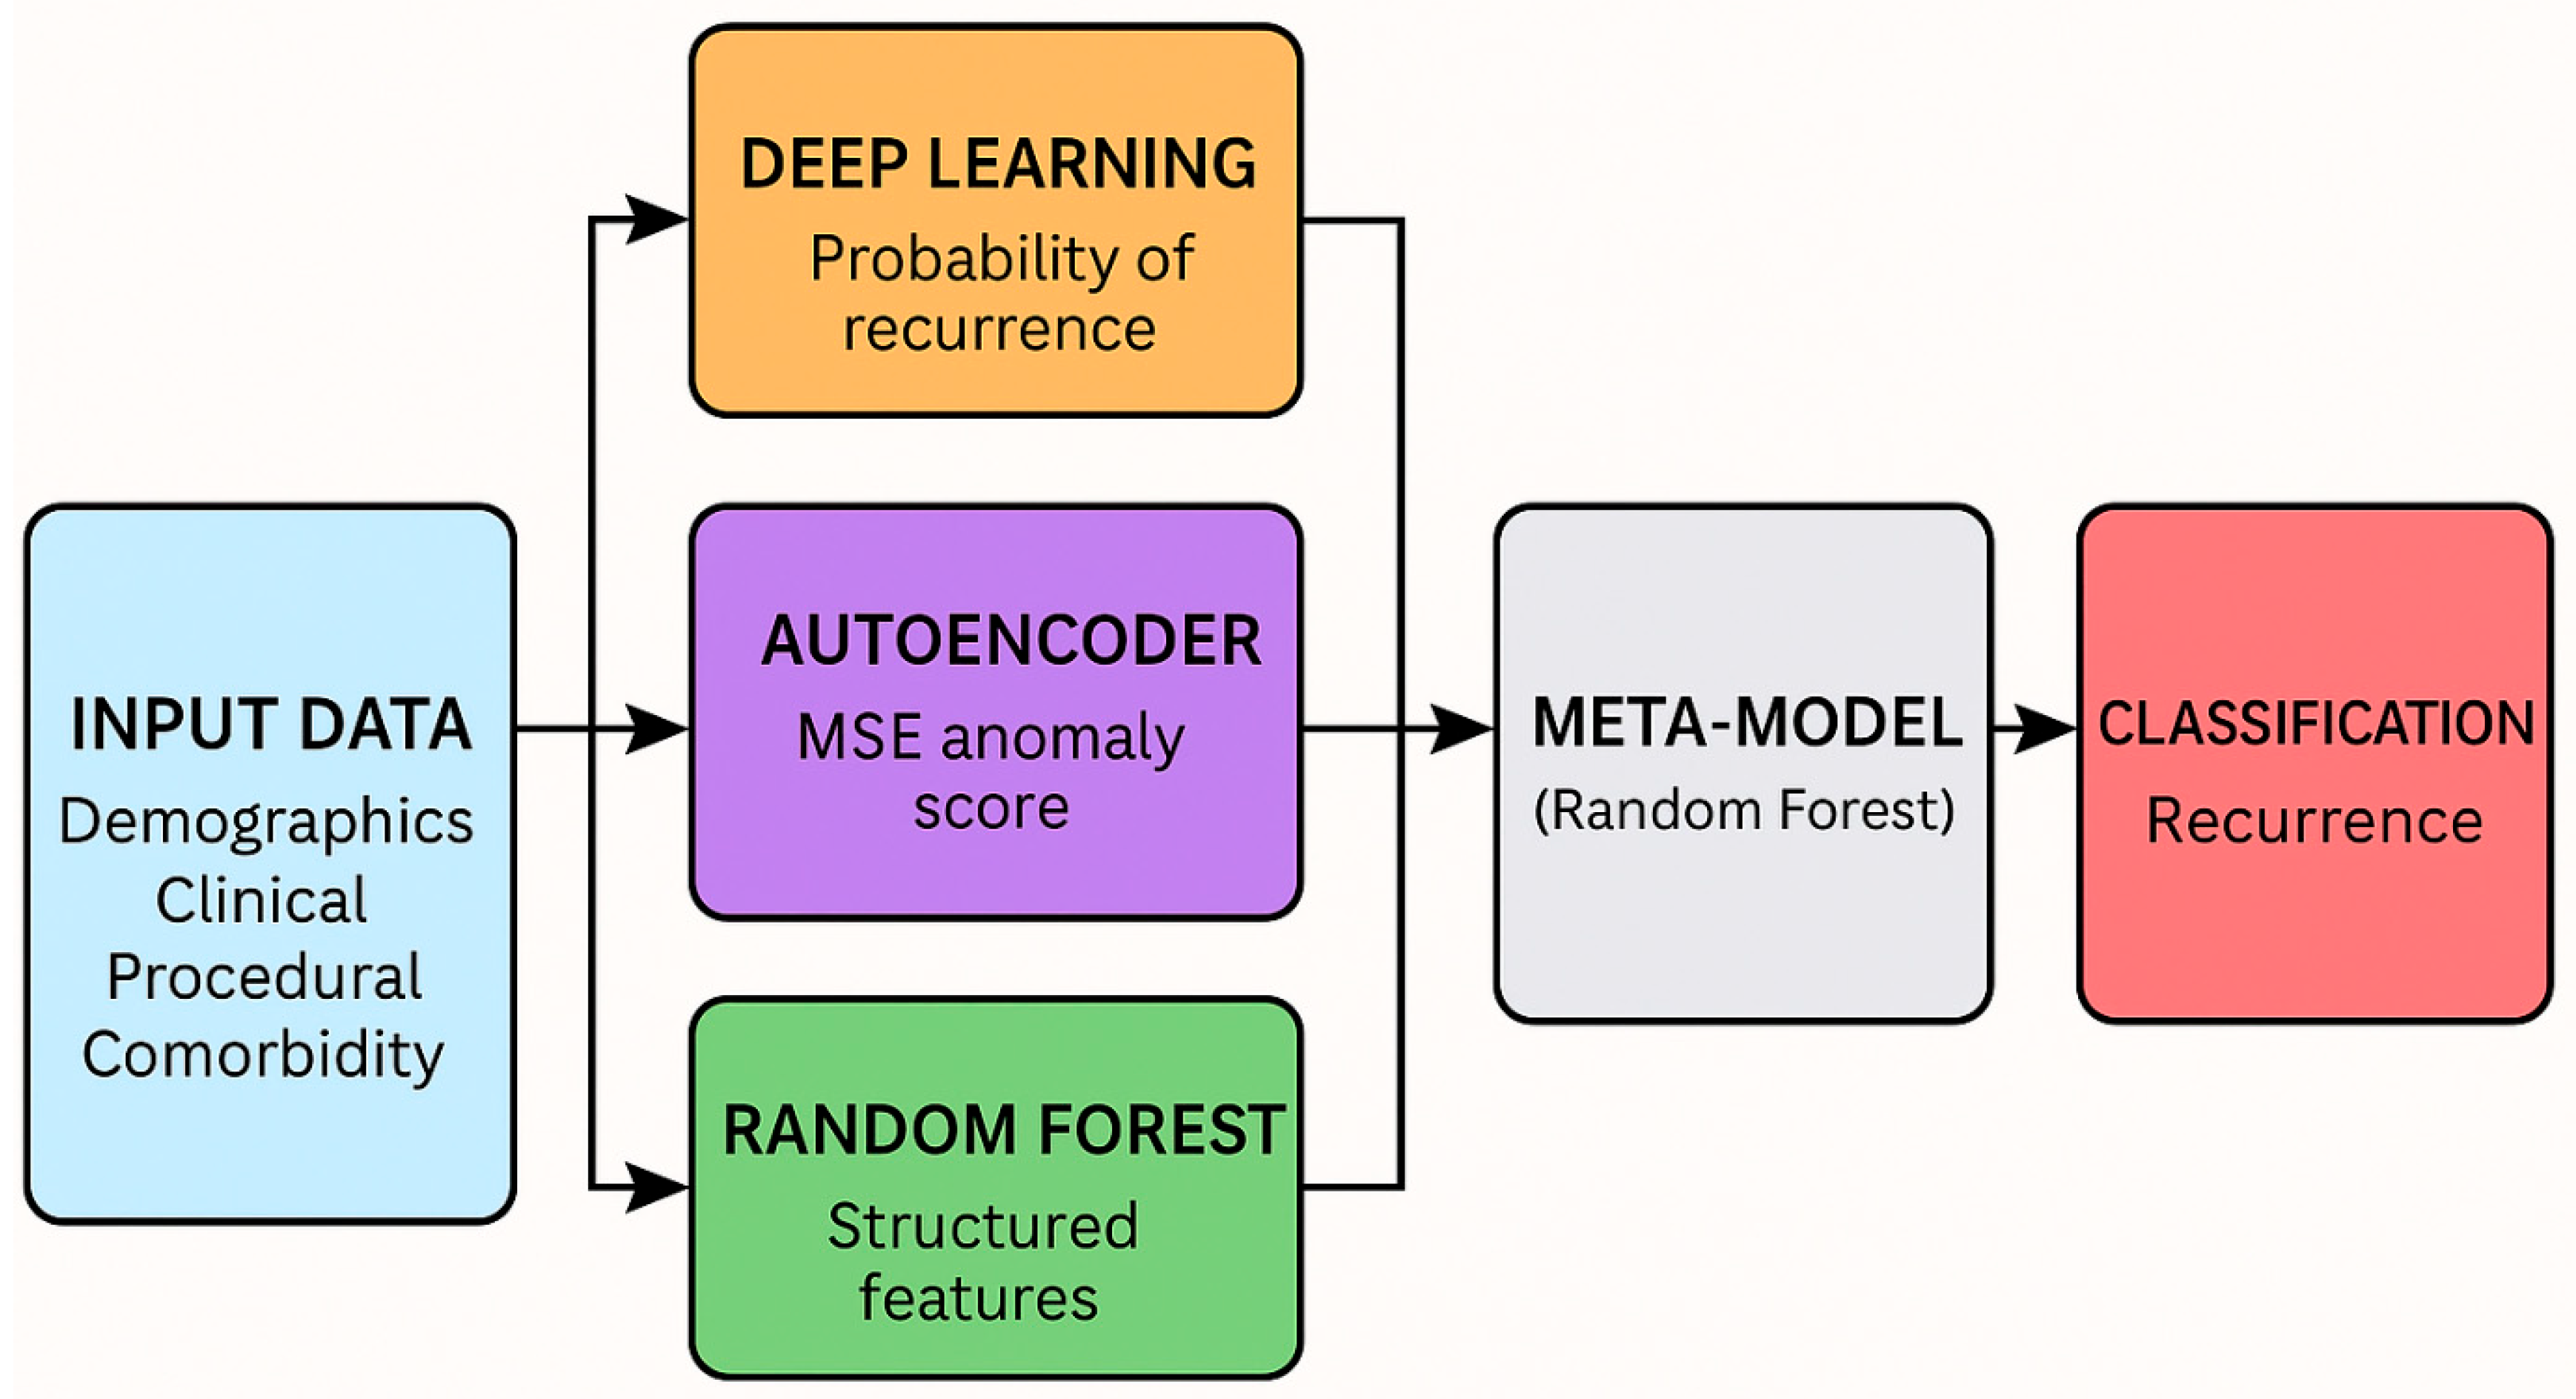
Stacked Ensemble Construction
- Deep Learning Classifier (Multi-Layer Perceptron, MLP): implemented using Keras with two hidden layers consisting of 64 and 32 units, respectively, each using ReLU activation. The final output layer uses a sigmoid activation to produce recurrence probabilities. The model was trained with the Adam optimizer, binary cross-entropy loss, and early stopping based on validation loss (patience = 5). Class imbalance was handled using class weights. No dropout layers were included.
- Random Forest Classifier: outputs recurrence probability.
- Deep Autoencoder: provides anomaly score via mean squared reconstruction error (MSE).
Algorithmic Workflow Overview
| Algorithm 1: Recurrence Prediction Pipeline with Stacked Ensemble and Threshold Optimization |
| Input: Patient dataset D with features X and labels y |
| Output: Predicted recurrence probabilities and binary classifications |
| 1. Preprocess data: |
| a. Clean missing values |
| b. Encode categorical variables |
| c. Standardize continuous features |
| 2. Split D into training set (80%) and hold-out test set (20%) |
| 3. Train base models on training set: |
| a. Train Random Forest classifier with class_weight = ‘balanced’ |
| b. Train Deep Learning classifier with class-weighted loss |
| c. Train Autoencoder on NO (non-recurrence) cases only |
| 4. Generate meta-features: |
| a. Get RF predicted probability → RF_Prob |
| b. Get DL predicted probability → DL_Prob |
| c. Get AE reconstruction error → AE_MSE |
| 5. Train meta-classifier: |
| a. Concatenate [RF_Prob, DL_Prob, AE_MSE] |
| b. Train Random Forest meta-model on concatenated features |
| 6. Optimize threshold: |
| a. Evaluate performance (F1, Recall, Precision) for thresholds from 0.01 to 0.50 |
| b. Select threshold that maximizes recall with acceptable F1 |
| 7. Predict on hold-out set: |
| a. Apply trained base models to hold-out features |
| b. Compute RF_Prob, DL_Prob, AE_MSE for hold-out cases |
| c. Generate meta-features and predict using meta-classifier |
| d. Apply optimized threshold to convert probabilities into YES/NO predictions |
| Return: Predicted probabilities and binary labels for test set |
2.3.3. Threshold Optimization and Sensitivity Tuning
Rationale for Model Architecture
2.4. Hardware and Software Environment
- Python 3.10 (Google Colab runtime),
- scikit-learn 1.2.2 for machine learning models and evaluation metrics,
- TensorFlow 2.11/Keras for deep learning and autoencoder components,
- XGBoost 1.7.3 for boosted tree modeling,
- pandas 1.5.3, NumPy 1.24, and SciPy 1.10 for data manipulation and analysis,
- matplotlib 3.7 and seaborn 0.12.2 for data visualization,
- ELI5 0.13.0 for local interpretability,
- joblib for model persistence and reproducibility.
Ethics Statement
3. Results
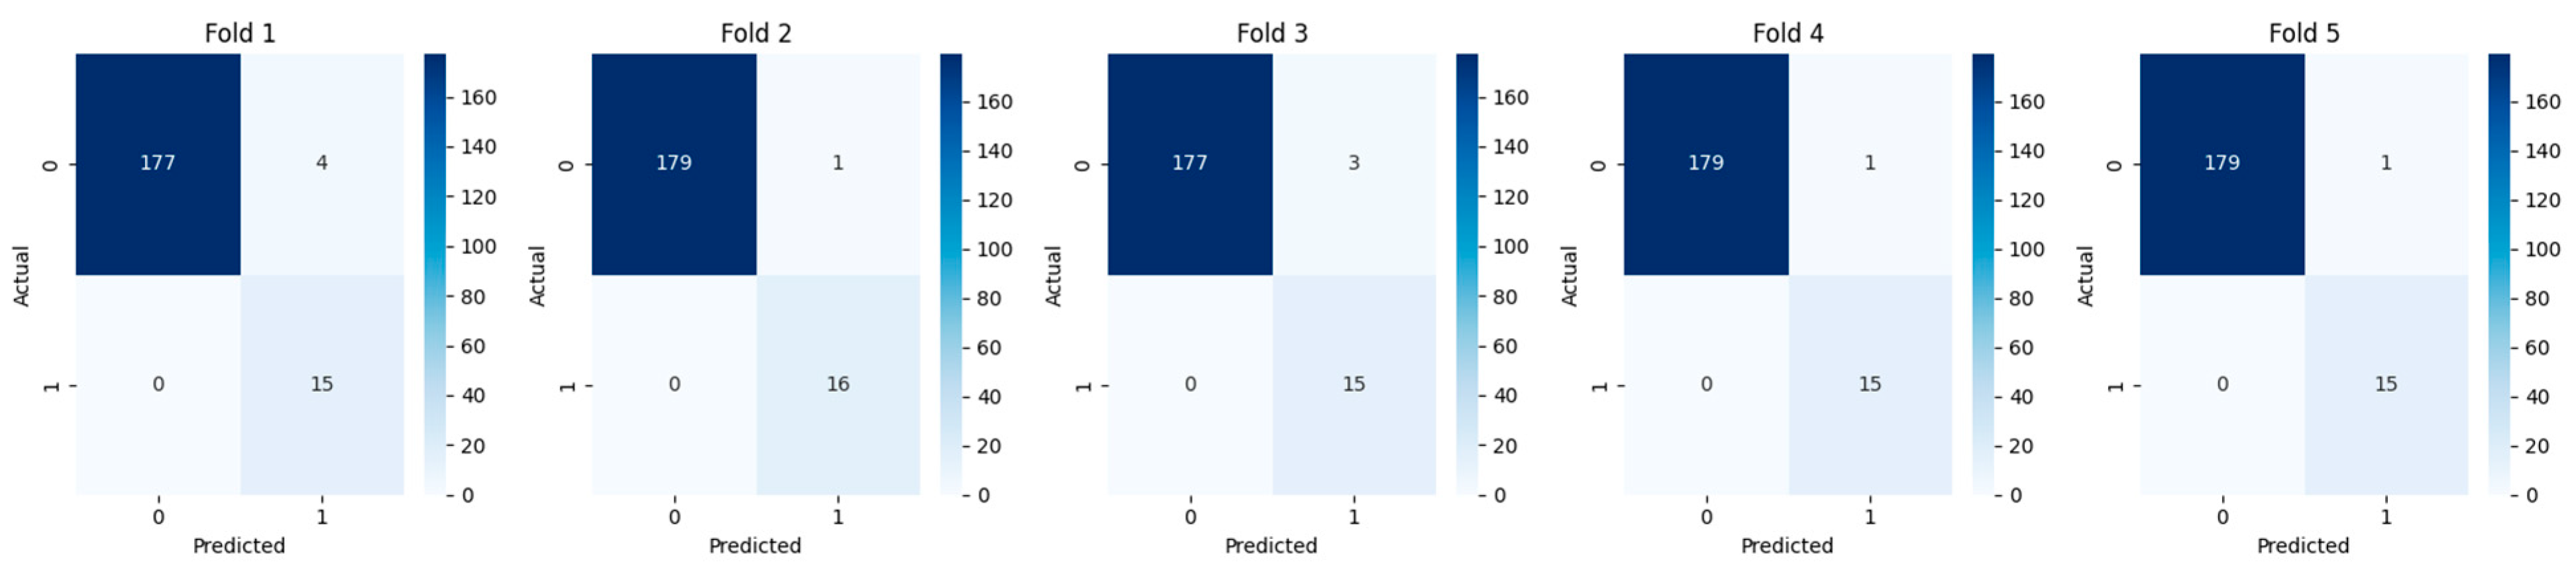
3.1. Cross-Validation and Fold-Wise Performance
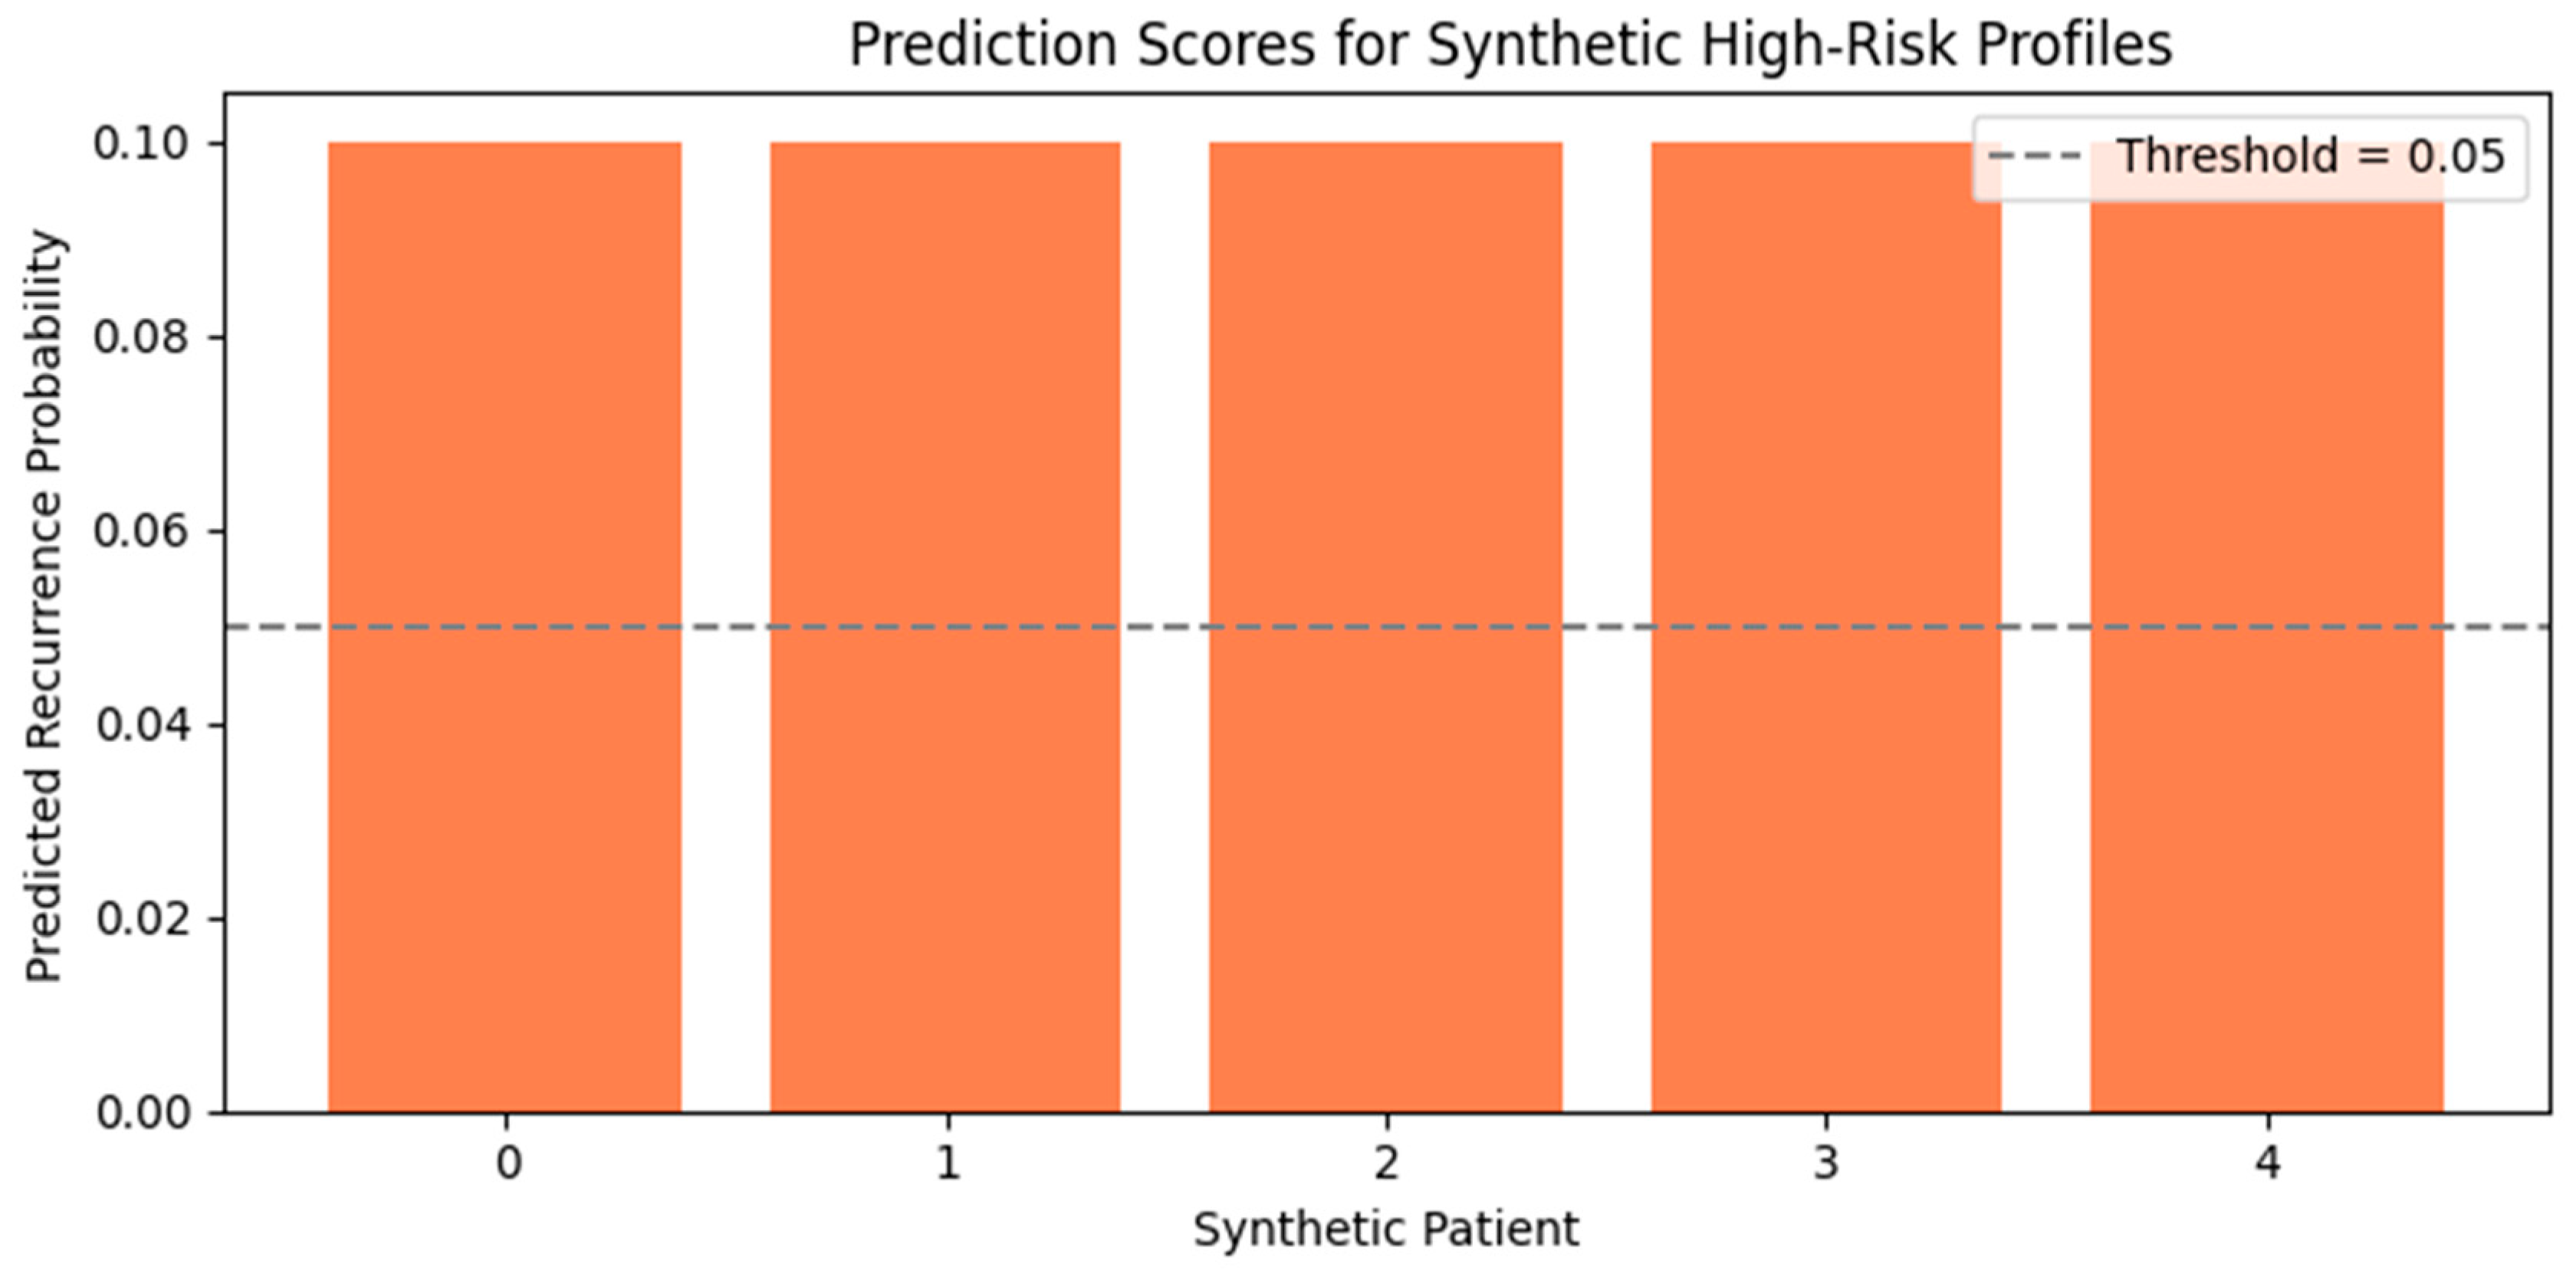
3.2. Evaluation on Real and Synthetic High-Risk Profiles
3.2.1. Evaluation on Synthetic Profiles
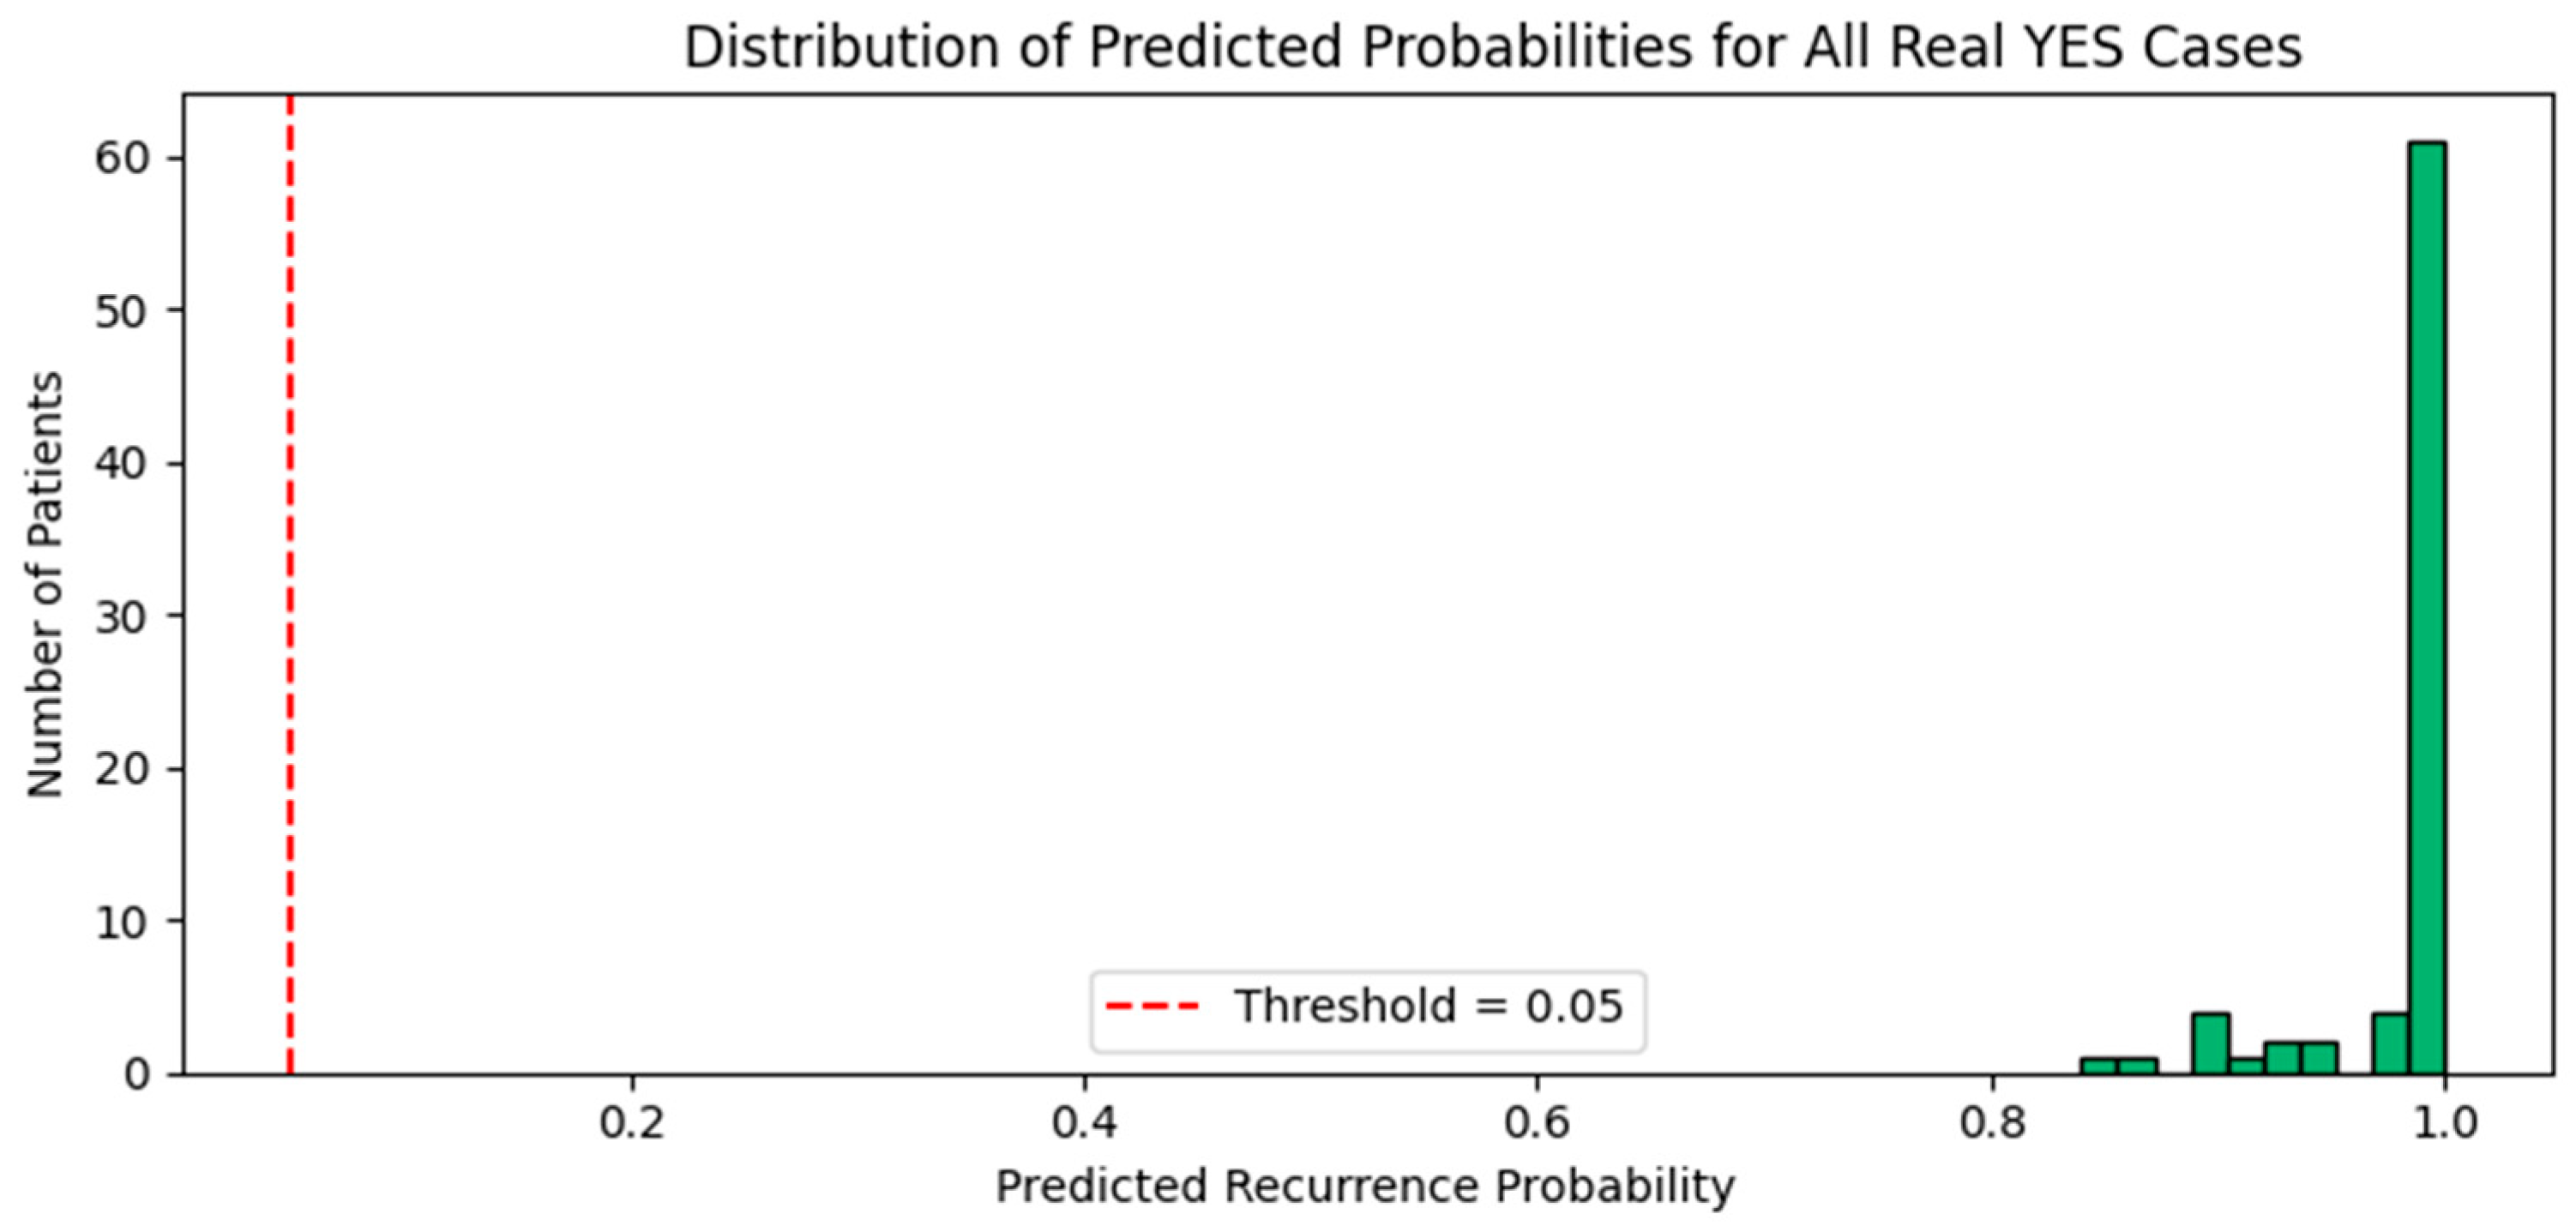
3.2.2. Evaluation on Real YES Cases
3.2.3. Comorbidity-Specific Signal
3.3. Feature Importance Insights
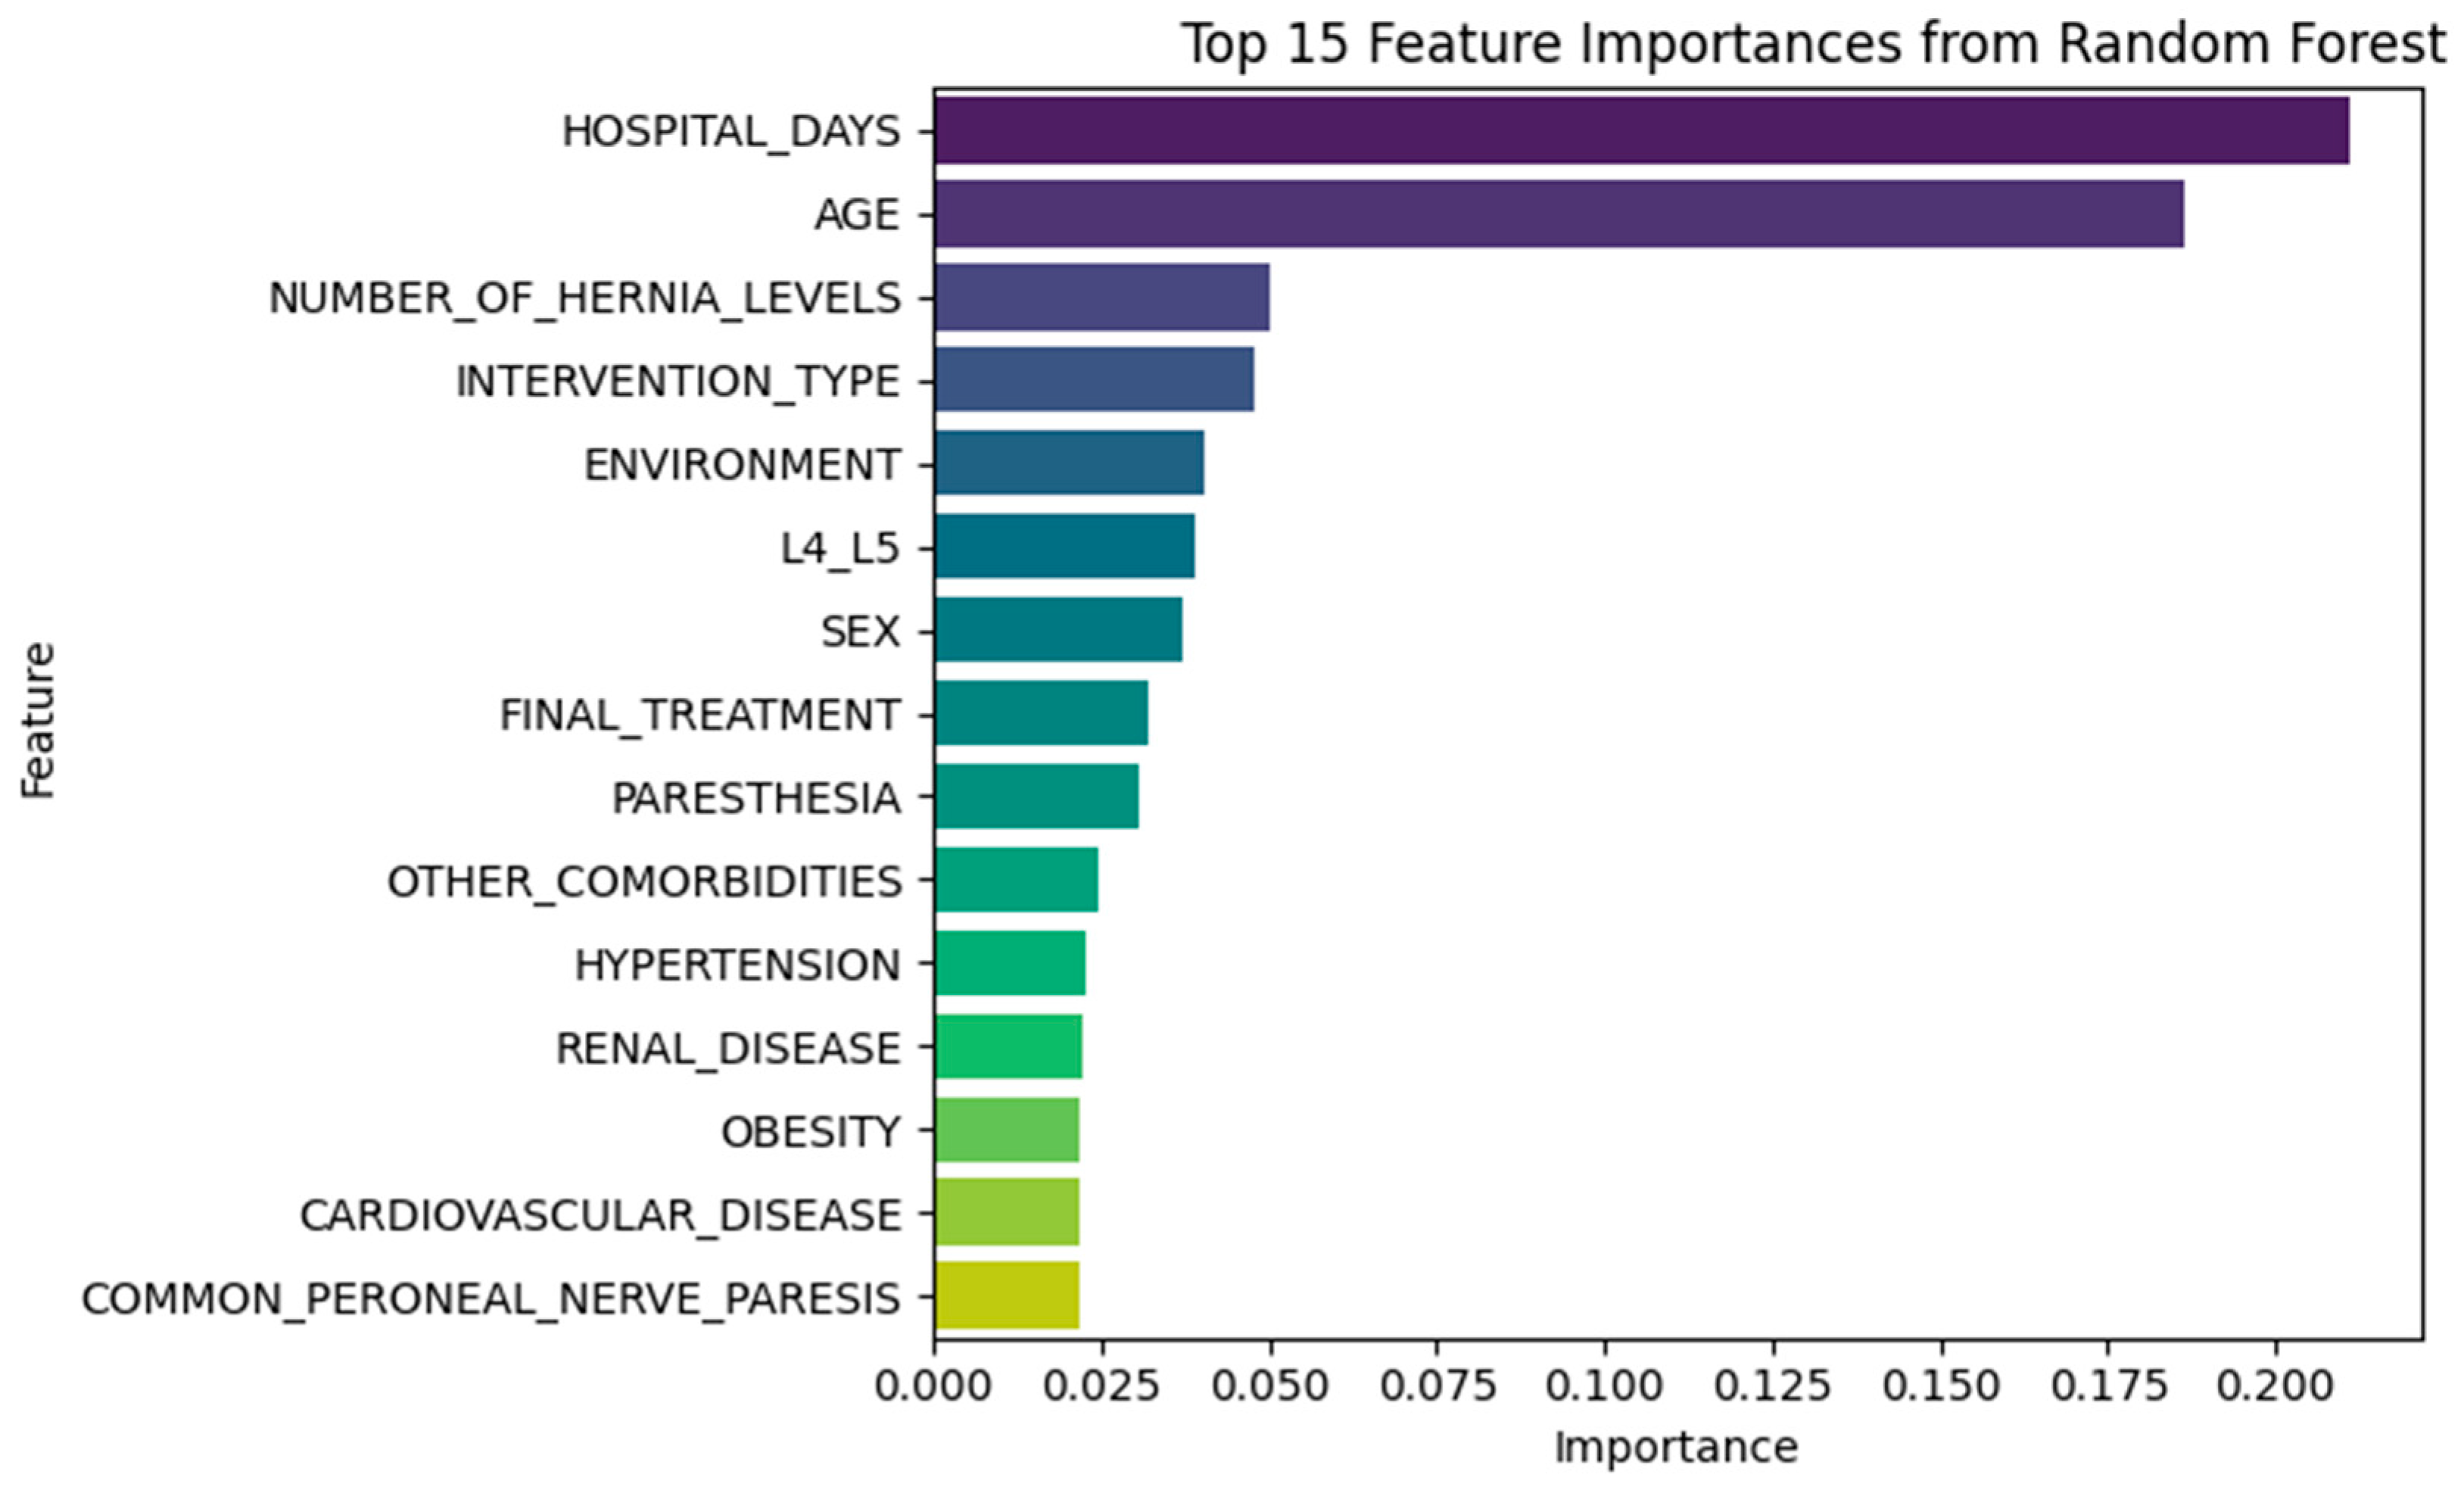
3.3.1. Random Forest Insights
- NUMBER_OF_HERNIA_LEVELS
- INTERVENTION_TYPE
- ENVIRONMENT
- L4_L5
- SEX
3.3.2. XGBoost Insights
- NUMBER_OF_HERNIA_LEVELS
- TUMORAL_DISEASE
- OTHER_COMORBIDITIES
- L5_S1 herniation
- PARESTHESIA
- POSTOP_CONTROL_CODED
- DIABETES
3.4. Feature Space Visualization
3.5. Model Interpretability via Permutation and Local Explanation
3.5.1. Global Insight via Permutation Importance
3.5.2. Correlation Between Model Signals
3.5.3. Local Explanation via Decision Path Tracing
- RF_Prob: +0.252
- DL_Prob: +0.244
- AE_MSE: +0.007
- <BIAS>: +0.497
ROC AUC Performance
3.6. Simulated External Validation
Confusion Matrices for Base Models
4. Discussion
4.1. Model Performance and Innovation
4.2. Interpretability and Meta-Feature Insights
4.3. Feature Separability and Clinical Signal
4.4. Practical Implications
4.5. Clinical Relevance and Deployment Potential
- Prospective validation in new patient cohorts;
- Robust external generalizability testing;
- Integration with clinician-facing tools that provide interpretability and allow for feedback.
5. Conclusions
5.1. Dataset Scope and Class Imbalance
5.2. External Evaluation and Generalization Gap
5.3. Interpretability and Model Transparency
5.4. Temporal and Causal Simplifications
5.5. Outcome Labeling and Clinical Granularity
5.6. Summary of Findings
5.7. Future Work
- External Validation: Test the model on independent cohorts from different institutions or countries to assess generalizability across clinical workflows and patient populations.
- Time-Aware Modeling: Incorporate longitudinal or sequential features (e.g., recovery curves, follow-up intervals) to better capture how recurrence risk evolves over time. Given the inherently temporal nature of recurrence, incorporating longitudinal data—such as postoperative symptom trajectories, recovery curves, and follow-up intervals—is crucial for future models. This approach would substantially enhance clinical fidelity, allowing better causal interpretation and real-time application.
- Rare-Event Calibration: Investigate advanced calibration techniques—including domain adaptation, class-conditional modeling, and meta-learning—to improve model robustness in imbalanced settings.
- Explainability-First Design: Move beyond post-hoc explanation toward embedding interpretability (e.g., SHAP, LIME, or causal frameworks) directly into the model architecture, to support clinician trust and regulatory readiness. Given the complexity introduced by deep learning and autoencoder models, future efforts should explicitly prioritize explainability-first architectures. Integrating frameworks like SHAP or LIME directly into the modeling pipeline, rather than relying on post-hoc interpretation, is essential to facilitate clinical adoption and regulatory compliance.
- Expanded Outcome Modeling: Transition from binary classification to more nuanced outcome prediction, including recurrence subtype, timing, and functional recovery trajectories. Future research should expand beyond binary recurrence classification to include multi-class models that incorporate recurrence type, timing, severity, and response to subsequent interventions. This would significantly enhance clinical applicability and patient-specific guidance.
- Clinician-Facing Deployment: Translate the pipeline into an interactive, explainable tool for use in real-time triage, shared decision-making, and postoperative follow-up planning.
5.8. Final Reflection
Author Contributions
Funding
Institutional Review Board Statement
Informed Consent Statement
Data Availability Statement
Conflicts of Interest
References
- Jordan, J.; Konstantinou, K.; O’Dowd, J. Herniated lumbar disc. BMJ Clin. Evid. 2009, 2009, 1118. [Google Scholar] [PubMed] [PubMed Central]
- Fjeld, O.R.; Grøvle, L.; Helgeland, J.; Småstuen, M.C.; Solberg, T.K.; Zwart, J.A.; Grotle, M. Complications, reoperations, readmissions, and length of hospital stay in 34 639 surgical cases of lumbardisc herniation. Bone Joint J. 2019, 101, 470–477. [Google Scholar] [CrossRef] [PubMed]
- Murray, C.J.; Barber, R.M.; Foreman, K.J.; Ozgoren, A.A.; Abd-Allah, S.F.; Abera, S.F.; Aboyans, V.; Abraham, J.P.; Abubakar, I.; Abu-Raddad, L.J.; et al. Global, regional, and national disability-adjustedlife years (DALYs) for 306 diseases and injuries and healthy lifeexpectancy (HALE) for 188 countries, 1990–2013: Quantifyingthe epidemiological transition. Lancet 2015, 386, 2145–2191. [Google Scholar] [CrossRef] [PubMed]
- Kim, J.-H.; van Rijn, R.M.; van Tulder, M.W.; Koes, B.W.; de Boer, M.R.; Ginai, A.Z.; Ostelo, R.W.G.J.; van der Windt, D.A.M.W.; Verhagen, A.P. Diagnostic accuracy of diagnostic imaging for lumbar disc herniation in adults with low back pain or sciatica is unknown; a systematic review. Chiropr. Man. Ther. 2018, 26. [Google Scholar] [CrossRef]
- Shimia, M.; Babaei-Ghazani, A.; Sadat, B.; Habibi, B.; Habibzadeh, A.; Be, S. Risk factors of recurrent lumbar disk herniation. Asian J. Neurosurg. 2013, 8, 93–96. [Google Scholar] [CrossRef]
- Woudneh, A.F. Understanding the dynamics of post-surgical recovery and its predictors in resource-limited settings: A prospective cohort study. BMC Surg. 2025, 25, 44. [Google Scholar] [CrossRef]
- Wellington, I.J.; Karsmarski, O.P.; Murphy, K.V.; Shuman, M.E.; Ng, M.K.; Antonacci, C.L. The use of machine learning for predicting candidates for outpatient spine surgery: A review. J. Spine Surg. 2023, 9, 323–330. [Google Scholar] [CrossRef]
- Wang, P.; Zhang, Z.; Xie, Z.; Liu, L.; Ren, G.; Guo, Z.; Xu, L.; Yin, X.; Hu, Y.; Wang, Y.; et al. Natural Language Processing-Driven Artificial Intelligence Models for the Diagnosis of Lumbar Disc Herniation with L5 and S1 Radiculopathy: A Preliminary Evaluation. World Neurosurg. 2024, 189, e300–e309. [Google Scholar] [CrossRef]
- Ren, G.; Liu, L.; Zhang, P.; Xie, Z.; Wang, P.; Zhang, W.; Wang, H.; Shen, M.; Deng, L.; Tao, Y.; et al. Machine Learning Predicts Recurrent Lumbar Disc Herniation Following Percutaneous Endoscopic Lumbar Discectomy. Glob. Spine J. 2022, 14, 146–152. [Google Scholar] [CrossRef]
- Swartz, K.R.; Trost, G.R. Recurrent lumbar disc herniation. Neurosurg. Focus 2003, 15, 1–4. [Google Scholar] [CrossRef]
- Zileli, M.; Oertel, J.; Sharif, S.; Zygourakis, C. Lumbar disc herniation: Prevention and treatment of recurrence: WFNS spine committee recommendations. World Neurosurg. X 2024, 22, 100275. [Google Scholar] [CrossRef]
- Brooks, M.; Dower, A.; Jalil, M.F.A.; Kohan, S. Radiological predictors of recurrent lumbar disc herniation: A systematic review and meta-analysis. J. Neurosurg. Spine 2020, 34, 481–491. [Google Scholar] [CrossRef] [PubMed]
- Siccoli, A.; Staartjes, V.E.; Klukowska, A.M.; Muizelaar, J.P.; Schröder, M.L. Overweight and smoking promote recurrent lumbar disk herniation after discectomy. Eur. Spine J. 2022, 31, 604–613. [Google Scholar] [CrossRef]
- Fotakopoulos, G.; Makris, D.; Kotlia, P.; Tzerefos, C.; Fountas, K. Recurrence Is Associated With Body Mass Index in Patients Undergoing a Single-Level Lumbar Disc Herniation Surgery. J. Clin. Med. Res. 2018, 10, 486–492. [Google Scholar] [CrossRef] [PubMed]
- Huang, W.; Han, Z.; Liu, J.; Yu, L.; Yu, X. Risk Factors for Recurrent Lumbar Disc Herniation: A Systematic Review and Meta-Analysis. Medicine 2016, 95, e2378. [Google Scholar] [CrossRef]
- Li, Y.; Wang, B.; Li, H.; Chang, X.; Wu, Y.; Hu, Z.; Liu, C.; Gao, X.; Zhang, Y.; Liu, H.; et al. Adjuvant surgical decision-making system for lumbar intervertebral disc herniation after percutaneous endoscopic lumber discectomy: A retrospective nonlinear multiple logistic regression prediction model based on a large sample. Spine J. 2021, 21, 2035–2048. [Google Scholar] [CrossRef]
- Benítez-Andrades, J.A.; Prada-García, C.; Ordás-Reyes, N.; Blanco, M.E.; Merayo, A.; Serrano-García, A. Enhanced prediction of spine surgery outcomes using advanced machine learning techniques and oversampling methods. Heal. Inf. Sci. Syst. 2025, 13, 24. [Google Scholar] [CrossRef]
- Tragaris, T.; Benetos, I.S.; Vlamis, J.; Pneumaticos, S.G. Machine Learning Applications in Spine Surgery. Cureus 2023, 15, e48078. [Google Scholar] [CrossRef]
- Wilson, C.A.; Roffey, D.M.; Chow, D.; Alkherayf, F.; Wai, E.K. A systematic review of preoperative predictors for postoperative clinical outcomes following lumbar discectomy. Spine J. 2016, 16, 1413–1422. [Google Scholar] [CrossRef]
- Schönnagel, L.; Caffard, T.; Vu-Han, T.-L.; Zhu, J.; Nathoo, I.; Finos, K.; Camino-Willhuber, G.; Tani, S.; Guven, A.E.; Haffer, H.; et al. Predicting postoperative outcomes in lumbar spinal fusion: Development of a machine learning model. Spine J. 2023, 24, 239–249. [Google Scholar] [CrossRef]
- Abel, F.; Garcia, E.; Andreeva, V.; Nikolaev, N.S.; Kolisnyk, S.; Sarbaev, R.; Novikov, I.; Kozinchenko, E.; Kim, J.; Rusakov, A.; et al. An Artificial Intelligence-Based Support Tool for Lumbar Spinal Stenosis Diagnosis from Self-Reported History Questionnaire. World Neurosurg. 2024, 181, e953–e962. [Google Scholar] [CrossRef]
- Fan, Z.; Wu, T.; Wang, Y.; Jin, Z.; Wang, T.; Liu, D. Deep-Learning-Based Radiomics to Predict Surgical Risk Factors for Lumbar Disc Herniation in Young Patients: A Multicenter Study. J. Multidiscip. Heal. 2024, 17, 5831–5851. [Google Scholar] [CrossRef] [PubMed]
- Wirries, A.; Geiger, F.; Hammad, A.; Oberkircher, L.; Blümcke, I.; Jabari, S. Artificial intelligence facilitates decision-making in the treatment of lumbar disc herniations. Eur. Spine J. 2021, 30, 2176–2184. [Google Scholar] [CrossRef]
- Ghavidel, A.; Pazos, P. Machine learning (ML) techniques to predict breast cancer in imbalanced datasets: A systematic review. J. Cancer Surviv. 2025, 19, 270–294. [Google Scholar] [CrossRef] [PubMed]
- Roy, P.; Srijon, F.M.S.; Bhowmik, P.; Chatterjee, J.M. An explainable ensemble approach for advanced brain tumor classification applying Dual-GAN mechanism and feature extraction techniques over highly imbalanced data. PLoS ONE 2024, 19, e0310748. [Google Scholar] [CrossRef]
- Shan, Z.-M.; Ren, X.-S.; Shi, H.; Zheng, S.-J.; Zhang, C.; Zhuang, S.-Y.; Wu, X.-T.; Xie, X.-H. Machine Learning Prediction Model and Risk Factor Analysis of Reoperation in Recurrent Lumbar Disc Herniation Patients After Percutaneous Endoscopic Lumbar Discectomy. Glob. Spine J. 2024, 14, 2240–2251. [Google Scholar] [CrossRef]
- Harada, G.K.; Siyaji, Z.K.; Mallow, G.M.; Hornung, A.L.; Hassan, F.; Basques, B.A.; Mohammed, H.A.; Sayari, A.J.; Samartzis, D.; An, H.S. Artificial intelligence predicts disk re-herniation following lumbar microdiscectomy: Development of the “RAD” risk profile. Eur. Spine J. 2021, 30, 2167–2175. [Google Scholar] [CrossRef]
- Compte, R.; Smith, I.G.; Isaac, A.; Danckert, N.; McSweeney, T.; Liantis, P.; Williams, F.M.K. Are current machine learning applications comparable to radiologist classification of degenerate and herniated discs and Modic change? A systematic review and meta-analysis. Eur. Spine J. 2023, 32, 3764–3787. [Google Scholar] [CrossRef]
- Wang, S.; Jiang, Z.; Yang, H.; Li, X.; Yang, Z.; Fan, Y. Automatic Segmentation of Lumbar Spine MRI Images Based on Improved Attention U-Net. Comput. Intell. Neurosci. 2022, 2022, 425947. [Google Scholar] [CrossRef]
- Marinescu, M.A.; Guliciuc, M.; Maier, A.C.; Olaru, I.; Bogdan-Goroftei, R.-E.; Barbu, R.E.; Mihailov, R.; Lutenco, V.; Firescu, D. Diagnostic and therapeutic particularities of a case admitted for low back pain and sciatica. Electron. J. Gen. Med. 2025, 22, em630. [Google Scholar] [CrossRef]
- Duceac (Covrig), M.; Eva, L.; Dabija, M.G.; Stoica, M.G.; Druguș, D.; Duceac, L.D.; Voinescu, D.C. Does oral health affect your bone loss? The link between periodontitis disease and osteoporosis—An epidemiological approach to lumbar disc herniation in a neurosurgery hospital in the northeastern region of Romania. Rom. J. Oral Rehab. 2023, 14, 44–53. [Google Scholar]
- Duceac (Covrig), M.; Gutu, C.; Eva, L.; Dabija, M.G.; Calin, G.; Duceac, L.D.; Ciupilan, C.; Voinescu, D.C. Retrospective study of lumbar disc herniation in a hospital in North-Eastern Romania. Balneo PRM Res. J. 2024, 15, 666. [Google Scholar] [CrossRef]
- Eva, L.; Munteanu, M.-R.; (Covrig), M.D.; Olaru, I.; Marcu, C.; Dabija, M.-G. The Evolution of Microscope (Aeos) Exoscope in the World of Artificial Intelligence and its Application in Lumbar Disc Herniations Surgery: A Comprehensive Study from Historical Perspective to Current Practices in Romania at the Hospital “Prof.Dr.N.Oblu”. Rom. J. Oral Rehabil. 2024, 16, 402–412. [Google Scholar] [CrossRef]
- ClinicalTrials.gov. The Prediction of Recurrence Lumbar Disc Herniation at L5-S1 Level Through Machine Learning Models. Identifier: NCT06254585. Available online: https://ctv.veeva.com/study/the-prediction-of-recurrence-lumbar-disc-herniation-at-l5-s1-level-through-machine-learning-models-b (accessed on 20 April 2025).
- Lin, A.; Zhang, H.; Wang, Y.; Cui, Q.; Zhu, K.; Zhou, D.; Han, S.; Meng, S.; Han, J.; Li, L.; et al. Radiomics based on MRI to predict recurrent L4-5 disc herniation after percutaneous endoscopic lumbar discectomy. BMC Med. Imaging 2024, 24, 1–10. [Google Scholar] [CrossRef]
- Žlahtič, B.; Završnik, J.; Vošner, H.B.; Kokol, P. Transferring Black-Box Decision Making to a White-Box Model. Electronics 2024, 13, 1895. [Google Scholar] [CrossRef]


| Variable | Type | Distribution Highlights | Key Notes/Clinical Insight |
|---|---|---|---|
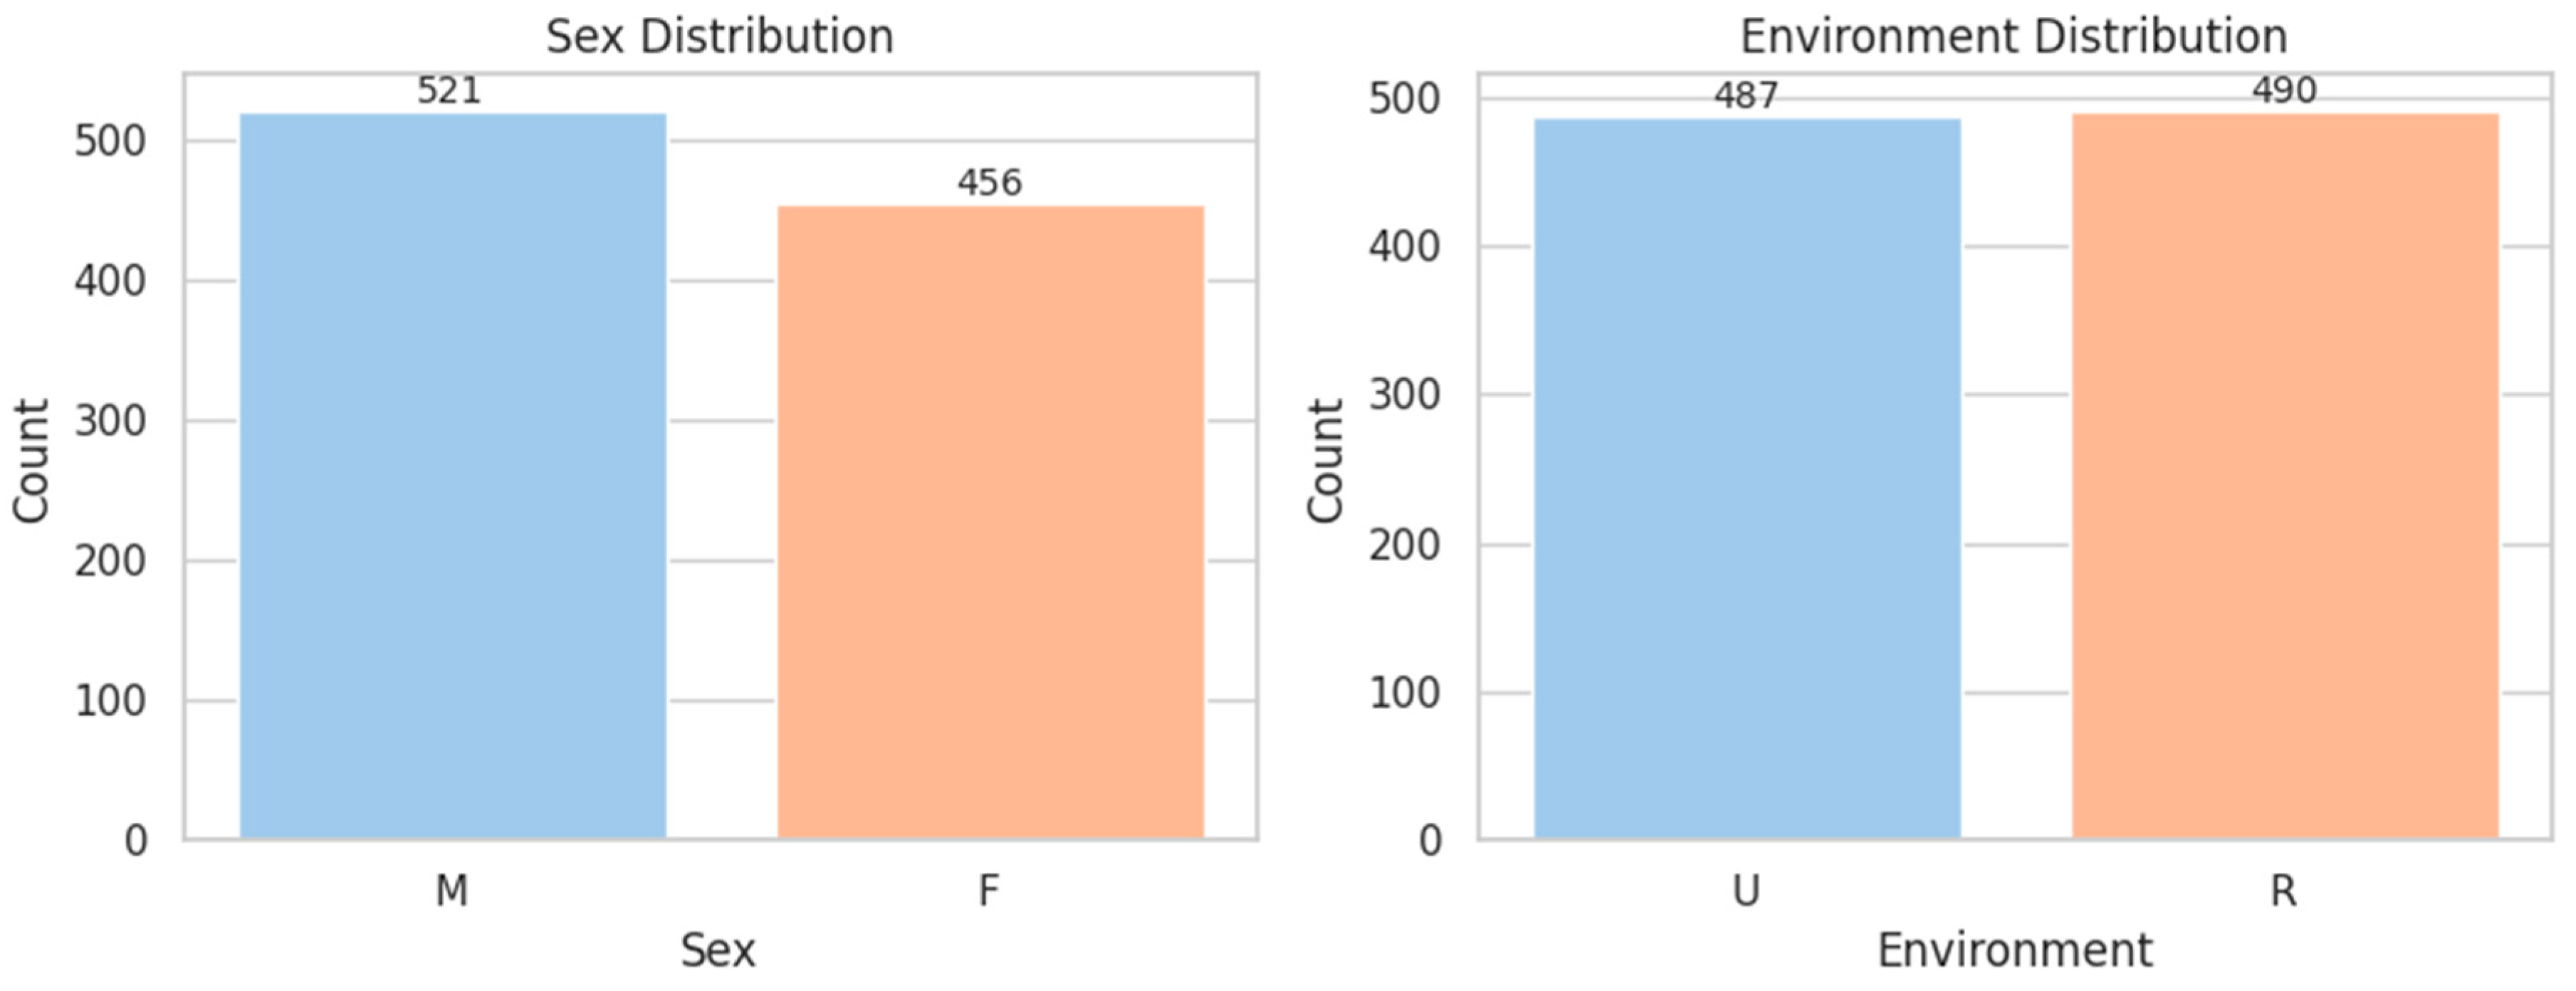
| SEX | Binary | M: 53.3%, F: 46.7% | Balanced dataset for sex-based analysis |
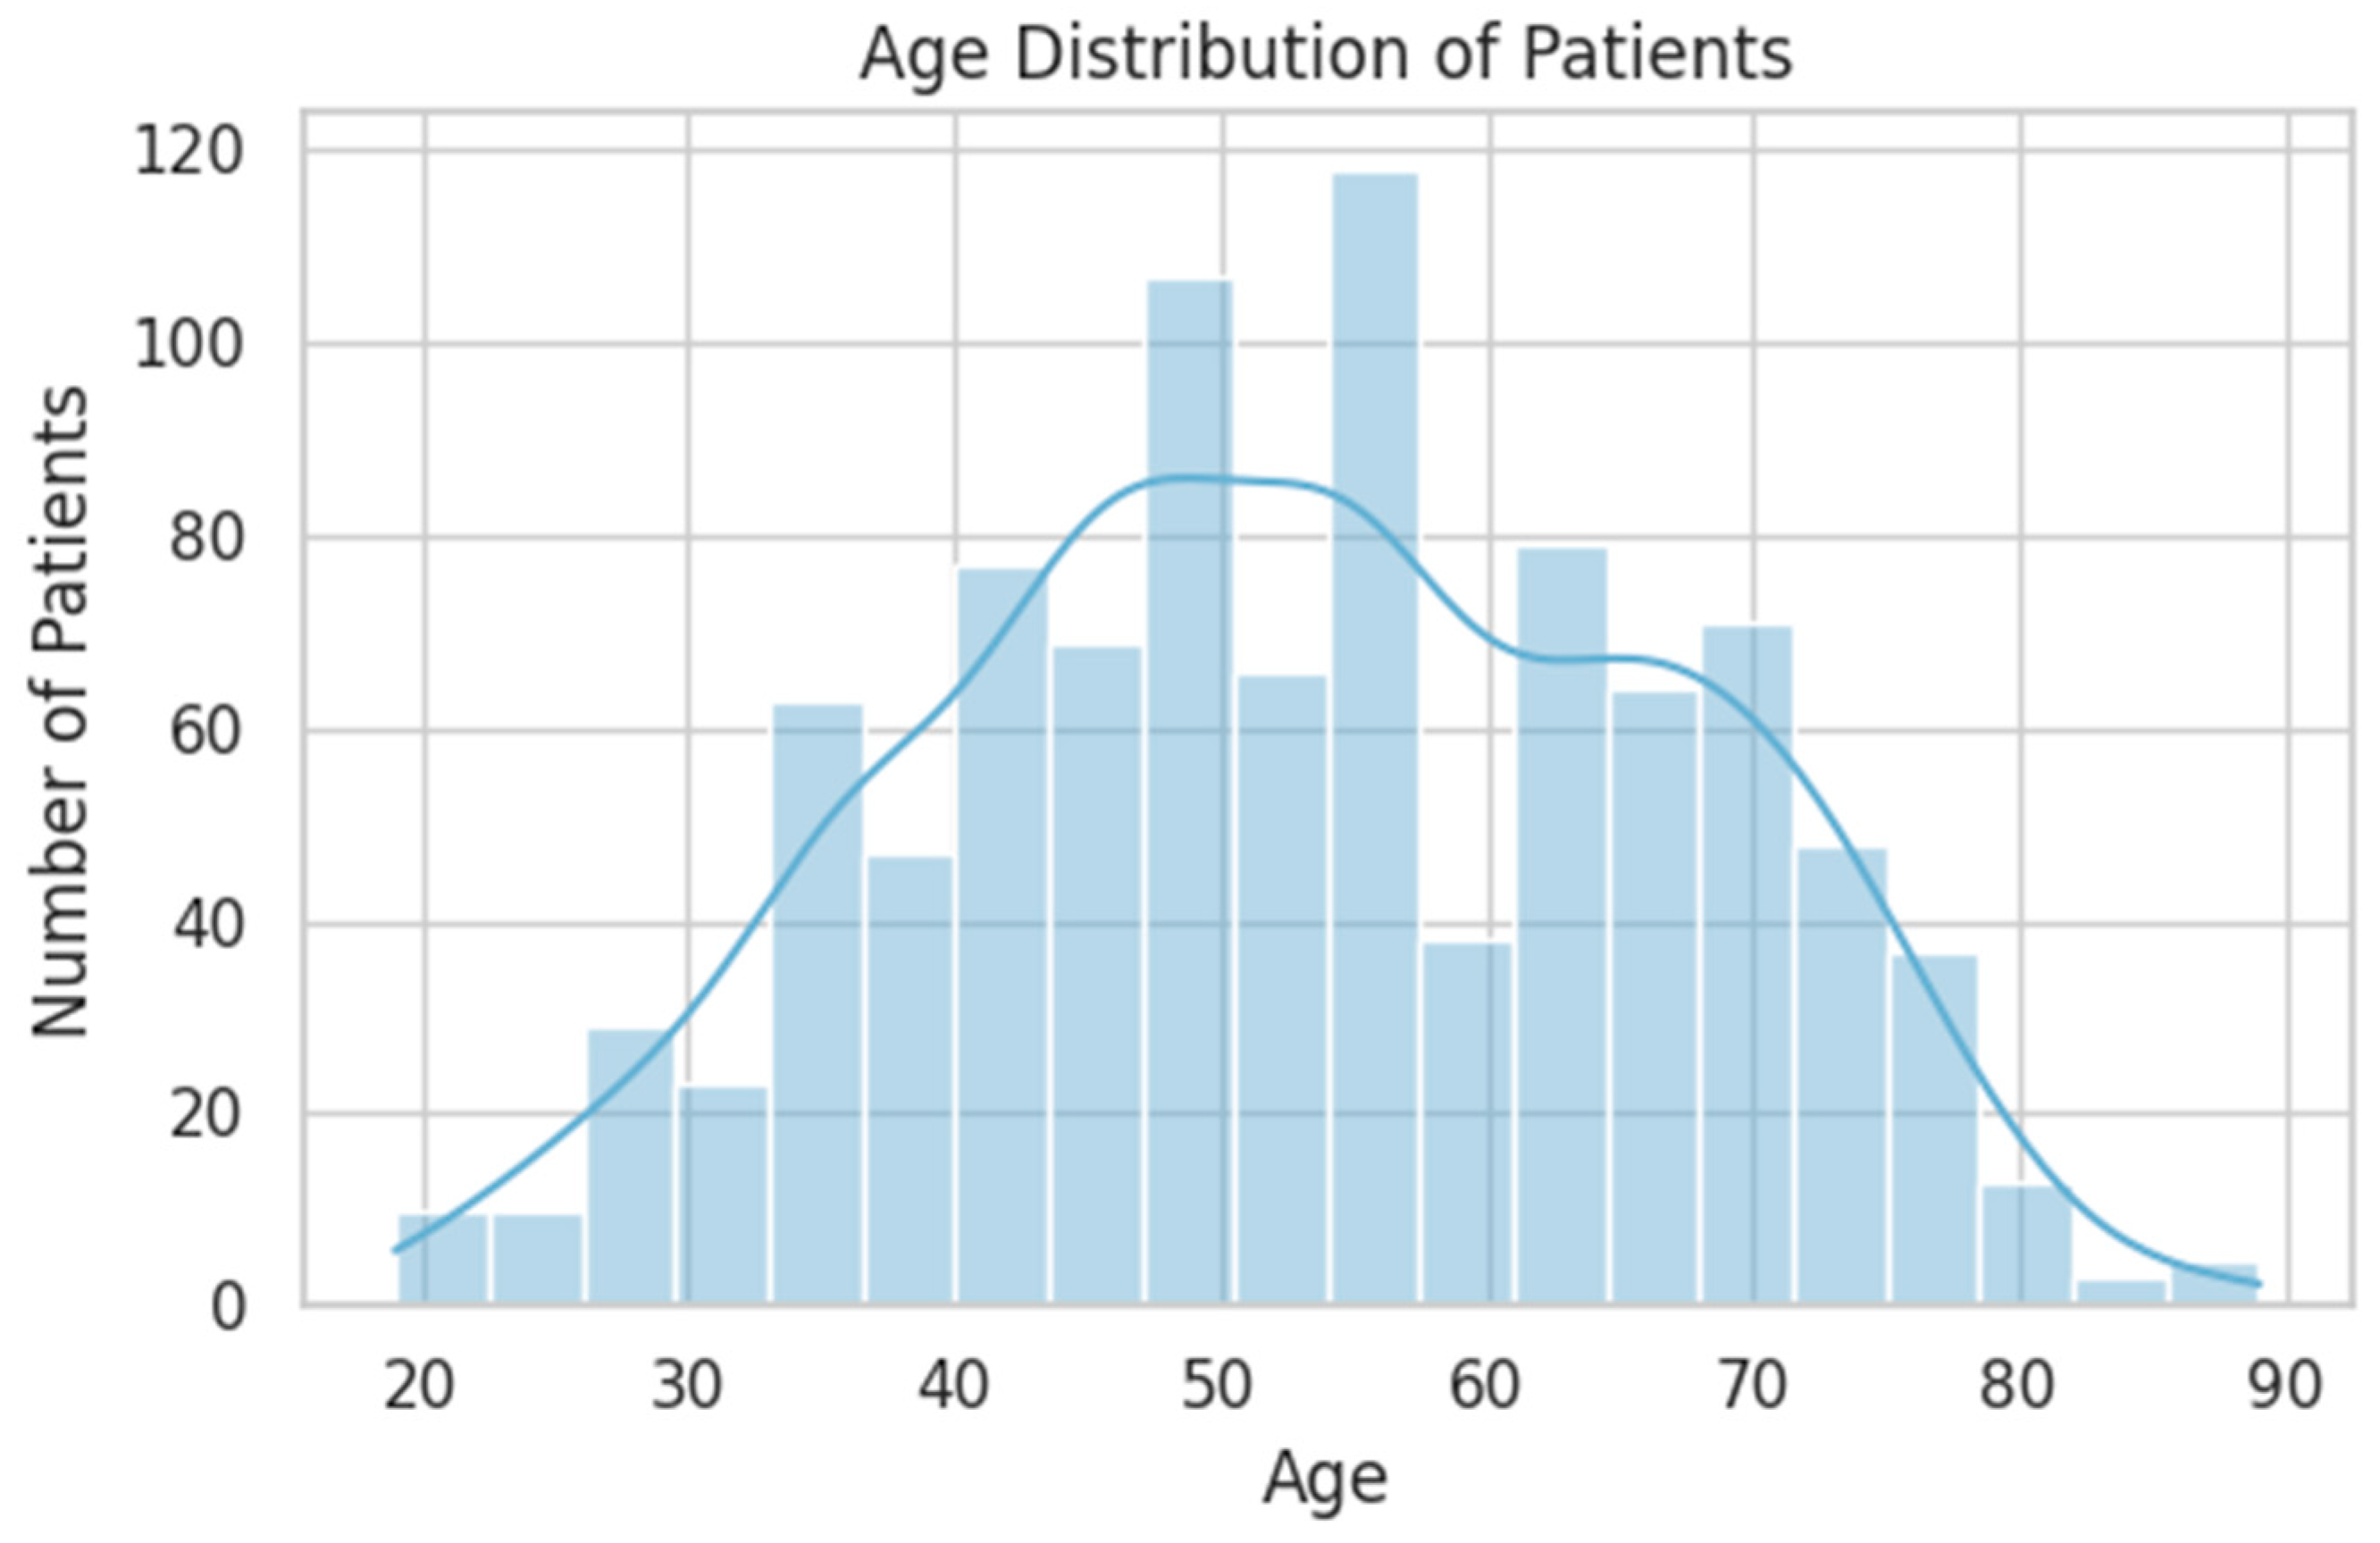
| AGE | Continuous | Mean: 53 years (range: 19–89) | Peak incidence between 40–65 years |
| ENVIRONMENT | Binary | Rural: 50.1%, Urban: 49.9% | Evenly distributed; useful for social determinant modeling |
| HOSPITAL_DAYS | Continuous | Mean: 8.4 days | Slight right skew; outliers may reflect complications |
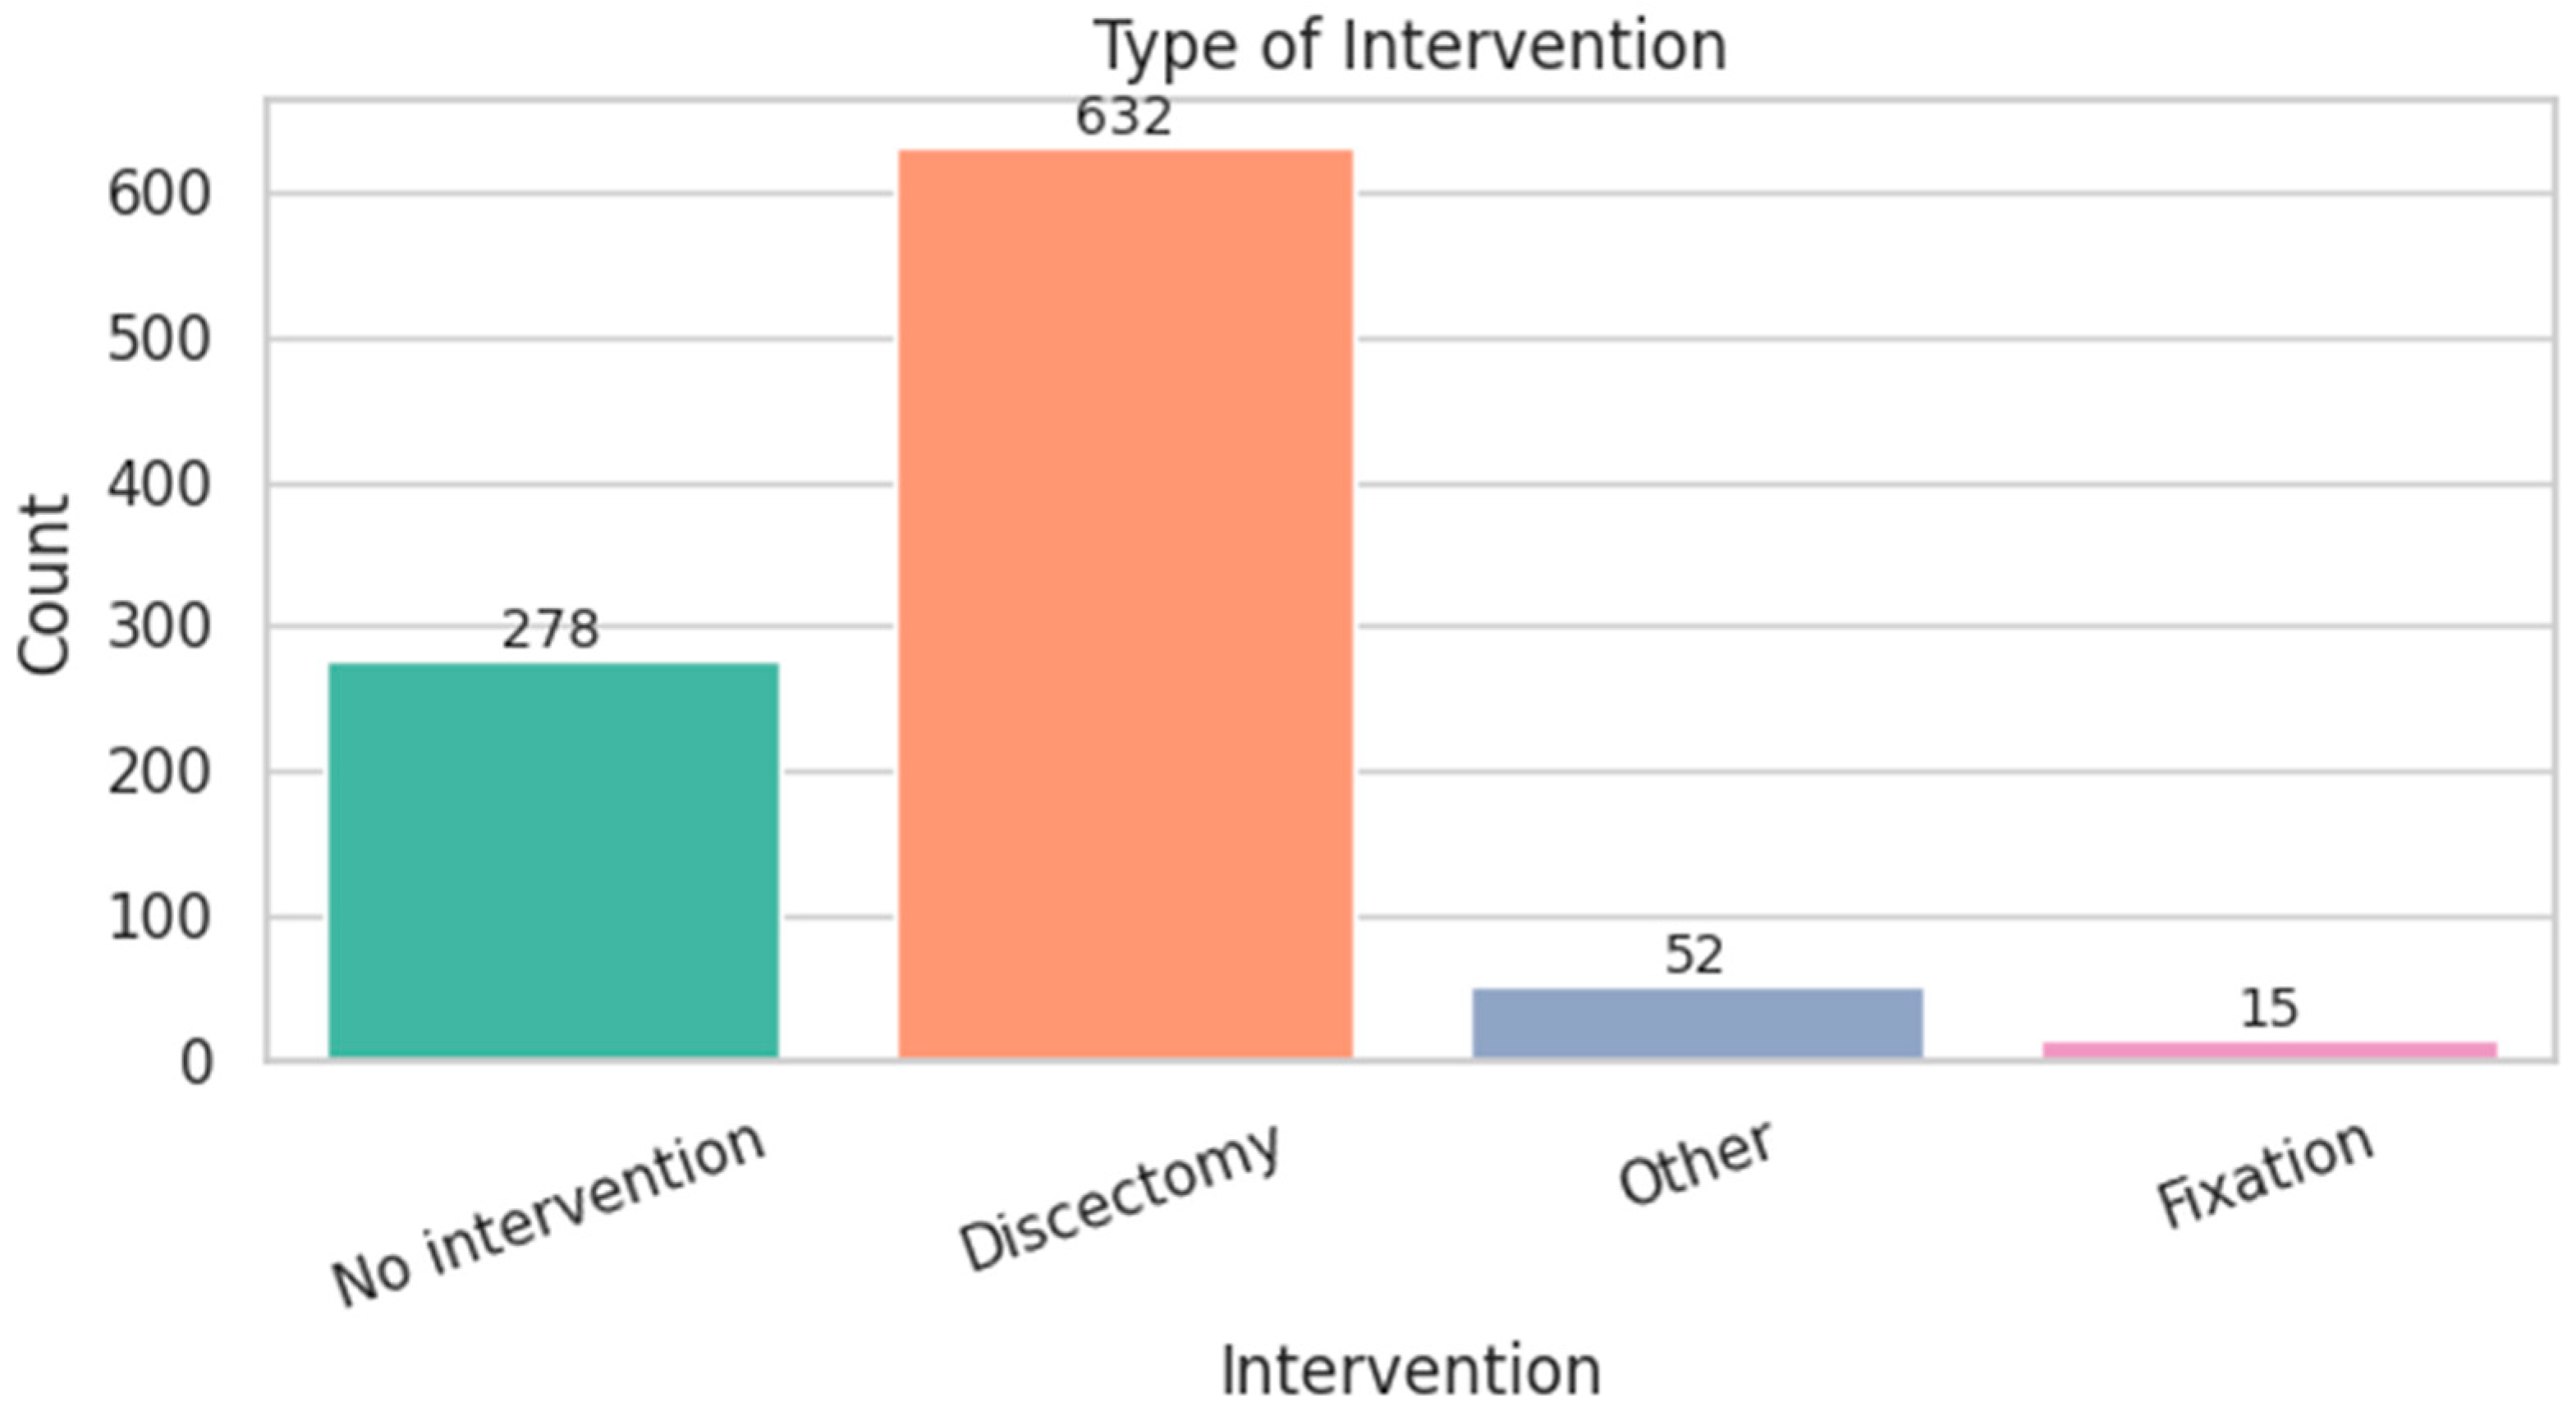
| INTERVENTION_TYPE | Categorical | Discectomy: 64.7%, No surgery: 28.5% | Majority underwent surgery |
| FINAL_TREATMENT | Ordinal | Operated + Rehab: 56.7%, Non-op + Rehab: 30.9% | High rehab adherence post-treatment |
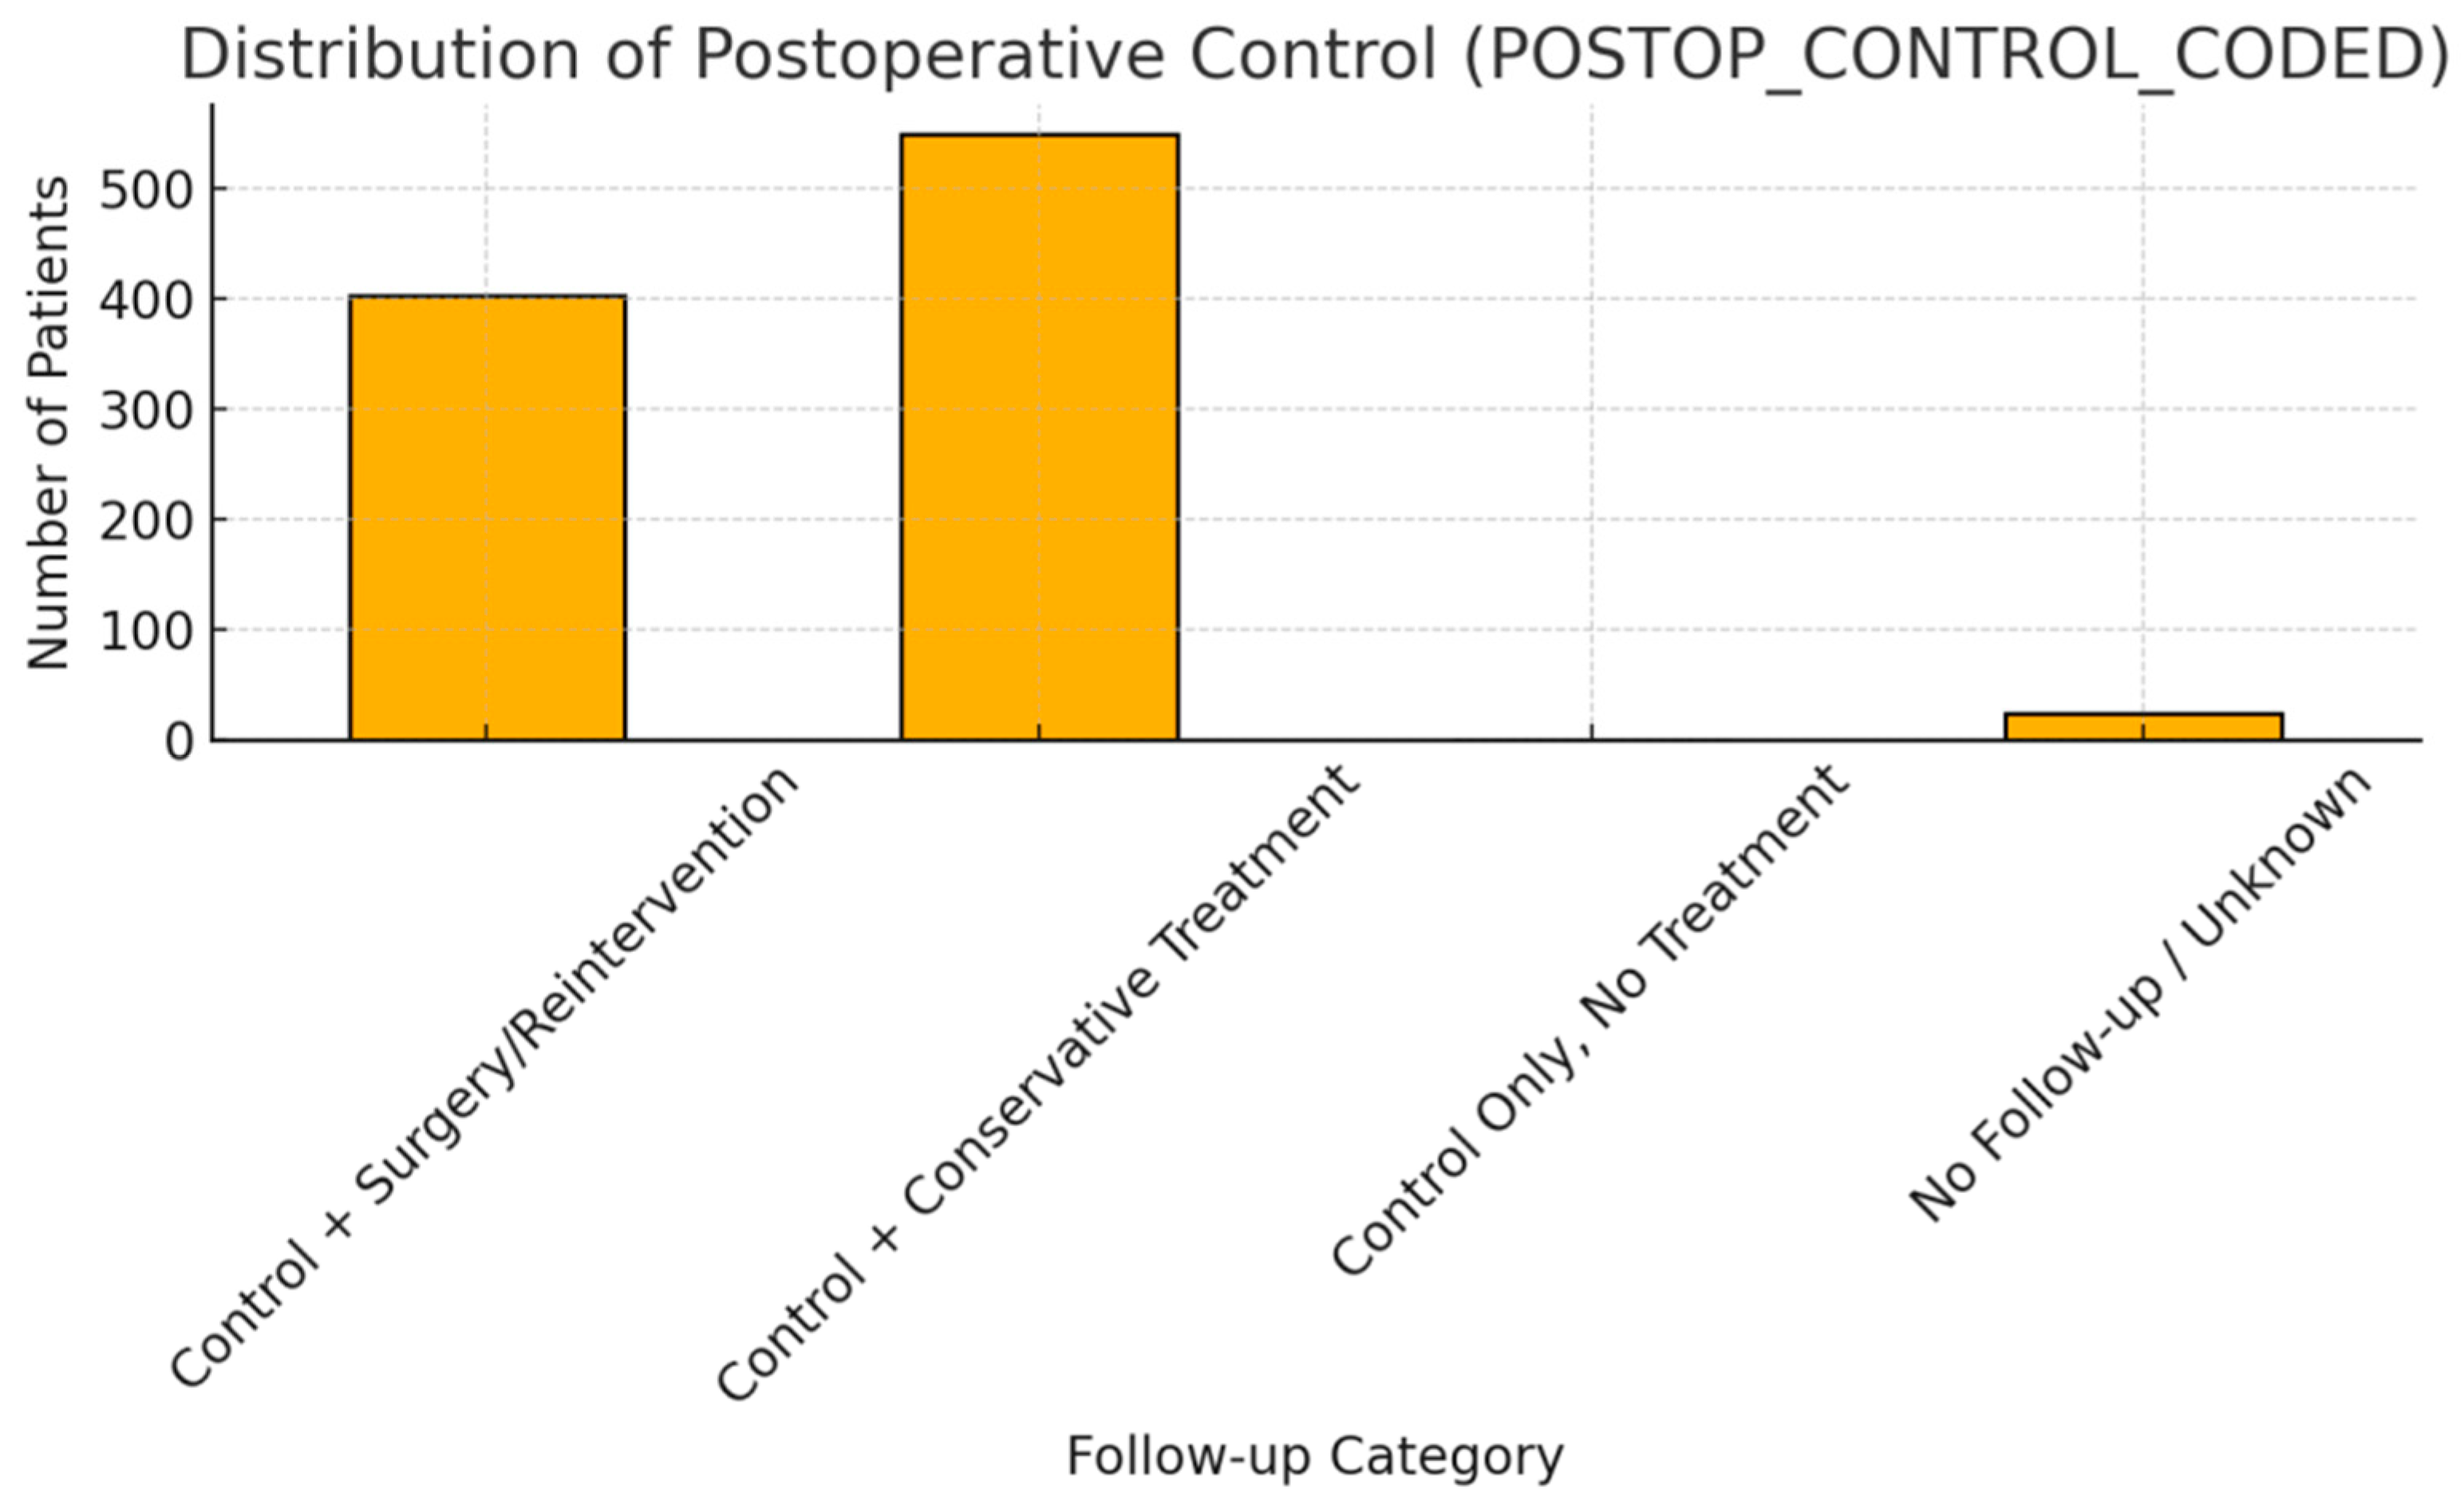
| POSTOP_CONTROL_ CODED | Ordinal | Conservative: 56.2%, Surgery: 41.2% | Reintervention rate relatively high |
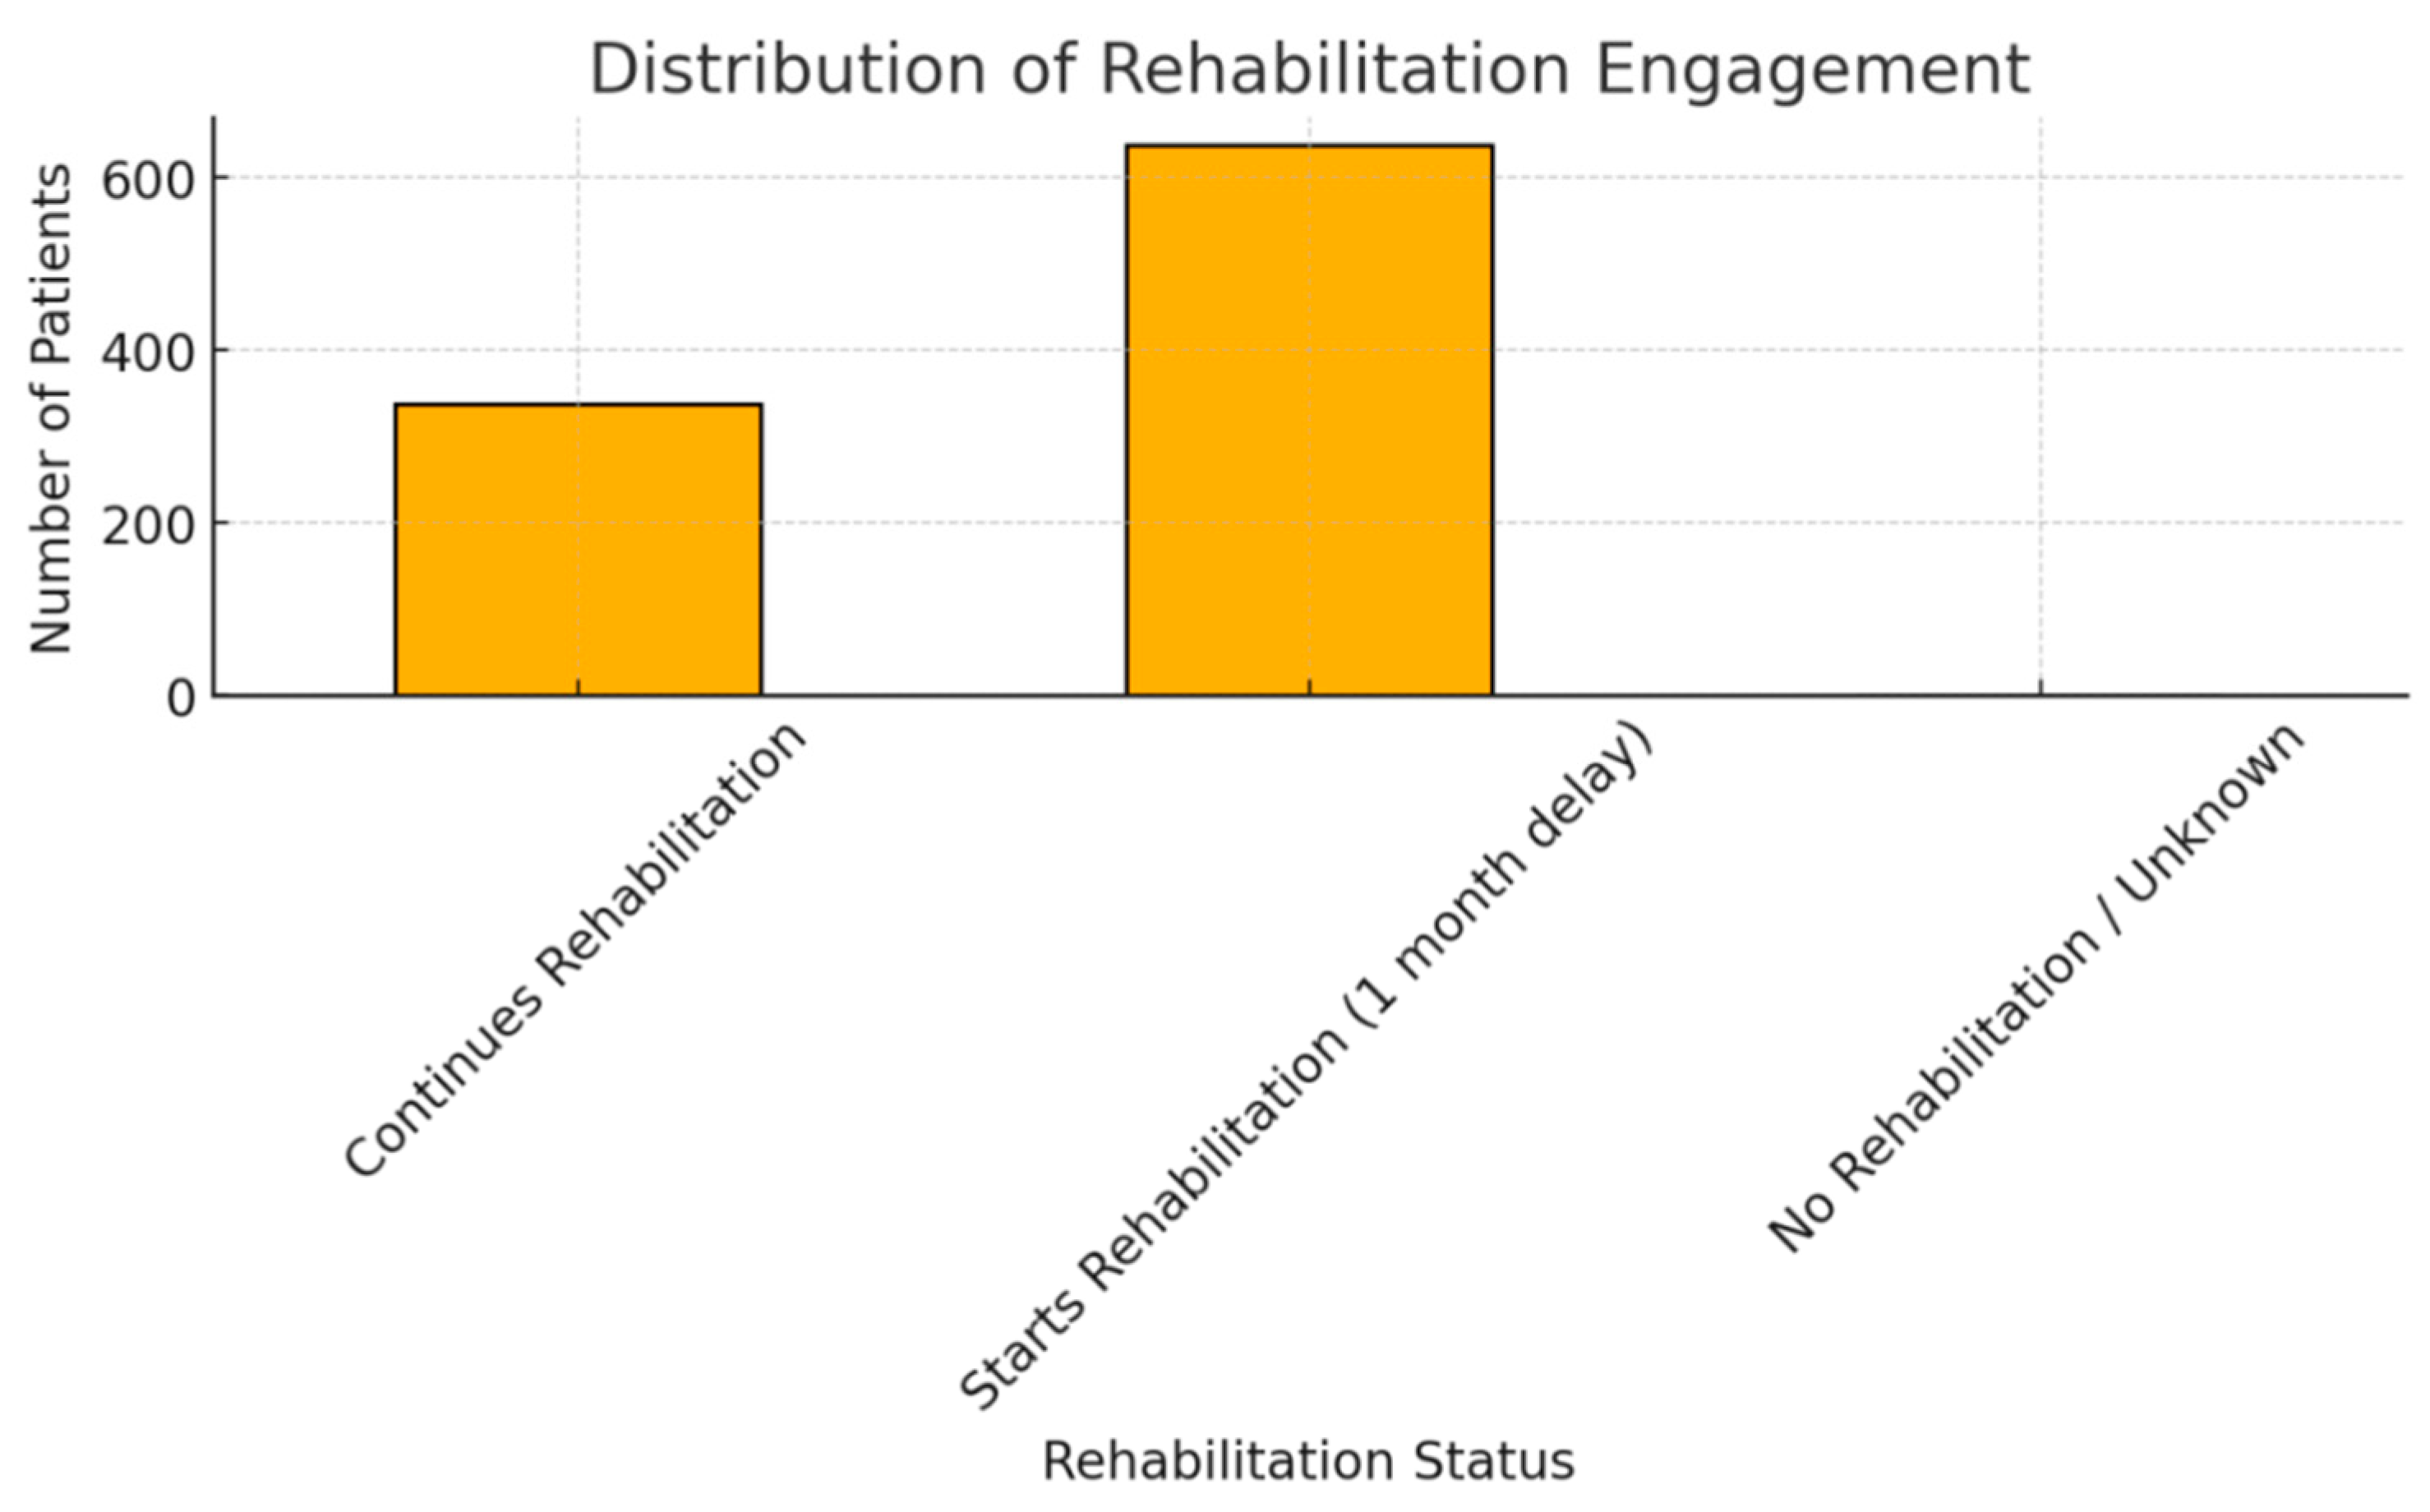
| STARTS_OR_ CONTINUES_REHAB | Ordinal | Starts late: 65.4%, Continues: 34.6% | Strong rehab adherence overall |
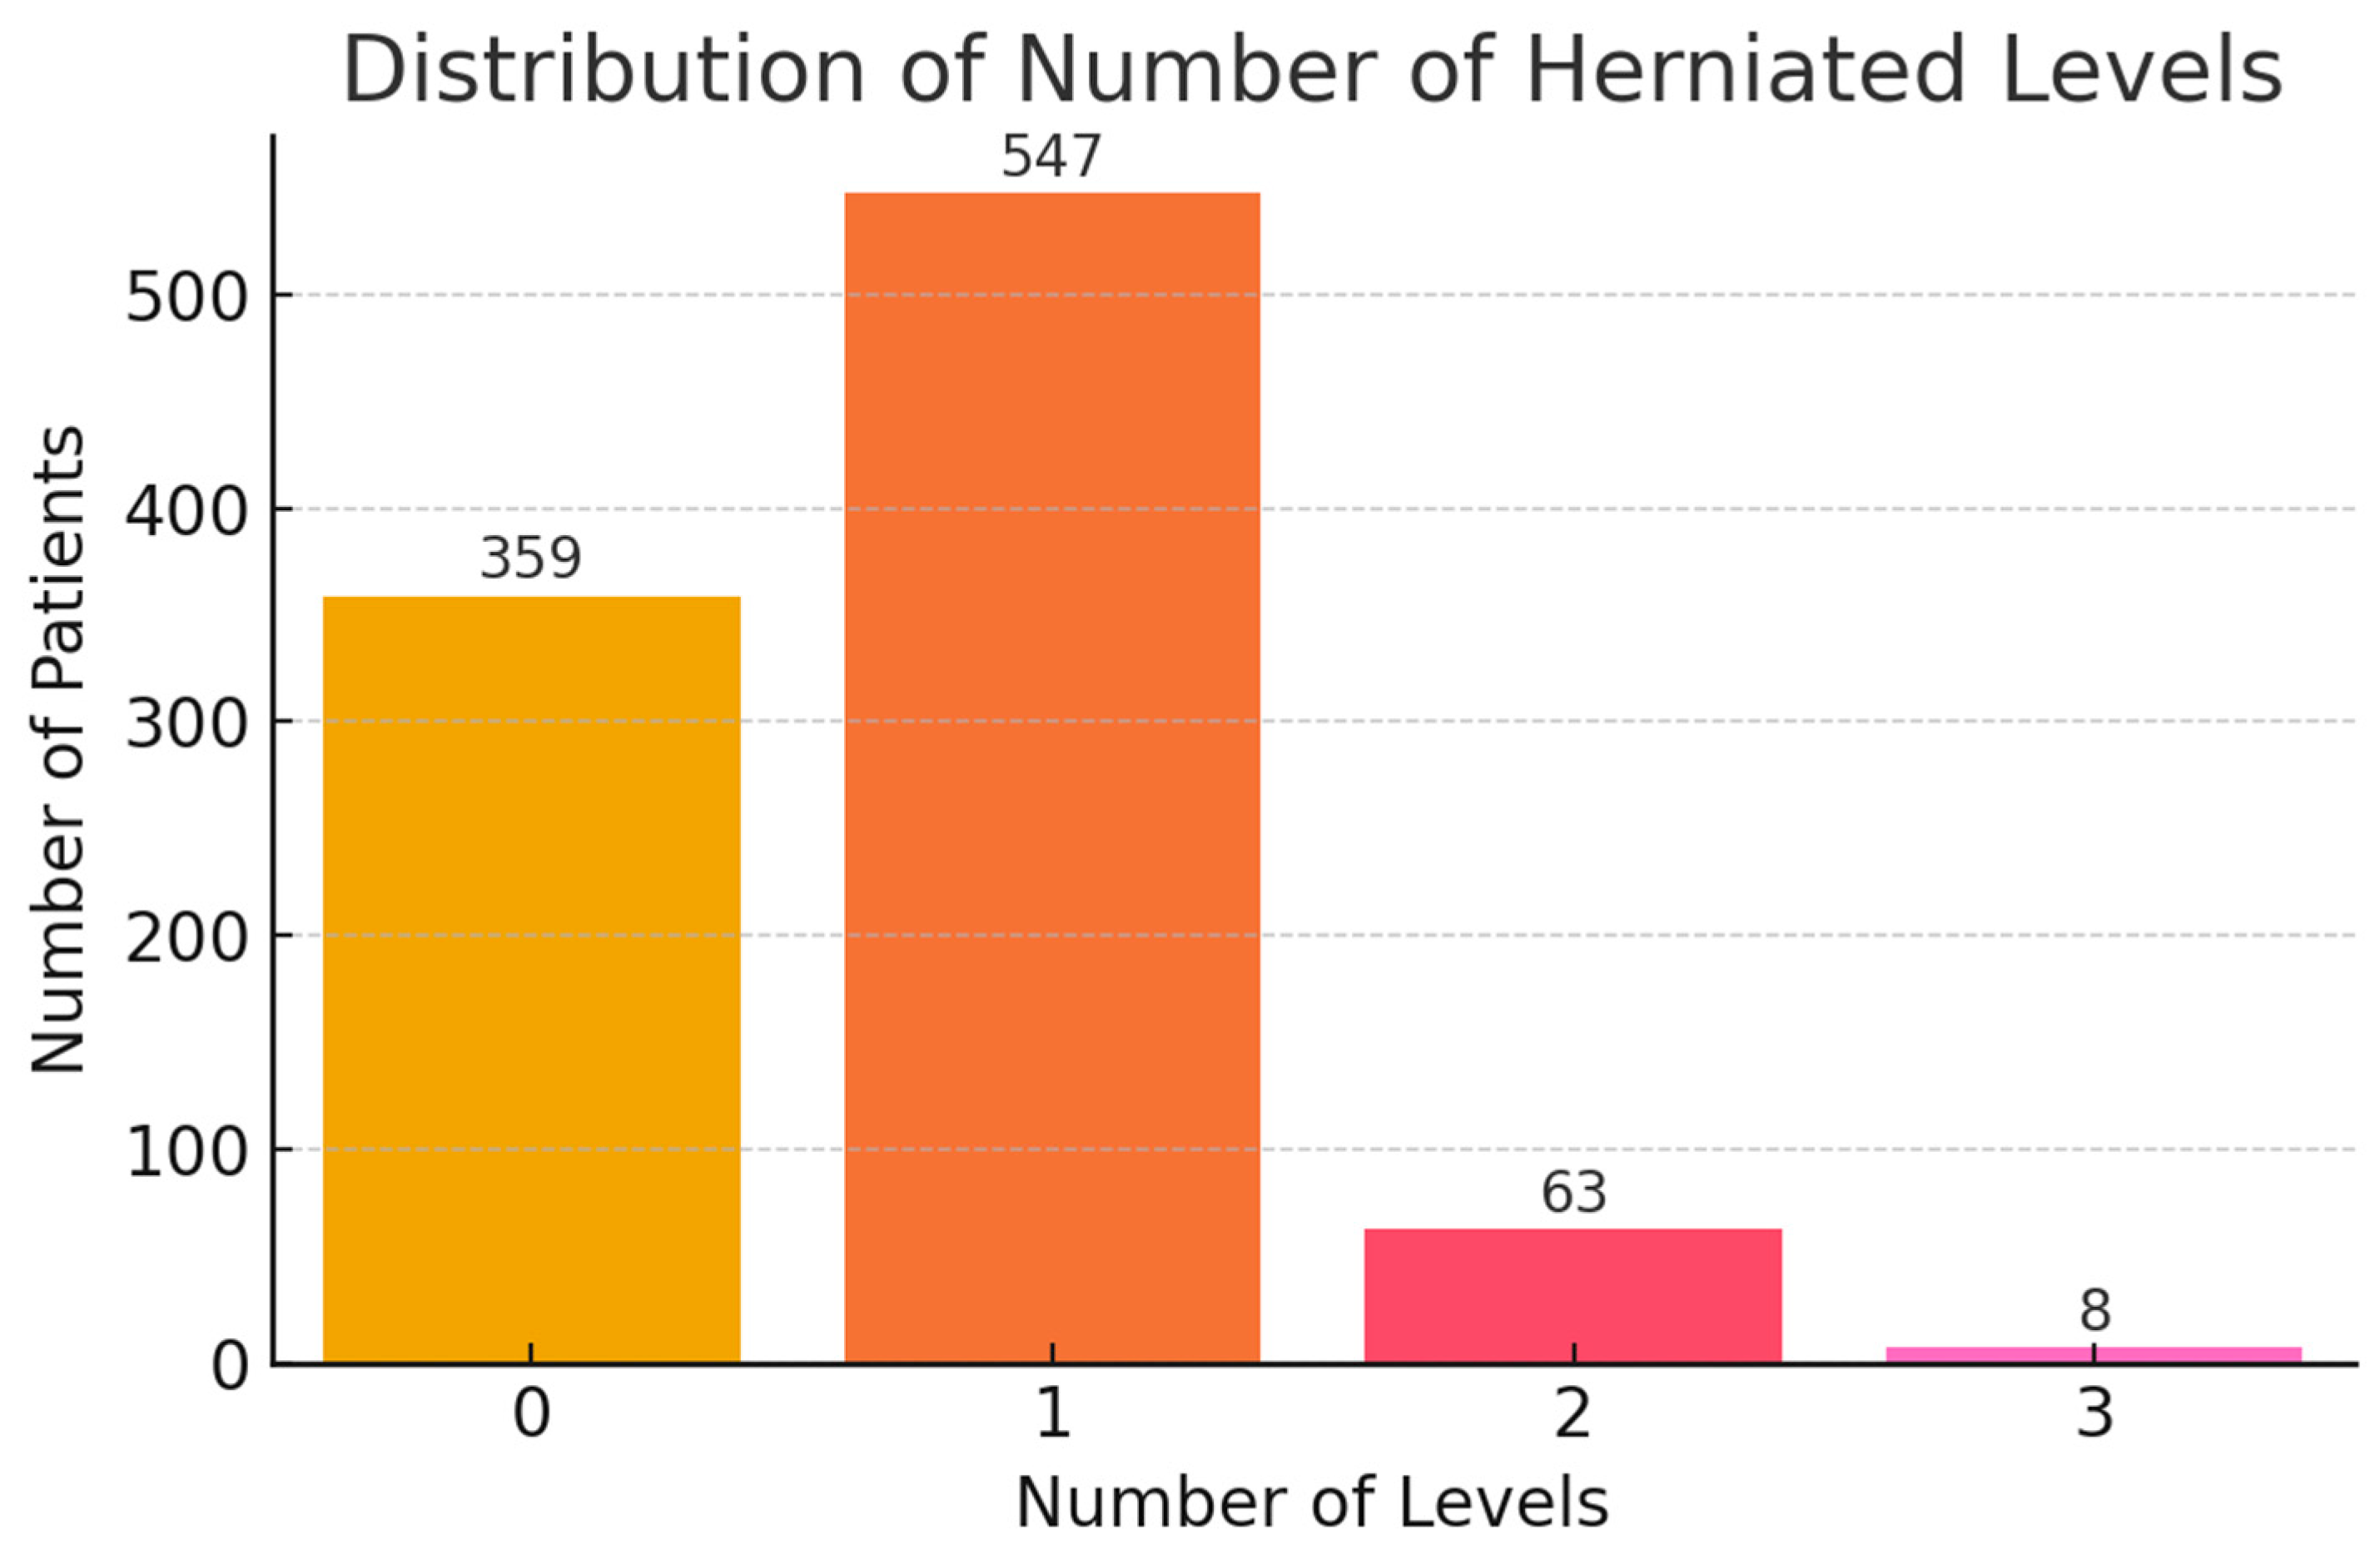
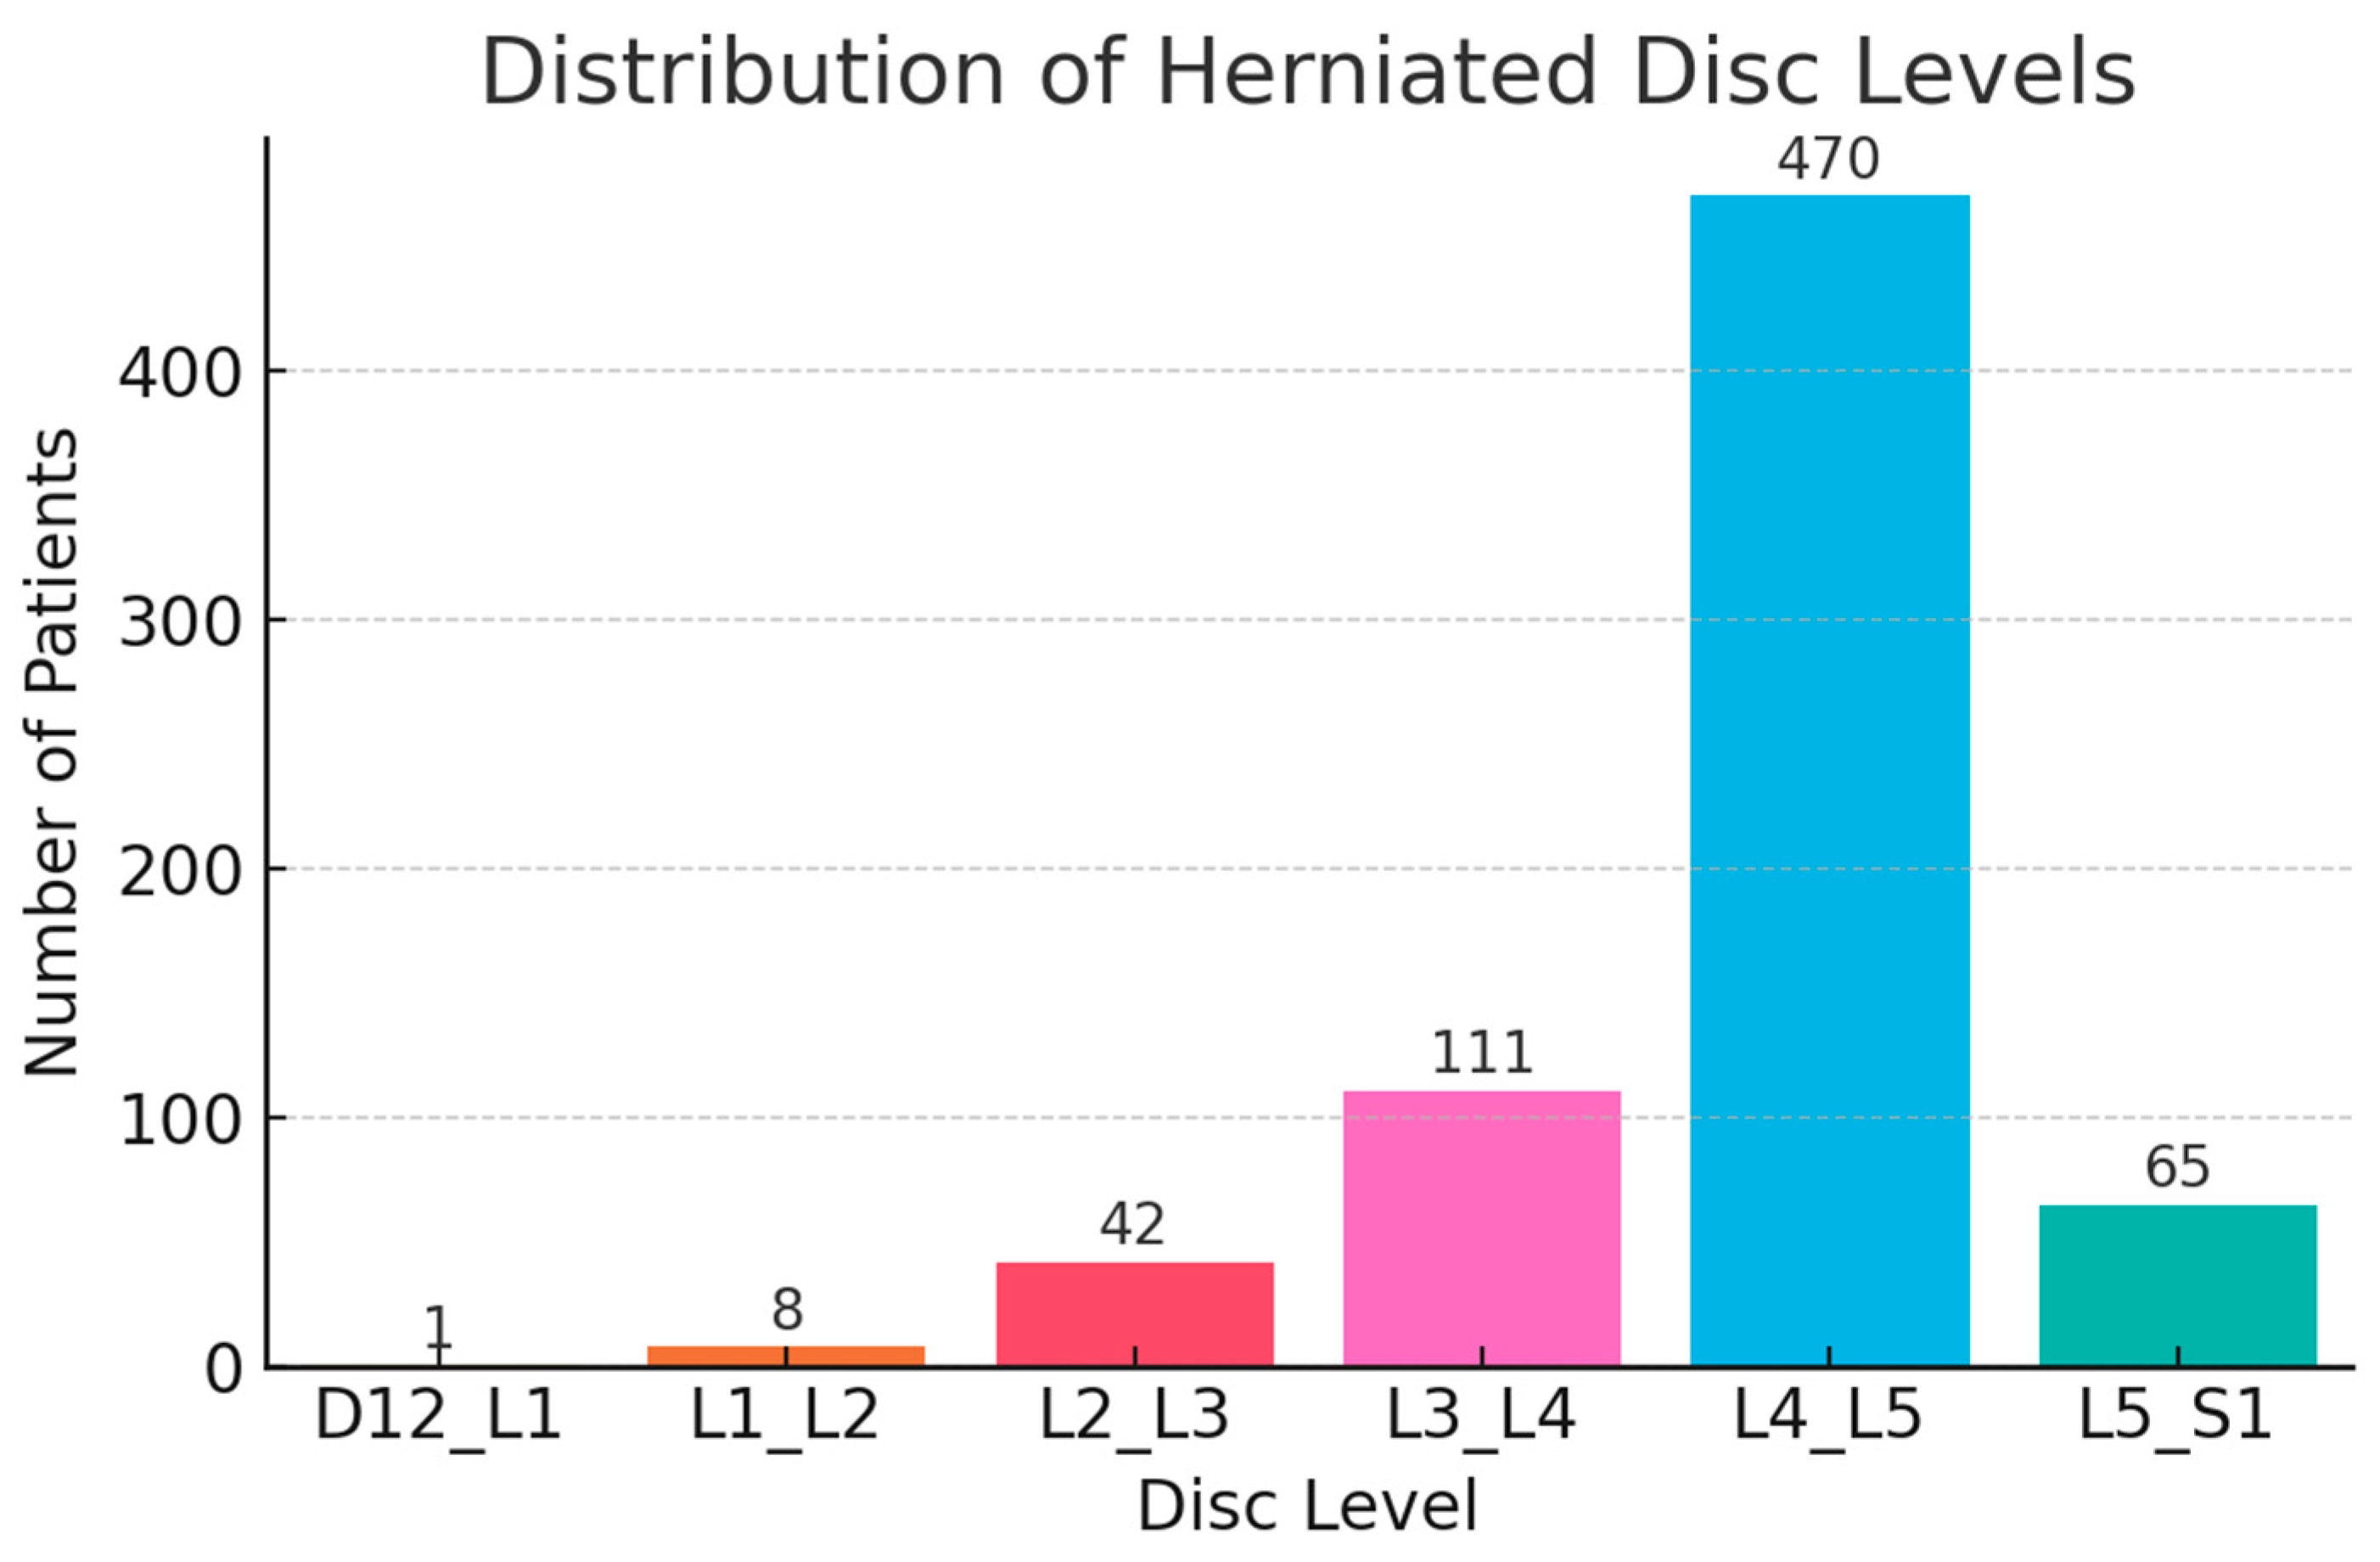
| NUMBER_OF_HERNIA_ LEVELS | Discrete Numeric | 0: 36.7%, 1: 56%, 2+: 7.2% | Single-level herniation dominates; 0 may indicate miscoding |
| D12_L1 | Binary | YES: 0.1% | Very rare upper lumbar herniation |
| L1_L2 | Binary | YES: 0.8% | Uncommon; may indicate atypical LDH |
| L2_L3 | Binary | YES: 4.3% | Relatively infrequent herniation level |
| L3_L4 | Binary | YES: 11.4% | Moderately common, often included in mid-lumbar pain cases |
| L4_L5 | Binary | YES: 48.1% | Most frequently affected disc level |
| L5_S1 | Binary | YES: 6.7% | Common LDH site; associated with classic sciatica |
| INITIAL_CONSULT_ CONSERVATIVE | Binary | YES: 34.6%, NO: 65.4% | Most patients evaluated surgically first |
| INITIAL_CONSULT_ SURGERY | Binary | YES: 65.4% | Matches previous indicator |
| TIBIAL_NERVE_PARESIS | Binary | YES: 7.7% | Reflects L5-S1 involvement |
| COMMON_PERONEAL_NERVE_PARESIS | Binary | YES: 16% | Reflects L4–L5 nerve root |
| CRURAL_PARESIS | Binary | YES: 3% | Uncommon but clinically significant |
| CAUDA_SYNDROME | Binary | YES: 0.7% | Important neurological emergency |
| PARESTHESIA | Binary | YES: 19% | Common symptom; relevant in early stage |
| HYPERTENSION | Binary | YES: 30.9% | Common comorbidity |
| CARDIOVASCULAR_ DISEASE | Binary | YES: 37.5% | May influence surgical outcomes |
| DIABETES | Binary | YES: 11.1% | Associated with delayed healing |
| OBESITY | Binary | YES: 13.1% | Known predictor of worse surgical outcome |
| OSTEOPOROSIS | Binary | YES: 0.9% | Rare but important in fixation cases |
| GONARTHROSIS | Binary | YES: 1.6% | May impact recovery via gait/mobility limitations |
| COXARTHROSIS | Binary | YES: 3% | Similar implications to gonarthrosis |
| TUMORAL_DISEASE | Binary | YES: 3.9% | May affect surgical indication and outcome |
| LIVER_DISEASE | Binary | YES: 6.1% | Important for perioperative management |
| ENDOCRINE_ DISORDERS | Binary | YES: 1.5% | Low incidence, mild metabolic implications |
| RESPIRATORY_DISEASE | Binary | YES: 5.8% | Relevant for anesthesia planning |
| RENAL_DISEASE | Binary | YES: 12.1% | May influence drug metabolism and recovery |
| OTHER_COMORBIDITIES | Binary | YES: 13.5% | Catch-all variable for rare/uncoded comorbidities |
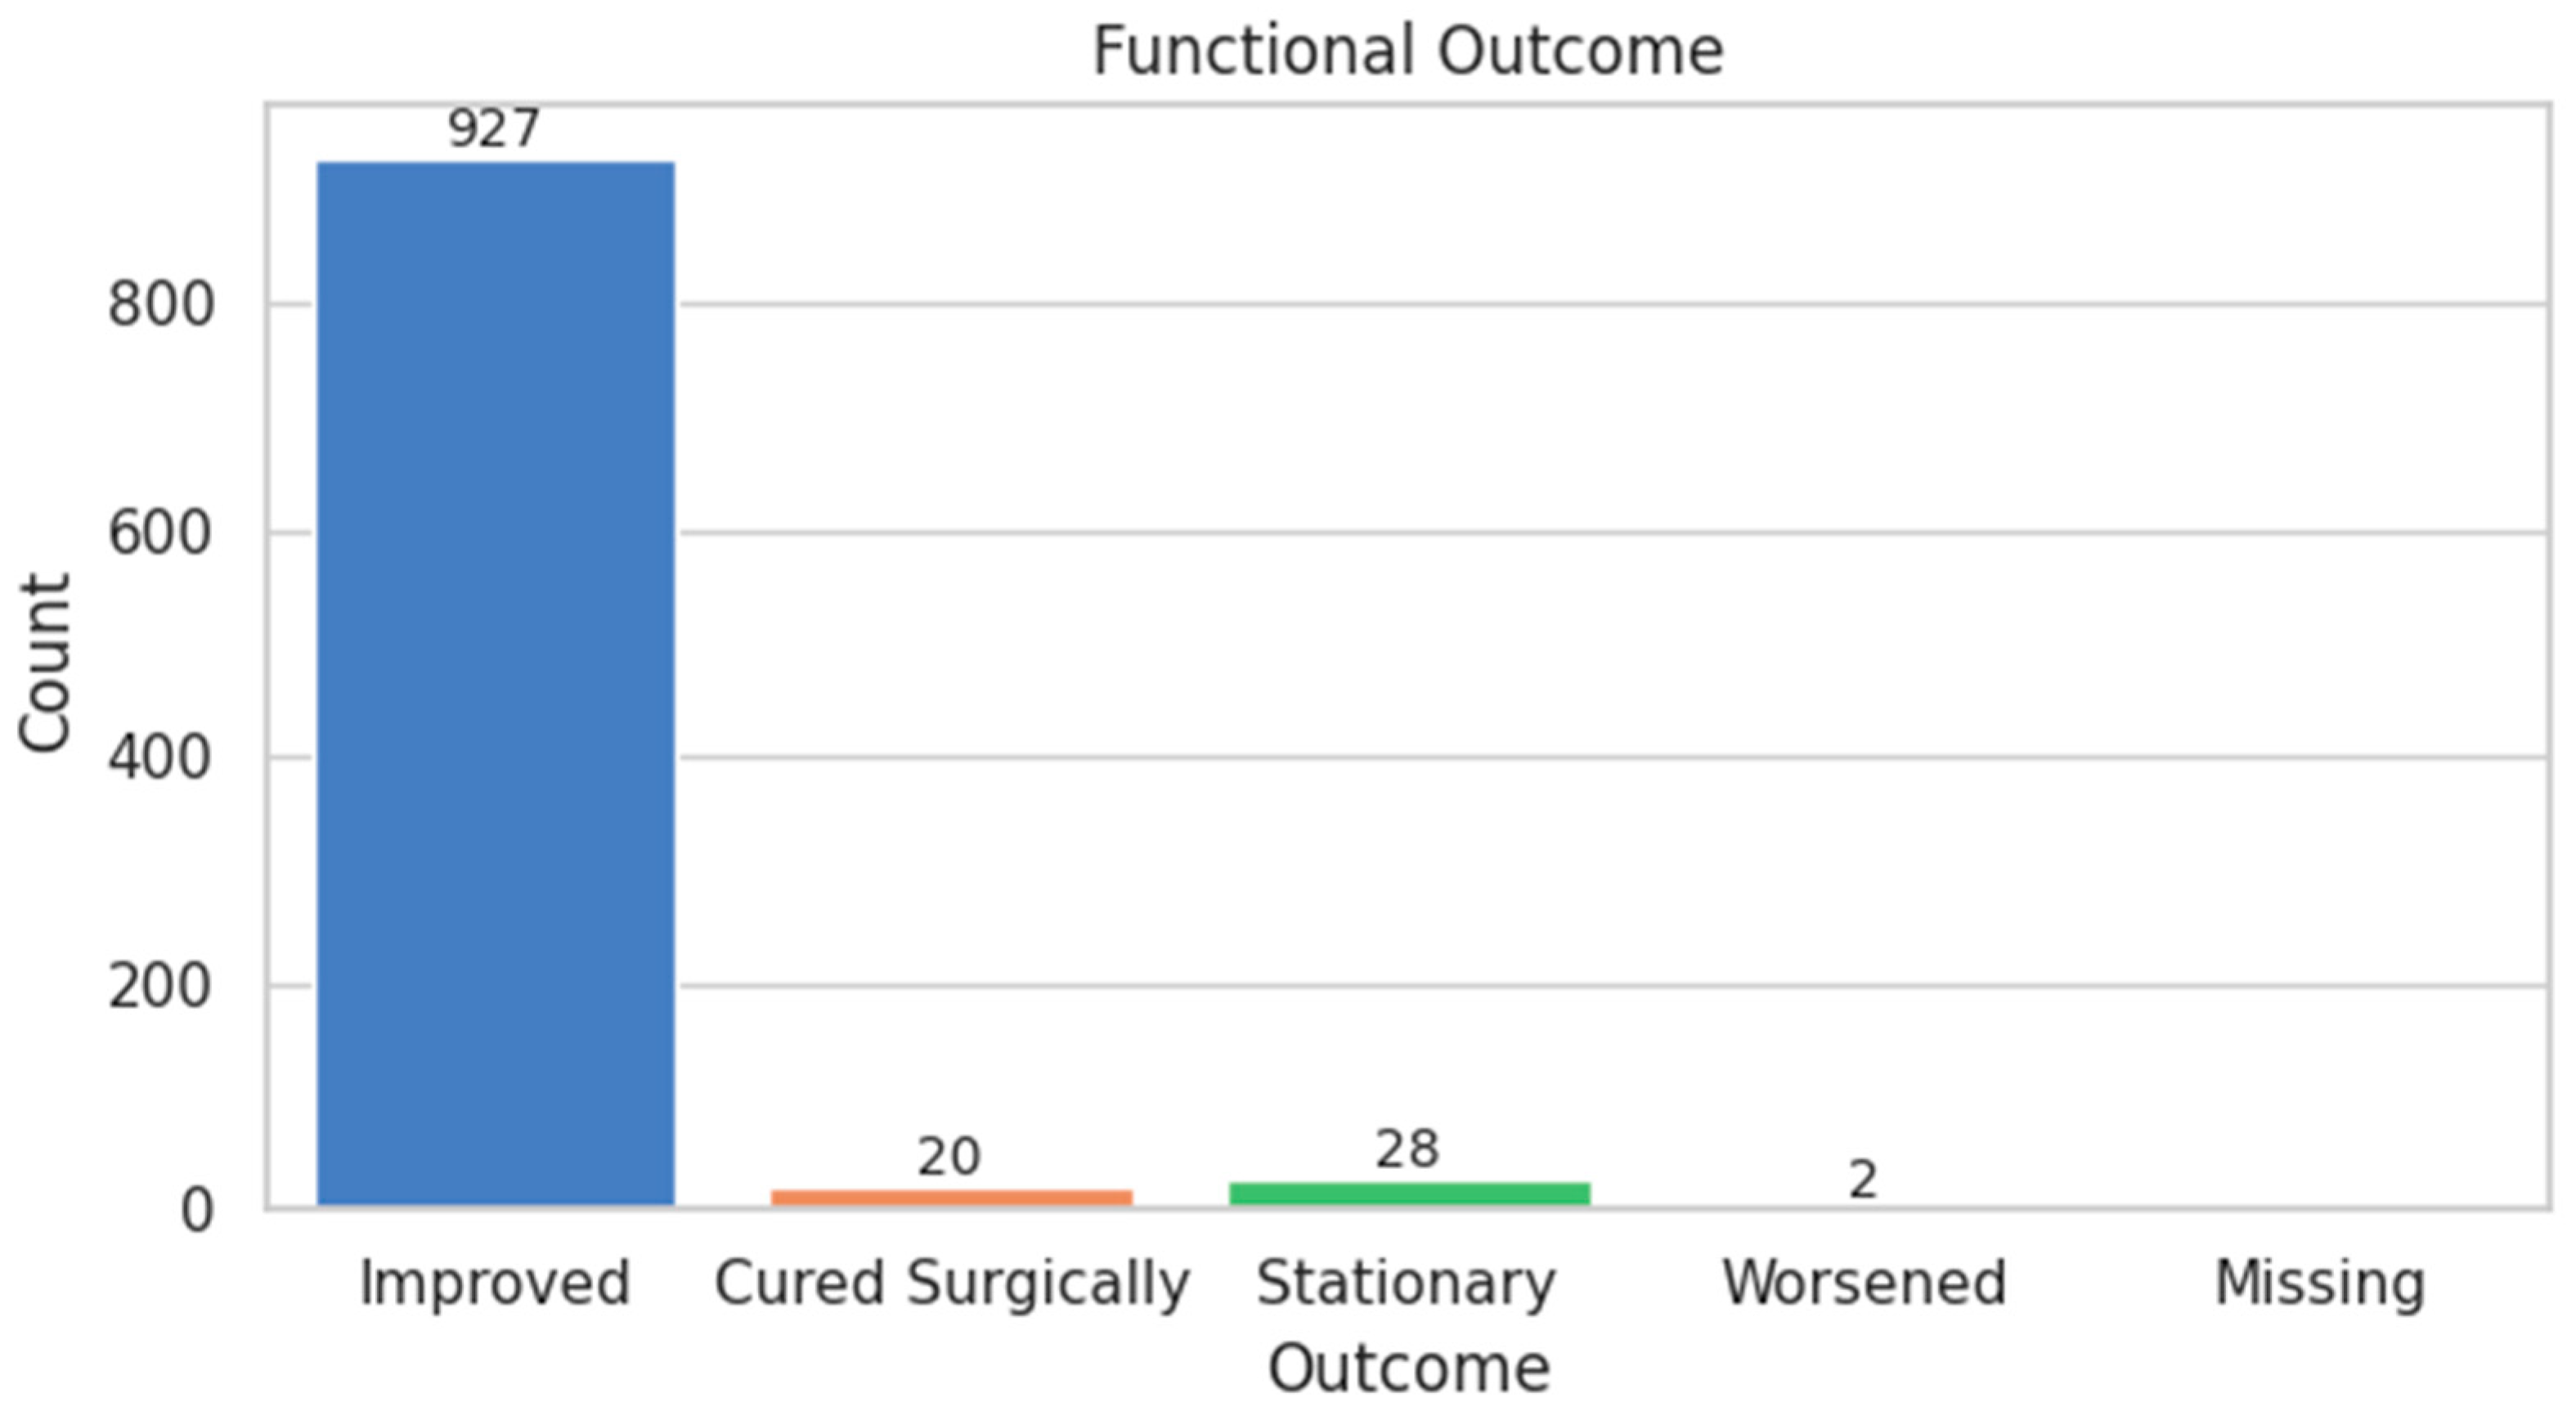
| FUNCTIONAL_SCORE | Ordinal | Improved: 94.9%, Worsened: 0.2% | Strongly skewed toward improvement |
| RECURRENCE_TYPE | Categorical | No: 92.2%, Same level: 6.6% | True recurrence more common than new herniation |
| RECURRENCE | Binary | YES: 7.8%, NO: 92.2% | Low recurrence overall; consistent with literature |
| Variable Name | Type | Description | Encoding/Transformation | Missing Values | Target Association |
|---|---|---|---|---|---|
| SEX | Binary categorical | Patient sex (Male/Female) | Label encoded (M = 0, F = 1) | None | Not significant |
| AGE | Continuous numerical | Patient age at time of intervention | Standardized | None | Weak correlation with score |
| ENVIRONMENT | Binary categorical | Residence (Rural/Urban) | Label encoded (R = 0, U = 1) | None | Not significant |
| HOSPITAL_DAYS | Continuous numerical | Duration of hospitalization (days) | Standardized | None | Point-biserial correlation with recurrence (p = 0.012) |
| INTERVENTION_TYPE | Ordinal categorical | Type of surgical intervention (0–3) | Label encoded | None | Significant (p = 0.004) with FUNCTIONAL_SCORE |
| FINAL_TREATMENT | Ordinal categorical | Surgical/conservative + rehab status (0–3) | Label encoded | 1.0% | Significant (p = 0.009) with FUNCTIONAL_SCORE |
| INITIAL_CONSULT_ CONSERVATIVE | Binary categorical | Initial conservative consult | YES = 1, NO = 0 | None | Not significant |
| INITIAL_CONSULT_ SURGERY | Binary categorical | Initial surgical consult | YES = 1, NO = 0 | None | Not significant |
| POSTOP_CONTROL_ CODED | Ordinal categorical | Post-op control severity (0–3) | Ordinal encoding | 2.6% | Not significant |
| STARTS_OR_ CONTINUES_REHAB | Ordinal categorical | Rehab adherence post-intervention | Ordinal encoding | None | Not significant |
| NUMBER_OF_HERNIA_ LEVELS | Discrete numerical | Number of herniated disc levels | Raw integer | None | Spearman corr. with recurrence type (ρ = 0.11, p < 0.05) |
| D12_L1 | Binary categorical | Herniation at D12-L1 level | YES = 1, NO = 0 | None | Not significant |
| L1_L2 | Binary categorical | Herniation at L1-L2 level | YES = 1, NO = 0 | None | Not significant |
| L2_L3 | Binary categorical | Herniation at L2-L3 level | YES = 1, NO = 0 | None | Not significant |
| L3_L4 | Binary categorical | Herniation at L3-L4 level | YES = 1, NO = 0 | None | Not significant |
| L4_L5 | Binary categorical | Herniation at L4-L5 level | YES = 1, NO = 0 | None | Significant with recurrence (p = 0.017) |
| L5_S1 | Binary categorical | Herniation at L5-S1 level | YES = 1, NO = 0 | None | Not significant |
| TIBIAL_NERVE_PARESIS | Binary categorical | Motor deficit–tibial nerve | YES = 1, NO = 0 | None | Not significant |
| COMMON_PERONEAL_ NERVE_PARESIS | Binary categorical | Motor deficit–peroneal nerve | YES = 1, NO = 0 | None | Significant with recurrence (p = 0.030) |
| CRURAL_PARESIS | Binary categorical | Motor deficit–crural nerve | YES = 1, NO = 0 | None | Not significant |
| CAUDA_SYNDROME | Binary categorical | Cauda equina syndrome | YES = 1, NO = 0 | None | Not significant |
| PARESTHESIA | Binary categorical | Paresthesia | YES = 1, NO = 0 | None | Not significant |
| HYPERTENSION | Binary categorical | Comorbidity–hypertension | YES = 1, NO = 0 | None | Not significant |
| CARDIOVASCULAR_ DISEASE | Binary categorical | Comorbidity–cardiovascular | YES = 1, NO = 0 | None | Not significant |
| DIABETES | Binary categorical | Comorbidity–diabetes | YES = 1, NO = 0 | None | Significant with recurrence (p = 0.018) |
| OBESITY | Binary categorical | Comorbidity–obesity | YES = 1, NO = 0 | None | Significant with recurrence (p = 0.012) |
| OSTEOPOROSIS | Binary categorical | Comorbidity–osteoporosis | YES = 1, NO = 0 | None | Not significant |
| GONARTHROSIS | Binary categorical | Comorbidity–knee arthrosis | YES = 1, NO = 0 | None | Not significant |
| COXARTHROSIS | Binary categorical | Comorbidity–hip arthrosis | YES = 1, NO = 0 | None | Not significant |
| TUMORAL_DISEASE | Binary categorical | Comorbidity–tumoral disease | YES = 1, NO = 0 | None | Not significant |
| LIVER_DISEASE | Binary categorical | Comorbidity–liver | YES = 1, NO = 0 | None | Not significant |
| ENDOCRINE_ DISORDERS | Binary categorical | Comorbidity–endocrine | YES = 1, NO = 0 | None | Not significant |
| RESPIRATORY_DISEASE | Binary categorical | Comorbidity–respiratory | YES = 1, NO = 0 | None | Not significant |
| RENAL_DISEASE | Binary categorical | Comorbidity–renal | YES = 1, NO = 0 | None | Not significant |
| OTHER_COMORBIDITIES | Binary categorical | Other comorbid conditions | YES = 1, NO = 0 | None | Not significant |
| FUNCTIONAL_SCORE | Ordinal categorical | Post-treatment recovery outcome | −1 to 3 scale | None | Target variable |
| RECURRENCE_TYPE | Ordinal categorical | Subtype of recurrence (0–3) | Label encoded | None | Intermediate label |
| RECURRENCE | Binary categorical | Recurrent disc herniation | YES = 1, NO = 0 | None | Target variable |
| Feature | p-Value |
|---|---|
| INTERVENTION_TYPE | 0.004347 |
| HOSPITAL_DAYS | 0.007417 |
| NUMBER_OF_HERNIA_LEVELS | 0.010542 |
| L4_L5 | 0.012621 |
| AGE | 0.037818 |
| OBESITY | 0.059700 |
| SEX | 0.070296 |
| POSTOP_CONTROL_CODED | 0.096429 |
| PARESTHESIA | 0.102891 |
| OTHER_COMORBIDITIES | 0.104613 |
| COMMON_PERONEAL_NERVE_PARESIS | 0.111058 |
| HYPERTENSION | 0.117064 |
| CARDIOVASCULAR_DISEASE | 0.132041 |
| FINAL_TREATMENT | 0.133354 |
| ENVIRONMENT | 0.159245 |
| Model | Accuracy | Precision | Recall | F1 Score |
|---|---|---|---|---|
| Logistic Regression | 0.92 | 0.92 | 0.00 | 0.00 |
| SVM (RBF Kernel) | 0.68 | 0.90 | 0.00 | 0.00 |
| Random Forest | 0.92 | 0.92 | 0.00 | 0.00 |
| Precision | Recall | f1-Score | Support | |
|---|---|---|---|---|
| NO | 1.00 | 1.00 | 1.00 | 901 |
| YES | 1.00 | 1.00 | 1.00 | 76 |
| accuracy | 1.00 | 977 | ||
| macroavg | 1.00 | 1.00 | 1.00 | 977 |
| weighted avg | 1.00 | 1.00 | 1.00 | 977 |
| Fold | Precision | Recall | F1 Score |
|---|---|---|---|
| 1 | 0.789 | 1.000 | 0.882 |
| 2 | 0.941 | 1.000 | 0.970 |
| 3 | 0.833 | 1.000 | 0.909 |
| 4 | 0.938 | 1.000 | 0.968 |
| 5 | 0.938 | 1.000 | 0.968 |
| Rank | Feature | Importance |
|---|---|---|
| 1 | HOSPITAL_DAYS | 0.211249 |
| 2 | AGE | 0.186493 |
| 3 | NUMBER_OF_HERNIA_LEVELS | 0.050279 |
| 4 | INTERVENTION_TYPE | 0.047659 |
| 5 | ENVIRONMENT | 0.040418 |
| 6 | L4_L5 | 0.038984 |
| 7 | SEX | 0.036871 |
| 8 | FINAL_TREATMENT | 0.031839 |
| 9 | PARESTHESIA | 0.030806 |
| 10 | OTHER_COMORBIDITIES | 0.024511 |
| 11 | HYPERTENSION | 0.022541 |
| 12 | RENAL_DISEASE | 0.022389 |
| 13 | OBESITY | 0.021721 |
| 14 | CARDIOVASCULAR_DISEASE | 0.021593 |
| 15 | COMMON_PERONEAL_NERVE_PARESIS | 0.021556 |
| Rank | Feature | Importance |
|---|---|---|
| 1 | NUMBER_OF_HERNIA_LEVELS | 0.058369 |
| 2 | TUMORAL_DISEASE | 0.053582 |
| 3 | OTHER_COMORBIDITIES | 0.052835 |
| 4 | L5_S1 | 0.051938 |
| 5 | PARESTHESIA | 0.049352 |
| 6 | POSTOP_CONTROL_CODED | 0.048677 |
| 7 | DIABETES | 0.046568 |
| 8 | TIBIAL_NERVE_PARESIS | 0.045574 |
| 9 | ENVIRONMENT | 0.044889 |
| 10 | COMMON_PERONEAL_NERVE_PARESIS | 0.043918 |
| 11 | HOSPITAL_DAYS | 0.040361 |
| 12 | INTERVENTION_TYPE | 0.039572 |
| 13 | FINAL_TREATMENT | 0.039410 |
| 14 | L3_L4 | 0.039084 |
| 15 | AGE | 0.039017 |
| Model | ROC AUC |
|---|---|
| Deep Learning (DL) | 0.3823 |
| Random Forest (RF) | 1.0000 |
| Autoencoder (AE) | 0.5985 |
| Isolation Forest | 0.5241 |
| Meta-Ensemble | 0.4475 |
| Confusion Matrix | Performance Metrics | ||||
|---|---|---|---|---|---|
| Predicted NO | Predicted YES | Metric | Value | ||
| Actual NO | 173 | 8 | Accuracy | 88.3% | |
| Actual YES | 15 | 0 | Precision (YES) | 0.00 | |
| Recall (YES) | 0.00 | ||||
| F1-Score (YES) | 0.00 | ||||
Disclaimer/Publisher’s Note: The statements, opinions and data contained in all publications are solely those of the individual author(s) and contributor(s) and not of MDPI and/or the editor(s). MDPI and/or the editor(s) disclaim responsibility for any injury to people or property resulting from any ideas, methods, instructions or products referred to in the content. |
© 2025 by the authors. Licensee MDPI, Basel, Switzerland. This article is an open access article distributed under the terms and conditions of the Creative Commons Attribution (CC BY) license (https://creativecommons.org/licenses/by/4.0/).
Share and Cite
Duceac, M.; Buzea, C.G.; Pleșea-Condratovici, A.; Eva, L.; Duceac, L.D.; Dabija, M.G.; Costăchescu, B.; Elkan, E.M.; Guțu, C.; Voinescu, D.C. A Hybrid Ensemble Learning Framework for Predicting Lumbar Disc Herniation Recurrence: Integrating Supervised Models, Anomaly Detection, and Threshold Optimization. Diagnostics 2025, 15, 1628. https://doi.org/10.3390/diagnostics15131628
Duceac M, Buzea CG, Pleșea-Condratovici A, Eva L, Duceac LD, Dabija MG, Costăchescu B, Elkan EM, Guțu C, Voinescu DC. A Hybrid Ensemble Learning Framework for Predicting Lumbar Disc Herniation Recurrence: Integrating Supervised Models, Anomaly Detection, and Threshold Optimization. Diagnostics. 2025; 15(13):1628. https://doi.org/10.3390/diagnostics15131628
Chicago/Turabian StyleDuceac (Covrig), Mădălina, Călin Gheorghe Buzea, Alina Pleșea-Condratovici, Lucian Eva, Letiția Doina Duceac, Marius Gabriel Dabija, Bogdan Costăchescu, Eva Maria Elkan, Cristian Guțu, and Doina Carina Voinescu. 2025. "A Hybrid Ensemble Learning Framework for Predicting Lumbar Disc Herniation Recurrence: Integrating Supervised Models, Anomaly Detection, and Threshold Optimization" Diagnostics 15, no. 13: 1628. https://doi.org/10.3390/diagnostics15131628
APA StyleDuceac, M., Buzea, C. G., Pleșea-Condratovici, A., Eva, L., Duceac, L. D., Dabija, M. G., Costăchescu, B., Elkan, E. M., Guțu, C., & Voinescu, D. C. (2025). A Hybrid Ensemble Learning Framework for Predicting Lumbar Disc Herniation Recurrence: Integrating Supervised Models, Anomaly Detection, and Threshold Optimization. Diagnostics, 15(13), 1628. https://doi.org/10.3390/diagnostics15131628