
A Lymphocyte Subset-Based Prediction Model for Refractory Community-Acquired Pneumonia in Immunocompetent Patients


Abstract
1. Introduction
2. Materials and Methods
- (1)
- Demographic data: We collected clinical data, including age, gender, onset season, antimicrobial regimen before admission, past history [e.g., chronic obstructive pulmonary disease (COPD), diabetes mellitus, hypertension, hyperlipemia, COVID-19 infection history (in the past 3 months), smoking history, etc.] from electronic medical records. The severity of pneumonia was evaluated by CURB-65 scores based on consciousness, blood urea nitrogen, respiratory rate, blood pressure, and age, as well as pneumonia severity index (PSI) according to age, mental status, pulse, respiratory rate, systolic blood pressure <90 mmHg, temperature, history, demographics, comorbidity, physical exam findings, and lab and radiographic findings.
- (2)
- For each patient with CAP, the onset date was divided into cold or warm seasons based on the climate characteristics of Beijing, that is, the 6 months with the highest monthly average temperatures were considered the warm season, and other months were considered the cold season.
- (3)
- Laboratory indicators: The laboratory indicators included CBC count by a hematology analyzer (BC-7500; Mindray), biochemical indicators [including TC, total triglyceride (TG), LDL-C, high-density lipoprotein cholesterin (HDL-C), serum Na+, serum potassium (K+), serum chloride (Cl−), uric acid (UA), serum iron (Fe), total serum calcium (TCa2+), calculated serum calcium (CCa2+), FCa2+, and serum magnesium (Mg2+)] and CRP by Clinical Chemistry Analyzers (AU5832; Beckman Coulter), and lymphocyte subsets by flow cytometry (CytoFLEX S; Beckman Coulter), including T (CD3+), CD4+ T (CD3+CD4+CD8−), CD8+ T (CD3+CD4−CD8+), double-negative T (DNT) (CD3+CD4−CD8−), B (CD3−CD19+), and natural killer (NK) (CD3−CD56+) cells.
- (4)
- Microbiological results: The microbiological data were collected from the sputum culture, BALF culture, and BALF NGS, etc.
- (5)
- Statistic process: The percentage of lymphocytes in WBCs were calculated and represented as Lym%WBC. The percentages of respective lymphocyte subsets in all lymphocytes were calculated and represented as B%Lym, T%Lym, NK%Lym, CD4+%Lym, CD8+%Lym, and DNT%Lym. The pathogen detection rate was calculated as follows: detected pathogen number/total subject number in each group.
3. Results
3.1. Demography
3.2. Peripheral Lymphocyte Subsets
3.3. Laboratory Indicators
3.4. Prediction Models for Refractory Community-Acquired Pneumonia
3.5. Microbiological Examination
4. Discussion
5. Conclusions
Author Contributions
Funding
Institutional Review Board Statement
Informed Consent Statement
Data Availability Statement
Conflicts of Interest
Abbreviations
| AIDS | acquired immunodeficiency disease |
| AMR | antimicrobial resistance |
| BALF | bronchoalveolar lavage fluid |
| CAP | community-acquired pneumonia |
| CBC | complete cell count |
| CCa2+ | calculated calcium |
| CCI | Charlson Comorbidity Index |
| CMV | cytomegalovirus |
| COPD | chronic obstructive pulmonary disease |
| COVID-19 | coronavirus disease 2019 |
| CRP | C-reactive protein |
| CTL | cytotoxic T lymphocyte |
| CTL | cytotoxic T lymphocyte |
| DALYs | disability-adjusted life-years |
| DMARDs | disease-modifying anti-rheumatic drugs |
| DNT cell | double-negative T cell |
| EBV | Epstein–Barr virus |
| FCa2+ | free calcium |
| GBD | Global Burden of Diseases |
| g-CAP | general community-acquired pneumonia |
| HDL-C | high-density lipoprotein cholesterin |
| HIV | human immunodeficiency virus |
| HHV | human herpes virus |
| IHME | Institute for Health Metrics and Evaluation |
| LDL-C | low-density lipoprotein cholesterin |
| MRSA | methicillin-resistant Staphylococcus aureus |
| NGS | next-generation sequencing |
| NK cell | natural killer cell |
| r-CAP | refractory community-acquired pneumonia |
| ROC curve | receiver operating characteristic curve |
| SCAP | severe community-acquired pneumonia |
| TC | total cholesterol |
| TCa2+ | total calcium |
| TEM cell | effectory memory T cell |
| TG | total triglyceride |
| TRM cell | tissue-resident effectory memory T cell |
| UA | uric acid |
| WBC | white blood cell |
References
- Fernández-Ruiz, M.; Castón, J.J.; Del Pozo, J.L.; Carratalà, J.; Fortún, J.; Salavert, M.; Torre-Cisneros, J.; Aguado, J.M. How can we optimize the diagnostic and therapeutic approach to pneumonia? Expert opinion-based recommendations. Enfermedades Infecciosas y Microbiología Clínica 2024, 42, 442–452. [Google Scholar] [CrossRef] [PubMed]
- Pneumonia in Adults: Diagnosis and Management; National Institute for Health and Care Excellence: Guidelines; National Institute for Health and Care Excellence (NICE): London, UK, 2023; ISBN 978-1-4731-5518-3.
- The Lancet Healthy Longevity. Older People and Political Instability. Lancet Healthy Longev. 2021, 2, e528. [Google Scholar] [CrossRef] [PubMed]
- Di Pasquale, M.F.; Sotgiu, G.; Gramegna, A.; Radovanovic, D.; Terraneo, S.; Reyes, L.F.; Rupp, J.; González Del Castillo, J.; Blasi, F.; Aliberti, S.; et al. Prevalence and Etiology of Community-Acquired Pneumonia in Immunocompromised Patients. Clin. Infect. Dis. 2019, 68, 1482–1493. [Google Scholar] [CrossRef] [PubMed]
- Pioli, P.D. Plasma Cells, the Next Generation: Beyond Antibody Secretion. Front. Immunol. 2019, 10, 2768. [Google Scholar] [CrossRef]
- Batista, F.D.; Harwood, N.E. The Who, How and Where of Antigen Presentation to B Cells. Nat. Rev. Immunol. 2009, 9, 15–27. [Google Scholar] [CrossRef]
- Sun, L.; Su, Y.; Jiao, A.; Wang, X.; Zhang, B. T Cells in Health and Disease. Signal Transduct. Target. Ther. 2023, 8, 235. [Google Scholar] [CrossRef]
- Schmidt, M.E.; Varga, S.M. The CD8 T Cell Response to Respiratory Virus Infections. Front. Immunol. 2018, 9, 678. [Google Scholar] [CrossRef]
- Wik, J.A.; Skålhegg, B.S. T Cell Metabolism in Infection. Front. Immunol. 2022, 13, 840610. [Google Scholar] [CrossRef]
- Chapman, N.M.; Boothby, M.R.; Chi, H. Metabolic Coordination of T Cell Quiescence and Activation. Nat. Rev. Immunol. 2020, 20, 55–70. [Google Scholar] [CrossRef]
- Juno, J.A.; Van Bockel, D.; Kent, S.J.; Kelleher, A.D.; Zaunders, J.J.; Munier, C.M.L. Cytotoxic CD4 T Cells—Friend or Foe during Viral Infection? Front. Immunol. 2017, 8, 19. [Google Scholar] [CrossRef]
- Bantug, G.R.; Galluzzi, L.; Kroemer, G.; Hess, C. The Spectrum of T Cell Metabolism in Health and Disease. Nat. Rev. Immunol. 2018, 18, 19–34. [Google Scholar] [CrossRef] [PubMed]
- Björkström, N.K.; Strunz, B.; Ljunggren, H.-G. Natural Killer Cells in Antiviral Immunity. Nat. Rev. Immunol. 2022, 22, 112–123. [Google Scholar] [CrossRef] [PubMed]
- Emergency Branch of Chinese Medical Doctor Association; Chinese Emergency Medicine Partnerships; Beijing Society for Emergency Medicine Clinical Practice. Guidelines for Adult Community-Acquired Pneumonia in Emergency Department (2024 Edition). Chin. J. Emerg. Med. 2025, 34, 300–317. [Google Scholar]
- Chinese Thoracic Society. Diagnosis and Treatment of Commnity-Acquired Pneumonia in Adults in China (2016 Edition). Chin. J. Tuberc. Respir. Dis. 2016, 39, 253–279. [Google Scholar] [CrossRef]
- Charlson, M.E.; Pompei, P.; Ales, K.L.; MacKenzie, C.R. A New Method of Classifying Prognostic Comorbidity in Longitudinal Studies: Development and Validation. J. Chronic Dis. 1987, 40, 373–383. [Google Scholar] [CrossRef]
- Naghavi, M.; Mestrovic, T.; Gray, A.; Gershberg Hayoon, A.; Swetschinski, L.R.; Robles Aguilar, G.; Davis Weaver, N.; Ikuta, K.S.; Chung, E.; Wool, E.E.; et al. Global Burden Associated with 85 Pathogens in 2019: A Systematic Analysis for the Global Burden of Disease Study 2019. Lancet Infect. Dis. 2024, 24, 868–895. [Google Scholar] [CrossRef] [PubMed]
- Naghavi, M.; Vollset, S.E.; Ikuta, K.S.; Swetschinski, L.R.; Gray, A.P.; Wool, E.E.; Robles Aguilar, G.; Mestrovic, T.; Smith, G.; Han, C.; et al. Global Burden of Bacterial Antimicrobial Resistance 1990–2021: A Systematic Analysis with Forecasts to 2050. Lancet 2024, 404, 1199–1226. [Google Scholar] [CrossRef] [PubMed]
- Molyneaux, P.L.; Mallia, P.; Cox, M.J.; Footitt, J.; Willis-Owen, S.A.G.; Homola, D.; Trujillo-Torralbo, M.-B.; Elkin, S.; Kon, O.M.; Cookson, W.O.C.; et al. Outgrowth of the Bacterial Airway Microbiome after Rhinovirus Exacerbation of Chronic Obstructive Pulmonary Disease. Am. J. Respir. Crit. Care Med. 2013, 188, 1224–1231. [Google Scholar] [CrossRef]
- Murphy, T.F.; Brauer, A.L.; Grant, B.J.B.; Sethi, S. Moraxella Catarrhalis in Chronic Obstructive Pulmonary Disease: Burden of Disease and Immune Response. Am. J. Respir. Crit. Care Med. 2005, 172, 195–199. [Google Scholar] [CrossRef]
- Sethi, S.; Sethi, R.; Eschberger, K.; Lobbins, P.; Cai, X.; Grant, B.J.B.; Murphy, T.F. Airway Bacterial Concentrations and Exacerbations of Chronic Obstructive Pulmonary Disease. Am. J. Respir. Crit. Care Med. 2007, 176, 356–361. [Google Scholar] [CrossRef]
- Sethi, S.; Evans, N.; Grant, B.J.B.; Murphy, T.F. New Strains of Bacteria and Exacerbations of Chronic Obstructive Pulmonary Disease. N. Engl. J. Med. 2002, 347, 465–471. [Google Scholar] [CrossRef] [PubMed]
- Hill, A.T.; Campbell, E.J.; Hill, S.L.; Bayley, D.L.; Stockley, R.A. Association between Airway Bacterial Load and Markers of Airway Inflammation in Patients with Stable Chronic Bronchitis. Am. J. Med. 2000, 109, 288–295. [Google Scholar] [CrossRef]
- Sethi, S.; Murphy, T.F. Bacterial Infection in Chronic Obstructive Pulmonary Disease in 2000: A State-of-the-Art Review. Clin. Microbiol. Rev. 2001, 14, 336–363. [Google Scholar] [CrossRef] [PubMed]
- Van Schilfgaarde, M.; Eijk, P.; Regelink, A.; Van Ulsen, P.; Everts, V.; Dankert, J.; Van Alphen, L. Haemophilus Influenzaelocalized in Epithelial Cell Layers Is Shielded from Antibiotics and Antibody-Mediated Bactericidal Activity. Microb. Pathog. 1999, 26, 249–262. [Google Scholar] [CrossRef]
- Brusselle, G.G.; Joos, G.F.; Bracke, K.R. New Insights into the Immunology of Chronic Obstructive Pulmonary Disease. Lancet 2011, 378, 1015–1026. [Google Scholar] [CrossRef]
- Urbanowicz, R.A.; Lamb, J.R.; Todd, I.; Corne, J.M.; Fairclough, L.C. Enhanced Effector Function of Cytotoxic Cells in the Induced Sputum of COPD Patients. Respir. Res. 2010, 11, 76. [Google Scholar] [CrossRef]
- Cosio, M.G.; Saetta, M.; Agusti, A. Immunologic Aspects of Chronic Obstructive Pulmonary Disease. N. Engl. J. Med. 2009, 360, 2445–2454. [Google Scholar] [CrossRef] [PubMed]
- Di Stefano, A.; Caramori, G.; Gnemmi, I.; Contoli, M.; Vicari, C.; Capelli, A.; Magno, F.; D’Anna, S.E.; Zanini, A.; Brun, P.; et al. T Helper Type 17-Related Cytokine Expression Is Increased in the Bronchial Mucosa of Stable Chronic Obstructive Pulmonary Disease Patients. Clin. Exp. Immunol. 2009, 157, 316–324. [Google Scholar] [CrossRef]
- Imaoka, H.; Hoshino, T.; Takei, S.; Kinoshita, T.; Okamoto, M.; Kawayama, T.; Kato, S.; Iwasaki, H.; Watanabe, K.; Aizawa, H. Interleukin-18 Production and Pulmonary Function in COPD. Eur. Respir. J. 2008, 31, 287–297. [Google Scholar] [CrossRef]
- Grumelli, S.; Corry, D.B.; Song, L.-Z.; Song, L.; Green, L.; Huh, J.; Hacken, J.; Espada, R.; Bag, R.; Lewis, D.E.; et al. An Immune Basis for Lung Parenchymal Destruction in Chronic Obstructive Pulmonary Disease and Emphysema. PLoS Med. 2004, 1, e8. [Google Scholar] [CrossRef]
- Freeman, C.M.; Han, M.K.; Martinez, F.J.; Murray, S.; Liu, L.X.; Chensue, S.W.; Polak, T.J.; Sonstein, J.; Todt, J.C.; Ames, T.M.; et al. Cytotoxic Potential of Lung CD8+ T Cells Increases with Chronic Obstructive Pulmonary Disease Severity and with In Vitro Stimulation by IL-18 or IL-15. J. Immunol. 2010, 184, 6504–6513. [Google Scholar] [CrossRef] [PubMed]
- Maeno, T.; Houghton, A.M.; Quintero, P.A.; Grumelli, S.; Owen, C.A.; Shapiro, S.D. CD8+ T Cells Are Required for Inflammation and Destruction in Cigarette Smoke-Induced Emphysema in Mice. J. Immunol. 2007, 178, 8090–8096. [Google Scholar] [CrossRef] [PubMed]
- Cosio, M.G.; Majo, J.; Cosio, M.G. Inflammation of the Airways and Lung Parenchyma in COPD. Chest 2002, 121, 160S–165S. [Google Scholar] [CrossRef] [PubMed]
- Deng, Z.; Zheng, Y.; Cai, P.; Zheng, Z. The Role of B and T Lymphocyte Attenuator in Respiratory System Diseases. Front. Immunol. 2021, 12, 635623. [Google Scholar] [CrossRef]
- Sette, A.; Crotty, S. Adaptive Immunity to SARS-CoV-2 and COVID-19. Cell 2021, 184, 861–880. [Google Scholar] [CrossRef]
- Corleis, B.; Cho, J.L.; Gates, S.J.; Linder, A.H.; Dickey, A.; Lisanti-Park, A.C.; Schiff, A.E.; Ghebremichael, M.; Kohli, P.; Winkler, T.; et al. Smoking and Human Immunodeficiency Virus 1 Infection Promote Retention of CD8+ T Cells in the Airway Mucosa. Am. J. Respir. Cell Mol. Biol. 2021, 65, 513–520. [Google Scholar] [CrossRef]
- Slütter, B.; Van Braeckel-Budimir, N.; Abboud, G.; Varga, S.M.; Salek-Ardakani, S.; Harty, J.T. Dynamics of Influenza-Induced Lung-Resident Memory T Cells Underlie Waning Heterosubtypic Immunity. Sci. Immunol. 2017, 2, eaag2031. [Google Scholar] [CrossRef]
- Chung, H.K.; McDonald, B.; Kaech, S.M. The Architectural Design of CD8+ T Cell Responses in Acute and Chronic Infection: Parallel Structures with Divergent Fates. J. Exp. Med. 2021, 218, e20201730. [Google Scholar] [CrossRef]
- Luckheeram, R.V.; Zhou, R.; Verma, A.D.; Xia, B. CD4+ T Cells: Differentiation and Functions. Clin. Dev. Immunol. 2012, 2012, 925135. [Google Scholar] [CrossRef]
- Trifari, S.; Kaplan, C.D.; Tran, E.H.; Crellin, N.K.; Spits, H. Identification of a Human Helper T Cell Population That Has Abundant Production of Interleukin 22 and Is Distinct from TH-17, TH1 and TH2 Cells. Nat. Immunol. 2009, 10, 864–871. [Google Scholar] [CrossRef]
- Cenerenti, M.; Saillard, M.; Romero, P.; Jandus, C. The Era of Cytotoxic CD4 T Cells. Front. Immunol. 2022, 13, 867189. [Google Scholar] [CrossRef]
- Hoeks, C.; Duran, G.; Hellings, N.; Broux, B. When Helpers Go Above and Beyond: Development and Characterization of Cytotoxic CD4+ T Cells. Front. Immunol. 2022, 13, 951900. [Google Scholar] [CrossRef] [PubMed]
- Zaunders, J.J. Identification of Circulating Antigen-Specific CD4+ T Lymphocytes with a CCR5+, Cytotoxic Phenotype in an HIV-1 Long-Term Nonprogressor and in CMV Infection. Blood 2004, 103, 2238–2247. [Google Scholar] [CrossRef] [PubMed]
- Gupta, G.; Shareef, I.; Tomar, S.; Kumar, M.S.N.; Pandey, S.; Sarda, R.; Singh, R.; Das, B.K.; Sinha, S. Th1/Th2/Th17 Cytokine Profile among Different Stages of COVID-19 Infection. Natl. Acad. Sci. Lett. 2022, 45, 363–369. [Google Scholar] [CrossRef] [PubMed]
- Meckiff, B.J.; Ramírez-Suástegui, C.; Fajardo, V.; Chee, S.J.; Kusnadi, A.; Simon, H.; Eschweiler, S.; Grifoni, A.; Pelosi, E.; Weiskopf, D.; et al. Imbalance of Regulatory and Cytotoxic SARS-CoV-2-Reactive CD4+ T Cells in COVID-19. Cell 2020, 183, 1340–1353.e16. [Google Scholar] [CrossRef]
- Choi, I.-K.; Wang, Z.; Ke, Q.; Hong, M.; Qian, Y.; Zhao, X.; Liu, Y.; Kim, H.-J.; Ritz, J.; Cantor, H.; et al. Signaling by the Epstein–Barr Virus LMP1 Protein Induces Potent Cytotoxic CD4+ and CD8+ T Cell Responses. Proc. Natl. Acad. Sci. USA 2018, 115, E686–E695. [Google Scholar] [CrossRef]
- Alhetheel, A.; Albarrag, A.; Shakoor, Z.; Somily, A.; Barry, M.; Altalhi, H.; Bakhrebah, M.; Nassar, M.; Alfageeh, M.B.; Assiri, A.; et al. Assessment of Th1/Th2 Cytokines among Patients with Middle East Respiratory Syndrome Coronavirus Infection. Int. Immunol. 2020, 32, 799–804. [Google Scholar] [CrossRef]
- Miller, S.M.; Cybulski, V.; Whitacre, M.; Bess, L.S.; Livesay, M.T.; Walsh, L.; Burkhart, D.; Bazin, H.G.; Evans, J.T. Novel Lipidated Imidazoquinoline TLR7/8 Adjuvants Elicit Influenza-Specific Th1 Immune Responses and Protect Against Heterologous H3N2 Influenza Challenge in Mice. Front. Immunol. 2020, 11, 406. [Google Scholar] [CrossRef]
- Wilkinson, T.M.; Li, C.K.F.; Chui, C.S.C.; Huang, A.K.Y.; Perkins, M.; Liebner, J.C.; Lambkin-Williams, R.; Gilbert, A.; Oxford, J.; Nicholas, B.; et al. Preexisting Influenza-Specific CD4+ T Cells Correlate with Disease Protection against Influenza Challenge in Humans. Nat. Med. 2012, 18, 274–280. [Google Scholar] [CrossRef]
- Murdock, B.J.; Shreiner, A.B.; McDonald, R.A.; Osterholzer, J.J.; White, E.S.; Toews, G.B.; Huffnagle, G.B. Coevolution of TH 1, TH 2, and TH 17 Responses during Repeated Pulmonary Exposure to Aspergillus Fumigatus Conidia. Infect. Immun. 2011, 79, 125–135. [Google Scholar] [CrossRef]
- Ma, X.; Wang, L.; Zhao, H.; Pang, N.; Zhang, F.; Jiang, T.; Liu, X.; Mamuti, W.; Wen, H.; Ding, J. Th17 Cells Are Associated with the Th1/Th2-Cell Balance during Echinococcus Multilocularis Infection. Mol. Med. Rep. 2014, 10, 236–240. [Google Scholar] [CrossRef]
- Shanmugasundaram, U.; Bucsan, A.N.; Ganatra, S.R.; Ibegbu, C.; Quezada, M.; Blair, R.V.; Alvarez, X.; Velu, V.; Kaushal, D.; Rengarajan, J. Pulmonary Mycobacterium Tuberculosis Control Associates with CXCR3- and CCR6-Expressing Antigen-Specific Th1 and Th17 Cell Recruitment. JCI Insight 2020, 5, e137858. [Google Scholar] [CrossRef]
- Abebe, F. Synergy between Th1 and Th2 Responses during Mycobacterium Tuberculosis Infection: A Review of Current Understanding: The Paper Discusses the Importance of Simultaneous Induction of Th1/Th2 Responses to Design and Develop Vaccine against TB. Int. Rev. Immunol. 2019, 38, 172–179. [Google Scholar] [CrossRef] [PubMed]
- Bartsch, P.; Kilian, C.; Hellmig, M.; Paust, H.-J.; Borchers, A.; Sivayoganathan, A.; Enk, L.; Zhao, Y.; Shaikh, N.; Büttner, H.; et al. Th17 Cell Plasticity towards a T-Bet-Dependent Th1 Phenotype Is Required for Bacterial Control in Staphylococcus Aureus Infection. PLoS Pathog. 2022, 18, e1010430. [Google Scholar] [CrossRef] [PubMed]
- Wu, Z.; Zheng, Y.; Sheng, J.; Han, Y.; Yang, Y.; Pan, H.; Yao, J. CD3+CD4-CD8- (Double-Negative) T Cells in Inflammation, Immune Disorders and Cancer. Front. Immunol. 2022, 13, 816005. [Google Scholar] [CrossRef] [PubMed]
- Paul, S.; Shilpi; Lal, G. Role of Gamma-Delta (Γδ) T Cells in Autoimmunity. J. Leukoc. Biol. 2015, 97, 259–271. [Google Scholar] [CrossRef]
- Fischer, K.; Voelkl, S.; Heymann, J.; Przybylski, G.K.; Mondal, K.; Laumer, M.; Kunz-Schughart, L.; Schmidt, C.A.; Andreesen, R.; Mackensen, A. Isolation and Characterization of Human Antigen-Specific TCRαβ+ CD4-CD8- Double-Negative Regulatory T Cells. Blood 2005, 105, 2828–2835. [Google Scholar] [CrossRef]
- DeMaster, L.K.; Liu, X.; VanBelzen, D.J.; Trinité, B.; Zheng, L.; Agosto, L.M.; Migueles, S.A.; Connors, M.; Sambucetti, L.; Levy, D.N.; et al. A Subset of CD4/CD8 Double-Negative T Cells Expresses HIV Proteins in Patients on Antiretroviral Therapy. J. Virol. 2016, 90, 2165–2179. [Google Scholar] [CrossRef]
- Pinheiro, M.B.; Antonelli, L.R.; Sathler-Avelar, R.; Vitelli-Avelar, D.M.; Spindola-de-Miranda, S.; Guimarães, T.M.P.D.; Teixeira-Carvalho, A.; Martins-Filho, O.A.; Toledo, V.P.C.P. CD4-CD8-Aβ and Γδ T Cells Display Inflammatory and Regulatory Potentials during Human Tuberculosis. PLoS ONE 2012, 7, e50923. [Google Scholar] [CrossRef]
- Cowley, S.C.; Meierovics, A.I.; Frelinger, J.A.; Iwakura, Y.; Elkins, K.L. Lung CD4−CD8− Double-Negative T Cells Are Prominent Producers of IL-17A and IFN-γ during Primary Respiratory Murine Infection with Francisella Tularensis Live Vaccine Strain. J. Immunol. 2010, 184, 5791–5801. [Google Scholar] [CrossRef]
- Antonelli, L.R.V.; Dutra, W.O.; Oliveira, R.R.; Torres, K.C.L.; Guimarães, L.H.; Bacellar, O.; Gollob, K.J. Disparate Immunoregulatory Potentials for Double-Negative (CD4−CD8−) Aβ and Γδ T Cells from Human Patients with Cutaneous Leishmaniasis. Infect. Immun. 2006, 74, 6317–6323. [Google Scholar] [CrossRef] [PubMed]
- Reijnders, T.D.Y.; Schuurman, A.R.; Verhoeff, J.; van den Braber, M.; Douma, R.A.; Faber, D.R.; Paul, A.G.A.; Wiersinga, W.J.; Saris, A.; Garcia Vallejo, J.J.; et al. High-dimensional phenotyping of the peripheral immune response in community-acquired pneumonia. Front. Immunol. 2023, 14, 1260283. [Google Scholar] [CrossRef] [PubMed]

| Total (n = 164) | g-CAP (n = 82) | r-CAP (n = 82) | p Value | |
|---|---|---|---|---|
| CCI | >0.9999 | |||
| 0–1 | 114 (69.51%) | 57 (69.51%) | 57 (69.51%) | >0.9999 |
| 2–3 | 44 (26.83%) | 22 (26.83%) | 22 (26.83%) | >0.9999 |
| 4–5 | 6 (3.66%) | 3 (3.66%) | 3 (3.66%) | >0.9999 |
| Gender | 0.6337 | |||
| Female | 67 (40.85%) | 35 (42.68%) | 32 (39.02%) | |
| Male | 97 (59.15%) | 47 (57.32%) | 50 (60.98%) | |
| Age (y/o) | 60.96 ± 18.22 | 60.77 ± 18.70 | 61.15 ± 17.84 | 0.5398 |
| Smoking history | 0.1290 | |||
| Yes | 51 (31.09%) | 21 (25.61%) | 30 (36.59%) | |
| Never | 113 (68.91%) | 61 (74.39%) | 52 (63.41%) | |
| Season | 0.0265 * | |||
| Cold | 96 (58.54%) | 55 (67.07%) | 41 (50.00%) | |
| Warm | 68 (41.46%) | 27 (32.93%) | 41 (50.00%) | |
| COPD | 0.0169 * | |||
| Yes | 25 (15.25%) | 7 (8.54%) | 18 (21.95%) | |
| No | 139 (84.75%) | 75 (91.46%) | 64 (78.05%) | |
| Diabetes Mellitus | 0.7059 | |||
| Yes | 36 (21.96%) | 17 (20.73%) | 19 (23.17%) | |
| No | 128 (78.04%) | 65 (79.27%) | 63 (76.83%) | |
| Hypertension | 0.8738 | |||
| Yes | 67 (40.85%) | 33 (40.24%) | 34 (41.46%) | |
| No | 97 (59.15%) | 49 (59.76%) | 48 (58.54%) | |
| Hyperlipemia | 0.5021 | |||
| Yes | 52 (31.70%) | 28 (34.15%) | 24 (29.27%) | |
| No | 112 (68.30%) | 54 (65.85%) | 58 (70.73%) | |
| COVID-19 history | 0.1756 | |||
| Yes | 15 (9.15%) | 10 (12.20%) | 5 (6.10%) | |
| No | 149 (90.85%) | 72 (87.80%) | 77 (93.90%) | |
| TO-A (days) | 30.66 ± 79.05 | 11.48 ± 15.77 | 49.85 ± 107.6 | <0.0001 **** |
| TO-A ≥ 7 days | 117 (71.34%) | 53 (64.63%) | 64 (78.05%) | 0.0836 |
| TO-A > 30 days | 22 (13.42%) | 3 (3.66%) | 19 (23.17%) | 0.0004 *** |
| Anti-microbial therapy before admission | 0.0001 *** | |||
| Quinolones | 141 (86.60%) | 72 (87.80%) | 69 (84.15%) | 0.4999 |
| Semisynthetic penicillin | 22 (13.42%) | 8 (9.76%) | 14 (17.07%) | 0.2516 |
| Tetracycline | 4 (2.44%) | 2 (2.44%) | 2 (2.44%) | >0.9999 |
| Cephalosporin (I, II) | 26 (15.85%) | 3 (3.66%) | 23 (28.05%) | <0.0001 **** |
| Macrolides | 10 (6.10%) | 4 (4.88%) | 6 (7.32%) | 0.5140 |
| Neuraminidase inhibitor | 6 (3.66%) | 2 (2.44%) | 4 (4.88%) | 0.4055 |
| Anti-SARS-CoV-2 medicine # | 6 (3.66%) | 6 (7.32%) | 0 (0.00%) | 0.0126 * |
| Carbapenem | 9 (5.49%) | 0 (0.00%) | 9 (10.98%) | 0.0020 ** |
| SCAP | <0.0001 **** | |||
| Yes | 15 (9.15%) | 0 (0.00%) | 15 (18.29%) | |
| No | 149 (90.85%) | 82 (100.00%) | 67 (81.71%) | |
| CURB-65 | 0.9911 | |||
| 0 | 76 (46.34%) | 39 (47.56%) | 37 (45.12%) | 0.7541 |
| 1 | 58 (35.37%) | 29 (35.37%) | 29 (35.37%) | >0.9999 |
| 2 | 26 (15.85%) | 13 (15.85%) | 13 (15.85%) | >0.9999 |
| 3 | 3 (1.83%) | 1 (1.22%) | 2 (2.44%) | >0.9999 |
| 4 | 1 (0.61%) | 0 (0.00%) | 1 (1.22%) | >0.9999 |
| PSI | 0.1266 | |||
| I | 35 (21.34%) | 22 (26.83%) | 13 (15.85%) | 0.0863 |
| II | 128 (78.05%) | 60 (73.17%) | 68 (82.93%) | 0.1312 |
| III | 1 (0.61%) | 0 (0.00%) | 1 (1.22%) | >0.9999 |
| Outcome | 0.0011 ** | |||
| Cured/Improved | 154 (93.90%) | 82 (100.00%) | 72 (87.80%) | |
| Deteriorated/Death | 10 (6.10%) | 0 (0.00%) | 10 (12.20%) | |
| g-CAP (n = 82) | r-CAP (n = 82) | p Value | |
|---|---|---|---|
| WBC (×109/L) | 7.13 (5.94, 8.75) | 7.57 (5.83, 10.63) | 0.1610 |
| Lym (×109/L) | 1.27 (0.94,1.78) | 1.38 (1.01,1.70) | 0.7958 |
| Lym%WBC (%) | 19.35 ± 7.85 | 19.11 ± 9.09 | 0.8621 |
| B (/µL) | 139.00 (76.25, 209.30) | 147.00 (66.00, 219.30) | 0.7258 |
| B%Lym (%) | 12.39 (7.42,17.74) | 12.88 (7.32, 16.69) | 0.3836 |
| T (/µL) | 779.00 (533.00, 1125.00) | 918.00 (537.00, 1135.00) | 0.3446 |
| T% (%) | 70.12 (62.89, 76.37) | 72.34 (66.28, 76.95) | 0.0828 |
| CD4+ (/µL) | 457.00 (298.30, 669.50) | 546.50 (359.30, 751.50) | 0.0397 * |
| CD4+%Lym (%) | 41.50 ± 8.19 | 47.50 ± 8.53 | <0.0001 **** |
| CD8+ (/µL) | 257.50 (160.00, 412.50) | 252.50 (164.00, 372.30) | 0.5928 |
| CD8+%Lym (%) | 23.37 (17.84, 28.77) | 20.80 (16.52, 26.44) | 0.1196 |
| CD4+/CD8+ | 1.75 (1.30, 2.53) | 2.20 (1.70, 3.03) | 0.0033 ** |
| DNT (/µL) | 0.00 (0.00, 8.25) | 0.00 (0.00, 0.00) | 0.6496 |
| DNT%Lym (%) | 0.00 (0.00, 1.27) | 0.00 (0.00, 0.00) | 0.2565 |
| NK (/µL) | 178.00 (99.75, 259.40) | 164.50 (93.75, 243.30) | 0.2249 |
| NK%Lym (%) | 14.32 (10.08, 21.89) | 13.66 (8.58, 18.28) | 0.1000 |
| Mo (×109/L) | 0.45 (0.32, 0.61) | 0.48 (0.35, 0.61) | 0.6789 |
| Mo%WBC (%) | 6.15 (4.78, 87.60) | 6.35 (5.18, 7.83) | 0.7941 |
| g-CAP (n = 82) | r-CAP (n = 82) | p Value | |
|---|---|---|---|
| TC (mmol/L) | 4.08 (3.62, 4.71) | 4.05 (3.16, 4.74) | 0.0428 * |
| TG (mmol/L) | 1.25 (0.97, 1.95) | 1.16 (0.79, 1.60) | 0.0056 ** |
| LDL-C (mmol/L) | 2.65 ± 0.70 | 2.58 ± 0.91 | 0.5849 |
| HDL-C (mmol/L) | 0.93 (0.79, 1.14) | 0.96 (0.77, 1.19) | 0.9804 |
| Na+ (mmol/L) | 138.00 (135.80, 140.00) | 139.00 (136.00, 141.00) | 0.0217 * |
| K+ (mmol/L) | 3.86 ± 0.34 | 3.87 ± 0.38 | 0.7771 |
| Cl− (mmol/L) | 103.00 (101.00, 105.00) | 105.00 (102.00, 107.00) | 0.0740 |
| UA (µmol/L) | 290.50 (241.50, 355.50) | 293.00 (220.50, 375.50) | 0.7888 |
| Fe (µmol/L) | 7.95 (4.97, 11.88) | 6.30 (3.70, 13.80) | 0.9076 |
| TCa2+ (mmol/L) | 2.24 (2.16, 2.34) | 2.20 (2.11, 2.34) | 0.0848 |
| CCa2+ (mmol/L) | 2.27 (2.21, 2.31) | 2.29 (2.21, 2.33) | 0.3547 |
| FCa2+ (mmol/L) | 1.08 (1.05, 1.11) | 1.10 (1.06, 1.13) | 0.0337 * |
| Mg2+ (mmol/L) | 0.86 ± 0.08 | 0.86 ± 0.09 | 0.9851 |
| CRP (mg/L) | 18.03 (4.85, 59.31) | 41.06 (5.39, 106.2) | 0.0334 * |
| Variate | Univariate OR (95%CI) | p Value | Multivariate OR (95%CI) | p Value |
|---|---|---|---|---|
| CCI | 1.000 (0.497, 2.011) | >0.9999 | 0.205 (0.031, 1.265) | 0.0909 |
| Gender | 1.164 (0.624, 2.176) | 0.6338 | 0.615 (0.137, 2.611) | 0.5138 |
| Age (y/o) | 1.001 (0.984, 1.018) | 0.894 | 0.986 (0.950, 1.022) | 0.442 |
| Smoking history | 1.676 (0.862, 3.303) | 0.1305 | 0.346 (0.057, 1.848) | 0.2253 |
| Season | 2.037 (1.088, 3.863) | 0.0274 * | 5.341 (1.305, 27.110) | 0.0281 * |
| COPD | 3.013 (1.229, 8.172) | 0.0207 * | 62.280 (5.909, 1197.00) | 0.0019 ** |
| Diabetes mellitus | 1.153 (0.549, 2.436) | 0.7061 | 6.411 (1.022, 48.450) | 0.0551 |
| Hypertension | 1.052 (0.564, 1.964) | 0.8738 | 1.385 (0.267, 7.488) | 0.6980 |
| Hyperlipemia | 0.798 (0.411, 1.542) | 0.5024 | 3.092 (0.591, 20.2) | 0.2022 |
| COVID-19 history | 0.468 (0.140, 1.382) | 0.1836 | 0.276 (0.00998, 4.916) | 0.4031 |
| TO-A (days) | 1.036 (1.015, 1.063) | 0.0029 ** | 1.037 (1.008, 1.077) | 0.0354 * |
| WBC (×109/L) | 1.059 (0.959, 1.174) | 0.2658 | 1.996 (1.027, 4.458) | 0.0621 |
| Lym (×109/L) | 0.865 (0.574, 1.176) | 0.4044 | 0.080 (0.00069, 1.769) | 0.2428 |
| Lym%WBC (%) | 0.997 (0.961, 1.034) | 0.8564 | 1.525 (1.131, 2.195) | 0.0122 * |
| B (/µL) | 0.999 (0.996, 1.002) | 0.5082 | 0.986 (0.969, 1.001) | 0.0663 |
| B%Lym (%) | 0.979 (0.935, 1.024) | 0.3555 | 1.146 (0.878, 1.535) | 0.3250 |
| T (/µL) | 1.000 (0.9996, 1.001) | 0.4121 | 0.9997 (0.981, 1.006) | 0.9450 |
| T% (%) | 1.030 (0.994, 1.069) | 0.1111 | 0.386 (0.202, 0.650) | 0.0012 ** |
| CD4+ (/µL) | 1.001 (1.000, 1.002) | 0.0288 * | 1.002 (0.994, 1.023) | 0.7028 |
| CD4+%Lym (%) | 1.093 (1.049, 1.143) | <0.0001 **** | 3.044 (1.766, 6.016) | 0.0003 *** |
| CD8+ (/µL) | 1.000 (0.999, 1.001) | 0.7572 | 1.002 (1.000, 1.027) | 0.5727 |
| CD8+%Lym (%) | 0.966 (0.927, 1.004) | 0.0834 | 2.621 (1.561, 4.852) | 0.0006 *** |
| CD4+/CD8+ | 1.440 (1.095, 1.969) | 0.0142 * | 1.711 (0.659, 4.471) | 0.2516 |
| DNT (/µL) | 1.001 (0.995, 1.007) | 0.8467 | 0.978 (0.917, 1.033) | 0.4465 |
| DNT%Lym (%) | 1.004 (0.942, 1.072) | 0.9082 | 2.188 (1.071, 5.18) | 0.0420 * |
| NK (/µL) | 0.999 (0.996 1.001) | 0.2628 | 0.999 (0.983, 1.016) | 0.8681 |
| NK%Lym (%) | 1.000 (0.980, 1.021) | 0.9892 | 1.036 (0.998, 1.17) | 0.1270 |
| Mo (/µL) | 0.838 (0.385, 1.235) | 0.4740 | 0.589 (0.193, 1.624) | 0.3145 |
| Mo%WBC (%) | 0.983 (0.916, 1.03) | 0.5233 | 0.929 (0.838, 1.02) | 0.1364 |
| TC (mmol/L) | 0.788 (0.588, 1.034) | 0.0962 | 0.0086 (0.0001, 0.2967) | 0.0173 * |
| TG (mmol/L) | 0.641 (0.426, 0.9025) | 0.0188 * | 0.752 (0.313, 1.655) | 0.4887 |
| LDL-C (mmol/L) | 0.896 (0.609, 1.311) | 0.572 | 178.500 (4.435, 17,773.00) | 0.0131 * |
| HDL-C (mmol/L) | 0.864 (0.312, 2.371) | 0.776 | 9.349 (0.105, 1385.00) | 0.3427 |
| Na+ (mmol/L) | 1.119 (1.022, 1.239) | 0.0231 * | 1.429 (1.084, 2.005) | 0.0206 * |
| K+ (mmol/L) | 1.136 (0.485, 2.682) | 0.7684 | 0.430 (0.053, 3.052) | 0.4084 |
| Cl- (mmol/L) | 1.040 (0.988, 1.112) | 0.1769 | 0.956 (0.832, 1.088) | 0.4871 |
| UA (µmol/L) | 0.9997 (0.997, 1.002) | 0.8134 | 1.007 (0.9998, 1.015) | 0.0700 |
| Fe (µmol/L) | 1.005 (0.955, 1.057) | 0.858 | 1.061 (0.919, 1.230) | 0.415 |
| TCa2+ (mmol/L) | 0.355 (0.047, 2.229) | 0.2871 | 0.059 (0.000022, 130.8) | 0.4712 |
| CCa2+ (mmol/L) | 3.102 (0.122, 86.89) | 0.4953 | 0.0189 (0.0000015, 181.7) | 0.3970 |
| FCa2+ (mmol/L) | 2255.00 (4.308, 2,154,700) | 0.0206 * | 1,917,152 (25.37, 1,026,463,384,926) | 0.0170 * |
| Mg2+ (mmol/L) | 0.964 (0.022, 42.420) | 0.9847 | 493.10 (0.084, 5,552,542) | 0.1699 |
| CRP (mg/L) | 1.006 (1.001, 1.011) | 0.0250 * | 1.022 (1.004, 1.043) | 0.0230 * |
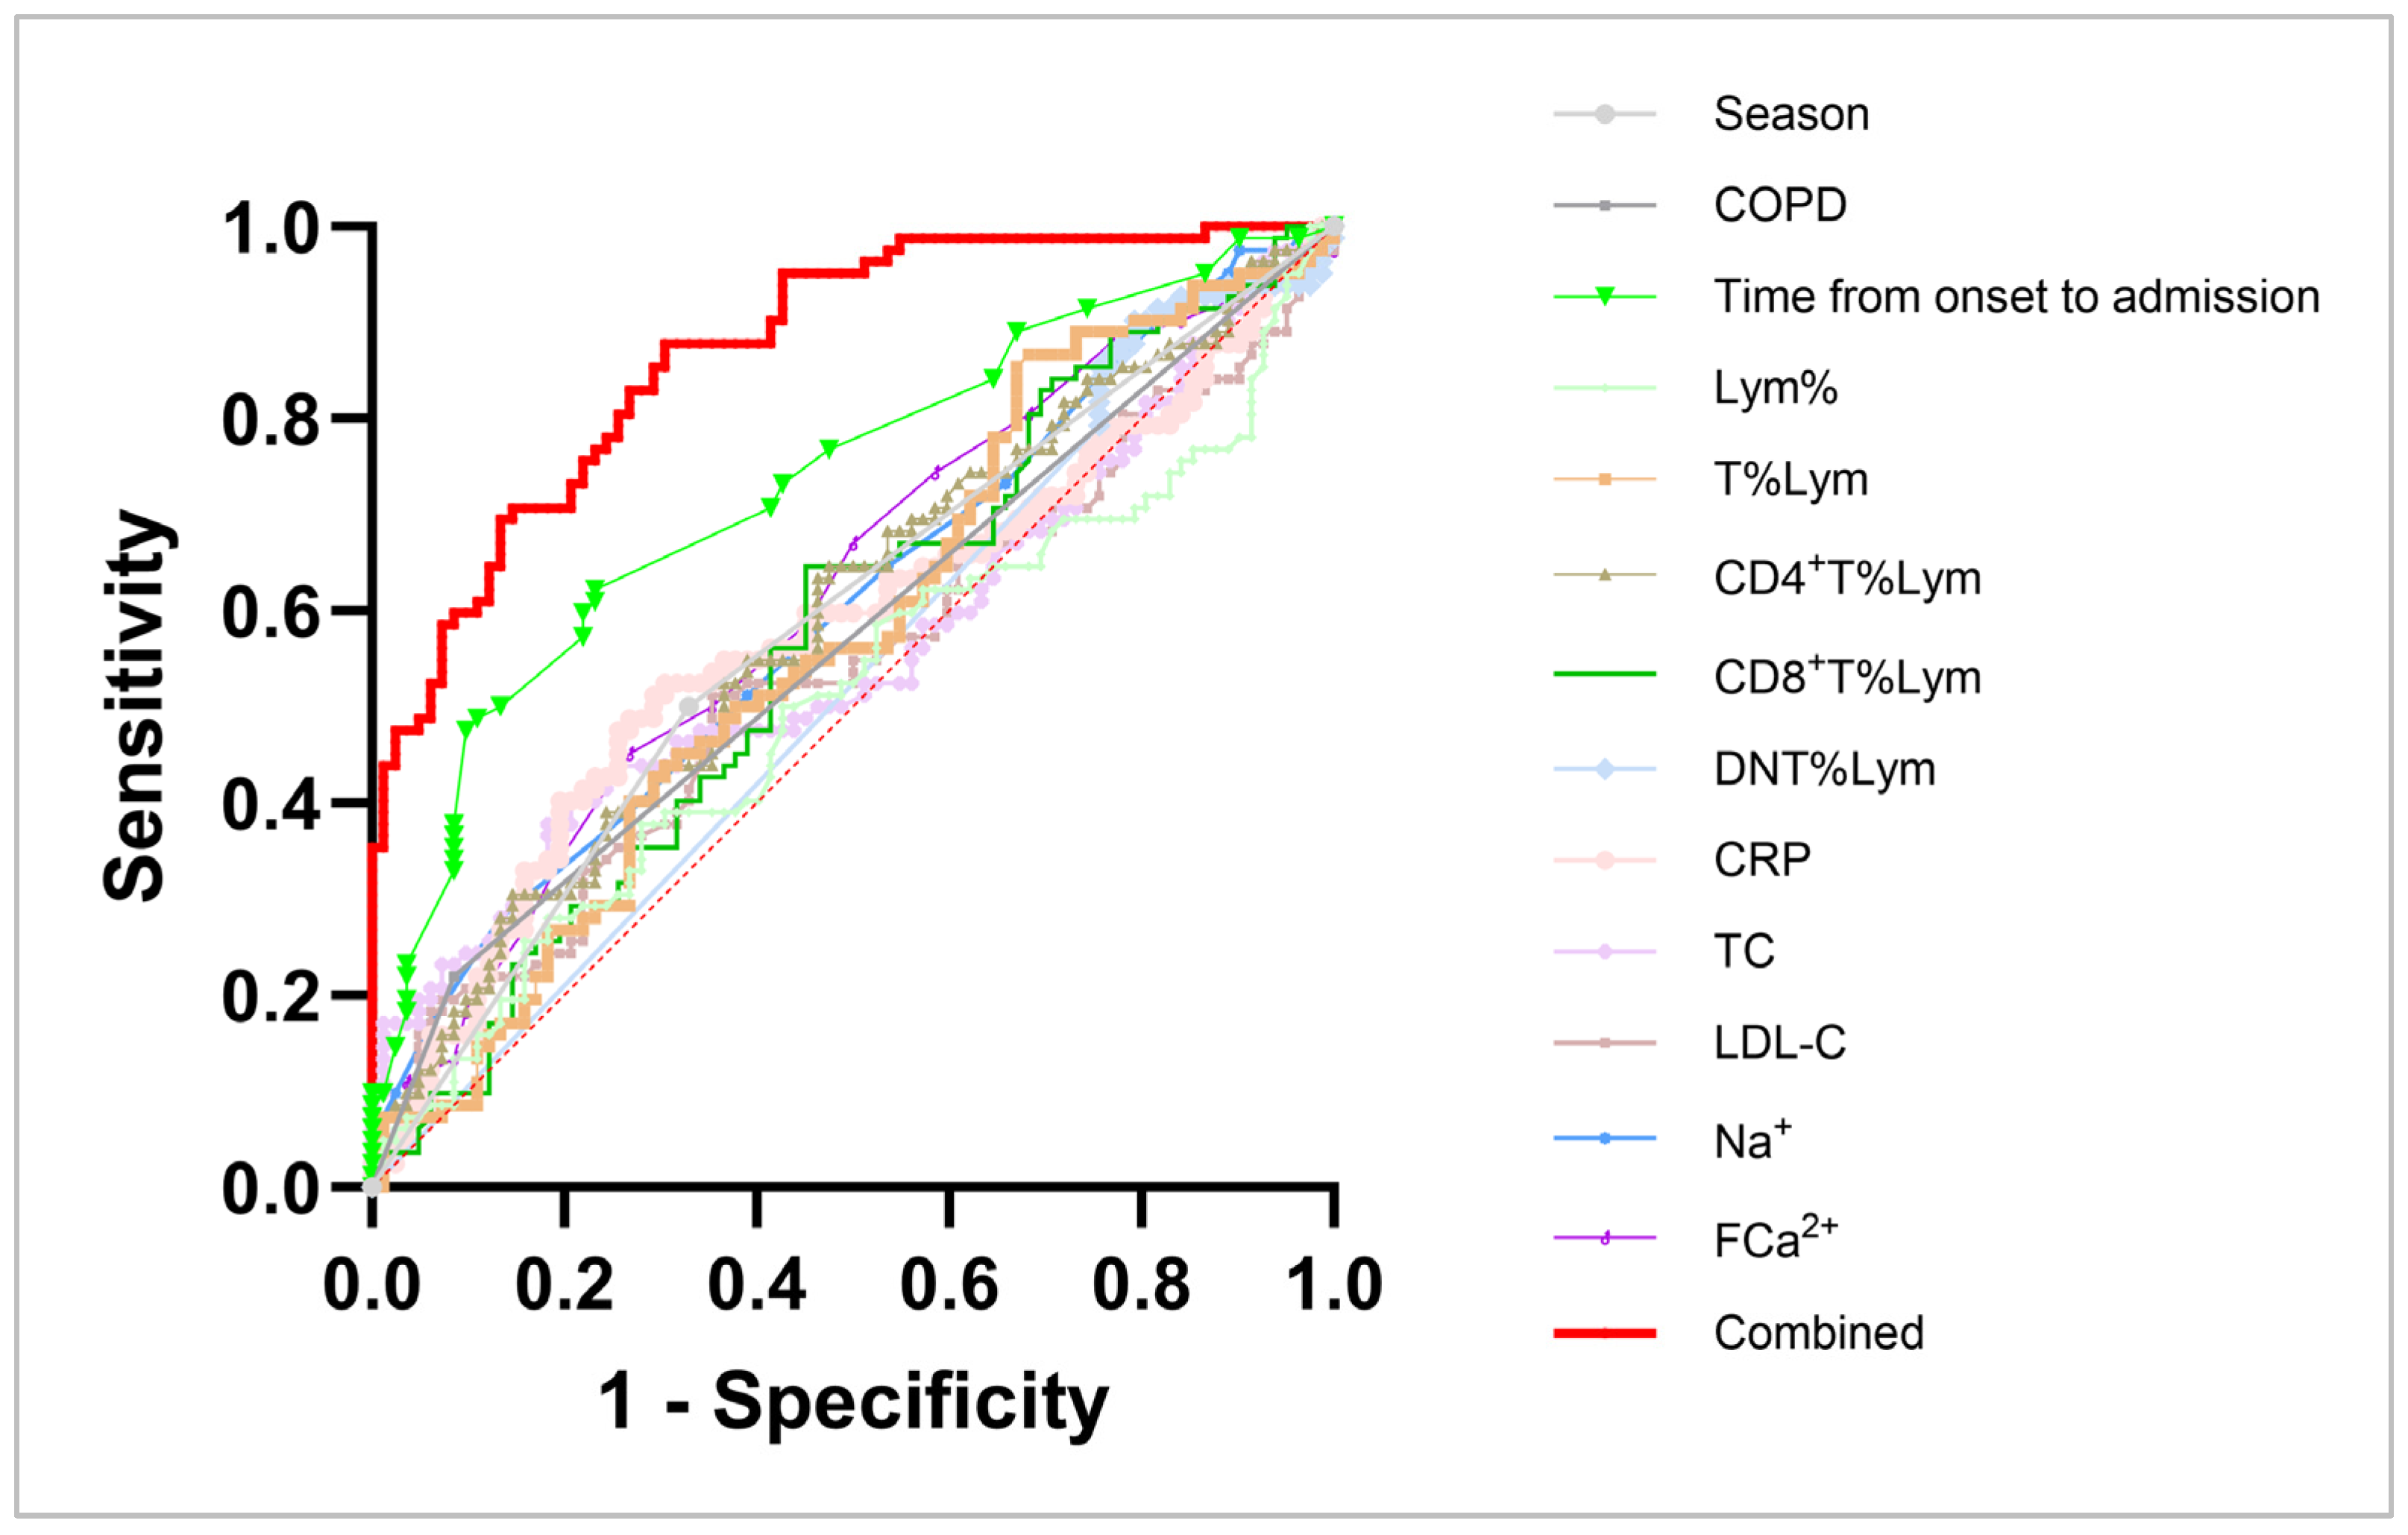
| Variate | Sensitivity | Specificity | AUC | p Value | Pseudo R Squared | Hosmer- Lemeshow |
|---|---|---|---|---|---|---|
| Season | 50.00% | 67.07% | 0.5854 | 0.0591 | 0.0300 | >0.9999 |
| COPD | 21.95% | 91.46% | 0.5671 | 0.1380 | 0.0348 | >0.9999 |
| TO-A | 48.78% | 89.02% | 0.7320 | <0.0001 **** | 0.1241 | 0.0352 * |
| Lym% | 53.66% | 48.78% | 0.5071 | 0.8759 | 0.0002 | 0.4904 |
| T%Lym | 56.10% | 52.44% | 0.5709 | 0.1171 | 0.0158 | 0.4493 |
| CD4+ T%Lym | 63.41% | 62.20% | 0.6881 | <0.0001 **** | 0.1153 | 0.4338 |
| CD8+ T%Lym | 64.63% | 53.66% | 0.5699 | 0.1222 | 0.0186 | 0.4364 |
| DNT%Lym | 79.27% | 24.39% | 0.5247 | 0.5851 | 8.009 × 10⁻⁵ | 0.0640 |
| CRP | 45.12% | 74.39% | 0.5773 | 0.0872 | 0.0326 | 0.6439 |
| TC | 52.44% | 48.78% | 0.5608 | 0.1791 | 0.0173 | 0.0406 * |
| LDL-C | 52.44% | 50.00% | 0.5378 | 0.4035 | 0.0020 | 0.2429 |
| Na+ | 64.63% | 46.34% | 0.5973 | 0.0314 * | 0.0391 | 0.9454 |
| FCa2+ | 58.54% | 54.88% | 0.6096 | 0.0154 | 0.0350 | 0.9655 |
| Combined # | 75.61% | 76.83% | 0.8711 | <0.0001 **** | 0.4235 | 0.7385 |
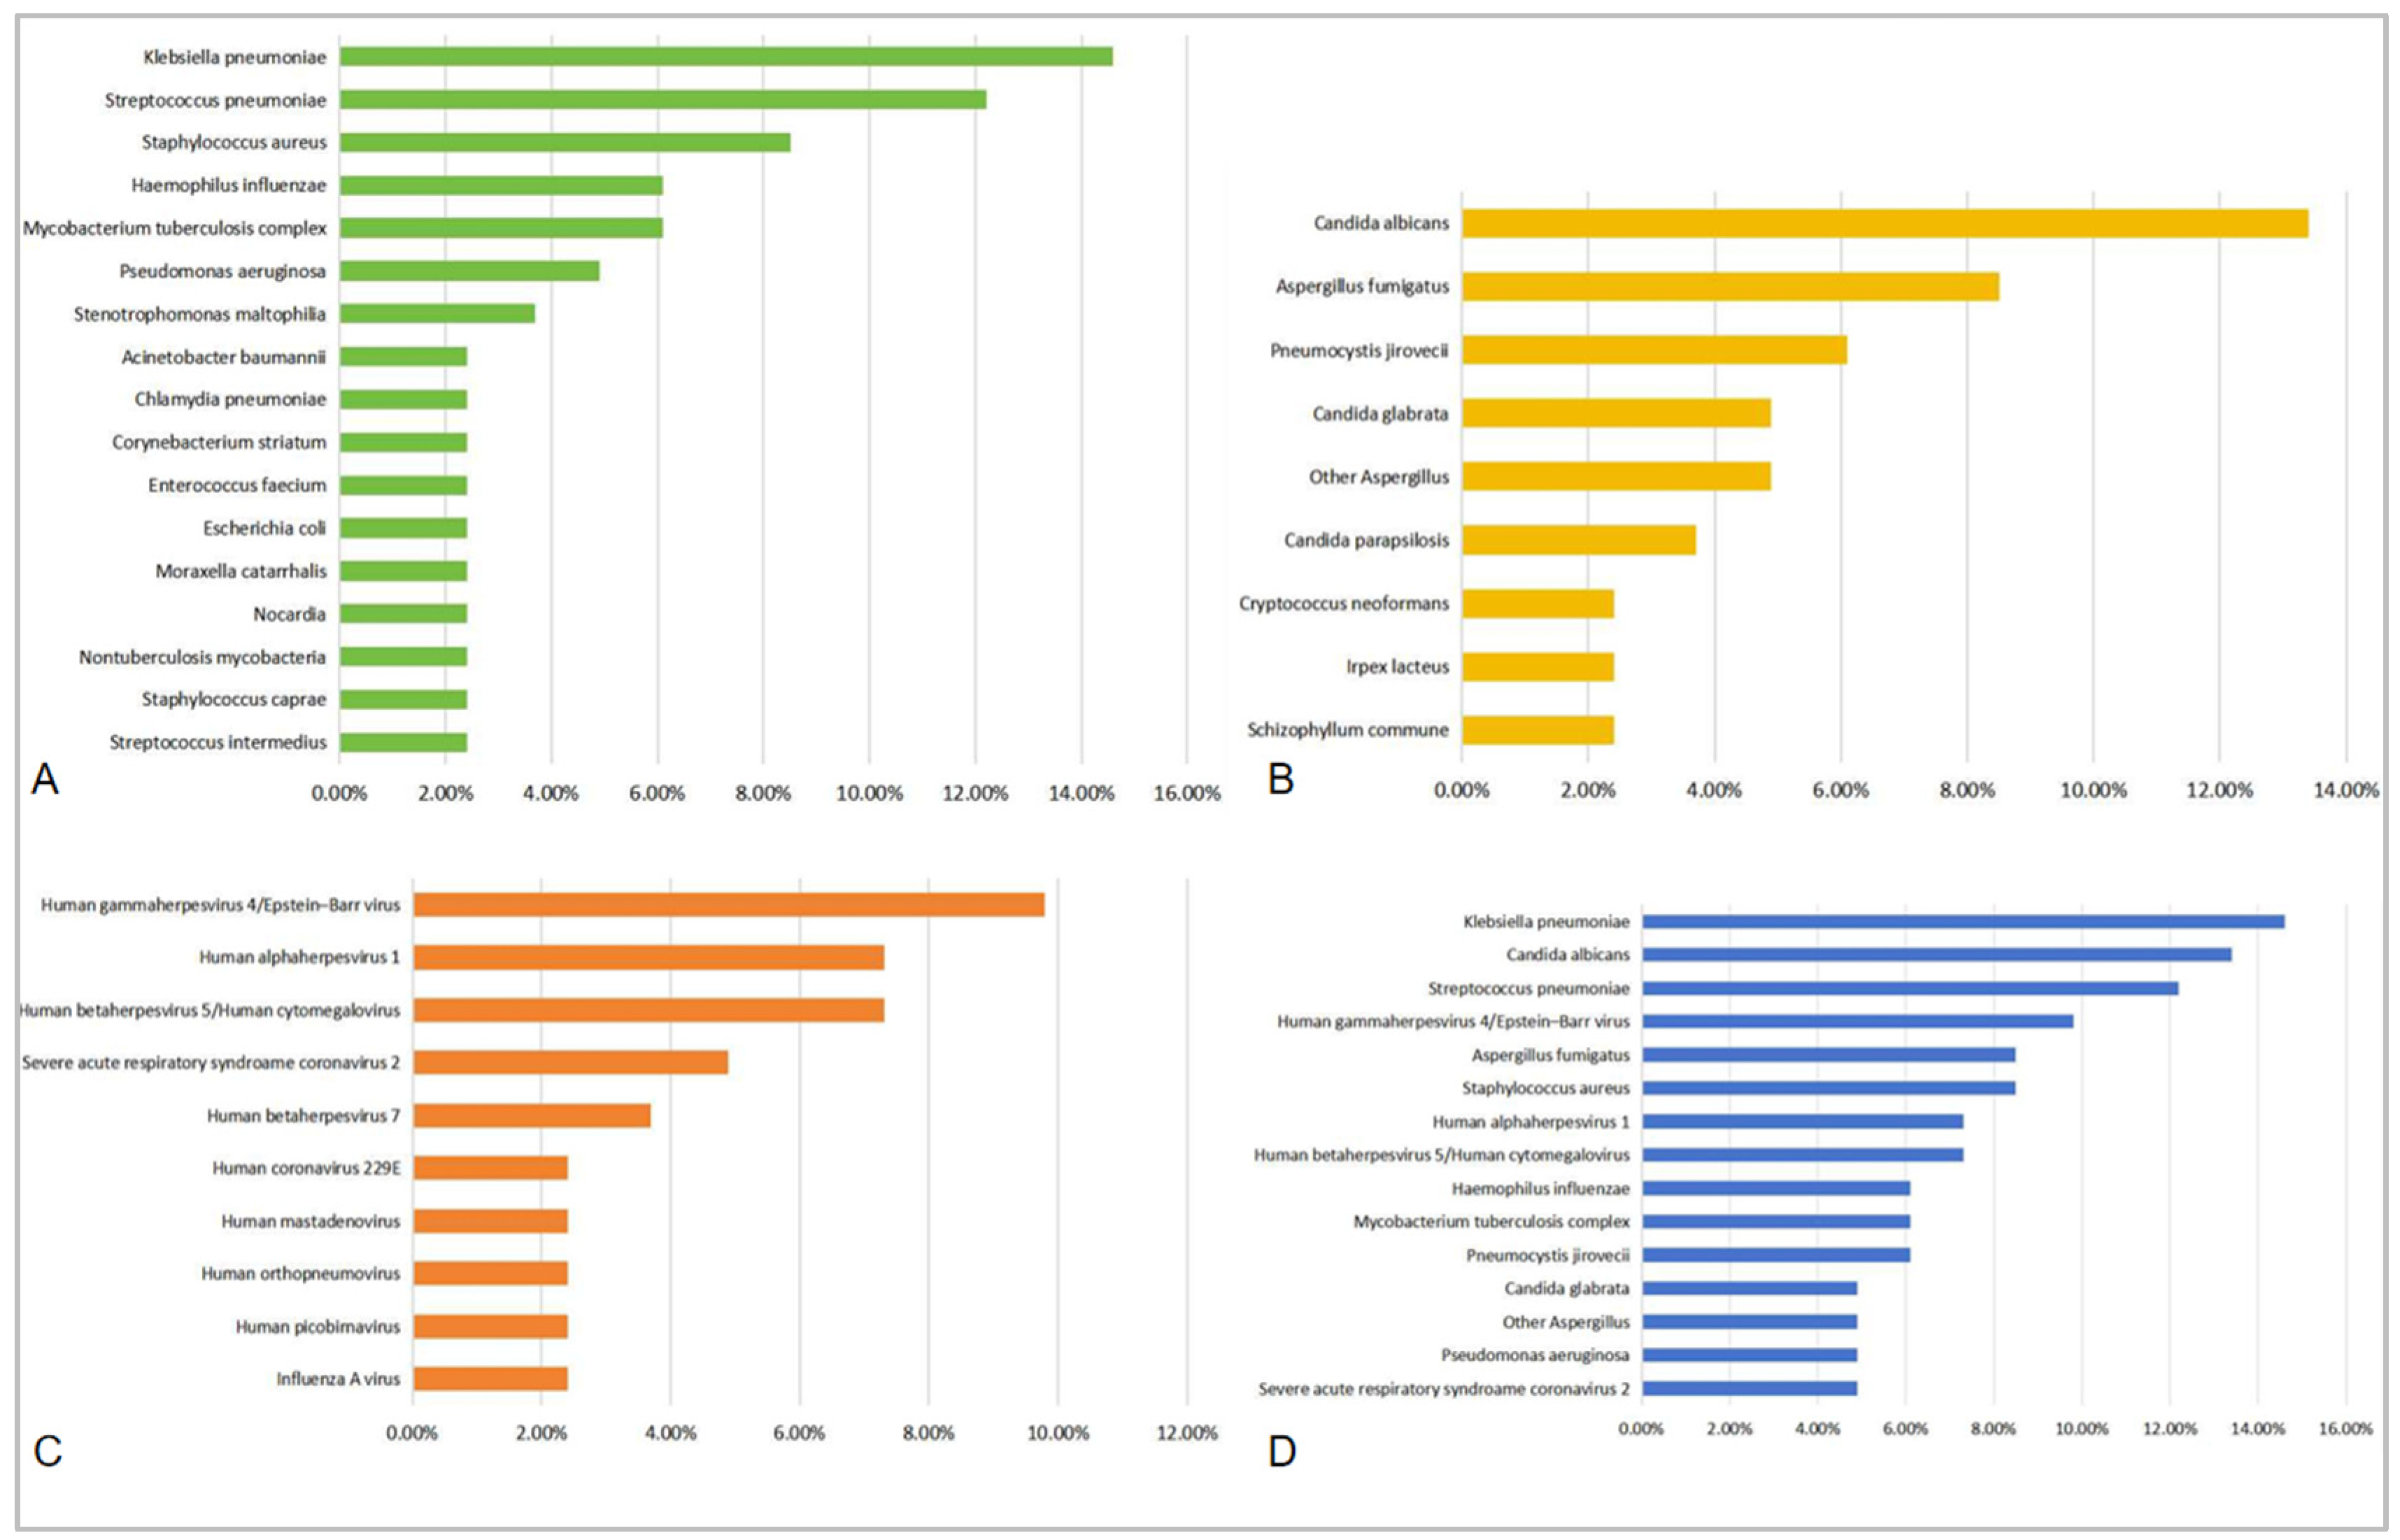
| Bacterium (Top 10) | Detection Rate (%) | Fungus (Top 10) | Detection Rate (%) |
|---|---|---|---|
| Klebsiella pneumoniae | 14.6% | Candida albicans | 13.4% |
| Streptococcus pneumoniae | 12.2% | Aspergillus fumigatus | 8.5% |
| Staphylococcus aureus | 8.5% | Pneumocystis jirovecii | 6.1% |
| MRSA | 2.4% | ||
| Haemophilus influenzae | 6.1% | Candida glabrata | 4.9% |
| Mycobacterium tuberculosis complex | 6.1% | Other Aspergillus # | 4.9% |
| Pseudomonas aeruginosa | 4.9% | Candida parapsilosis | 3.7% |
| Stenotrophomonas maltophilia | 3.7% | Irpex lacteus | 2.4% |
| Acinetobacter baumannii | 2.4% | Schizophyllum commune | 2.4% |
| Escherichia coli | 2.4% | Cryptococcus neoformans | 2.4% |
| Chlamydia pneumoniae | 2.4% | ||
| Moraxella catarrhalis | 2.4% | ||
| Staphylococcus caprae | 2.4% | ||
| Enterococcus faecium | 2.4% | ||
| Corynebacterium striatum | 2.4% | ||
| Streptococcus intermedius | 2.4% | ||
| Nocardia ## | 2.4% | ||
| Nontuberculosis mycobacteria | 2.4% |
| Virus (Top 10) | Detection Rate (%) | All Pathogens (Top 15) | Detection Rate (%) |
|---|---|---|---|
| Human gammaherpesvirus 4/ Epstein-Barr virus | 9.8% | Klebsiella pneumoniae | 14.6% |
| Human alphaherpesvirus 1/Herpes simplex virus type 1 | 7.3% | Candida albicans | 13.4% |
| Human betaherpesvirus 5/ Human cytomegalovirus | 7.3% | Streptococcus pneumoniae | 12.2% |
| Severe acute respiratory syndroame coronavirus 2 | 4.9% | Human gammaherpesvirus 4/Epstein-Barr virus | 9.8% |
| Human betaherpesvirus 7 | 3.7% | Staphylococcus aureus | 8.5% |
| Human picobirnavirus | 2.4% | Aspergillus fumigatus | 8.5% |
| Influenza A virus | 2.4% | Human alphaherpesvirus 1 | 7.3% |
| Human coronavirus 229E | 2.4% | Human betaherpesvirus 5/Human cytomegalovirus | 7.3% |
| Human orthopneumovirus | 2.4% | Haemophilus influenzae | 6.1% |
| Human mastadenovirus | 2.4% | Mycobacterium tuberculosis complex | 6.1% |
| Pneumocystis jirovecii | 6.1% | ||
| Pseudomonas aeruginosa | 4.9% | ||
| Candida glabrata | 4.9% | ||
| Other Aspergillus | 4.9% | ||
| Severe acute respiratory syndroame coronavirus 2 | 4.9% |
Disclaimer/Publisher’s Note: The statements, opinions and data contained in all publications are solely those of the individual author(s) and contributor(s) and not of MDPI and/or the editor(s). MDPI and/or the editor(s) disclaim responsibility for any injury to people or property resulting from any ideas, methods, instructions or products referred to in the content. |
© 2025 by the authors. Licensee MDPI, Basel, Switzerland. This article is an open access article distributed under the terms and conditions of the Creative Commons Attribution (CC BY) license (https://creativecommons.org/licenses/by/4.0/).
Share and Cite
Zhang, J.; Hu, X.; Aili, A.; Pan, L.; Xue, X.; Chen, X. A Lymphocyte Subset-Based Prediction Model for Refractory Community-Acquired Pneumonia in Immunocompetent Patients. Diagnostics 2025, 15, 1627. https://doi.org/10.3390/diagnostics15131627
Zhang J, Hu X, Aili A, Pan L, Xue X, Chen X. A Lymphocyte Subset-Based Prediction Model for Refractory Community-Acquired Pneumonia in Immunocompetent Patients. Diagnostics. 2025; 15(13):1627. https://doi.org/10.3390/diagnostics15131627
Chicago/Turabian StyleZhang, Jingyuan, Xinyu Hu, Ailifeila Aili, Lei Pan, Xinying Xue, and Xiaolan Chen. 2025. "A Lymphocyte Subset-Based Prediction Model for Refractory Community-Acquired Pneumonia in Immunocompetent Patients" Diagnostics 15, no. 13: 1627. https://doi.org/10.3390/diagnostics15131627
APA StyleZhang, J., Hu, X., Aili, A., Pan, L., Xue, X., & Chen, X. (2025). A Lymphocyte Subset-Based Prediction Model for Refractory Community-Acquired Pneumonia in Immunocompetent Patients. Diagnostics, 15(13), 1627. https://doi.org/10.3390/diagnostics15131627