


The Importance of Magnetic Resonance Enterography in Monitoring Inflammatory Bowel Disease: A Review of Clinical Significance and Current Challenges

Abstract
1. Introduction
2. Imaging Methods Used in Inflammatory Bowel Diseases
- Colonoscopyremains the gold standard for diagnosis, allowing for direct visualization of the mucosa, biopsy sampling [9], and treatment of some complications. It is superior to other imaging methods in highlighting superficial erosions and ulcerations, mucosal hyperemia, and loss of vascular pattern and detecting colonic polyps [2]. Despite its advantages, it has certain limitations: it is invasive, can be uncomfortable for the patient, and does not allow for visualization of the entire small intestine, requiring the use of additional imaging techniques such as CT, intestinal ultrasound, and MRE [14]. However, a colonoscopic evaluation is necessary if patients have persistent symptoms despite normal MRE results [15]. Colonoscopy also cannot evaluate extraintestinal lesions and may limit the penetration of the endoscope in the presence of stenosis (stricture) [16]. Additionally, during the examination, lesions located in hidden parts of the colon may be missed [17].
- Video capsule endoscopy is useful in exploring the small intestine, with high sensitivity for early mucosal changes, such as small aphthous lesions [18]. It is also indicated in patients with suspected Crohn’s disease and normal endoscopic results [19,20]. Recent studies have shown that video capsule endoscopy is superior to MRE in detecting lesions located in the proximal region of the small intestine [19]. However, it does not allow for in-depth evaluation of the intestinal wall and carries a risk of capsule retention in stenoses and intestinal obstructions.
- Intestinal ultrasound is a non-invasive, accessible, radiation-free method that does not require prior preparation, except for fasting a few hours before the examination [8]. Firstly, it allows for the detection of wall thickening, with a value over 3 mm considered pathological [8] and a measurement over 7 mm indicating an unfavorable prognosis, with surgical indication within the following year [21]. At the same time, the use of color Doppler or contrast medium (CEUS) allows for evaluation of both the wall perfusion and the intestinal inflammatory status, as well as the presence of complications (fistulas, abscesses, or inflammatory lesions), visualized as hypo- or hyperechogenic masses [8]. An increased color Doppler signal is observed in cases of transmural edema present in the active form of Crohn’s disease, as evidenced by disrupted mural stratification [22]. Intestinal ultrasound is also useful in detecting the thickening of peri-visceral adipose tissue or fat wrapping [23], as evidenced by increased echogenicity at this level, representing a sign of active disease [22]. Ultrasound images may be unsatisfactory and limited in obese patients, body habitus, or significant abdominal distension that may obscure the intestinal region [22].
- Computed tomography enterography provides detailed images of both the small intestine—highlighting intestinal wall thickening, hyperemia, submucosal fat deposition, and lymphadenopathy [24,25]—and of extraintestinal, perineural lesions, with greater accuracy in terms of the degree and severity of the disease [26], differentiating the active form from the fibrotic one. At the same time, this imaging technique is frequently used for the detection of complications of inflammatory bowel diseases (fistulas, perforations, and abscesses) [24,25] and in emergencies, such as sepsis or penetrating intra-abdominal lesions requiring surgical intervention [13]. Other advantages of CTE include a shorter scanning time, reduced costs compared to MRE [27], and suitability for patients with contraindications to MRE [13], those who are allergic to gadolinium-based contrast media [8], those who were claustrophobic in prior MR exams, and those with acute symptoms [13]. The main disadvantage is exposure to ionizing radiation, which limits its repeated use in young patients [28,29]. The radiation dose used in CTE for the adult population is between 10 and 20 mSv (milisievert) [30], while that in the pediatric population is between 2.9 and 4 mSv [31]. New protocols propose reducing the radiation dose in adults to 5–7 mSv and the noise produced by CTE during the investigation [32]. At the same time, recent studies have focused their interest on artificial intelligence and radiomics. Li et al. have demonstrated that a radiomics model (RM) based on CTE accurately describes intestinal fibrosis in patients with CD [33].
- Magnetic Resonance Enterography (MRE) is essential in the evaluation of inflammatory bowel disease, providing simultaneously detailed images of the intestinal wall and adjacent structures and inflammatory lesions [22], differentiating inflammation from fibrosis in both the small and large intestine submucosa and the perineal area [34,35]. MRE also has high accuracy in staging small bowel inflammatory bowel disease [29], in monitoring treatment response and relapse [22], and in detecting and classifying isolated forms of colonic involvement [36]. This imaging modality is preferred in complex cases with evidence of penetrating, fistulizing, and stenosing lesions [22], as well as in fistulas and perianal sepsis [13]. Fat smudging, fecal sign, fluid level, gaseous distension, comb sign (related vascular congestion), and lymphadenopathy are the elements mainly visualized/detected by MRE [2]. Another advantage—perhaps the most important—is that MRE is the safest and most cost-effective cross-sectional imaging method that can be used to evaluate the activity of Crohn’s disease and ulcerative colitis in both adults and young people [37], without the use of ionizing radiation [2]. Taylor et al. have shown that MRE has a sensitivity of 97% for detecting inflammatory bowel diseases, over 90% for fibro-inflammatory strictures, and specificity of over 95% [29].
3. Technical Principles of MRE
3.1. Standardized Protocol for MRE
3.2. Relevant Imaging Features in Magnetic Resonance Enterography
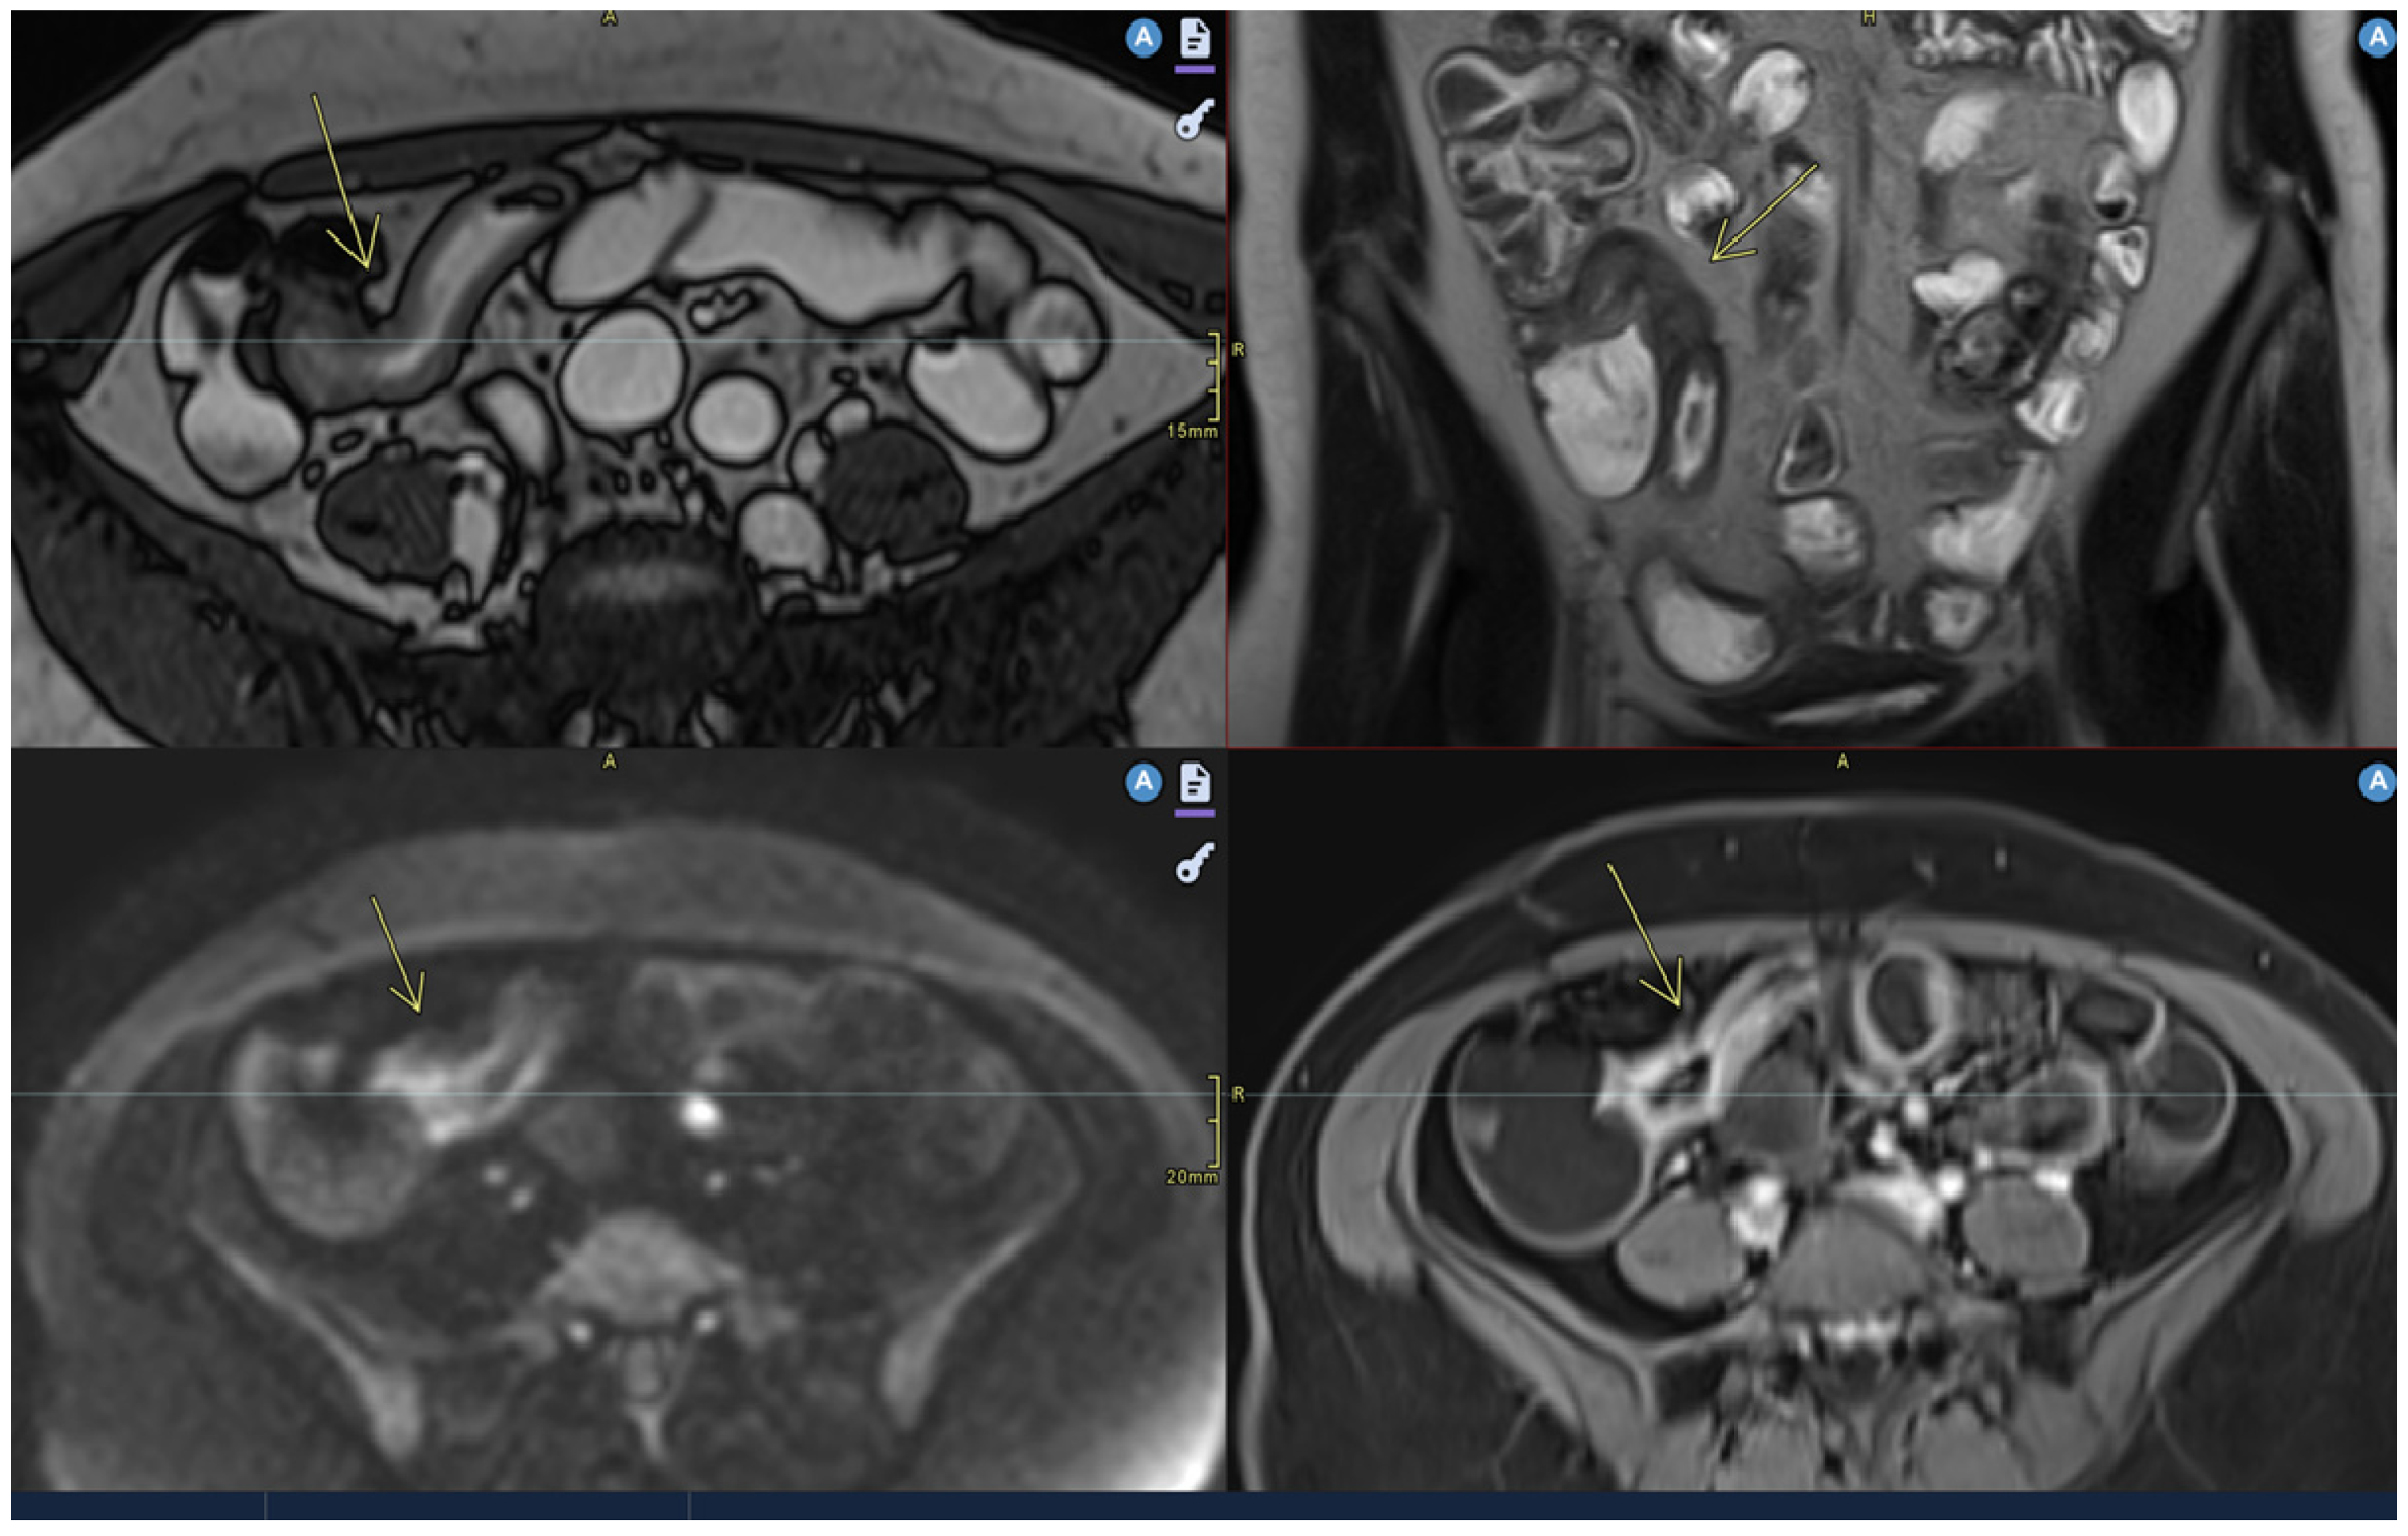
- Mural thickening:
- Can be mild (<5 mm), moderate (<9 mm),orsevere (>10 mm).
- Commonly occurs in active areas of inflammation (Figure 1).
- Mural hyperenhancement
- Asymmetric distribution in CD or continuous and concentric distribution in extensive ulcerative colitis [43].
- Stratified uptake: “double layer” (submucosa is thickened by edema and inflammation) or “trilaminar layer” (when serosa is also involved) [8].
- Homogeneous, hypovascular uptake in (chronic) fibrosis.
- Correlates with clinical and biological activity scores [43].
- Evaluated on post-gadolinium T1 fat-sat sequences, in dynamics [48].
- Intramural edema
- Is detected as T2 hyperintense signals.
- Restricted diffusion
- DWI hypersignal + low ADC in acute inflammation.
- Ulceration
- Mesenteric lymphadenopathy
- Comb sign
- Fibrofatty proliferation
- Also called “creeping fat”.
- Fistulas
- Abscesses
- Abscesses are found in the abdominal cavity, intestinal wall, or perianal area [8].
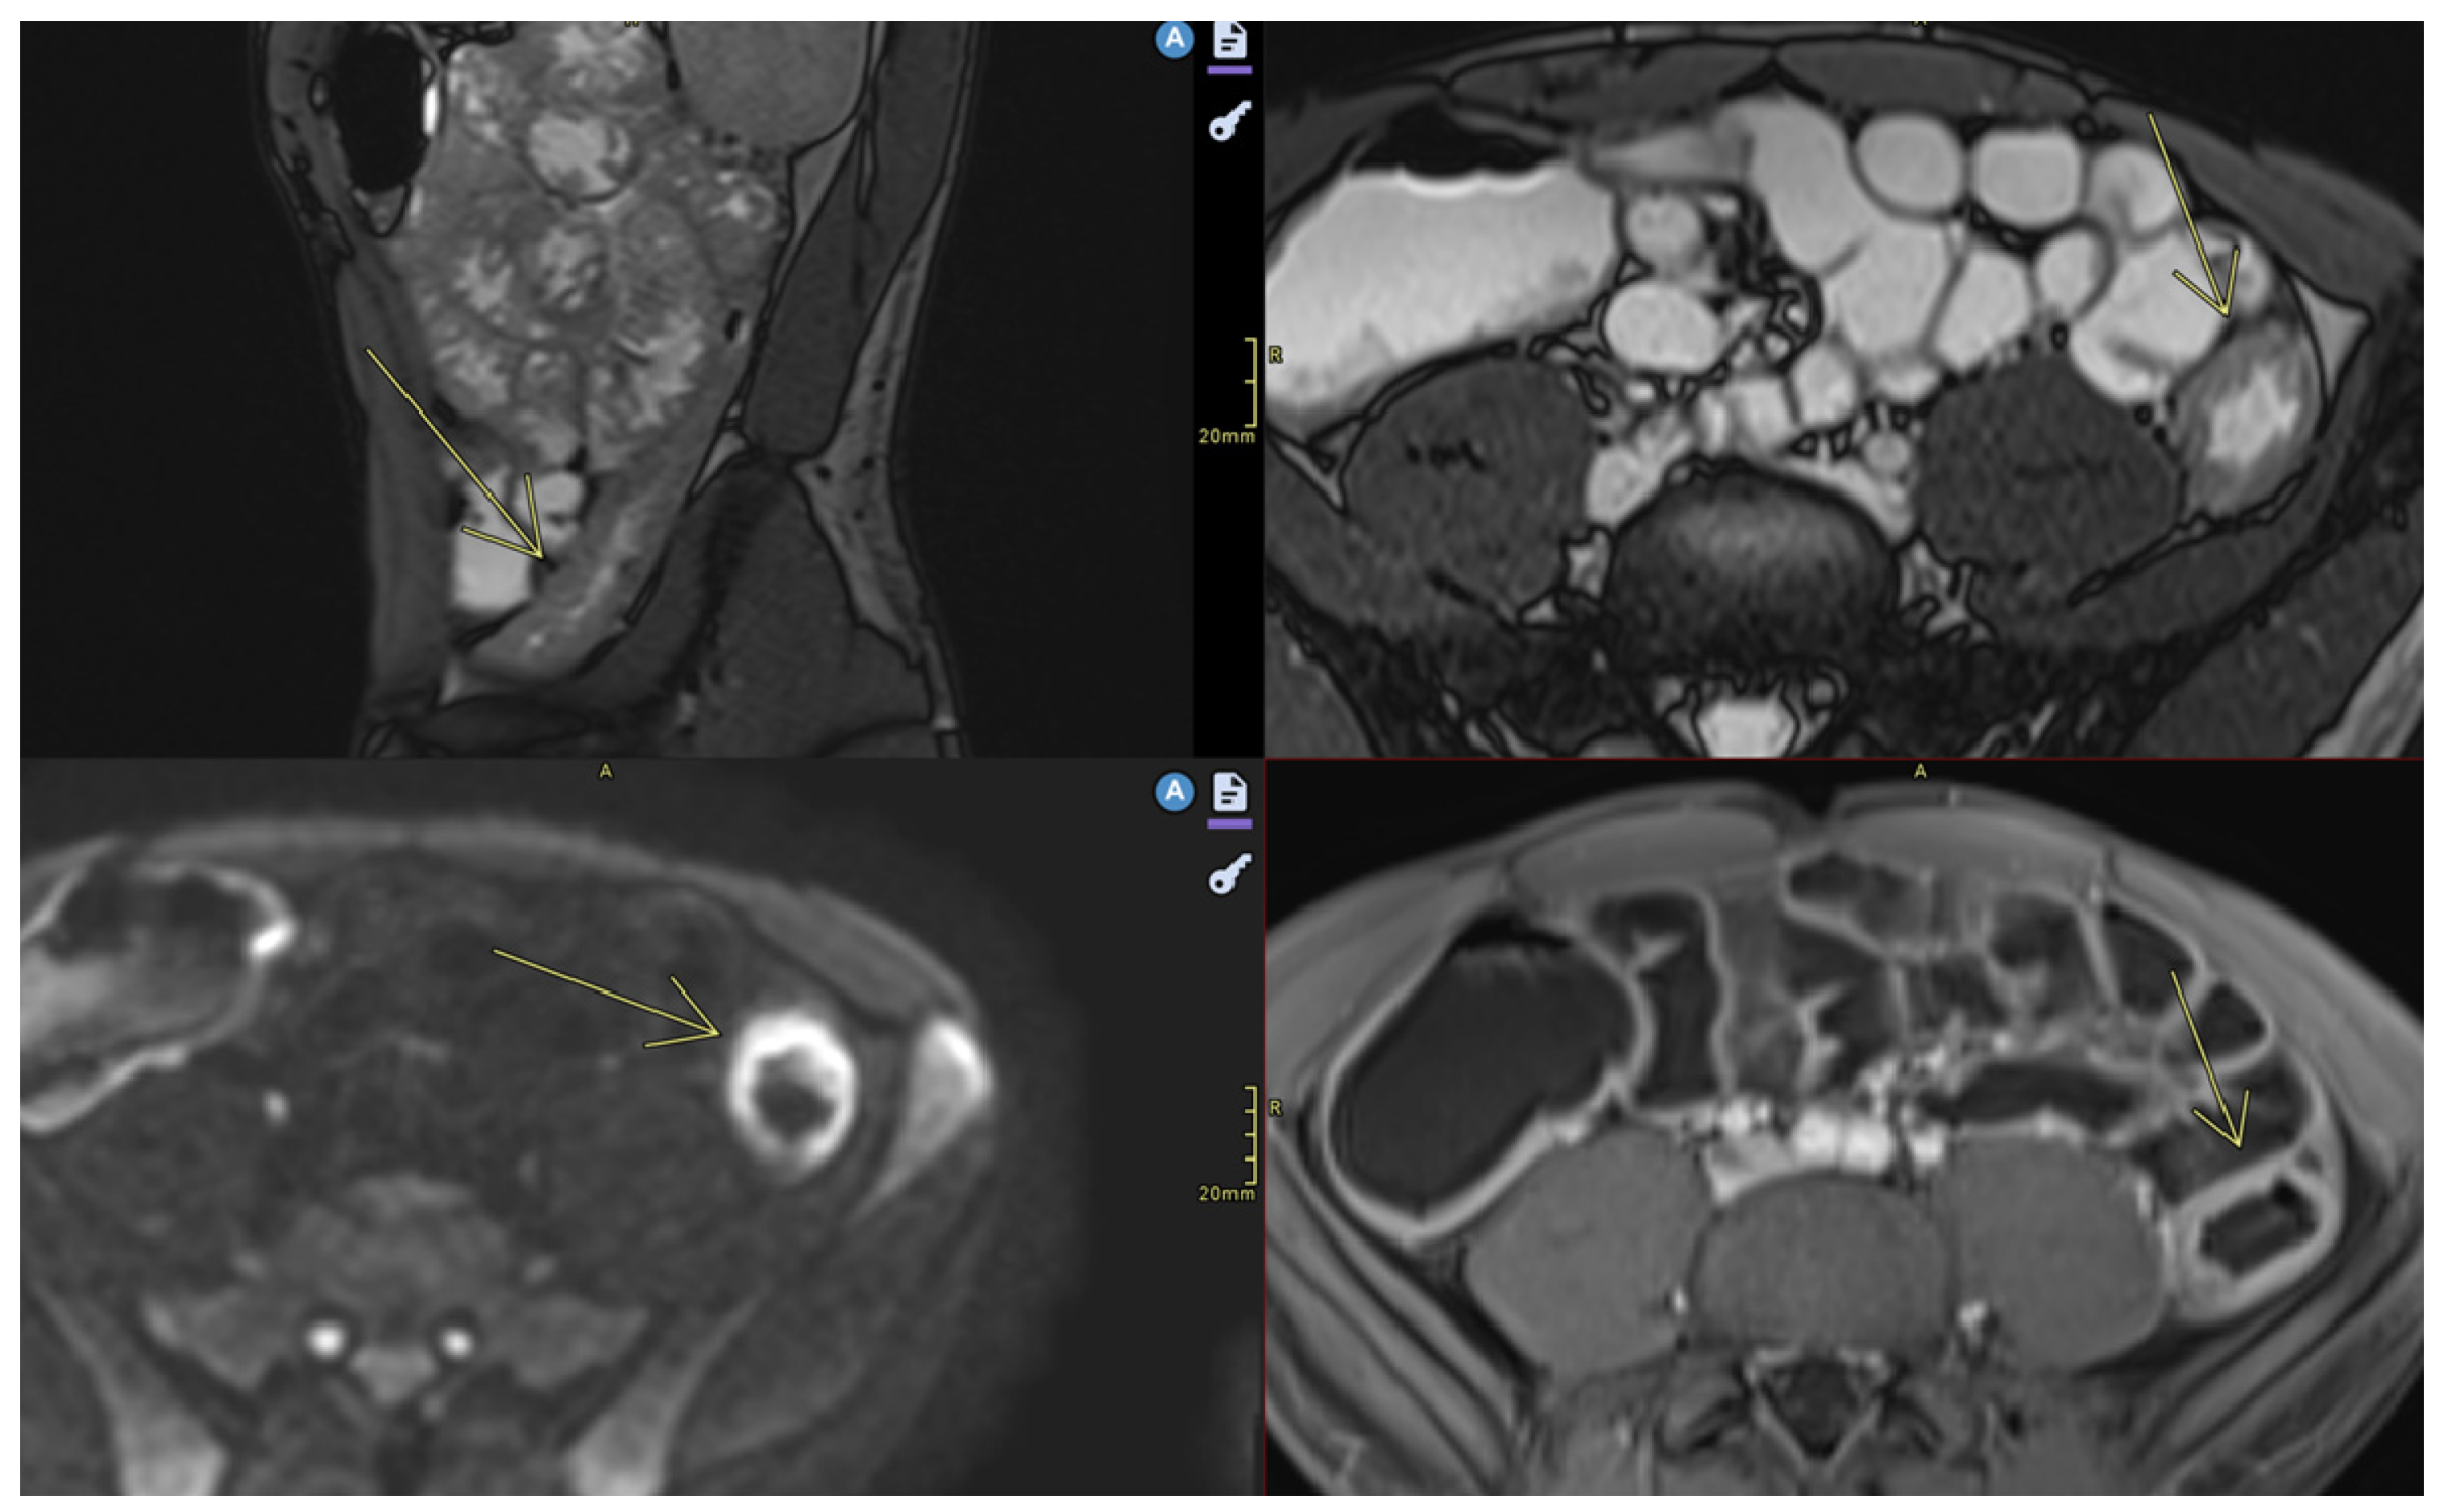
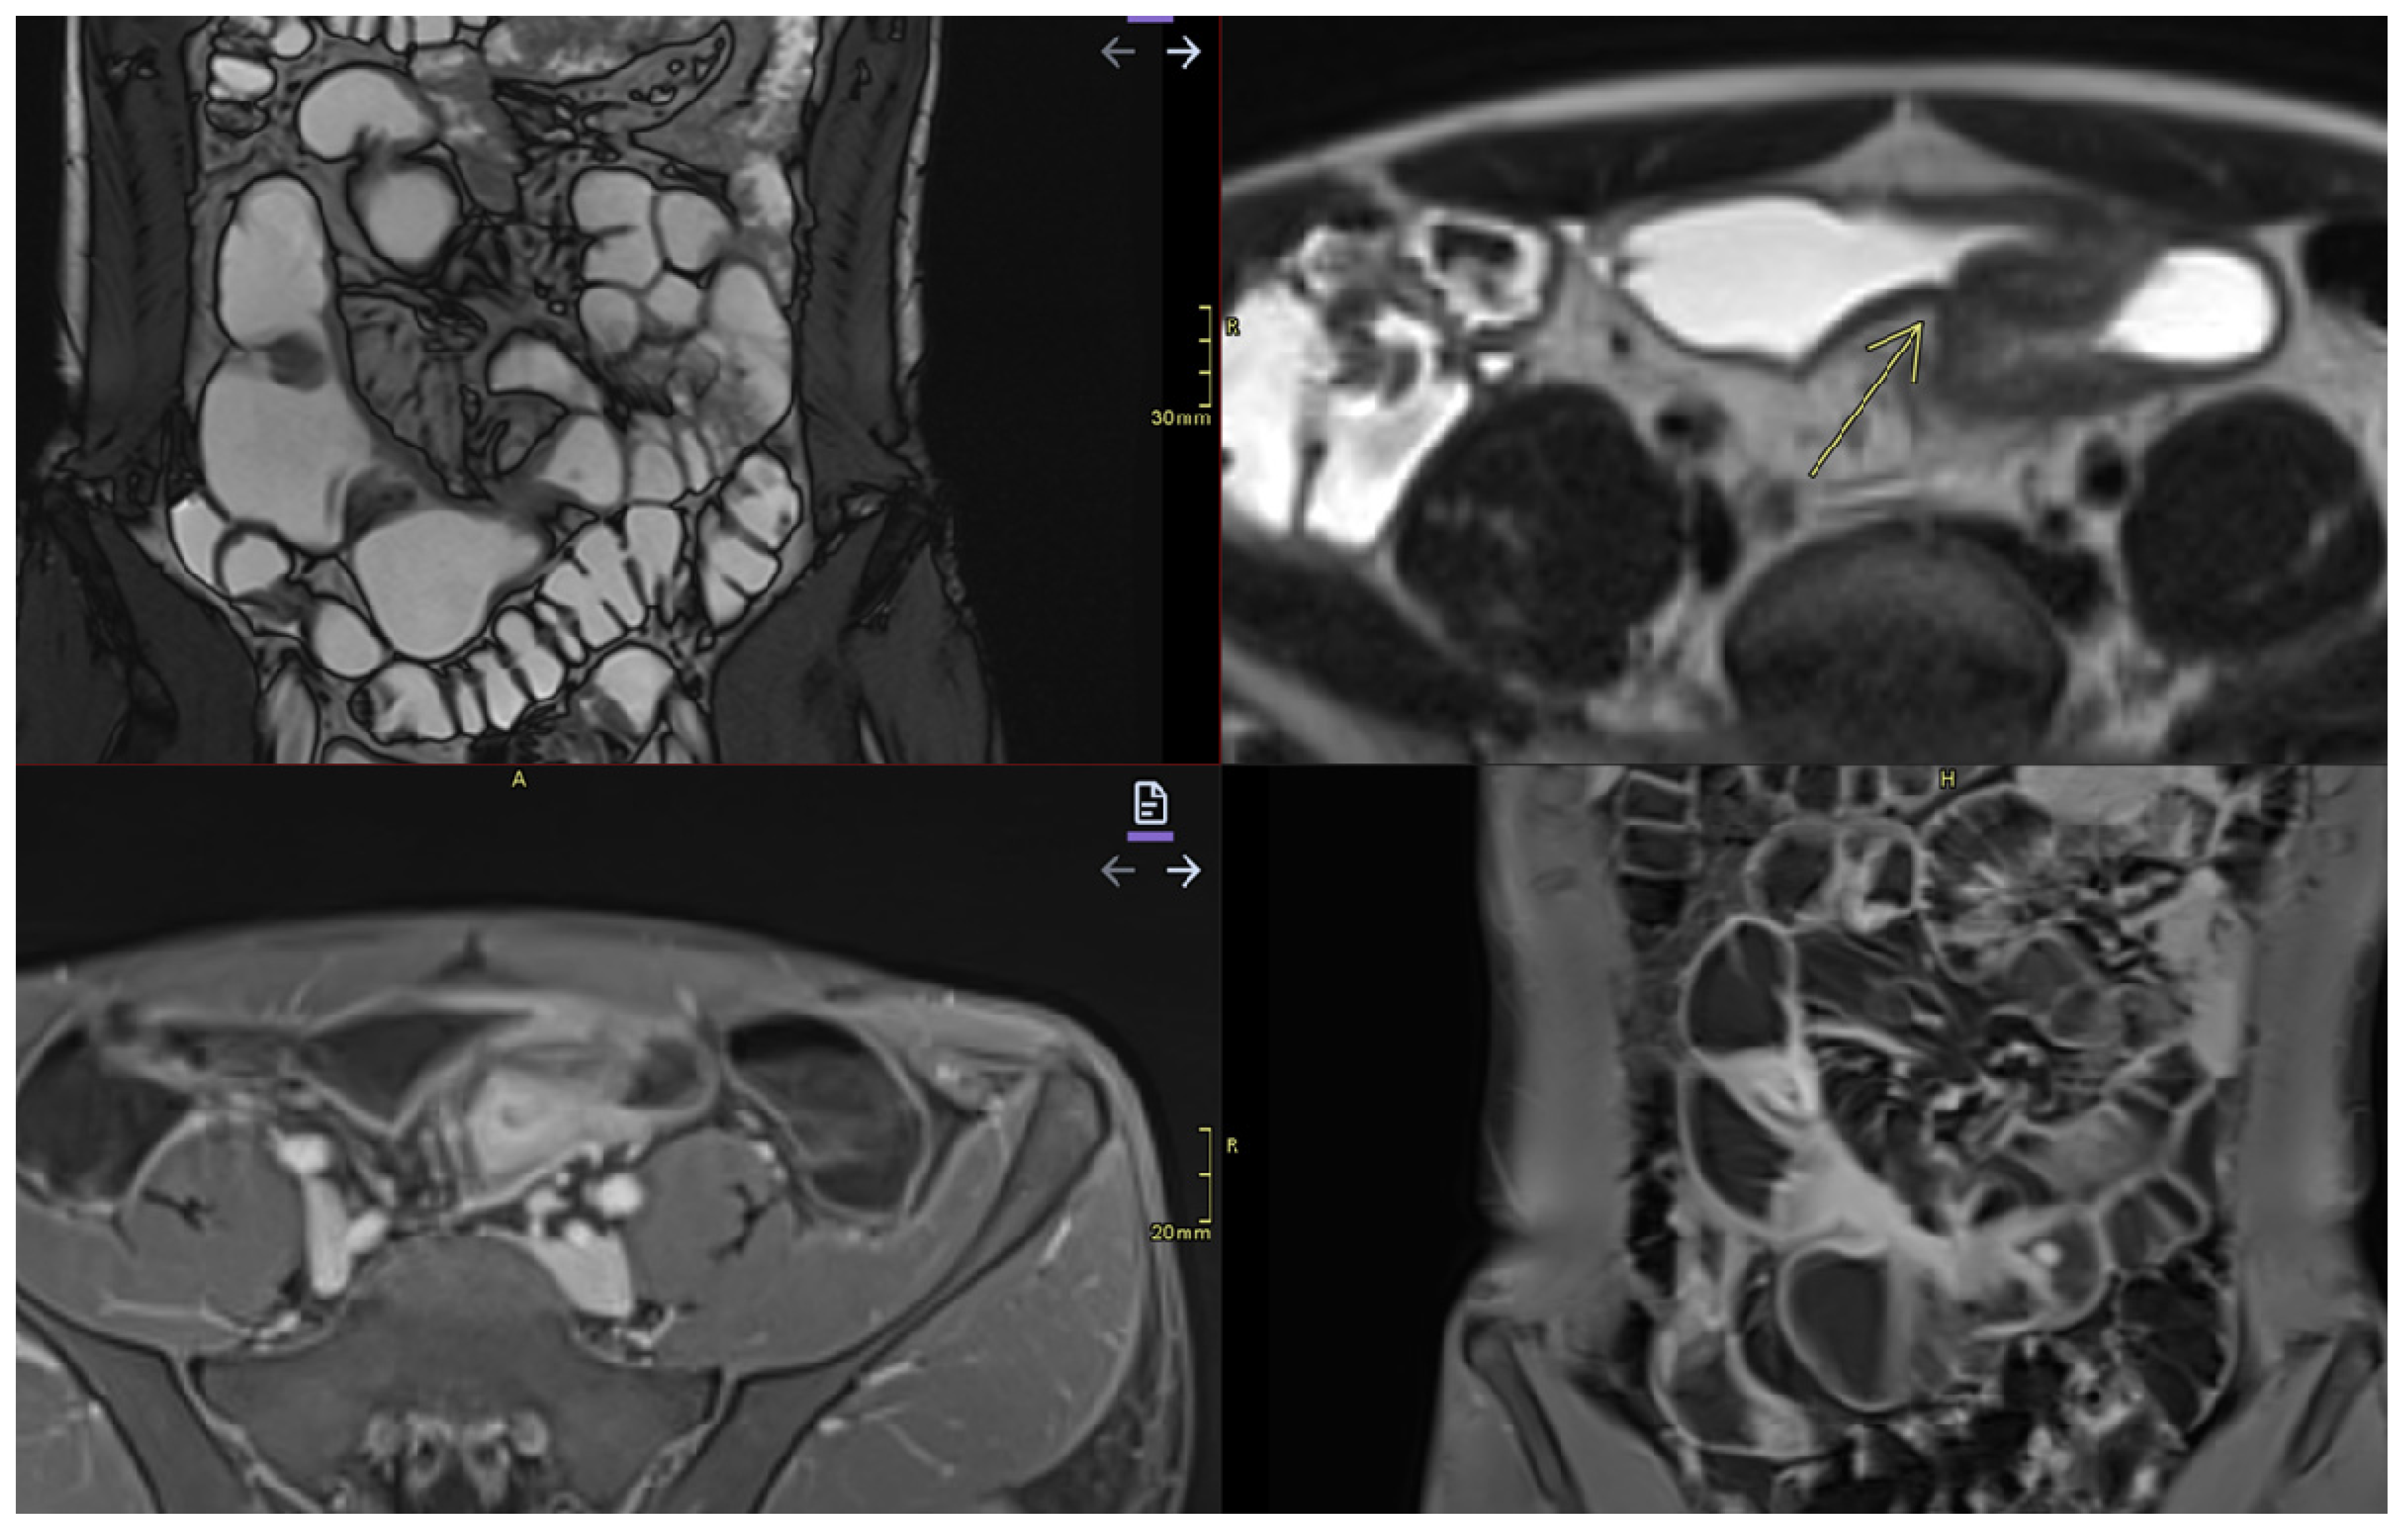
- Stenosis
- May be inflammatory (with edema and entrapment) or fibrotic (without inflammatory signs) (Figure 7).

| Characteristic | Appearance in MRE | Clinical Significance |
|---|---|---|
| Mural thickening |
| Active inflammation or fibrosis [43] |
| Mural hyperenhancement/hyperemia |
| Active inflammation [43] Disease activity assessment |
| Intramural edema |
| Active inflammation [43] |
| Fibrosis |
| |
| Restricted Diffusion (DWI/ACD) |
| Active inflammation |
| Ulceration |
| Sign of severe activity |
| Mesenteric lymphadenopathy |
| Regional inflammation [43] |
| Comb sign |
| Active disease, intestinal inflammation present |
| Fibrofatty proliferation |
| Active inflammation |
| Fistulas |
| Transmural complication |
| Abscess |
| Infection, complication, requires treatment |
| Stenoses |
| Complication Evaluation for intervention |
| Obstructions | Complete obstruction of the intestinal lumen [47] |
4. Applicability of MRE in Inflammatory Bowel Diseases
4.1. Differentiating Between Active Inflammation and Fibrosis
4.2. Screening/Detection of Complications
- ➢
- Enteroenteric, enterocutaneous, and perianal fistulas: MRE can distinguish between simple and complicated fistulas, guiding the decision between conservative treatment and surgical drainage;
- ➢
- Intra-abdominal abscesses;
- ➢
- Fibrous stenosis with dilation of the upstream loops;
- ➢
- Mesenteric adenopathies and changes in perenteric fat;
- ➢
- Toxic megacolon—a rare but severe complication of ulcerative colitis [28].
4.3. Monitoring Response to Treatment
4.4. Complementarity with Other Methods
- ➢
- Exploration of jejunal and ileal loops;
- ➢
- Transmural and extramural evaluation;
- ➢
- Therapeutic guidance in the absence of obvious colonic lesions.
4.5. Role in Staging and Imaging Scores
4.5.1. Standardized Imaging Scores in Magnetic Resonance Enterography
- 1.
- The most widely studied scoring system that assesses Crohn’s disease activity on MRE is the magnetic resonance index activity (MaRIA) score. The score is calculated using the following equation:
- MaRIA score=1.5 × wall thickness + 0.02 × RCE (relative contrast enhancement) + 5 × edema + 10 × ulceration [59];RCE = [(WSI − wall signal intensity postgadolinium − WSIpregadolinium)/(WSIpregadolinium)] × 100 × SD noise pregadolinium/SD noise postgadolinium), where SD (standard deviation) noise represents the average of three SDs of the signal intensity measured outside the body before and after administration of the contrast agent [59].
The cut-off values of the MaRIA score are as follows:
- ➢
- Normal: 0–6;
- ➢
- Moderate disease: ≥ 7–11;
- ➢
- Severe disease: ≥ 11 [22].
- 2.
- The major disadvantage of this score is that it is time-consuming to obtain. Such a limitation led to the development of a simplified new scoring system, the sMaRIA, which requires just 4.5 min compared to over 12 min for the MARIA [22,59,60]. The sMaRIA was validated by Ordas et al. in 2019, and its most significant advantage is that it does not involve contrast-enhanced imaging [22,61].The sMaRIA is calculated with the following equation:
- MARIAs = (1 × thickness >3 mm) + (1 × edema) + (1 × fat stranding) + (2 × ulcers)
The cut-off points of the sMaRIA score are as follows:
- ➢
- A score of >1 identifies active disease, with 90% sensitivity and 81% specificity;
- ➢
- 3.
4.5.2. London and “Extended” London Scores
4.5.3. Crohn’s Disease MRI Index (CDMI)
4.5.4. Clermont Score
4.5.5. Nancy Score
4.6. Differential Diagnoses Mimicking Crohn’s Disease on Magnetic Resonance Enterography
5. Limitations and Challenges of MRE
6. Conclusions and Future Perspectives
6.1. Main Benefits of MRE
- ➢
- It allows for detailed evaluation of the small intestine, and is superior to colonoscopy for endoscopically inaccessible segments;
- ➢
- It distinguishes between active inflammation and fibrosis, which is an essential aspect for guiding treatment;
- ➢
- It detects complications of Crohn’s disease, providing critical information for therapeutic decisions;
- ➢
- It is safe for repeated use, which is ideal for the long-term monitoring of patients with IBD.
6.2. Research and Innovation Directions
- ➢
- AI—Deep learning algorithms could automate image interpretation, reducing inter-radiologist variability and improving the accuracy of diagnosis.
- ➢
- New imaging techniques may provide improved MR sequences for the early detection of inflammation and more precise differentiation between edema and fibrosis.
- ➢
- The development of shorter scanning protocols will allow for faster and more accessible examinations while maintaining image quality.
- ➢
- The effective utilization of serum and fecal biomarkers, such as the integration of MRE with laboratory tests (e.g., fecal calprotectin), will allow for more efficient patient monitoring.
6.3. AI in Magnetic Resonance Enterography (MRE): Enhancing Diagnosis and Monitoring of Inflammatory Bowel Disease
6.3.1. Key Applications of AI in MRE for IBD
- Automated Image Segmentation and QuantificationAI algorithms, particularly deep learning models, have demonstrated proficiency in automating the segmentation of bowel structures, such as the lumen and bowel wall. Studies have reported high agreement rates between AI-based segmentation and manual methods, with some achieving 75% agreement for the lumen and 81% for the bowel wall. This automation enhances consistency and reduces inter-observer variability [77,78].
- Quantifying of Disease Activity and ComplicationsAI models have been developed to evaluate various disease features, including bowel wall thickness, enhancement patterns, edema, classifying disease severity, and the presence of complications like strictures or fistulas. For instance, a machine learning-based radiomic model demonstrated high accuracy in predicting the presence of intestinal fibrosis, outperforming radiologists in some cases [78].
- Prediction of Treatment Response and Long-Term OutcomesAI has shown promise in predicting patient responses to treatment and long-term outcomes. By analyzing imaging biomarkers and clinical data, AI models can assist in stratifying patients based on their likelihood of achieving remission or experiencing disease progression [77].
- Integration with Other Diagnostic Modalities
6.3.2. Challenges and Future Directions
- Data Quality and Standardization: Variability in imaging protocols and patient populations can affect AI model performance.
- Interpretability: Understanding the decision-making process of AI models is crucial for clinical trust and adoption.
- Integration into Clinical Workflows: Seamless incorporation of AI tools into existing clinical practices requires careful consideration of workflow and regulatory standards.
7. Conclusions
Author Contributions
Funding
Institutional Review Board Statement
Informed Consent Statement
Data Availability Statement
Conflicts of Interest
References
- Cozzi, D.; Moroni, C.; Addeo, G.; Danti, G.; Lanzetta, M.M.; Cavigli, E.; Falchini, M.; Marra, F.; Piccolo, C.L.; Brunese, L.; et al. Radiological Patterns of Lung Involvement in Inflammatory Bowel Disease. Gastroenterol. Res. Pract. 2018, 2018, 5697846. [Google Scholar] [CrossRef] [PubMed]
- Ali, R.M.M.; El Salam, A.F.A.; Anwar, I.; Shehab, H.; Awadallah, M.Y. Role of MR enterography versus ileo-colonoscopy in the assessment of inflammatory bowel diseases. Egypt. J. Radiol. Nucl. Med. 2023, 54, 17. [Google Scholar] [CrossRef]
- Arif-Tiwari, H.; Taylor, P.; Kalb, B.T.; Diego, R.M. Magnetic resonance enterography in inflammatory bowel disease. Appl. Radiol. 2019, 48, 9–15. [Google Scholar] [CrossRef] [PubMed]
- Shivashankar, R.; Tremaine, W.J.; Harmsen, W.S.; Loftus, E.V., Jr. Incidence and Prevalence of Crohn’s Disease and Ulcerative Colitis in Olmsted County, Minnesota From 1970 Through 2010. Clin. Gastroenterol. Hepatol. 2017, 15, 857–863. [Google Scholar] [CrossRef]
- Bernstein, C.N.; Wajda, A.; Svenson, L.W.; MacKenzie, A.; Koehoorn, M.; Jackson, M.; Fedorak, R.; Israel, D.; Blanchard, J.F. The epidemiology of inflammatory bowel disease in Canada: A population-based study. Am. J. Gastroenterol. 2006, 101, 1559–1568. [Google Scholar] [CrossRef]
- Ekbom, A.; Helmick, C.; Zack, M.; Adami, H.O. The epidemiology of inflammatory bowel disease: A large, population-based study in Sweden. Gastroenterology 1991, 100, 350–358. [Google Scholar] [CrossRef]
- Schultsz, C.; Van Den Berg, F.M.; Ten Kate, F.W.; Tytgat, G.N.; Dankert, J. The intestinal mucus layer from patients with inflammatory bowel disease harbors high numbers of bacteria compared with controls. Gastroenterology 1999, 117, 1089–1097. [Google Scholar] [CrossRef]
- Biondi, M.; Bicci, E.; Danti, G.; Flammia, F.; Chiti, G.; Palumbo, P.; Bruno, F.; Borgheresi, A.; Grassi, R.; Grassi, F. The role of Magnetic Resonance Enterography in Crohn’s Disease: A Review of Recent Literature. Diagnostics 2022, 12, 1236. [Google Scholar] [CrossRef]
- Girometti, R.; Zuiani, C.; Toso, F.; Brondani, G.; Sorrentino, D.; Avellini, C.; Bazzocchi, M. MRI scoring system including dynamic motility evaluation in assessing the activity of Crohn’s disease of the terminal ileum. Acad. Radiol. 2008, 15, 153–164. [Google Scholar] [CrossRef]
- Bonifacio, C.; Dal Buono, A.; Levi, R.; Gabbiadini, R.; Reca, C.; Bezzio, C.; Francone, M.; Armuzzi, A.; Balzarini, L. Reporting of Magnetic Resonance Enterography in Inflammatory Bowel Disease: Results of an Italian Survey. J. Clin. Med. 2024, 13, 3953. [Google Scholar] [CrossRef]
- Fiorino, G.; Peyrin-Biroulet, L.; Danese, S. Bowel damage assessment in Crohn’s disease by magnetic resonance imaging. Curr Drug Targets 2012, 13, 1300–1307. [Google Scholar] [CrossRef] [PubMed]
- Brem, O.; Elisha, D.; Konen, E.; Amitai, M.; Klang, E. Deep learning in magnetic resonance enterography for Crohn’s disease assessment: A systematic review. Abdom. Radiol. 2024, 49, 3183–3189. [Google Scholar] [CrossRef] [PubMed]
- Bruining, D.; Zimmermann, E.; Loftus, E., Jr.; Sandborn, W.; Sauer, C.; Strong, S. Consensus Recommendations for Evaluation, Interpretation, and Utilization of Computed Tomography and Magnetic Resonance Enterography in Patients With Small Bowel Crohn’s Disease. Radiology 2018, 286, 776–799. [Google Scholar] [CrossRef] [PubMed]
- Buisson, A.; Gonzalez, F.; Poullenot, F.; Nancey, S.; Sollellis, E.; Fumery, M.; Pariente, B.; Flamant, M.; Trang-Poisson, C.; Bonnaud, G.; et al. ACCEPT study group. Comparative acceptability and perceived clinical utility of monitoring tools: A Nationwide Survey of patients with inflammatory bowel disease. Inflamm Bowel Dis 2017, 23, 1425–1433. [Google Scholar] [CrossRef]
- Dulai, P.S.; Levesque, B.G.; Feagan, B.G. Assessment of mucosal healing in inflammatory bowel disease. Gastrointest. Endosc. 2015, 82, 246–255. [Google Scholar] [CrossRef]
- Langan, R.C.; Gotsch, P.B.; Krafczyk, M.A. Ulcerative colitis: Diagnosis and treatment. Am. Fam. Physician 2007, 76, 1323–1330. [Google Scholar]
- Neumann, H.; Tontini, G.E.; Albrecht, H. Su1702 accuracy of the full spectrum endoscopy system (FUSE) for prediction of colorectal polyp histology. Gastrointest. Endosc. 2016, 83, AB402. [Google Scholar] [CrossRef]
- Tillack, C.; Seiderer, J.; Brand, S.; Göke, B.; Reiser, M.F.; Schaefer, C.; Diepolder, H.; Ochsenkühn, T.; Herrmann, K.A. Correlation of magnetic resonance enteroclysis (MRE) and wireless capsule endoscopy (CE) in the diagnosis of small bowel lesions in Crohn’s disease. Inflamm. Bowel Dis. 2008, 14, 1219–1228. [Google Scholar] [CrossRef]
- Kopylov, U. Diagnostic yield of capsule endoscopy versus magnetic resonance enterography and small bowel contrast ultrasound in the evaluation of small bowel Crohn’s disease: Systematic review and meta-analysis. Dig. Liver Dis. 2017, 49, 854–863. [Google Scholar] [CrossRef]
- Rozendorn, N.; Klang, E.; Lahat, A.; Yablecovitch, D.; Kopylov, U.; Eliakim, A.; Ben-Horin, S.; Amitai, M.M. Prediction of patency capsule retention in known Crohn’s disease patients by using magnetic resonance imaging. Gastrointest. Endosc. 2015, 83, 182–187. [Google Scholar] [CrossRef]
- Castiglione, F.; de Sio, I.; Cozzolino, A.; Rispo, A.; Manguso, F.; Del Vecchio Blanco, G.; Di Girolamo, E.; Castellano, L.; Ciacci, C.; Mazzacca, G. Bowel wall thickness at abdominal ultrasound and the one-year-risk of surgery in patients with Crohn’s disease. Am. J. Gastroenterol. 2004, 99, 1977–1983. [Google Scholar] [CrossRef] [PubMed]
- Kumar, S.; De Kock, I.; Blad, W.; Hare, R.; Pollok, R.; Taylor, S. Magnetic Resonance Enterography and Intestinal Ultrasound for the Assessment and Monitoring of Crohn’s Disease. J. Crohns Colitis 2024, 18, 1450–1463. [Google Scholar] [CrossRef] [PubMed]
- Rosenfeld, G.; Brown, J.; Vos, P.M.; Leipsic, J.; Enns, R.; Bressler, B. Prospective Comparison of Standard- Versus Low-Radiation-Dose CT Enterography for the Quantitative Assessment of Crohn Disease. Am. J. Roentgenol. 2018, 210, W54–W62. [Google Scholar] [CrossRef] [PubMed]
- Gore, R.M.; Balthazar, E.J.; Ghahremani, G.G.; Miller, F.H. CT features of ulcerative colitis and Crohn’s disease. AJR Am. J. Roentgenol. 1996, 167, 3–15. [Google Scholar] [CrossRef]
- Duigenan, S.; Gee, M.S. Imaging of pediatric patients with inflammatory bowel disease. AJR Am. J. Roentgenol. 2012, 199, 907–915. [Google Scholar] [CrossRef]
- Elsayes, K.; Al Hawary, M.M.; Jagdish, J.; Ganesh, H.S.; Platt, J.F. CT enterography: Principles, trends, and interpretation of findings. RadioGraphics 2010, 30, 1955–1970. [Google Scholar] [CrossRef]
- Haas, K.; Rubesova, E.; Bass, D. Role of imaging in the evaluation of inflammatory bowel disease: How much is too much? World J. Radiol. 2016, 8, 124–131. [Google Scholar] [CrossRef] [PubMed]
- Makanyanga, J.C.; Taylor, S.A. Current and future role of MRI in Crohn’s disease. Clin. Radiol. 2021, 76, 157–167. [Google Scholar]
- Taylor, S.A.; Mallett, S.; Bhatnagar, G.; Baldwin-Cleland, R.; Bloom, S.; Gupta, A.; Hamlin, P.J.; Hart, A.L.; Higginson, A.; Jacobs, I.; et al. Diagnostic accurancy of magnetic resonance enterography and small bowel ultrasound for the extent and activity of Crohn’s disease (METRIC): A multicentre trial. Lancet Gastroenterol. Hepatol. 2021, 6, 548–562. [Google Scholar]
- Mettler, F.A.; Huda, W.; Yoshizumi, T.T.; Mahesh, M. Effective doses in radiology and diagnostic nuclear medicine: A catalog. Radiology 2008, 248, 254–263. [Google Scholar] [CrossRef]
- Gaca, A.M.; Jaffe, T.A.; Delaney, S.; Yoshizumi, T.; Toncheva, G.; Nguyen, G.; Frush, D.P. Radiation doses from small-bowel follow-through and abdomen/pelvis MDCT in pediatric Crohn disease. Pediatr. Radiol. 2008, 38, 285–291. [Google Scholar] [CrossRef] [PubMed]
- Del Gaizo, A.J.; Fletcher, J.G.; Yu, L.; Paden, R.G.; Spencer, G.C.; Leng, S.; Silva, A.M.; Fidler, J.L.; Silva, A.C.; Hara, A.K. Reducing radiation dose in CT enterography. Radiographics 2013, 33, 1109–1124. [Google Scholar] [CrossRef] [PubMed]
- Li, X.; Liang, D.; Meng, J.; Zhou, J.; Chen, Z.; Huang, S.; Lu, B.; Qiu, Y.; Baker, M.E.; Ye, Z.; et al. Development and validation of a novel computed-tomography enterography radiomic approach for characterization of intestinal fibrosis in Crohn’s disease. Gastroenterology 2021, 160, 2303–2316.e11. [Google Scholar] [CrossRef] [PubMed]
- Martin, D.R.; Lauenstein, T.; Sitaraman, S.V. Utility of magnetic resonance imaging in small bowel Crohn’s disease. Gastroenterology 2007, 133, 385–390. [Google Scholar] [CrossRef]
- Kim, K.J.; Lee, Y.; Park, S.H. Diffusion-weighted MR enterography for evaluating Crohn’s disease: How does it add diagnostically to conventional MR enterography. Inflamm. Bowel Dis. 2015, 21, 101–109. [Google Scholar] [CrossRef]
- Kaushal, P.; Somwaru, A.S.; Charabaty, A. MR enterography of inflammatory bowel disease with endoscopic correlation. Radiographics 2017, 37, 116–131. [Google Scholar] [CrossRef]
- Lanier, M.H.; Shetty, A.S.; Salter, A. Evaluation of noncontrast MR enterography for pediatric inflammatory bowel disease assessment. J. Magn. Reson. Imaging 2018, 48, 341–348. [Google Scholar] [CrossRef]
- Fallis, S.A.; Murphy, P.; Sinha, R. Magnetic reso-nance enterography in Crohn’s disease: A compari-son with the findings at surgery. Colorectal. Dis. 2013, 15, 1273–1280. [Google Scholar] [CrossRef]
- Kuehle, C.A.; Ajaj, W.; Ladd, S.C.; Massing, S.; Barkhausen, J.; Lauenstein, T.C. Hydro-MRI of the Small Bowel: Effect of Contrast Volume, Timing of Contrast Administration, and Data Acquisition on Bowel Distention. Am. J. Roentgenol. 2006, 187, W375–W385. [Google Scholar] [CrossRef]
- Maccioni, F.; Bruni, A.; Viscido, A.; Colaiacomo, M.C.; Cocco, A.; Montesani, C.; Caprilli, R.; Marini, M. MR Imaging in Patients with Crohn Disease: Value of T2- versus T1-weighted Gadolinium-enhanced MR Sequences with Use of an Oral Superparamagnetic Contrast Agent. Radiology 2006, 238, 517–530. [Google Scholar] [CrossRef]
- Low, R.N.; Sebrechts, C.P.; Politoske, D.A. Crohn disease with endoscopic correlation: Single-shot fast spin-echo and gadolinium-enhanced fat-sup-pressed spoiled gradient-echo MR imaging. Radiology 2002, 222, 652–660. [Google Scholar] [CrossRef] [PubMed]
- Tolan, D.J.; Greenhalgh, R.; Zealley, I.A.; Halligan, S.; Taylor, S.A. MR enterographic manifestations of small bowel Crohn disease. Radiographics 2010, 30, 367–384. [Google Scholar] [CrossRef] [PubMed]
- Moy, M.; Sauk, J.; Gee, M. The Role of MR Enterography in Assessing Crohn’s Disease Activity and Treatment Response. Gastroenterol. Res. Pract. 2015, 2016, 8168695. [Google Scholar] [CrossRef] [PubMed]
- Rimola, J.; Fernandez-Clotet, A.; Capozzi, N.; Caballol, B.; Rodríguez, S.; Gallego, M.; Masamunt, M.C.; Panés, J.; Ricart, E.; Ordás, I. ADC values for detecting bowel inflammation and biologic therapy response in patients with Crohn disease: A Post-Hoc Prospective Trial Analysis. AJR Am. J. Roentgenol. 2023, 222, e2329639. [Google Scholar] [CrossRef]
- Radmard, A.; Amouei, M.; Torabi, A.; Sima, A.; Saffar, H.; Geahchan, A.; Davarpanah, A.; Taouli, B. MR Enterography in Ulcerative Colitis: Beyond Endoscopy. RadioGraphics 2024, 44. [Google Scholar] [CrossRef]
- Alexopoulou, E.; Roma, E.; Loggitsi, D.; Economopoulos, N.; Papakonstantinou, O.; Panagiotou, I.; Pahoula, I.; Kelekis, N.L. Magnetic resonance imaging of the small bowel in children with idiopathic inflammatory bowel disease: Evaluation of disease activity. Pediatr. Radiol. 2009, 39, 791–797. [Google Scholar] [CrossRef]
- Qiu, Y.; Mao, R.; Chen, B.L.; Li, X.H.; He, Y.; Zeng, Z.R.; Li, Z.P.; Chen, M.H. Systematic review with meta-analysis: Magnetic resonance enterography vs. computed tomography enterography for evaluating disease activity in small bowel Crohn’s disease. Aliment. Pharmacol. Ther. 2014, 40, 134–146. [Google Scholar] [CrossRef]
- Biernacka, K.; Barańska, D.; Matera, K.; Podgórski, M.; Czkwianianc, E.; Zakrzewska, K.; Dziembowska, I.; Grzelak, P. The value of magnetic resonance enterography in diagnostic difficulties associated with Crohn’s disease. Pol. J. Radiol. 2021, 86, e143–e150. [Google Scholar] [CrossRef]
- Athanasakos, A.; Mazioti, A.; Economopoulos, N.; Kontopoulou, C.; Stathis, G.; Filippiadis, D.; Spyridopoulos, T.; Alexopoulou, E. Inflammatory bowel disease-the role of cross-sectional imaging techniques in the investigation of the small bowel. Insights Imaging 2015, 6, 73–83. [Google Scholar] [CrossRef]
- Mentzel, H.J.; Reinsch, S.; Kurzai, M.; Stenzel, M. Magnetic resonance imaging in children and adolescents with chronic inflammatory bowel disease. World J. Gastroenterol. 2014, 20, 1180–1191. [Google Scholar] [CrossRef]
- Fornasa, F.; Benassuti, C.; Benazzato, L. Role of magnetic resonance enterography in differentiating between fibrotic and active inflammatory small bowel stenosis in patients with Crohn’s disease. J. Clin. Imaging Sci. 2011, 1, 35. [Google Scholar] [CrossRef] [PubMed]
- Gee, M.S.; Nimkin, K.; Hsu, M.; Israel, E.J.; Biller, J.A.; Katz, A.J.; Mino-Kenudson, M.; Harisinghani, M.G. Prospective evaluation of MR enterography as the primary imaging modality for pediatric Crohn disease assessment. Am. J. Roentgenol. 2011, 197, 224–231. [Google Scholar] [CrossRef] [PubMed]
- Baert, F.; Moortgat, L.; Van Assche, G.; Caenepeel, P.; Vergauwe, P.; De Vos, M.; Stokkers, P.; Hommes, D.; Rutgeerts, P.; Vermeire, S.; et al. Mucosal healing predicts sustained clinical remission in patients with early-stage Crohn’s disease. Gastroenterology 2010, 138, e410–e468. [Google Scholar] [CrossRef] [PubMed]
- Neurath, M.F.; Travis, S.P.L. Mucosal healing in inflammatory bowel diseases: A systematic review. Gut 2012, 61, 1619–1635. [Google Scholar] [CrossRef]
- Frøslie, K.F.; Jahnsen, J.; Moum, B.A.; Vatn, M.H. Mucosal healing in inflammatory bowel disease: Results from a Norwegian population-based cohort. Gastroenterology 2007, 133, 412–422. [Google Scholar] [CrossRef]
- Björkesten, C.-G.; Nieminen, U.; Sipponen, T.; Turunen, U.; Arkkila, P.; Färkkilä, M. Mucosal healing at 3 months predicts long-term endoscopic remission in anti-TNF-treated luminal Crohn’s disease. Scand. J. Gastroenterol. 2013, 48, 543–551. [Google Scholar] [CrossRef]
- Rutgeerts, P.; Van Assche, G.; Sandborn, W.J.; Wolf, D.C.; Geboes, K.; Colombel, J.F.; Reinisch, W.; EXTEND Investigators; Kumar, A.; Lazar, A.; et al. Adalimumab induces and maintains mucosal healing in patients with Crohn’s disease: Data from the EXTEND trial. Gastroenterology 2012, 142, 1102.e2–1111.e2. [Google Scholar] [CrossRef]
- Peyrin-Biroulet, L.; Deltenre, P.; de Suray, N.; Branche, J.; Sandborn, W.J.; Colombel, J.-F. Efficacy and safety of tumor necrosis factor antagonists in Crohn’s disease: Meta-analysis of placebo-controlled trials. Clin. Gastroenterol. Hepatol. 2008, 6, 644–653. [Google Scholar] [CrossRef]
- Rimola, J.; Ordás, I.; Rodriguez, S.; García-Bosch, O.; Aceituno, M.; Llach, J.; Ayuso, C.; Ricart, E.; Panés, J. Magnetic Resonance Imaging for Evaluation of Crohn’s Disease: Validation of Parameters of Severity and Quantitative Index of Activity. Inflamm. Bowel Dis. 2011, 17, 1759–1768. [Google Scholar] [CrossRef]
- Williet, N.; Jardin, S.; Roblin, X. The simplified Magnetic Resonance Index of Activity [MARIA] for Crohn’s disease is strongly correlated with the MARIA and Clermont score: An external validation. Gastroenterology 2020, 158, 282–283. [Google Scholar] [CrossRef]
- Ordás, I.; Rimola, J.; Alfaro, I.; Rodríguez, S.; Castro-Poceiro, J.; Ramírez-Morros, A.; Gallego, M.; Giner, À.; Barastegui, R.; Fernández-Clotet, A.; et al. Development and Validation of a Simplified Magnetic Resonance Index of Activity for Crohn’s Disease. Gastroenterology 2019, 157, 432–439.e1. [Google Scholar] [CrossRef] [PubMed]
- Kumar, S.; Plumb, A.; Mallett, S.; Bhatnagar, G.; Bloom, S.; Clarke, C.; Hamlin, J.; Hart, A.; Jacobs, I.; Travis, S.; et al. METRIC-EF: Magnetic resonance enterography to predict disabling disease in newly diagnosed Crohn’s disease—Protocol for a multicentre, non-randomised, single-arm, prospective study. BMJ Open 2022, 12, e067265. [Google Scholar] [CrossRef] [PubMed]
- Seo, N. Comprehensive Review of Magnetic Resonance Enterography-Based Activity Scoring Systems for Crohn’s Disease. iMRI 2025, 29, 1–13. [Google Scholar] [CrossRef]
- Makanyanga, J.C.; Pendsé, D.; Dikaios, N.; Bloom, S.; McCartney, S.; Helbren, E.; Atkins, E.; Cuthbertson, T.; Punwani, S.; Forbes, A.; et al. Evaluation of Crohn’s disease activity: Initial validation of a magnetic resonance enterography global score (MEGS) against faecal calprotectin. Eur. Radiol. 2014, 24, 277–287. [Google Scholar] [CrossRef]
- Steward, M.J.; Punwani, S.; Proctor, I.; Adjei-Gyamfi, Y.; Chatterjee, F.; Bloom, S.; Novelli, M.; Halligan, S.; Rodriguez-Justo, M.; Taylor, S.A. Non-perforating small bowel Crohn’s disease assessed by MRI enterography: Derivation and histopathological validation of an MR-based activity index. Eur. J. Radiol. 2012, 81, 2080–2088. [Google Scholar] [CrossRef]
- Hordonneau, C.; Buisson, A.; Scanzi, J.; Goutorbe, F.; Pereira, B.; Borderon, C.; Da Ines, D.; Montoriol, P.F.; Garcier, J.M.; Boyer, L.; et al. Diffusion-weighted magnetic resonance imaging in ileocolonic Crohn’s disease: Validation of quantitative index of activity. Am. J. Gastroenterol. 2014, 109, 89–98. [Google Scholar] [CrossRef]
- Buisson, A.; Joubert, A.; Montoriol, P.F.; Da Ines, D.; Hordonneau, C.; Pereira, B.; Garcier, J.M.; Bommelaer, G.; Petitcolin, V. Diffusion-weighted magnetic resonance imaging for detecting and assessing ileal inflammation in Crohn’s disease. Aliment. Pharmacol. Ther. 2013, 37, 537–545. [Google Scholar] [CrossRef]
- Oussalah, A.; Laurent, V.; Bruot, O.; Bressenot, A.; Bigard, M.A.; Régent, D.; Peyrin-Biroulet, L. Diffusion-weighted magnetic resonance without bowel preparation for detecting colonic inflammation in inflammatory bowel disease. Gut 2010, 59, 1056–1065. [Google Scholar] [CrossRef]
- Babayeva, G.H.; Asadova, G.V.; Musayev, J.S.; Mahmudov, U.R.; Quliyev, F.V.; Hasanova, A.I. Difficulties in the Differential Diagnosis of Crohn’s Disease. In InCrohn’s Disease-The Current State of the Art; IntechOpen: London, UK, 2023. [Google Scholar] [CrossRef]
- Algin, O.; Turkbey, B.; Ozmen, E.; Algin, E. Magnetic resonance enterography findings of chronic radiation enteritis. Cancer Imaging 2011, 11, 189–194. [Google Scholar]
- Penizzotto, A.; Vespa, F.; Grove, R.L.; Rendón, O.; Tsai, R.; Ocantos, J.A. CT and MR Enterography in the Evaluation of Celiac Disease. Radiographics 2024, 44, e230122. [Google Scholar] [CrossRef]
- Khosravi, B.; Salehnia, A.; Pak, N.; Montazeri, S.A.; Vahedi, H.; Malekzadeh, R.; Radmard Amir, R. A Practical Index to Distinguish Backwash Ileitis From Crohn’s Terminal Ileitis in MR Enterography. Inflamm. Bowel Dis. 2023, 29, 42–50. [Google Scholar] [CrossRef] [PubMed]
- Rached, A.A.; El Hajj, W. Eosinophilic gastroenteritis: Approach to diagnosis and management. World J. Gastrointest. Pharmacol. Ther. 2016, 7, 513–523. [Google Scholar] [CrossRef] [PubMed]
- Derlin, T.; Laqmani, A.; Veldhoen, S.; Apostolova, I.; Ayuk, F.; Adam, G.; Kröger, N.; Bannas, P. Magnetic resonance enterography for assessment of intestinal graft-versus-host disease after allogeneic stem cell transplantation. Eur. Radiol. 2015, 25, 1229–1237. [Google Scholar] [CrossRef] [PubMed]
- Panes, J.; Bouhnik, Y.; Reinisch, W.; Stoker, J.; Taylor, S.A.; Baumgart, D.C.; Danese, S.; Halligan, S.; Marincek, B.; Matos, C.; et al. Imaging techhiquws for assessment of inflammatory bowel disease: Joint ECCO-ESGAR evidence-based consensus guidelines. J. Crohn’s Colitis 2023, 17, 455–472. [Google Scholar]
- Shaban, N.; Hoad, C.L.; Naim, I.; Alshammari, M.; Radford, S.J.; Clarke, C.; Marciani, L.; Moran, G. Imaging in inflammatory bowel disease: Current and future perspectives. Frontline Gastroenterol. 2022, 13, e28–e34. [Google Scholar] [CrossRef]
- Kawamoto, A.; Takenaka, K.; Okamoto, R.; Watanabe, M.; Ohtsuka, K. Systematic review of artificial intelligence-based image diagnosis for inflammatory bowel disease. Dig. Endosc. 2022, 34, 1311–1319. [Google Scholar] [CrossRef]
- Bufman, H.; Eliakim, R.; Tau, N.; Amitai, M.M. Magnetic resonance enterography in Crohn’s disease patients: Current state of the art and future perspectives. Expert. Rev. Med. Devices 2021, 18, 657–667. [Google Scholar] [CrossRef]


| Crohn’s Disease | Ulcerative Colitis |
|---|---|
| Intestinal preparation before examination | Colonic preparation before examination |
| T2-weighted HASTE/SSFSE axial and coronal | MR images in axial plane with entire colon and rectum [45] |
| Balanced steady state free procession gradient-echo (SSFPGR)—Coronal | T2-weighted coronal post-contrast additional images to verify if there are complications [45] |
| 3D cinematic bSSFP—Coronal | |
| Delayed 3D T1-weighted post-contrast fat-saturated GRE (gradient recalled echo)—Axial | Sagittal T2-weighted MR images for anastomosis [45] |
| 3D T1-weighted pre-/post-contrast fat-saturated GRE (gradient recalled echo)–Dynamic—Coronal | Thin-section axial fat-suppression T2-weighted images for perianal disease [45] |
| DWI—Axial |
| Per-Segment Score | ||||
| MR features | 0 | 1 | 2 | 3 |
| Mural thickness | <3 mm | >3–5 mm | >5–7 mm | >7 mm |
| Mural T2 signal (edema) | NORMAL | Minor increase | Moderate increase | Large increase |
| PerimuralT2 signal | NORMAL | Increased signal but no fluid | Small (≤2 mm) fluid rim | Large (>2 mm fluid rim) |
| Contrast enhancement: pattern | NORMAL | N/A or homogeneous | Mucosal | Layered |
| Haustral loss (colon only) | 0–5 cm | 5–15 cm | >15 cm | |
| Multiplication factor for segmental score | ||||
| X1 | X2 | X3 | ||
| Length of disease in that segment | <5 cm | 5–15 cm | >15 cm | |
| Per patient score | ||||
| MR features | 0 | 5 | ||
| Lymph nodes | Absent | Present | ||
| Comb sign | Absent | Present | ||
| Abscess | Absent | Present | ||
| Fistula | Absent | Present | ||
| Score Name | Validation Status | Complexity | Content/Parameters Assessed | Comments |
|---|---|---|---|---|
| MaRIA | Validated | High (time-consuming) | Wall thickness, relative contrast enhancement (RCE), edema, ulceration | Widely studied; requires contrast; calculation is complex and time-consuming (~12+ min). |
| sMaRIA (Simplified MaRIA) | Validated (2019) | Low (fast, ~4.5 min) | Wall thickness >3 mm, edema, fat stranding, ulcers | No contrast needed; simpler and faster; good sensitivity/specificity for active/severe disease. |
| MEGS (MR Enterography Global Score) | Validated | Moderate to High | Segmental mural thickness, mural T2 signal (edema), perimuralT2 signal, contrast enhancement pattern, haustral loss, lymph nodes, comb sign, abscess, fistula (whole bowel assessed) | Comprehensive; sums segment scores multiplied by length; includes per-patient findings; complex. |
| London/Extended London | Validated (2012) | Moderate | Mural thickness score, mural T2 score; extended version includes inflammation and complications | Requires contrast; mainly for research; extended version more detailed but less used clinically. |
| CDMI (Crohn’s Disease MRI Index) | Validated (2012) | High | Precise measurements including post-contrast gradient calculations | Rigorous and detailed with histologic correlation; requires specialized software; less clinical use. |
| Clermont | Validated (2013) | Moderate | Wall thickness, edema, ulceration, ADC (apparent diffusion coefficient) from diffusion-weighted imaging (DWI) | Similar toMaRIA but incorporates DWI; high specificity; requires ADC measurements. |
| Nancy | Validated (2010) | Moderate | Ulceration, parietal edema, bowel wall thickening, mucosa vs. muscularis differentiation, rapid contrast enhancement, DWI hyperintensity | Visual assessment of both small and large bowel; incorporates DWI; binary scoring of findings. |
| Issue | Fix |
| Long scan time → more motion | Use parallel imaging (GRAPPA/SENSE) or compressed sensing |
| Motion sensitivity in DWI | Use readout-segmented EPI or reduced FOV DWI to reduce distortions |
| T2-W sequences blurred | Use single-shot fast spin echo (SSFSE/HASTE) with fat suppression and breath-hold |
| Ghosting in post-contrast | Use 3D T1 GRE with high acceleration, tight shim, and good pre-scan normalization |
Disclaimer/Publisher’s Note: The statements, opinions and data contained in all publications are solely those of the individual author(s) and contributor(s) and not of MDPI and/or the editor(s). MDPI and/or the editor(s) disclaim responsibility for any injury to people or property resulting from any ideas, methods, instructions or products referred to in the content. |
© 2025 by the authors. Licensee MDPI, Basel, Switzerland. This article is an open access article distributed under the terms and conditions of the Creative Commons Attribution (CC BY) license (https://creativecommons.org/licenses/by/4.0/).
Share and Cite
Mirică, R.E.; Matură, T.F.; Craciun, E.; Pavel, D. The Importance of Magnetic Resonance Enterography in Monitoring Inflammatory Bowel Disease: A Review of Clinical Significance and Current Challenges. Diagnostics 2025, 15, 1540. https://doi.org/10.3390/diagnostics15121540
Mirică RE, Matură TF, Craciun E, Pavel D. The Importance of Magnetic Resonance Enterography in Monitoring Inflammatory Bowel Disease: A Review of Clinical Significance and Current Challenges. Diagnostics. 2025; 15(12):1540. https://doi.org/10.3390/diagnostics15121540
Chicago/Turabian StyleMirică, Roxana Elena, Teodora Florentina Matură, Eliza Craciun, and Dana Pavel. 2025. "The Importance of Magnetic Resonance Enterography in Monitoring Inflammatory Bowel Disease: A Review of Clinical Significance and Current Challenges" Diagnostics 15, no. 12: 1540. https://doi.org/10.3390/diagnostics15121540
APA StyleMirică, R. E., Matură, T. F., Craciun, E., & Pavel, D. (2025). The Importance of Magnetic Resonance Enterography in Monitoring Inflammatory Bowel Disease: A Review of Clinical Significance and Current Challenges. Diagnostics, 15(12), 1540. https://doi.org/10.3390/diagnostics15121540