Article

Explainable Machine Learning in the Prediction of Depression

by
Christina Mimikou
1,
Christos Kokkotis
2,
Dimitrios Tsiptsios
3,*,
Konstantinos Tsamakis
4,5,
Stella Savvidou
3,
Lillian Modig
3,
Foteini Christidi
6,
Antonia Kaltsatou
7,
Triantafyllos Doskas
8,
Christoph Mueller
4,
Aspasia Serdari
9,
Kostas Anagnostopoulos
10 and
Gregory Tripsianis
1
1
Laboratory of Medical Statistics, School of Medicine, Democritus University of Thrace, 68100 Alexandroupolis, Greece
2
Department of Physical Education and Sport Science, Democritus University of Thrace, 69100 Komotini, Greece
3
3rd Department of Neurology, Aristotle University of Thessaloniki, 54124 Thessaloniki, Greece
4
Institute of Psychiatry, Psychology and Neuroscience (IoPPN), King’s College London, London SE5 8AB, UK
5
Department of Clinical Sciences, New Anglia University, George Hill AI-2640, Anguilla
6
Department of Neurology, Democritus University of Thrace, 68100 Alexandroupolis, Greece
7
Physical Education and Sport Science, University of Thessaly, 42132 Trikala, Greece
8
Department of Neurology, Athens Naval Hospital, 11521 Athens, Greece
9
Department of Child and Adolescent Psychiatry, School of Medicine, Democritus University of Thrace, 68100 Alexandroupolis, Greece
10
Laboratory of Biochemistry, School of Medicine, Democritus University of Thrace, 68100 Alexandroupolis, Greece
*
Author to whom correspondence should be addressed.
Diagnostics 2025, 15(11), 1412; https://doi.org/10.3390/diagnostics15111412
Submission received: 29 April 2025 / Revised: 30 May 2025 / Accepted: 31 May 2025 / Published: 2 June 2025

Abstract

:
Background: Depression constitutes a major public health issue, being one of the leading causes of the burden of disease worldwide. The risk of depression is determined by both genetic and environmental factors. While genetic factors cannot be altered, the identification of potentially reversible environmental factors is crucial in order to try and limit the prevalence of depression. Aim: A cross-sectional, questionnaire-based study on a sample from the multicultural region of Thrace in northeast Greece was designed to assess the potential association of depression with several sociodemographic characteristics, lifestyle, and health status. The study employed four machine learning (ML) methods to assess depression: logistic regression (LR), support vector machine (SVM), XGBoost, and neural networks (NNs). These models were compared to identify the best-performing approach. Additionally, a genetic algorithm (GA) was utilized for feature selection and SHAP (SHapley Additive exPlanations) for interpreting the contributions of each employed feature. Results: The XGBoost classifier demonstrated the highest performance on the test dataset to predict depression with excellent accuracy (97.83%), with NNs a close second (accuracy, 97.02%). The XGBoost classifier utilized the 15 most significant risk factors identified by the GA algorithm. Additionally, the SHAP analysis revealed that anxiety, education level, alcohol consumption, and body mass index were the most influential predictors of depression. Conclusions: These findings provide valuable insights for the development of personalized public health interventions and clinical strategies, ultimately promoting improved mental well-being for individuals. Future research should expand datasets to enhance model accuracy, enabling early detection and personalized mental healthcare systems for better intervention.

1. Introduction

Depression, a chronic mood disorder characterized by loss of interest and a persistent feeling of sadness [1], affects approximately 280 million people globally [2]. It is one of the leading causes of the global burden of disease [3], thus posing a challenging public health issue. Many studies have documented robust relationships between depression and hopelessness and subsequent suicidal thoughts and behaviors [4]. Apart from its debilitating impact on the sufferer, depression also affects their close environment, as caregivers of individuals with depression often endure emotional and physical challenges, increasing the risk of experiencing psychological issues themselves [5]. Existing literature supports that there is a great variety of risk factors for depression. Sociodemographic factors, such as gender, marital status, age, educational level, and unemployment; daily habits, such as physical activity, diet, and sleep disturbances; and a wide variety of chronic physical diseases have been found to be related to depression with complex bi-directional relationships [6,7,8,9,10]. The pathogenesis of depression is associated with both genetic and environmental factors, with environmental features potentially having the greatest influence [11]. Due to the detrimental effects on people’s health, early diagnosis of depression is essential.
Machine learning (ML) is a powerful artificial intelligence (AI) tool used by researchers in the medical field to predict, calculate, and generate patterns for specific diagnoses. Over the past two decades, ML has been widely used to process statistical data to predict possible outcomes of complex biological systems [12]. The goal of ML is to detect underlying patterns within a sequence of observations by performing specific tasks to analyze data points collected by the physician’s team, ultimately producing predictions or even enabling early diagnoses. ML is a combination of algorithms exploring how computer systems can learn rules from multiple examples without explicit programming [13]. ML is gaining prominence in the field of medicine, demonstrating impressive results in predicting survival and prognosis among patients [14]. ML algorithms can handle and analyze large datasets more efficiently than traditional methods, allowing for the extraction of meaningful insights and physical laws that might otherwise be missed [15]. Neural networks are vital components of ML algorithms, which are modeled after the human brain. They function via pattern recognition, diagnosis, and prognosis in neurology. In a recent study, neural networks have been seen to achieve 87% accuracy, suggesting that such models can effectively assist neurologists in diagnosing and understanding multiple sclerosis (MS) [16].
ML has not only been used in psychiatry but also in a vast number of specialties, including surgery, nephrology, and genomic medicine. In surgery, it has been used to analyze the surgeon’s technical skill by detecting instrument motion, recognizing patterns in video recordings, tracking eye movements, and determining the cognitive function of the surgeon [17]. Another function for the use of ML is the benefit to chronic kidney disease (CKD). CKD is known to be a costly disease, and thus, with the help of ML, physicians can proceed to reduce the costs and provide more care to a greater patient population. In primary care settings, these algorithms can help address the issue by triggering early nephrology referral and improving outcomes in kidney disease patients [18]. Another example is the use of these programs in the field of genomic medicine, where the scope of ML can sift through complex genomic data to identify existing patterns associated with diseases such as cancer. Here, applying ML can help detect mutations in lesions or tumors. This integration allows for the identification of customized treatment recommendations, ultimately leading to enhanced patient outcomes [19].
Neurological disorders such as stroke, spinal cord injury, and Parkinson’s disease require accurate diagnosis and long-term neurorehabilitation, as they cause chronic disability. Diagnoses made by neuroimaging and physiological tools are important for accurately guiding the subsequent rehabilitation [20]. “Neuroscience and AI share a long history of collaboration”, as Macpherson et al. [21] claim; AI and ML algorithms are able to sort through vast amounts of complicated data, such as neuroimaging sets, while recognizing specific patterns, making them valuable for prognosis and guidance in treatment [21]. Therefore, “these newer technologies can offer better rehabilitation outcomes and patient care through more personalized treatments based on (such) data” [20].
With regard to mental health disorders, there is currently no available FDA-approved AI application. However, considering the chronicity and the significant burden of psychiatric disorders, there is a significant need for the utilization of AI and ML algorithms to assist, especially in identifying individuals at risk [22]. Mental health illnesses can pose a challenge in terms of diagnosis, as their disease patterns are interchangeable and complex. In this case, AI and ML could potentially address the challenge through their capacity to analyze extensive patient data, “including medical records, genetic information, and behavioral patterns” [23], thus enhancing diagnostic accuracy. Utilizing AI in the field of mental health also has the potential to establish diagnoses more objectively and detect early stages of disease where signs are frequently overlooked [24].
Utilization of AI and ML algorithms for depression provides meaningful insight into the disease, more effective drug regimens, and some predictive ability regarding patient outcomes [25]. Diagnosis of depression can be challenging, as it is highly heterogeneous, while it can also be underdiagnosed, as many individuals do not seek medical care due to the perceived stigma [26]. In the case of depression, prevention is of utmost importance, even more so than the diagnosis, as preventative actions significantly limit prevalence [27]. AI and ML algorithms have the capacity to possibly predict the development of depression by simply identifying certain environmental factors that put an individual at greater risk [28].
AI and ML, in the context of depression, could potentially be used to identify even minor signs, suggesting the presence of the disease based on behavioral and linguistic patterns. For instance, the patient’s vocal tone and pattern could point the algorithm towards a direction ranging from major depressive disorder to mild anxiety. Additionally, AI algorithms show promise in the ability to analyze specific brain areas, such as the amygdala, anterior cingulate cortex, and prefrontal cortex, that have been linked with anxiety and depression based on neuroimaging data [29]. Elnaggar et al. (2024) emphasize the pivotal role of electroencephalogram (EEG) analysis in advancing AI-driven approaches for depression diagnosis, demonstrating how EEG signals can be effectively leveraged to identify depression biomarkers [30]. In the realm of social media, Hasib et al. (2023) provide a comprehensive review of machine learning and deep learning techniques applied to social network data for depression detection, highlighting the efficacy of these methods in analyzing user-generated content to identify depressive symptoms [31]. Expanding beyond depression, Altomi et al. (2024) introduce a deep learning-based framework for diagnosing autism spectrum disorder (ASD) using facial images [32]. Their methodology employs attentional feature fusion with NasNetMobile and DeiT networks to capture intricate patterns and facial characteristics pertinent to ASD identification.
The aim of our study is to explore the association between depression and certain environmental factors, such as demographic characteristics, socioeconomics, general health, and habits, using four machine learning methods. Identifying which factors show a positive association and which are protective would allow for the creation of an algorithm that could predict and accurately diagnose depression, leading to earlier diagnosis and therefore prevention of worse outcomes, as well as adequate adaptation of therapy and treatment, thus limiting depression prevalence.

2. Materials and Methods

2.1. Study Sample and Research Design

The sample for this cross-sectional study included 1227 subjects, consisting of 657 women (53.5%) and 570 men (46.5%), with an average age of 49.94 ± 14.87 years (ranging from 19 to 76; median age 50 years). The sample selection, which took place between September 2016 and June 2022, was based on a two-stage stratified sampling scheme of adult people (18 years and older) residing in the culturally diverse region of Thrace, the northeastern prefecture of Greece, which includes a wide range of national, ethnolinguistic, and religious communities. The sampling procedure’s first stage involved dividing Thrace into two strata based on population size: urban (40% of the total population) and semi-urban or rural (60% of the total population). In the second step, participants were selected proportionally to the size of each stratum using a technique that randomly generated phone numbers using the area code. The participants consented to be interviewed in their home by field researchers and to complete the study questionnaires in a one-hour interview after the study’s purpose was explained to them. More details about the research design of this study are reported in Serdari et al. [33]. The overall response rate was 72.2%, which is fairly good for Greek standards (compared to 44.5% and 72% in the studies of Paparrigopoulos et al. [34] and Touloumi et al. [35], respectively). With 42.7% of the final sample coming from urban regions, 57.3% from rural areas, 65.8% from Greek Christians, 29.2% from Greek Muslims, and 5.1% from Greek expatriates, the sampling plan ensured that the sample was chosen at random and was representative of the overall population of Thrace. Due to their unique habits and daily routines, the study did not include those under 18, pregnant women, night shift workers, residents of institutions for chronic illnesses, residents of correctional facilities, and residents of retirement homes.

2.2. Ethics

All the procedures included in the study were carried out according to the ethics standards of the Democritus University Ethics Committee, which approved the realization of the study according to the standards of the Declaration of Helsinki (1964) and its subsequent amendments. Finally, all the participants in the study granted their consent.

2.3. Questionnaire Design—Covariates

After an extensive literature review, with the collaboration of a psychiatrist, we started creating a questionnaire in order to identify factors significantly associated with the prevalence of depression in the adult population. Finally, a structured questionnaire was developed, consisting of three distinct categories: formal sociodemographic characteristics, lifestyle and dietary habits, and health-related characteristics. In particular, the participants were requested to provide the following information: (a) formal sociodemographic characteristics (gender, age, place of residence, education level, presence of child <6 years old, marital, cultural, financial, and employment status); (b) lifestyle and dietary habits (smoking, alcohol consumption, daily consumption of coffee, adherence to choice of Mediterranean diet [36], physical activity, midday sleep, and duration of sleep); and (c) characteristics related to health (subjective general health status, body mass index [37], chronic disease morbidity, number of chronic diseases illnesses, anxiety [38], depression [39], family history of depression, traumatic events in the life of the participants, presence of insomnia or somnolence, and sleep quality) [40,41,42].

2.4. Assessment of Depression

The Greek version of the Beck Depression Inventory (BDI) [39] was used to evaluate depression symptoms. The BDI is a popular tool to measure typical depressive symptoms and behaviors. It comprises 21 self-reported Likert scale items, each of which is rated by respondents using a four-point scale ranging from 0 (i.e., I do not feel sad) to 3 (i.e., I am so sad and unhappy that I cannot stand it) based on how each item applied to them over the previous two weeks. The overall score is the sum of all items, with greater values representing higher degrees of depression. Due to its high sensitivity, a total score of 13 is utilized as a screening threshold for major depression [43]. The Greek version of the BDI demonstrates very good internal consistency, with alpha coefficients of 0.85 for individuals who have visited a public mental health center and 0.92 for a healthy population; very good test–retest reliability, with a correlation coefficient of r = 0.89 between the two measurements; and high validity, with correlation coefficients ranging from 0.66 to 0.80 with other depression and anxiety scales [44].

2.5. Problem Definition

The participants were classified in a binary manner of “with depression” or “without depression”. Almost thirty percent of the entire cohort (29%; 352 participants; Class 1) presented with depression disorders, while the rest of them had no depression disorders (29%; 352 participants; Class 0). The employed dataset consists of 27 variables at baseline, with the target/dependent variable being the existence or non-existence of depression. Figure 1 presents the percentages of each class.

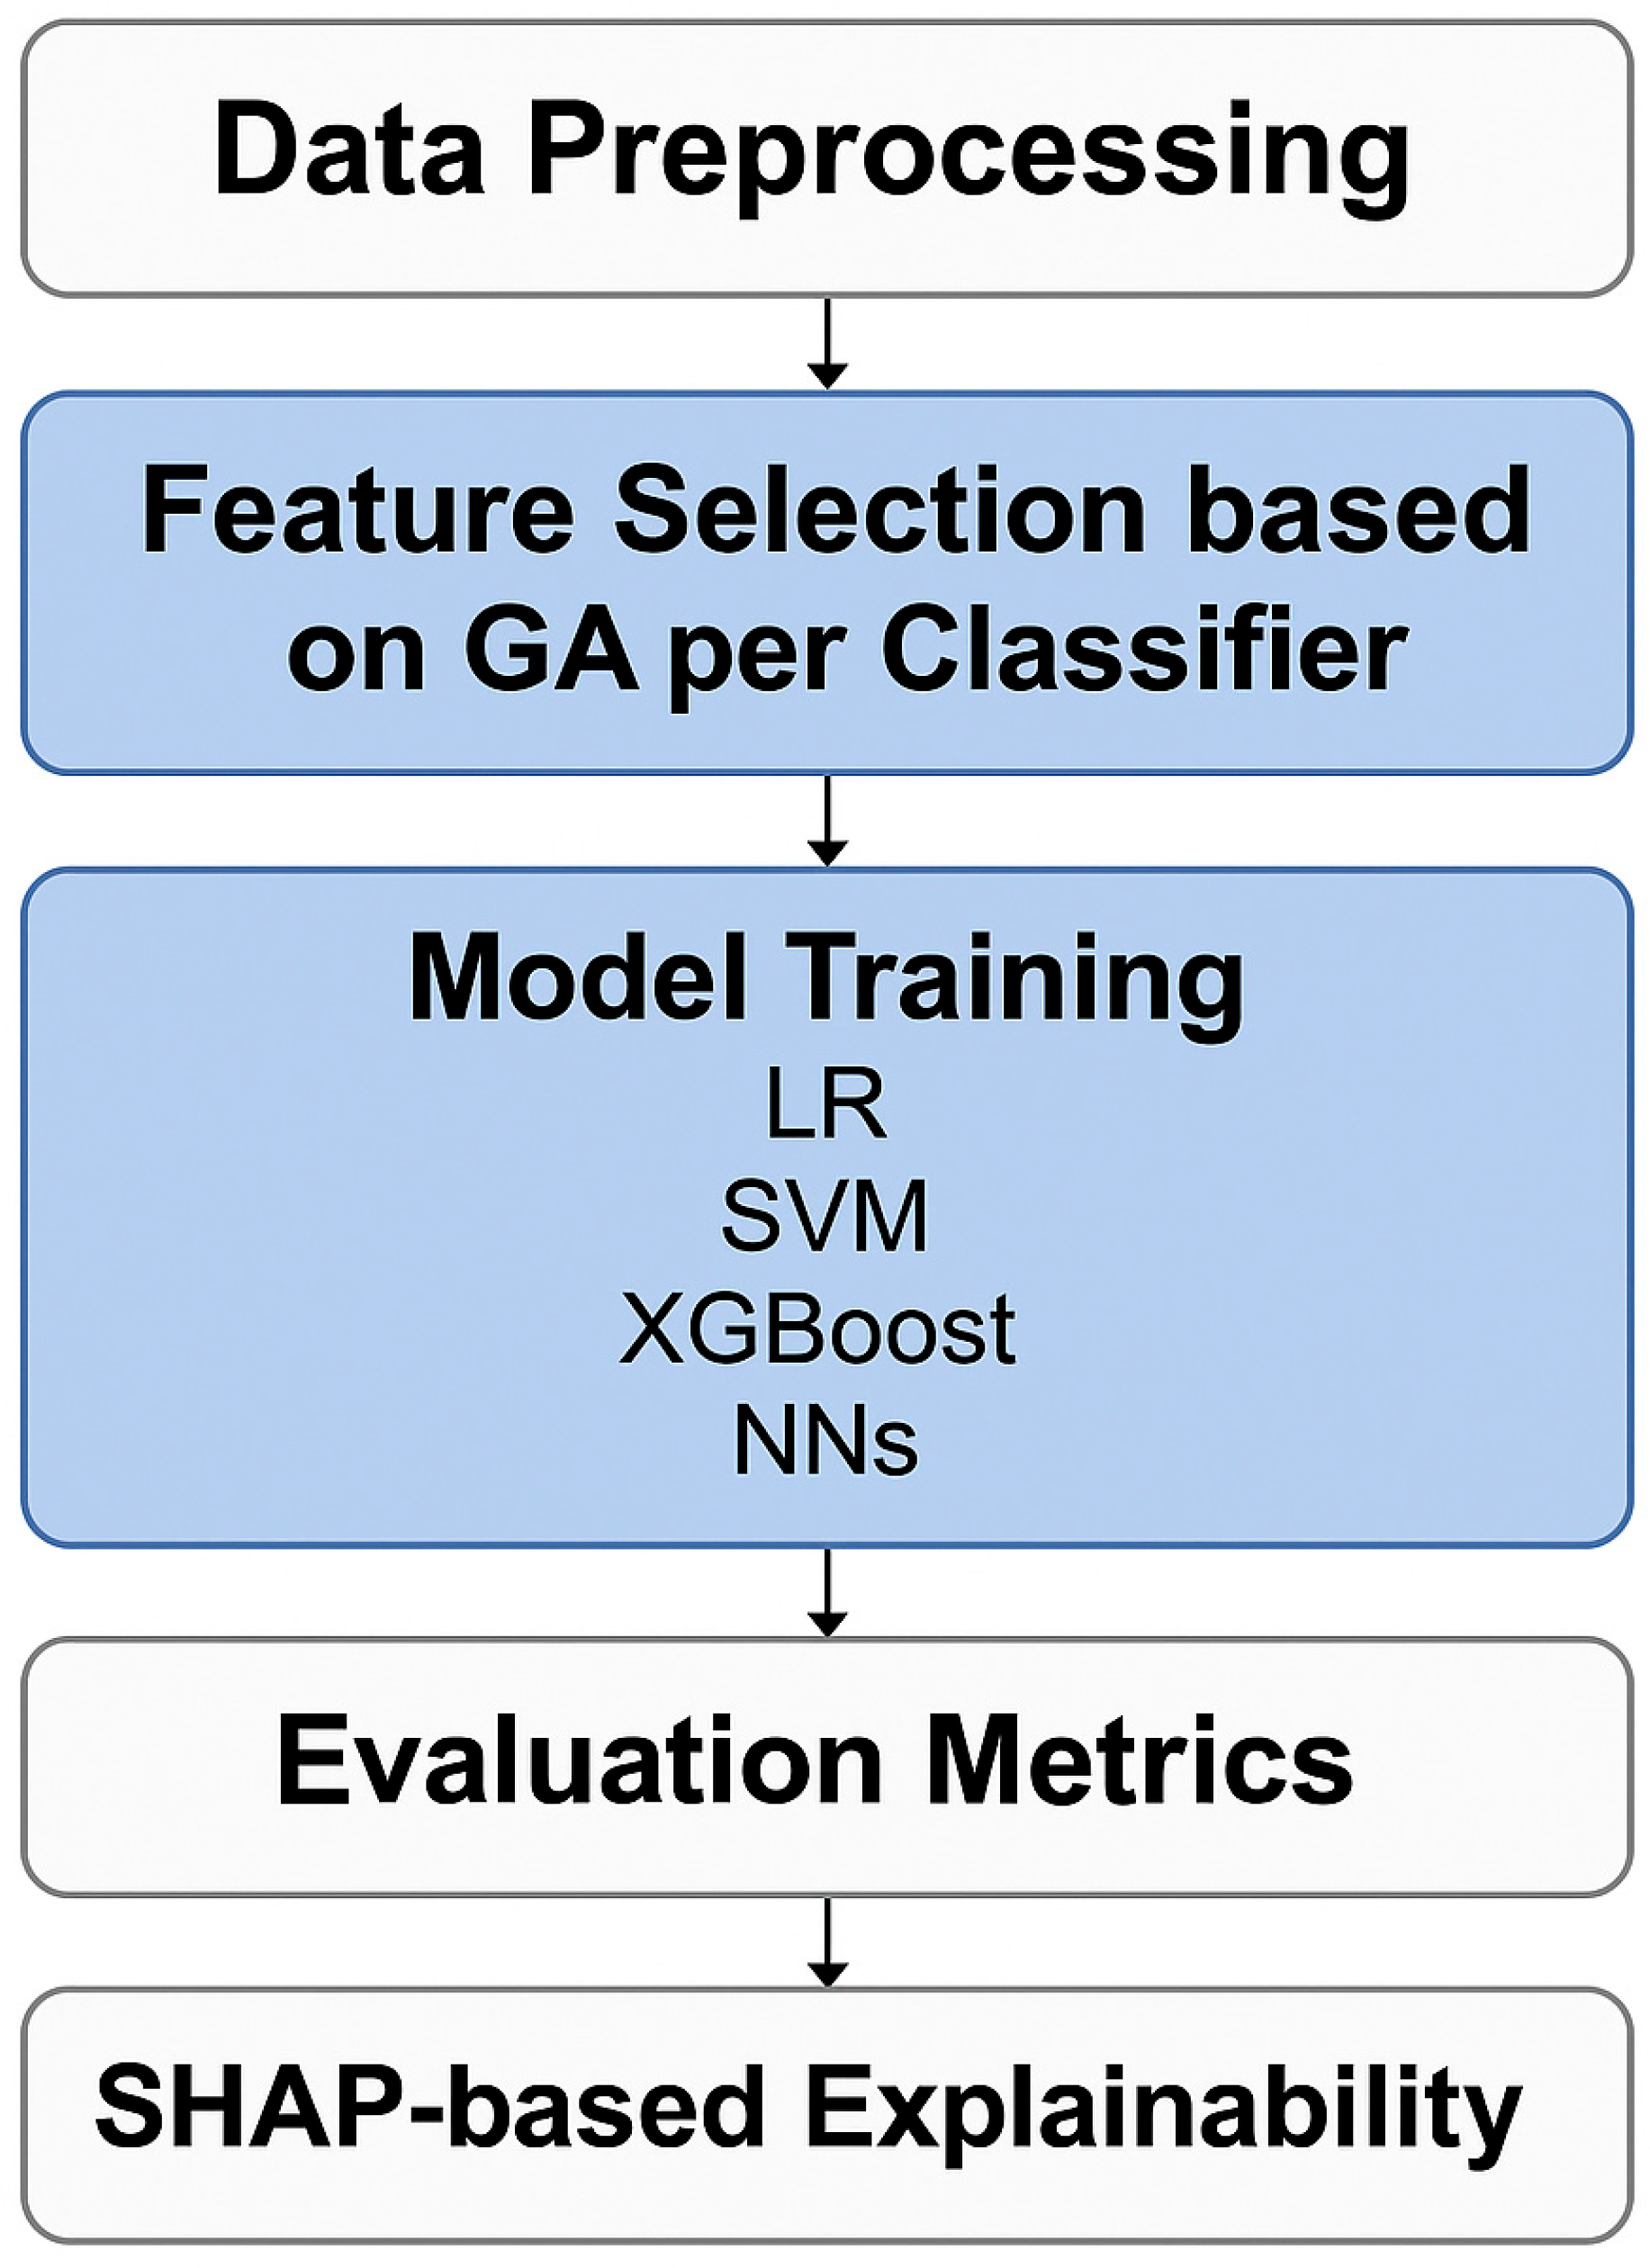
2.6. Machine Learning Workflow

To handle missing data in the dataset, the mode imputation strategy was used, which involves replacing missing values with the most frequently occurring value in the dataset. The study employed the genetic algorithm (GA) as a feature selection method to identify the optimal subset of features for improving the performance of the classifier. Four classifiers, namely, logistic regression (LR), support vector machines (SVMs), XGBoost, and neural networks (NNs), were used in the learning process, and a 70%/30% training/testing validation strategy was employed. These classifiers were selected based on their diverse strengths: LR serves as a simple and interpretable baseline; SVMs are effective in high-dimensional spaces and can model complex decision boundaries; XGBoost is powerful for capturing non-linear feature interactions and managing structured data; and NNs excel at recognizing intricate patterns in the data. Internal 10-fold cross-validation was used during the training phase to tune the hyperparameters after the undersampling step in the internal phase. The validation metrics included accuracy, recall, precision, F1 score, and specificity. The SHapley Additive exPlanations (SHAP) model assigns feature importance values using the concept of Shapley values from cooperative game theory and is a powerful tool for understanding the decision-making process of an ML model. All code for the development, training, and evaluation of the ML models was written in Python 3.9 utilizing the Scikit-learn library (https://scikit-learn.org/, accessed on 30 March 2025) as the primary framework for implementing ML algorithms and techniques. An ML pipeline was constructed to visually represent the methodology employed. The pipeline includes data preprocessing, FS using GA, training of four classifiers, evaluation through multiple metrics, and interpretation using SHAP values (Figure 2).

2.7. Statistical Analysis

Chi-squared analysis was used to evaluate whether the distribution of categorical variables, including subjects’ demographic characteristics, lifestyle habits, and health-related factors, differs significantly between individuals with depression and those without. The analysis revealed significant associations, indicating that variations in these factors are linked to differences in the prevalence of depression.

3. Results

In this section, the epidemiological profile and depression prevalence among subjects, the description of the 15 most significant risk factors, the testing results of the ML classifiers that were trained using the aforementioned risk factors, and the interpretation of the best ML model output are presented.

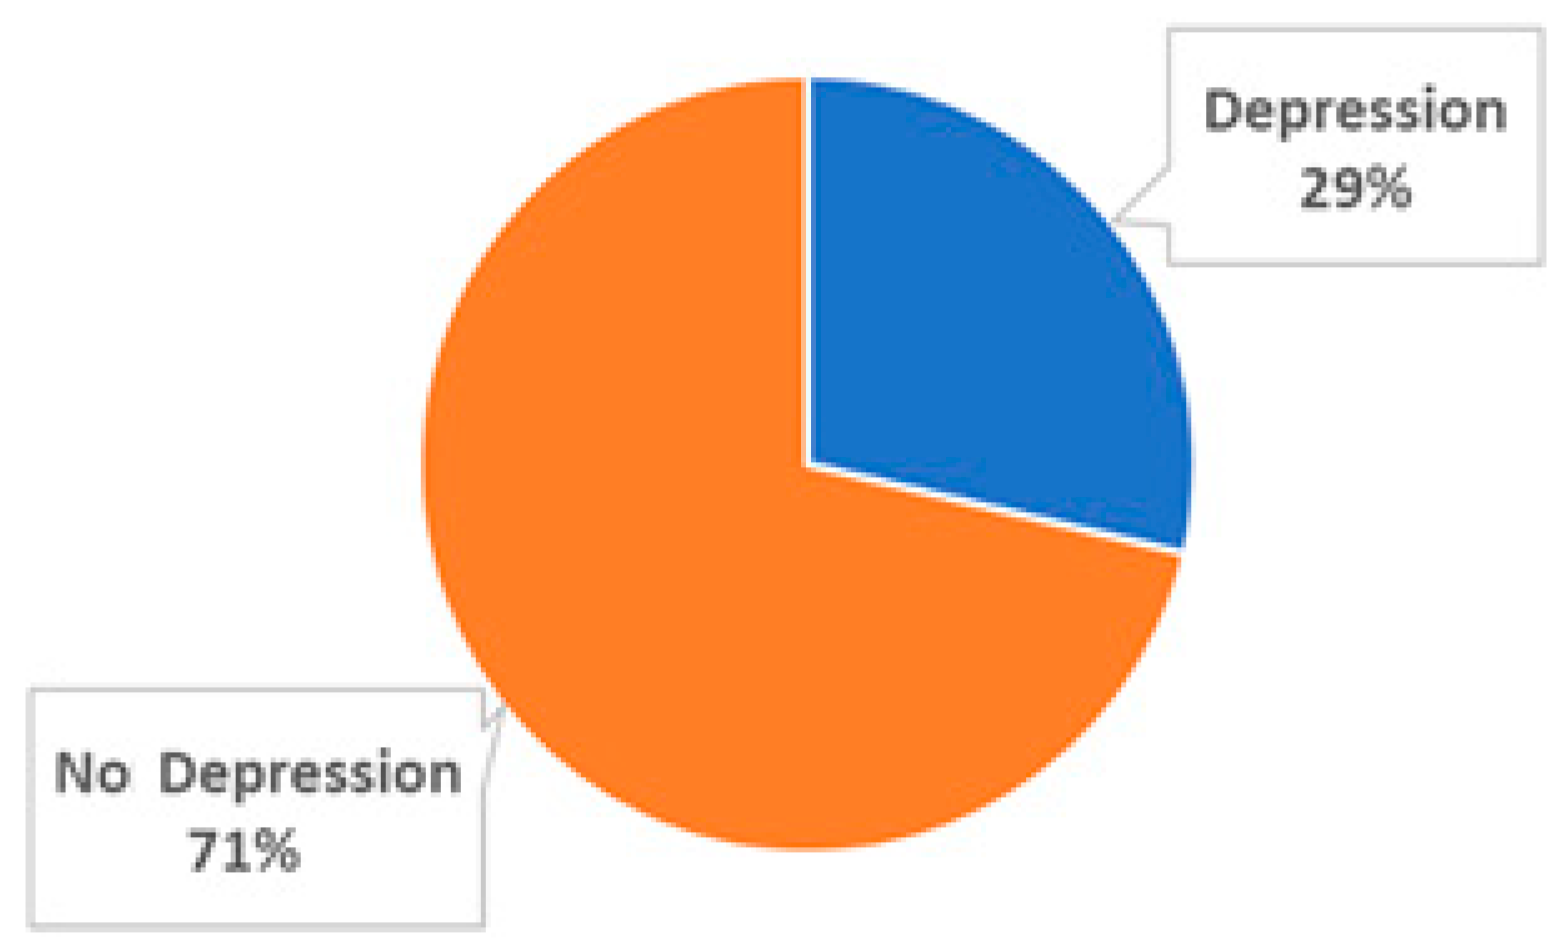
3.1. Epidemiological Profile and Depression Prevalence Among Subjects

The association of demographic characteristics with the prevalence of depression (Table 1) revealed that while gender was not significantly associated with depression (p = 0.145), age, marital status, cultural status, place of residence, education level, unemployment, and financial status showed significant differences in depression prevalence (all p < 0.001). In particular, older individuals, divorced subjects, those residing in rural areas, and participants with lower education or poorer financial conditions were more likely to experience depression. The absence of a child under six years old also showed a significant association (p = 0.029) with a higher prevalence of depression.
The association of lifestyle habits with the prevalence of depression (Table 2) revealed that depression was statistically significantly associated with alcohol consumption, coffee consumption, physical activity, and sleep duration (all p < 0.001). Subjects consuming more than four cups of coffee daily or those reporting short sleep duration had substantially higher depression rates, whereas higher levels of physical activity and lower or moderate alcohol consumption were linked to lower depression prevalence. In contrast, smoking status (p = 0.242), adherence to the Mediterranean diet (p = 0.080), and midday sleep (p = 0.101) did not show any statistically significant association with depression.
Health-related factors were strongly associated with the prevalence of depression (Table 3). Individuals with poor subjective health, chronic illnesses (especially those with multiple conditions), a positive family history of depression, exposure to traumatic life events, and anxiety symptoms were significantly more likely to be depressed (all p < 0.001). Additionally, the presence of insomnia (p = 0.042) and poor sleep quality (p = 0.008) was associated with higher depression rates, while BMI status (p = 0.103) and excessive daytime sleepiness (p = 0.704) did not demonstrate any statistically significant association with depression.

3.2. Feature Selection

Table 4 shows the 15 most significant risk factors with the highest level of significance identified using a genetic algorithm as a feature selection technique for predicting depression in a binary classification problem.

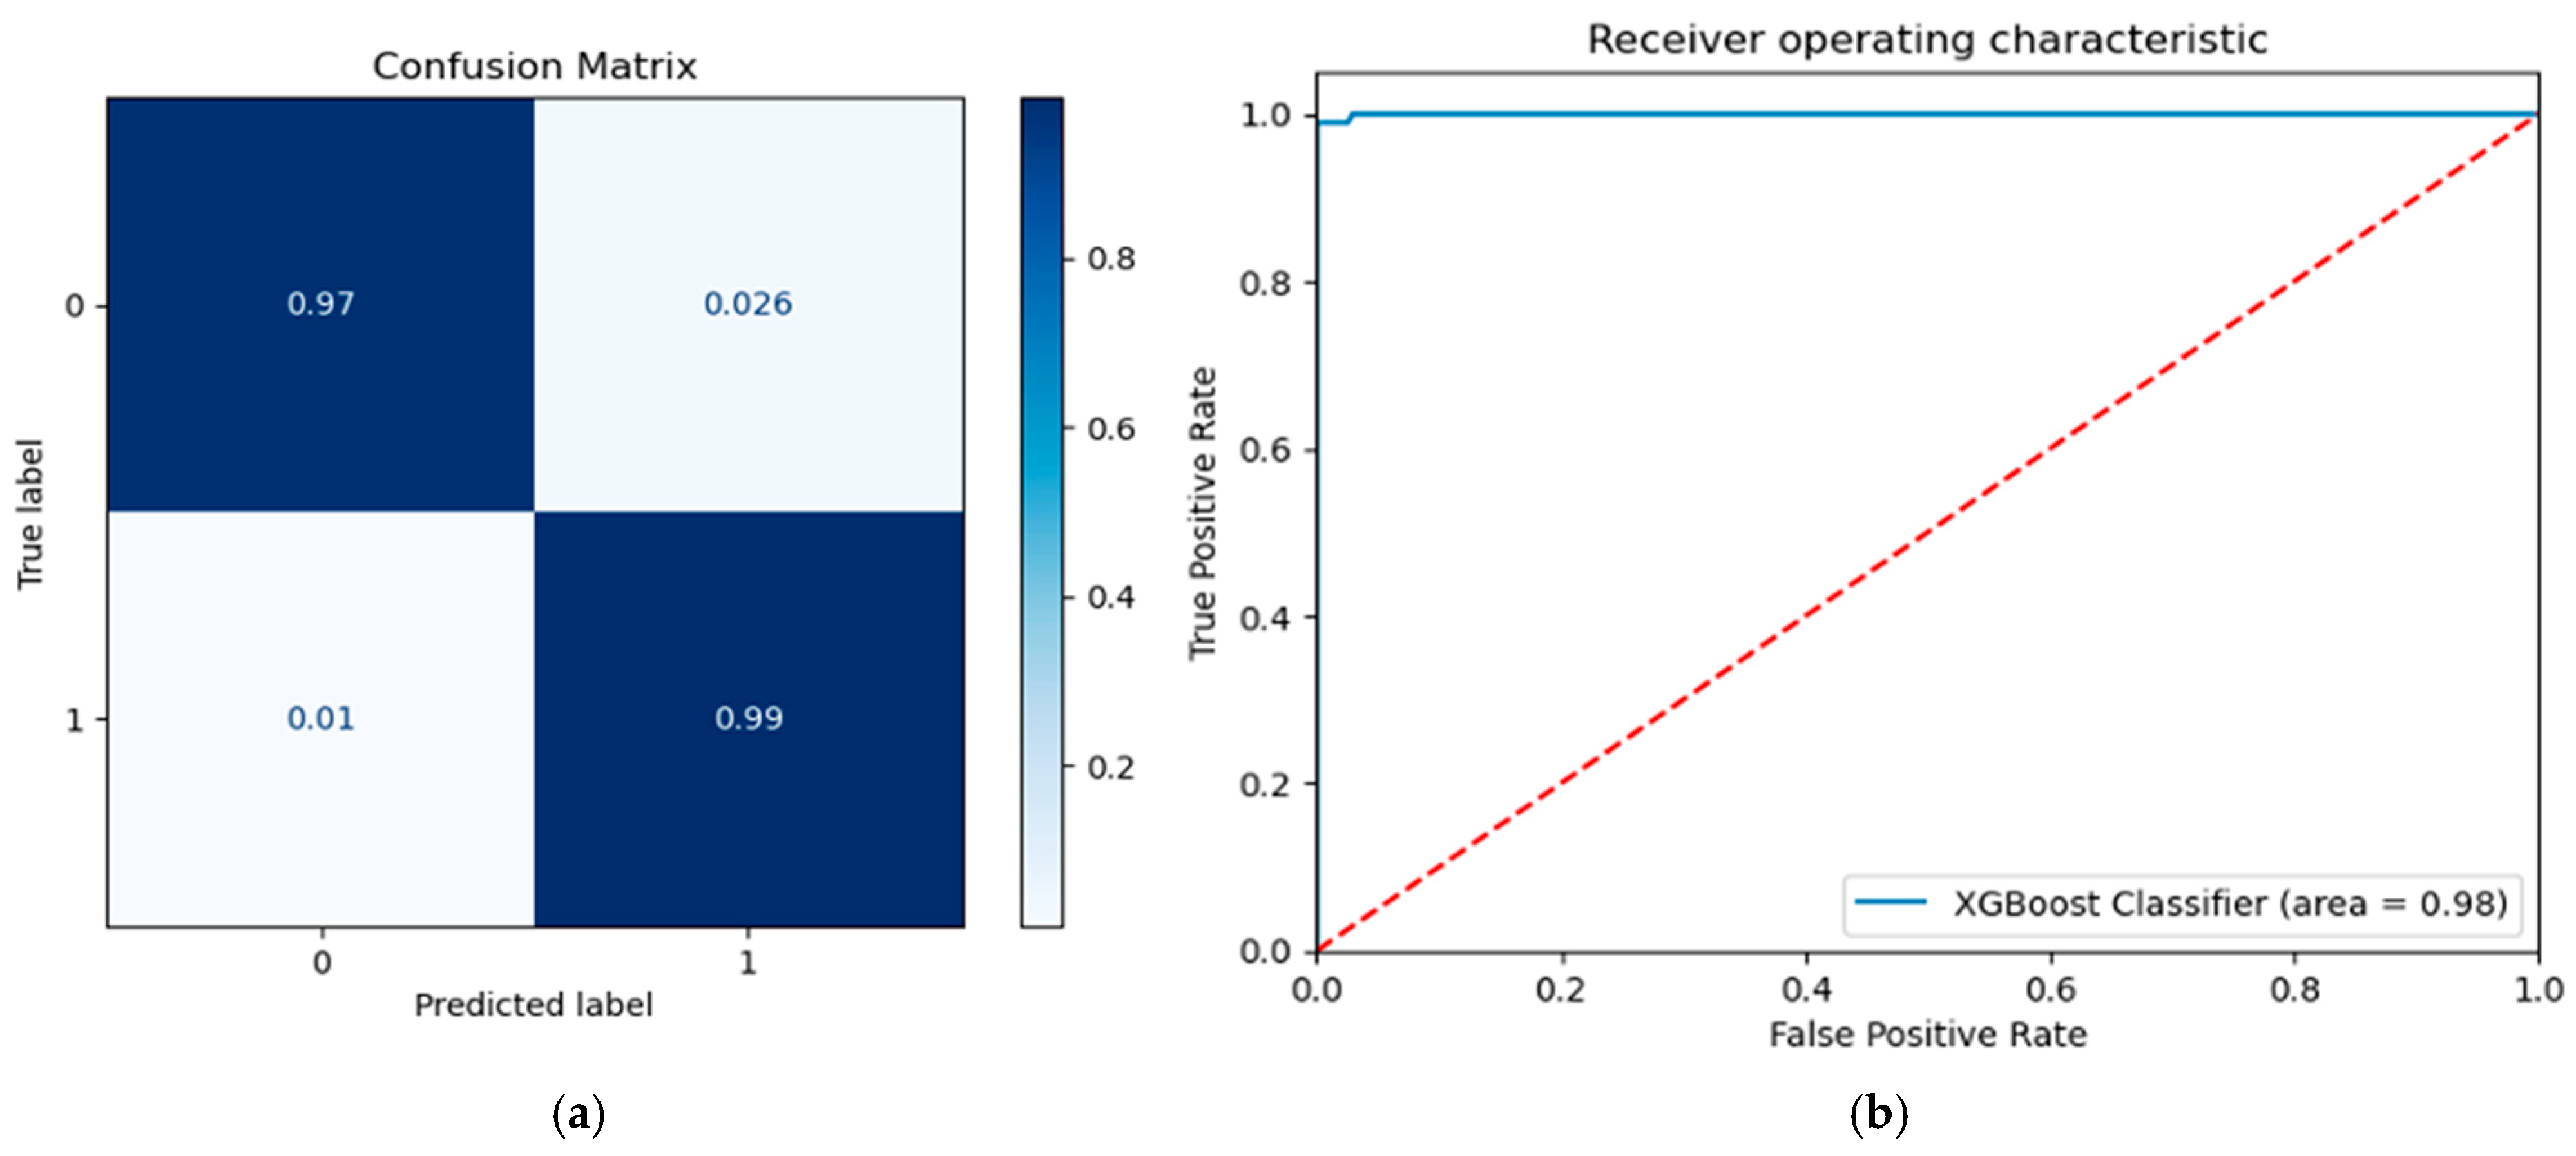
3.3. Testing Performance

Table 5 summarizes the testing performance metrics of a comparative analysis between the employed ML classifiers in this binary task. The XGBoost classifier achieved the best testing performance scores with the 15 most significant risk factors as they were selected from the GA algorithm. Specifically, 97.83% accuracy, 97.85% F1 score, 97.94% precision, 98.96% sensitivity, and 97.44% specificity were achieved by XGBoost. On the other hand, the lowest performance metrics were achieved by the LR classifier. In particular, LR achieved 79.95% accuracy, 79.04% F1 score, 78.82% precision, 79.95% sensitivity, and 90.84% specificity.
Additionally, Figure 3 depicts the normalized confusion matrix and the receiver operating characteristics (0.98) for our best ML classifier. Specifically, the XGBoost classifier achieved 0.99 sensitivity and 0.97 specificity in this binary task.

3.4. Explainability

In Figure 4, the effects of the 15 most significant risk factors on the output of the top-performing ML model (XGBoost) are illustrated. Figure 4a shows the mean absolute value of the SHAP values, which is an indicator of the SHAP global feature importance. Notably, the risk factors of anxiety, education, alcohol, BMI, and coffee had the greatest impact on the prediction output and were considered the most important features. Figure 4b displays the effect of each feature on the output of the final model (XGBoost) applied to the depression dataset. The features are sorted based on the sum of their SHAP value magnitudes across all samples. SHAP values are based on game theory and assign an importance value to each feature in a model. Features with positive SHAP values positively impact the prediction, while those with negative values have a negative impact. The magnitude is a measure of how strong the effect is.
The color of each feature represents its value (blue for low and red for high). This analysis reveals that high levels of anxiety among the participants lead to an increase in their predicted depression status. Moreover, high consumption of coffee, chronic diseases, unemployment, a Mediterranean diet, and sleepiness were associated with an increased risk of depression. On the contrary, higher education level, excessive drinking versus moderate drinking, higher BMI, being female, high income, residence in the country, and long sleep durations were associated with a reduced risk of depression.

4. Discussion

This study investigated the association between depression and multiple environmental factors, including sleep patterns, BMI, and diet. Data were collected through random phone number sampling, achieving a response rate of 72%. Participants completed a one-hour interview with healthcare professionals via phone call from their homes. The collected data were analyzed using multiple ML algorithms, including LR, NNs, SVMs, and XGBoost, with XGBoost demonstrating the highest reliability and accuracy. SHAP analysis identified several environmental factors with either positive or negative impacts on depression development. Although some SHAP-ranked features differ from those selected by GA, this reflects their differing objectives. GA identifies features enhancing classifier performance, while SHAP highlights those with the strongest influence on model output. In this discussion, we compare our findings to previous studies to better understand the factors influencing the prevalence and diagnosis of depression.
The prevalence of depression in the present study was high (28.7%), aligning with Kokaliari [45], who reported a 22.5% prevalence of moderate to severe depression within the Greek population. Similarly, Papadopoulos et al. [46] identified a high prevalence among individuals over 60 years of age living in rural Greece. Our study utilized the Greek version of the Beck Depression Inventory, which, while more effective as a screening tool than a diagnostic one, reliably identifies individuals at high risk or already experiencing depression [47].
Increased depression prevalence was observed among Greek Muslims (36.9%) and Greek expatriates (41.9%), compared to 24% among indigenous Greeks. This supports the hypothesis that culturally diverse communities are associated with a higher risk of depression, consistent with findings by Bailey et al. [48], who identified exclusion, lower socioeconomic status, and limited access to psychiatric care as key factors. Furthermore, belonging to such a group often reduces the likelihood of seeking mental health support [48], despite evidence that any form of social identity can confer protection against mental illness [49].
Higher income and financial stability were associated with a decreased risk of depression; however, consistent with previous studies, a U-shaped relationship was observed. Depression was more prevalent at very low and very high-income levels, while mid- to high-income levels were protective [50,51]. These findings echo those of Stylianidis and Souliotis [52], who reported a significant impact of unemployment and financial hardship on depression and suicidality during the Greek economic crisis.
Among all factors, educational attainment emerged as the strongest protective predictor against depression, supporting the findings of Biswas et al. [53]. Nevertheless, when coupled with unemployment, particularly during adolescence, the protective effect of education diminished. Unemployed adolescents with higher education levels showed increased anxiety and depression symptoms, driven by societal and familial pressures. Thus, the interplay between education and other socioeconomic factors should be considered when evaluating depression risk. Including vocational and skills-based courses in curricula could enhance future employment prospects [53].
Anxiety was the most significant risk factor for depression in our study, in line with existing research showing that approximately 85% of depression cases are comorbid with anxiety disorders [54,55,56]. Generalized anxiety disorder, in particular, frequently precedes depression [57]. Avoidant behaviors driven by anxiety can evolve into depression [58]. Treatments such as cognitive behavioral therapy (CBT) and antidepressants benefit both conditions [56], and neuroimaging studies suggest shared brain alterations in emotion-processing circuits [59]. The STAR*D study further highlighted that comorbid anxiety-depression leads to more severe depressive episodes and increased suicide risk [60].
Interestingly, our findings diverged from the widely reported trend of higher depression rates among females, as we found a lower prevalence among women. Although epidemiological studies commonly show a 2:1 female-to-male ratio for major depression [61], differences in symptom presentation—internalizing symptoms in men versus externalizing in women [62]—and sensitivity to interpersonal versus extrinsic factors [63] could explain this discrepancy in our sample.
Contrary to expectations, heavy drinking was negatively associated with depression risk. Depression prevalence decreased with higher alcohol consumption and increased among moderate or non-drinkers. Although alcohol dependence has been linked to depression [64], some studies suggest moderate drinking may improve mood and cognitive function [65]. This complexity highlights the need for more nuanced evaluations.
Similarly, a higher BMI was negatively associated with depression risk in our study, whereas prior research, such as that by Kraus et al. [66], linked obesity with treatment-resistant depression and worse clinical outcomes. Badillo et al. [67] found obesity to be especially detrimental for men, largely mediated by poor sleep quality. Our findings align more closely with Cui et al. [68], who described a U-shaped relationship between BMI and mental health, suggesting that maintaining a healthy weight offers the best protection.
In terms of sleep, our findings revealed that both short and prolonged sleep durations were associated with depression, reflecting Zhai et al.’s meta-analysis [69]. Although some previous studies did not find a link between longer sleep duration and depression [70,71], our data, consistent with Badillo et al. [67], suggest that sleep disturbances, potentially driven by inflammation, biochemical, or genetic mechanisms, play a key role in depression development.
Caffeine consumption also emerged as a risk factor for depression, likely through its negative effects on sleep and anxiety. However, Narita et al. [72] found that black coffee, without additives, might have protective effects due to lower inflammation and maintained brain-derived neurotrophic factor (BDNF) levels. While moderate coffee intake has been linked to reduced depression risk in prior studies, our SHAP analysis suggests that high consumption (>4 cups/day) is positively associated with depression, possibly due to sleep disruption and increased anxiety. This divergence may reflect differences in population characteristics or confounding factors.
As expected, depression was more common among individuals with chronic diseases such as diabetes, arthritis, and asthma [73], consistent with Herrera et al. [74]. However, effective self-regulation and disease management appeared to mitigate the psychological burden for some patients.
In contrast to most studies [75,76,77], adherence to a Mediterranean diet (MD) was unexpectedly associated with a higher depression risk. Although traditionally protective, issues with low adherence or misreporting might explain this contradiction, as noted by Radkhah et al. [78]. Sánchez-Villegas et al. [75] demonstrated that while B vitamins showed a protective effect, omega-3 fatty acids did not have a significant impact.
Living in rural areas was generally protective against depression, consistent with findings by Pérès et al. [79], who cited stronger social support during the COVID-19 lockdown. However, Nam et al. [80] identified farmworkers as an exception due to unique occupational stressors.
In terms of model performance, XGBoost and NNs outperformed other ML models for predicting depression-associated factors. These findings align with those of Qasrawi et al. [81], who suggested that ML models can help healthcare professionals implement preventive interventions. XGBoost was particularly noted for its superior modeling capabilities over LR, SVM, and decision trees, as supported by Sharma and Verbeke [82] and Kessler et al. [83]. The consistent advantage of ML methods underlines the importance of using sophisticated algorithms, especially as the number of predictive factors increases. However, challenges remain. Richter et al. [84] noted inconsistencies in ML performance across different datasets and methods, suggesting a need for greater standardization.
Specifically, we selected XGBoost as one of the classifiers due to its demonstrated effectiveness in handling structured, tabular data and its capacity to model complex, non-linear relationships between features. Compared to traditional models like LR and SVMs, XGBoost offers enhanced performance by employing an ensemble of decision trees optimized through gradient boosting techniques. This allows it to capture intricate patterns in the data that linear models might overlook. Furthermore, XGBoost incorporates regularization parameters to prevent overfitting, making it robust across various datasets. While NNs are powerful in modeling non-linear relationships, they often require larger datasets and more computational resources. XGBoost, on the other hand, achieves a balance between performance and computational efficiency, making it particularly suitable for our dataset and research objectives.

5. Limitations

Despite the valuable insights gained from this study, several limitations must be acknowledged. First, the cross-sectional design prevents the establishment of causal relationships between environmental factors and depression. Second, self-reported data collected via phone interviews may introduce recall bias or social desirability bias, potentially affecting the accuracy of responses. Third, although random sampling was employed, selection bias cannot be fully excluded, particularly given the 28% non-response rate. Additionally, while the Greek Beck Depression Inventory is a validated screening tool, it is not a definitive diagnostic instrument, which may influence the estimated prevalence rates. Finally, although ML models such as XGBoost and NNs demonstrated strong predictive ability, model performance could vary with different datasets or demographic contexts, and external validation with independent samples is necessary to confirm generalizability.

6. Future Directions

Most predictive studies for depression to date have relied on relatively small sample sizes, especially in the context of treatment response prediction. While small datasets are valuable for model development and hypothesis generation, larger and more diverse cohorts are crucial for building robust and generalizable machine learning models. As such datasets become available, applying more rigorous validation strategies, such as higher k-fold cross-validation or external validation using independent datasets, will be critical to ensure model reproducibility and clinical applicability. In parallel, integrating multimodal data sources such as neuroimaging, genetic profiles, and electronic health records could enhance model performance by capturing the complex, multifactorial nature of depression. Feature selection techniques and algorithm choices should also be adapted to handle high-dimensional, heterogeneous data effectively. Ultimately, future research should focus on translating predictive models into clinically deployable tools, enabling personalized treatment strategies and improving outcomes in real-world psychiatric care.

7. Conclusions

In summary, depression is a pathological illness that can affect individuals of any age and gender. It is also more frequently observed in individuals with comorbid physical illnesses. ML approaches have shown significant promise in aiding the diagnosis of various mental health conditions, including schizophrenia, depression, bipolar disorder, autism spectrum disorders, and post-traumatic stress disorder. To detect such conditions, data derived from patients’ social profiles, general clinical health status, and sensory mobile applications can be analyzed. In the present study, we examined contemporary research on the diagnosis of depression using ML-based approaches. Our aim was to provide information on the fundamental concepts of ML algorithms employed in mental health, particularly depression, and to explore their practical application. The results indicate that XGBoost outperforms traditional projection methods, demonstrating superior adaptability in predicting depression. Importantly, XGBoost’s benefits extend beyond diagnosis, offering potential for predicting the future development of the disorder. A key advantage of this method is its applicability to individualized analysis. SHAP analysis identified anxiety, education level, alcohol consumption, and BMI as the most influential predictors of depression. These findings emphasize the value of explainable ML tools like SHAP in improving transparency and guiding targeted interventions.
Future studies could focus on expanding the dataset size to enhance training and validation processes, thereby improving the model’s performance and reliability for clinical applications. As depression is a leading cause of impaired quality of life and remains challenging to predict, the application of advanced ML models like XGBoost offers a promising new direction in the therapeutic management of the disorder. The identified risk factors could contribute to the development of intelligent mental healthcare systems capable of detecting early signs of depressive symptoms, including within workplace environments.

Author Contributions

Conceptualization, C.M. (Christina Mimikou) and G.T.; methodology, C.K.; validation, F.C. and A.K.; formal analysis, C.M. (Christina Mimikou) and C.M. (Christoph Mueller); investigation, T.D. and A.S.; resources, G.T.; data curation, T.D. and C.K.; writing—original draft preparation, S.S., L.M., and D.T.; writing—review and editing, F.C., A.S., and K.T.; supervision, K.A. and A.S.; project administration, G.T. and D.T. All authors have read and agreed to the published version of the manuscript.

Funding

This research received no external funding.

Institutional Review Board Statement

The study was conducted in accordance with the Declaration of Helsinki, and approved by the Ethics Committee of the Democritus University of Thrace (Protocol Number 42570/294, Approval Date 5 March 2020).

Informed Consent Statement

All the procedures included in the study were carried out according to the ethics standards of the Democritus University Ethics Committee, which approved the realization of the study according to the standards of the Declaration of Helsinki (1964) and its subsequent amendments. All participants provided written informed consent.

Data Availability Statement

All data are available upon request.

Conflicts of Interest

The authors declare no conflicts of interest.

References

  1. Chand, S.P.; Arif, H.; Kutlenios, R.M. Depression (Nursing). In StatPearls [Internet]; StatPearls Publishing: Tampa, FL, USA, 2023. [Google Scholar]
  2. Sousa, R.D.; Henriques, A.R.; Caldas de Almeida, J.; Canhão, H.; Rodrigues, A.M. Unraveling Depressive Symptomatology and Risk Factors in a Changing World. Int. J. Environ. Res. Public. Health 2023, 20, 6575. [Google Scholar] [CrossRef] [PubMed]
  3. Mathers, C.D.; Loncar, D. Projections of Global Mortality and Burden of Disease from 2002 to 2030. PLoS Med. 2006, 3, e442. [Google Scholar] [CrossRef]
  4. Ribeiro, J.D.; Huang, X.; Fox, K.R.; Franklin, J.C. Depression and Hopelessness as Risk Factors for Suicide Ideation, Attempts and Death: Meta-Analysis of Longitudinal Studies. Br. J. Psychiatry 2018, 212, 279–286. [Google Scholar] [CrossRef]
  5. Sobieraj, M.; Williams, J.; Marley, J.; Ryan, P. The Impact of Depression on the Physical Health of Family Members. Br. J. Gen. Pract. 1998, 48, 1653–1655. [Google Scholar] [PubMed]
  6. Dagnino, P.; Ugarte, M.J.; Morales, F.; González, S.; Saralegui, D.; Ehrenthal, J.C. Risk Factors for Adult Depression: Adverse Childhood Experiences and Personality Functioning. Front. Psychol. 2020, 11, 594698. [Google Scholar] [CrossRef] [PubMed]
  7. Schuch, F.B.; Vancampfort, D.; Firth, J.; Rosenbaum, S.; Ward, P.B.; Silva, E.S.; Hallgren, M.; Ponce De Leon, A.; Dunn, A.L.; Deslandes, A.C. Physical Activity and Incident Depression: A Meta-Analysis of Prospective Cohort Studies. Am. J. Psychiatry 2018, 175, 631–648. [Google Scholar] [CrossRef]
  8. Jacka, F.N.; Pasco, J.A.; Mykletun, A.; Williams, L.J.; Hodge, A.M.; O’Reilly, S.L.; Nicholson, G.C.; Kotowicz, M.A.; Berk, M. Association of Western and Traditional Diets with Depression and Anxiety in Women. Am. J. Psychiatry 2010, 167, 305–311. [Google Scholar] [CrossRef]
  9. Baglioni, C.; Nanovska, S.; Regen, W.; Spiegelhalder, K.; Feige, B.; Nissen, C.; Reynolds, C.F., III; Riemann, D. Sleep and Mental Disorders: A Meta-Analysis of Polysomnographic Research. Psychol. Bull. 2016, 142, 969. [Google Scholar] [CrossRef]
  10. Weich, S.; Blanchard, M.; Prince, M.; Burton, E.; Erens, B.; Sproston, K. Mental Health and the Built Environment: Cross–Sectional Survey of Individual and Contextual Risk Factors for Depression. Br. J. Psychiatry 2002, 180, 428–433. [Google Scholar] [CrossRef]
  11. Nabeshima, T.; Kim, H.-C. Involvement of Genetic and Environmental Factors in the Onset of Depression. Exp. Neurobiol. 2013, 22, 235. [Google Scholar] [CrossRef]
  12. Choi, R.Y.; Coyner, A.S.; Kalpathy-Cramer, J.; Chiang, M.F.; Campbell, J.P. Introduction to Machine Learning, Neural Networks, and Deep Learning. Transl. Vis. Sci. Technol. 2020, 9, 14. [Google Scholar] [PubMed]
  13. Schlick, T.; Wei, G.-W. Machine Learning Tools Advance Biophysics. Biophys. J. 2024, 123, E1–E3. [Google Scholar] [CrossRef] [PubMed]
  14. Bi, Q.; Goodman, K.E.; Kaminsky, J.; Lessler, J. What Is Machine Learning? A Primer for the Epidemiologist. Am. J. Epidemiol. 2019, 188, 2222–2239. [Google Scholar] [CrossRef] [PubMed]
  15. Swanson, K.; Wu, E.; Zhang, A.; Alizadeh, A.A.; Zou, J. From Patterns to Patients: Advances in Clinical Machine Learning for Cancer Diagnosis, Prognosis, and Treatment. Cell 2023, 186, 1772–1791. [Google Scholar] [CrossRef]
  16. Ata, N.; Zahoor, I.; Hoda, N.; Adnan, S.M.; Vijayakumar, S.; Louis, F.; Poisson, L.; Rattan, R.; Kumar, N.; Cerghet, M. Artificial Neural Network-Based Prediction of Multiple Sclerosis Using Blood-Based Metabolomics Data. Mult. Scler. Relat. Disord. 2024, 92, 105942. [Google Scholar] [CrossRef]
  17. Egert, M.; Steward, J.E.; Sundaram, C.P. Machine Learning and Artificial Intelligence in Surgical Fields. Indian J. Surg. Oncol. 2020, 11, 573–577. [Google Scholar] [CrossRef]
  18. Singh, P.; Goyal, L.; Mallick, D.C.; Surani, S.R.; Kaushik, N.; Chandramohan, D.; Simhadri, P.K. Artificial Intelligence in Nephrology: Clinical Applications and Challenges. Kidney Med. 2024, 7, 100927. [Google Scholar] [CrossRef]
  19. Chafai, N.; Bonizzi, L.; Botti, S.; Badaoui, B. Emerging Applications of Machine Learning in Genomic Medicine and Healthcare. Crit. Rev. Clin. Lab. Sci. 2024, 61, 140–163. [Google Scholar] [CrossRef]
  20. Calderone, A.; Latella, D.; Bonanno, M.; Quartarone, A.; Mojdehdehbaher, S.; Celesti, A.; Calabrò, R.S. Towards Transforming Neurorehabilitation: The Impact of Artificial Intelligence on Diagnosis and Treatment of Neurological Disorders. Biomedicines 2024, 12, 2415. [Google Scholar] [CrossRef]
  21. Macpherson, T.; Churchland, A.; Sejnowski, T.; DiCarlo, J.; Kamitani, Y.; Takahashi, H.; Hikida, T. Natural and Artificial Intelligence: A Brief Introduction to the Interplay between AI and Neuroscience Research. Neural Netw. 2021, 144, 603–613. [Google Scholar] [CrossRef]
  22. Lee, E.E.; Torous, J.; De Choudhury, M.; Depp, C.A.; Graham, S.A.; Kim, H.-C.; Paulus, M.P.; Krystal, J.H.; Jeste, D.V. Artificial Intelligence for Mental Health Care: Clinical Applications, Barriers, Facilitators, and Artificial Wisdom. Biol. Psychiatry Cogn. Neurosci. Neuroimaging 2021, 6, 856–864. [Google Scholar] [CrossRef] [PubMed]
  23. Levkovich, I. Is Artificial Intelligence the Next Co-Pilot for Primary Care in Diagnosing and Recommending Treatments for Depression? Med. Sci. 2025, 13, 8. [Google Scholar] [CrossRef]
  24. Mansoor, M.A.; Ansari, K.H. Early Detection of Mental Health Crises through Artifical-Intelligence-Powered Social Media Analysis: A Prospective Observational Study. J. Pers. Med. 2024, 14, 958. [Google Scholar] [CrossRef] [PubMed]
  25. Park, Y.; Park, S.; Lee, M. Effectiveness of Artificial Intelligence in Detecting and Managing Depressive Disorders: Systematic Literature Review. J. Affect. Disord. 2024, 361, 445–456. [Google Scholar] [CrossRef] [PubMed]
  26. Xiaohua, L.; Jiang, K. Why Is Diagnosing MDD Challenging? Shanghai Arch. Psychiatry 2016, 28, 343. [Google Scholar]
  27. Cuijpers, P.; Beekman, A.T.; Reynolds, C.F. Preventing Depression: A Global Priority. JAMA 2012, 307, 1033–1034. [Google Scholar] [CrossRef] [PubMed]
  28. López Steinmetz, L.C.; Sison, M.; Zhumagambetov, R.; Godoy, J.C.; Haufe, S. Machine Learning Models Predict the Emergence of Depression in Argentinean College Students during Periods of COVID-19 Quarantine. Front. Psychiatry 2024, 15, 1376784. [Google Scholar] [CrossRef]
  29. Zafar, F.; Alam, L.F.; Vivas, R.R.; Wang, J.; Whei, S.J.; Mehmood, S.; Sadeghzadegan, A.; Lakkimsetti, M.; Nazir, Z. The Role of Artificial Intelligence in Identifying Depression and Anxiety: A Comprehensive Literature Review. Cureus 2024, 16, e56472. [Google Scholar] [CrossRef]
  30. Elnaggar, K.; El-Gayar, M.M.; Elmogy, M. Depression Detection and Diagnosis Based on Electroencephalogram (EEG) Analysis: A Systematic Review. Diagnostics 2025, 15, 210. [Google Scholar] [CrossRef]
  31. Hasib, K.M.; Islam, M.R.; Sakib, S.; Akbar, M.A.; Razzak, I.; Alam, M.S. Depression Detection from Social Networks Data Based on Machine Learning and Deep Learning Techniques: An Interrogative Survey. IEEE Trans. Comput. Soc. Syst. 2023, 10, 1568–1586. [Google Scholar] [CrossRef]
  32. Altomi, Z.A.; Alsakar, Y.M.; El-Gayar, M.M.; Elmogy, M.; Fouda, Y.M. Autism Spectrum Disorder Diagnosis Based on Attentional Feature Fusion Using NasNetMobile and DeiT Networks. Electronics 2025, 14, 1822. [Google Scholar] [CrossRef]
  33. Serdari, A.; Manolis, A.; Tsiptsios, D.; Vorvolakos, T.; Terzoudi, A.; Nena, E.; Tsamakis, K.; Steiropoulos, P.; Tripsianis, G. Insight into the Relationship between Sleep Characteristics and Anxiety: A Cross-Sectional Study in Indigenous and Minority Populations in Northeastern Greece. Psychiatry Res. 2020, 292, 113361. [Google Scholar] [CrossRef] [PubMed]
  34. Paparrigopoulos, T.; Tzavara, C.; Theleritis, C.; Psarros, C.; Soldatos, C.; Tountas, Y. Insomnia and Its Correlates in a Representative Sample of the Greek Population. BMC Public Health 2010, 10, 1–7. [Google Scholar] [CrossRef] [PubMed]
  35. Touloumi, G.; Karakatsani, A.; Karakosta, A.; Sofianopoulou, E.; Koustenis, P.; Gavana, M.; Alamanos, Y.; Kantzanou, M.; Konstantakopoulos, G.; Chryssochoou, X. National Survey of Morbidity and Risk Factors (EMENO): Protocol for a Health Examination Survey Representative of the Adult Greek Population. JMIR Res. Protoc. 2019, 8, e10997. [Google Scholar] [CrossRef]
  36. Panagiotakos, D.B.; Pitsavos, C.; Arvaniti, F.; Stefanadis, C. Adherence to the Mediterranean Food Pattern Predicts the Prevalence of Hypertension, Hypercholesterolemia, Diabetes and Obesity, among Healthy Adults; the Accuracy of the MedDietScore. Prev. Med. 2007, 44, 335–340. [Google Scholar] [CrossRef]
  37. World Health Organization. The World Health Report 2000: Health Systems: Improving Performance; World Health Organization: Geneva, Switzerland, 2000; ISBN 92-4-156198-X. [Google Scholar]
  38. Samakouri, M.; Bouhos, G.; Kadoglou, M.; Giantzelidou, A.; Tsolaki, K.; Livaditis, M. Standardization of the Greek Version of Zung’s Self-Rating Anxiety Scale (SAS). Psychiatr. Psychiatr. 2012, 23, 212–220. [Google Scholar]
  39. Beck, A.T.; Ward, C.H.; Mendelson, M.; Mock, J.; Erbaugh, J. An Inventory for Measuring Depression. Arch. Gen. Psychiatry 1961, 4, 561–571. [Google Scholar] [CrossRef]
  40. Soldatos, C.R.; Dikeos, D.G.; Paparrigopoulos, T.J. Athens Insomnia Scale: Validation of an Instrument Based on ICD-10 Criteria. J. Psychosom. Res. 2000, 48, 555–560. [Google Scholar] [CrossRef]
  41. Tsara, V.; Eva, S.; Amfilochiou, A.; Constantinidis, T.; Christaki, P. Greek Version of the Epworth Sleepiness Scale. Sleep Breath. 2004, 8, 91–95. [Google Scholar] [CrossRef]
  42. Kotronoulas, G.C.; Papadopoulou, C.N.; Papapetrou, A.; Patiraki, E. Psychometric Evaluation and Feasibility of the Greek Pittsburgh Sleep Quality Index (GR-PSQI) in Patients with Cancer Receiving Chemotherapy. Support. Care Cancer 2011, 19, 1831–1840. [Google Scholar] [CrossRef]
  43. Lasa, L.; Ayuso-Mateos, J.L.; Vázquez-Barquero, J.L.; Díez-Manrique, F.J.; Dowrick, C.F. The Use of the Beck Depression Inventory to Screen for Depression in the General Population: A Preliminary Analysis. J. Affect. Disord. 2000, 57, 261–265. [Google Scholar] [CrossRef] [PubMed]
  44. Giannakou, M.; Roussi, P.; Kosmides, M.-E.; Kiosseoglou, G.; Adamopoulou, A.; Garyfallos, G. Adaptation of the Beck Depression Inventory-II to Greek Population. Hell. J. Psychol. 2013, 10, 120–146. [Google Scholar]
  45. Kokaliari, E. Quality of Life, Anxiety, Depression, and Stress among Adults in Greece Following the Global Financial Crisis. Int. Soc. Work 2018, 61, 410–424. [Google Scholar] [CrossRef]
  46. Papadopoulos, F.; Petridou, E.; Argyropoulou, S.; Kontaxakis, V.; Dessypris, N.; Anastasiou, A.; Katsiardani, K.; Trichopoulos, D.; Lyketsos, C. Prevalence and Correlates of Depression in Late Life: A Population Based Study from a Rural Greek Town. Int. J. Geriatr. Psychiatry J. Psychiatry Late Life Allied Sci. 2005, 20, 350–357. [Google Scholar] [CrossRef]
  47. Edelstein, B.A.; Drozdick, L.W.; Ciliberti, C.M. Chapter 1—Assessment of Depression and Bereavement in Older Adults. In Handbook of Assessment in Clinical Gerontology, 2nd ed.; Lichtenberg, P.A., Ed.; Academic Press: San Diego, CA, USA, 2010; pp. 3–43. ISBN 978-0-12-374961-1. [Google Scholar]
  48. Bailey, R.K.; Mokonogho, J.; Kumar, A. Racial and Ethnic Differences in Depression: Current Perspectives. Neuropsychiatr. Dis. Treat. 2019, 15, 603–609. [Google Scholar] [CrossRef]
  49. Brance, K.; Chatzimpyros, V.; Bentall, R.P. Increased Social Identification Is Linked with Lower Depressive and Anxiety Symptoms among Ethnic Minorities and Migrants: A Systematic Review and Meta-Analysis. Clin. Psychol. Rev. 2023, 99, 102216. [Google Scholar] [CrossRef]
  50. Li, C.; Ning, G.; Wang, L.; Chen, F. More Income, Less Depression? Revisiting the Nonlinear and Heterogeneous Relationship between Income and Mental Health. Front. Psychol. 2022, 13, 1016286. [Google Scholar] [CrossRef] [PubMed]
  51. Parra-Mujica, F.; Johnson, E.; Reed, H.; Cookson, R.; Johnson, M. Understanding the Relationship between Income and Mental Health among 16-to 24-Year-Olds: Analysis of 10 Waves (2009–2020) of Understanding Society to Enable Modelling of Income Interventions. PLoS ONE 2023, 18, e0279845. [Google Scholar] [CrossRef]
  52. Stylianidis, S.; Souliotis, K. The Impact of the Long-Lasting Socioeconomic Crisis in Greece. BJPsych Int. 2019, 16, 16–18. [Google Scholar] [CrossRef]
  53. Biswas, M.M.; Das, K.C.; Sheikh, I. Psychological Implications of Unemployment among Higher Educated Migrant Youth in Kolkata City, India. Sci. Rep. 2024, 14, 10171. [Google Scholar] [CrossRef]
  54. Tiller, J.W. Depression and Anxiety. Med. J. Aust. 2013, 16, S28–S31. [Google Scholar] [CrossRef] [PubMed]
  55. Santomauro, D.F.; Herrera, A.M.M.; Shadid, J.; Zheng, P.; Ashbaugh, C.; Pigott, D.M.; Abbafati, C.; Adolph, C.; Amlag, J.O.; Aravkin, A.Y. Global Prevalence and Burden of Depressive and Anxiety Disorders in 204 Countries and Territories in 2020 Due to the COVID-19 Pandemic. Lancet 2021, 398, 1700–1712. [Google Scholar] [CrossRef]
  56. Wittchen, H.-U.; Kessler, R.C.; Pfister, H.; Höfler, M.; Lieb, R. Why Do People with Anxiety Disorders Become Depressed? A Prospective-Longitudinal Community Study. Acta Psychiatr. Scand. 2000, 102, 14–23. [Google Scholar] [CrossRef]
  57. Horn, P.J.; Wuyek, L.A. Anxiety Disorders as a Risk Factor for Subsequent Depression. Int. J. Psychiatry Clin. Pract. 2010, 14, 244–247. [Google Scholar] [CrossRef]
  58. Jacobson, N.C.; Newman, M.G. Avoidance Mediates the Relationship between Anxiety and Depression over a Decade Later. J. Anxiety Disord. 2014, 28, 437–445. [Google Scholar] [CrossRef]
  59. McTeague, L.M.; Rosenberg, B.M.; Lopez, J.W.; Carreon, D.M.; Huemer, J.; Jiang, Y.; Chick, C.F.; Eickhoff, S.B.; Etkin, A. Identification of Common Neural Circuit Disruptions in Emotional Processing across Psychiatric Disorders. Am. J. Psychiatry 2020, 177, 411–421. [Google Scholar] [CrossRef] [PubMed]
  60. Fava, M.; Alpert, J.E.; Carmin, C.N.; Wisniewski, S.R.; Trivedi, M.H.; Biggs, M.M.; Shores-Wilson, K.; Morgan, D.; Schwartz, T.; Balasubramani, G. Clinical Correlates and Symptom Patterns of Anxious Depression among Patients with Major Depressive Disorder in STAR* D. Psychol. Med. 2004, 34, 1299–1308. [Google Scholar] [CrossRef]
  61. Salk, R.H.; Hyde, J.S.; Abramson, L.Y. Gender Differences in Depression in Representative National Samples: Meta-Analyses of Diagnoses and Symptoms. Psychol. Bull. 2017, 143, 783. [Google Scholar] [CrossRef]
  62. Bartels, M.; Cacioppo, J.T.; van Beijsterveldt, T.C.; Boomsma, D.I. Exploring the Association between Well-Being and Psychopathology in Adolescents. Behav. Genet. 2013, 43, 177–190. [Google Scholar] [CrossRef]
  63. Kendler, K.S.; Gardner, C.O. Sex Differences in the Pathways to Major Depression: A Study of Opposite-Sex Twin Pairs. Am. J. Psychiatry 2014, 171, 426–435. [Google Scholar] [CrossRef]
  64. Kuria, M.W.; Ndetei, D.M.; Obot, I.S.; Khasakhala, L.I.; Bagaka, B.M.; Mbugua, M.N.; Kamau, J. The Association between Alcohol Dependence and Depression before and after Treatment for Alcohol Dependence. Int. Sch. Res. Not. 2012, 2012, 482802. [Google Scholar] [CrossRef] [PubMed]
  65. Baum-Baicker, C. The Psychological Benefits of Moderate Alcohol Consumption: A Review of the Literature. Drug Alcohol Depend. 1985, 15, 305–322. [Google Scholar] [CrossRef] [PubMed]
  66. Kraus, C.; Kautzky, A.; Watzal, V.; Gramser, A.; Kadriu, B.; Deng, Z.-D.; Bartova, L.; Zarate Jr, C.A.; Lanzenberger, R.; Souery, D. Body Mass Index and Clinical Outcomes in Individuals with Major Depressive Disorder: Findings from the GSRD European Multicenter Database. J. Affect. Disord. 2023, 335, 349–357. [Google Scholar] [CrossRef]
  67. Badillo, N.; Khatib, M.; Kahar, P.; Khanna, D. Correlation between Body Mass Index and Depression/Depression-like Symptoms among Different Genders and Races. Cureus 2022, 14, e21841. [Google Scholar] [CrossRef]
  68. Cui, H.; Xiong, Y.; Wang, C.; Ye, J.; Zhao, W. The Relationship between BMI and Depression: A Cross-Sectional Study. Front. Psychiatry 2024, 15, 1410782. [Google Scholar] [CrossRef]
  69. Zhai, L.; Zhang, H.; Zhang, D. Sleep Duration and Depression among Adults: A Meta-analysis of Prospective Studies. Depress. Anxiety 2015, 32, 664–670. [Google Scholar] [CrossRef]
  70. Vorvolakos, T.; Leontidou, E.; Tsiptsios, D.; Mueller, C.; Serdari, A.; Terzoudi, A.; Nena, E.; Tsamakis, K.; Constantinidis, T.C.; Tripsianis, G. The Association between Sleep Pathology and Depression: A Cross-Sectional Study among Adults in Greece. Psychiatry Res. 2020, 294, 113502. [Google Scholar] [CrossRef]
  71. Gehrman, P.; Seelig, A.D.; Jacobson, I.G.; Boyko, E.J.; Hooper, T.I.; Gackstetter, G.D.; Ulmer, C.S.; Smith, T.C. Millennium Cohort Study Team Predeployment Sleep Duration and Insomnia Symptoms as Risk Factors for New-Onset Mental Health Disorders Following Military Deployment. Sleep 2013, 36, 1009–1018. [Google Scholar] [CrossRef] [PubMed]
  72. Narita, Z.; Hidese, S.; Kanehara, R.; Tachimori, H.; Hori, H.; Kim, Y.; Kunugi, H.; Arima, K.; Mizukami, S.; Tanno, K. Association of Sugary Drinks, Carbonated Beverages, Vegetable and Fruit Juices, Sweetened and Black Coffee, and Green Tea with Subsequent Depression: A Five-Year Cohort Study. Clin. Nutr. 2024, 43, 1395–1404. [Google Scholar] [CrossRef]
  73. Lotfaliany, M.; Bowe, S.J.; Kowal, P.; Orellana, L.; Berk, M.; Mohebbi, M. Depression and Chronic Diseases: Co-Occurrence and Communality of Risk Factors. J. Affect. Disord. 2018, 241, 461–468. [Google Scholar] [CrossRef]
  74. Herrera Salinas, P.A.; Campos Romero, S.; Szabo Lagos, W.M.; Martínez, P.; Guajardo Tobar, V.A.; Rojas Castillo, M.G. Understanding the Relationship between Depression and Chronic Diseases Such as Diabetes and Hypertension: A Grounded Theory Study. Int. J. Environ. Res. Public Health 2021, 18, 12130. [Google Scholar]
  75. Sánchez-Villegas, A.; Henríquez, P.; Bes-Rastrollo, M.; Doreste, J. Mediterranean Diet and Depression. Public Health Nutr. 2006, 9, 1104–1109. [Google Scholar] [CrossRef] [PubMed]
  76. Mamalaki, E.; Ntanasi, E.; Hatzimanolis, A.; Basta, M.; Kosmidis, M.H.; Dardiotis, E.; Hadjigeorgiou, G.M.; Sakka, P.; Scarmeas, N.; Yannakoulia, M. The Association of Adherence to the Mediterranean Diet with Depression in Older Adults Longitudinally Taking into Account Cognitive Status: Results from the HELIAD Study. Nutrients 2023, 15, 359. [Google Scholar] [CrossRef] [PubMed]
  77. Yin, W.; Löf, M.; Chen, R.; Hultman, C.M.; Fang, F.; Sandin, S. Mediterranean Diet and Depression: A Population-Based Cohort Study. Int. J. Behav. Nutr. Phys. Act. 2021, 18, 1–10. [Google Scholar] [CrossRef]
  78. Radkhah, N.; Rasouli, A.; Majnouni, A.; Eskandari, E.; Parastouei, K. The Effect of Mediterranean Diet Instructions on Depression, Anxiety, Stress, and Anthropometric Indices: A Randomized, Double-Blind, Controlled Clinical Trial. Prev. Med. Rep. 2023, 36, 102469. [Google Scholar] [CrossRef] [PubMed]
  79. Pérès, K.; Ouvrard, C.; Koleck, M.; Rascle, N.; Dartigues, J.; Bergua, V.; Amieva, H. Living in Rural Area: A Protective Factor for a Negative Experience of the Lockdown and the COVID-19 Crisis in the Oldest Old Population? Int. J. Geriatr. Psychiatry 2021, 36, 1950–1958. [Google Scholar] [CrossRef]
  80. Nam, S.M.; Peterson, T.A.; Seo, K.Y.; Han, H.W.; Kang, J.I. Discovery of Depression-Associated Factors from a Nationwide Population-Based Survey: Epidemiological Study Using Machine Learning and Network Analysis. J. Med. Internet Res. 2021, 23, e27344. [Google Scholar] [CrossRef]
  81. Qasrawi, R.; Vicuna Polo, S.; Al-Halawa, D.A.; Hallaq, S.; Abdeen, Z. Schoolchildren’depression and Anxiety Risk Factors Assessment and Prediction: Machine Learning Techniques Performance Analysis. JMIR Form. Res. 2022, 31, e32736. [Google Scholar]
  82. Sharma, A.; Verbeke, W.J. Improving Diagnosis of Depression with XGBOOST Machine Learning Model and a Large Biomarkers Dutch Dataset (N = 11,081). Front. Big Data 2020, 3, 523466. [Google Scholar] [CrossRef]
  83. Kessler, R.C.; van Loo, H.M.; Wardenaar, K.J.; Bossarte, R.M.; Brenner, L.A.; Cai, T.; Ebert, D.D.; Hwang, I.; Li, J.; de Jonge, P. Testing a Machine-Learning Algorithm to Predict the Persistence and Severity of Major Depressive Disorder from Baseline Self-Reports. Mol. Psychiatry 2016, 21, 1366–1371. [Google Scholar] [CrossRef]
  84. Richter, T.; Fishbain, B.; Richter-Levin, G.; Okon-Singer, H. Machine Learning-Based Behavioral Diagnostic Tools for Depression: Advances, Challenges, and Future Directions. J. Pers. Med. 2021, 11, 957. [Google Scholar] [CrossRef] [PubMed]
Figure 1. Grouping of the employed participants: No depression, Class 0 (n = 875 participants); Depression, Class 1 (n = 352 participants).
Diagnostics 15 01412 g001
Figure 2. ML workflow.
Diagnostics 15 01412 g002
Figure 3. For the best ML classifier (XGBoost), (a) the confusion matrix and (b) receiver operating characteristics are presented.
Diagnostics 15 01412 g003
Figure 4. Risk factors on XGBoost ML classifier output for the diagnosis of depression. This figure presents (a) the SHAP feature importance and (b) the SHAP summary plot for the XGBoost trained on the risk factors selected by the GA. The dotted boxes in each image highlight the suggested features with the highest contribution.
Diagnostics 15 01412 g004
Table 1. Prevalence of depression in relation to subjects’ demographic characteristics.
Depression
Number (%)FrequencyProportion (%)p Value
Gender 0.145
  Males570 (46.5)15226.7
  Females657 (53.5)20030.4
Age (years) <0.001
  ≤40 341 (27.8)4212.3
  41–60 571 (46.5)16428.7
  >60 315 (25.7)14646.3
Marital status <0.001
  Married825 (67.2)25731.2
  Single252 (20.5)4116.3
  Divorced102 (8.3)4241.2
  Widowed48 (3.9)1225.0
Cultural status <0.001
  Greek Christians807 (65.7)19424.0
  Greek Muslims358 (29.2)13236.9
  Expatriated Greeks62 (5.1)2641.9
Place of residence <0.001
  Urban524 (42.7)8816.8
  Rural703 (57.3)26437.6
Education level <0.001
  Low406 (33.1)21152.0
  Medium431 (35.1)9822.7
  High390 (31.8)4311.0
Presence of child <6 years 0.029
  No1128 (91.9)33329.5
  Yes99 (8.1)1919.2
Unemployment <0.001
  No1121 (91.4)30327.0
  Yes106 (8.6)4946.2
Financial status <0.001
  Low614 (50.0)21334.7
  Medium258 (21.0)3312.8
  High180 (14.7)2916.1
Table 2. Prevalence of depression in relation to subjects’ lifestyle habits.
Depression
Number (%)FrequencyProportion (%)p Value
Smoking status 0.242
  Never/ex-smoker808 (65.9)22327.6
  Current smoker419 (34.1)12930.8
Alcohol consumption <0.001
  None621 (50.6)21234.1
  1–3 glasses/week316 (25.8)6921.8
  4–6 glasses/week215 (17.5)4219.5
  >6 glasses/week75 (6.1)2938.7
Coffee consumption <0.001
  None113 (9.2)3329.2
  1–2 cups/day723 (58.9)17924.8
  3–4 cups/day322 (26.2)9930.7
  >4 cups/day69 (5.6)4159.4
Adherence to Mediterranean diet 0.080
  Low968 (78.9)28929.9
  High259 (21.1)6324.3
Physical activity <0.001
  Low1031 (84.0)32131.1
  High196 (16.0)3115.8
Midday sleep 0.101
  No520 (42.4)16231.2
  Yes707 (57.6)19026.9
Sleep duration <0.001
  Short273 (22.2)13047.6
  Normal780 (63.6)17622.6
  Long174 (14.2)4626.4
Table 3. Prevalence of depression in relation to subjects’ health-related characteristics.
Depression
Number (%)FrequencyProportion (%)p Value
BMI status 0.103
  Normal415 (33.8)11327.2
  Overweight352 (28.7)9125.9
  Obese460 (37.5)14832.2
Subjective health status <0.001
  Good941 (76.7)16817.9
  Bad286 (23.3)18464.3
Morbidity of chronic illness <0.001
  No534 (43.5)9417.6
  Yes693 (56.5)25837.2
Number of chronic diseases <0.001
  None 534 (43.5)9417.6
  One360 (29.3)9726.9
  Two208 (17.0)8741.8
  More than two125 (10.2)7459.2
Family history of depression <0.001
  No812 (66.2)19924.5
  Yes415 (33.8)15336.9
Traumatic events in life <0.001
  No716 (58.4)15521.6
  Yes511 (41.6)19738.6
Anxiety symptoms <0.001
  No813 (66.3)11914.6
  Yes414 (33.7)23356.3
Excessive daytime sleepiness 0.704
  No1120 (91.3)32328.8
  Yes107 (8.7)2927.1
Presence of insomnia 0.042
  No1015 (82.7)27927.5
  Yes212 (17.3)7334.4
Sleep quality 0.008
  Good765 (62.3)19926.0
  Bad462 (37.7)15333.1
Table 4. Ranking of the most informative risk factors in depression diagnosis using a genetic algorithm.
Risk FactorDescriptionType of Variable
GenderGender (male/female)Categorical
Marital statusMarital status (single/married/divorced/widowed)Categorical
ResidenceArea of residence (urban/rural)Categorical
EducationEducation level (low/medium/high)Categorical
UnemploymentUnemployment (no/yes)Categorical
IncomeIncome (low/medium/high)Categorical
Chronic diseasesChronic diseases (no/yes)Categorical
BMIBody mass index (normal/overweight/obese)Categorical
AlcoholAlcohol consumption/week (none/1–3 glasses/4–6 glasses/>6 glasses)Categorical
CoffeeCoffee consumption/day (none/1–2 glasses/3–4 glasses/>4 glasses)Categorical
Mediterranean dietAdherence to Mediterranean diet (no/yes)Categorical
Child <6 yearsPresence of a child younger than 6 years of age (no/yes)Categorical
Sleep durationSleep duration (short/normal/long)Categorical
SleepinessExcessive daytime sleepiness (no/yes)Categorical
AnxietyAnxiety (no/yes)Categorical
Table 5. Metrics of testing performance for the employed classifiers.
ClassifierAccuracy (%)F1 Score
(%)
Precision
(%)
Sensitivity
(Recall) (%)
Specificity
(%)
Hyperparameters
LR79.9579.0478.8279.9590.48C: 1, penalty: l2
SVM95.6695.6495.6395.6697.80C: 10, kernel: rbf
XGBoost97.8397.8597.9498.9697.44gamma: 0, max_depth: 7, min_child_weight: 1
NN97.0297.0397.0697.0297.44activation: tanh, alpha: 0.0001, hidden_layer_sizes: (10, 20, 50), learning_rate: constant, solver: adam
Disclaimer/Publisher’s Note: The statements, opinions and data contained in all publications are solely those of the individual author(s) and contributor(s) and not of MDPI and/or the editor(s). MDPI and/or the editor(s) disclaim responsibility for any injury to people or property resulting from any ideas, methods, instructions or products referred to in the content.

