Radiomics-Based Classification of Clear Cell Renal Cell Carcinoma ISUP Grade: A Machine Learning Approach with SHAP-Enhanced Explainability

 , , and
Abstract
1. Introduction
2. Material and Methods
2.1. Demographics
2.2. Image Acquisition
2.3. Image Analysis
2.4. Feature Selection
2.5. Model Elaboration and SHAP Values
3. Results
4. Discussion
Supplementary Materials
Author Contributions
Funding
Institutional Review Board Statement
Informed Consent Statement
Data Availability Statement
Conflicts of Interest
References
- Siegel, R.L.; Miller, K.D.; Jemal, A. Cancer statistics. CA Cancer J. Clin. 2020, 70, 7–30. [Google Scholar] [CrossRef]
- Israel, G.M.; Silverman, S.G. The incidental renal mass. Radiol. Clin. North Am. 2011, 49, 369–383. [Google Scholar] [CrossRef] [PubMed]
- Al Harbi, F.; Tabatabaeefar, L.; Jewett, M.A.; Finelli, A.; O’Malley, M.; Atri, M. Enhancement Threshold of Small (<4 cm) Solid Renal Masses on CT. AJR Am. J. Roentgenol. 2016, 206, 554–558. [Google Scholar] [CrossRef] [PubMed]
- Israel, G.M.; Bosniak, M.A. Pitfalls in renal mass evaluation and how to avoid them. Radiographics 2008, 28, 1325–1338. [Google Scholar] [CrossRef] [PubMed]
- Delahunt, B.; Eble, J.N.; Egevad, L.; Samaratunga, H. Grading of renal cell carcinoma. Histopathology 2019, 74, 4–17. [Google Scholar] [CrossRef] [PubMed]
- Rabjerg, M.; Gerke, O.; Engvad, B.; Marcussen, N. Comparing WHO/ISUP grading and Fuhrman grading with the prognostic value of nuclear area in renal cell carcinoma. Uro 2021, 1, 2–13. [Google Scholar] [CrossRef]
- Moch, H. WHO-ISUP grading system for renal carcinoma. Pathologe 2016, 37, 355–360. [Google Scholar] [CrossRef]
- Kutikov, A.; Uzzo, R.G. The R.E.N.A.L. nephrometry score: A comprehensive standardized system for quantitating renal tumor size, location and depth. J. Urol. 2009, 182, 844–853. [Google Scholar] [CrossRef] [PubMed]
- Kocak, B.; Durmaz, E.S.; Ates, E.; Kilickesmez, O. Radiomics with artificial intelligence: A practical guide for beginners. Diagn. Interv. Radiol. 2019, 25, 485–495. [Google Scholar] [CrossRef]
- Gillies, R.J.; Kinahan, P.E.; Hricak, H. Radiomics: Images are more than pictures, they are data. Radiology 2016, 278, 563–577. [Google Scholar] [CrossRef]
- Aerts, H.J.; Velazquez, E.R.; Leijenaar, R.T.H.; Parmar, C.; Grossmann, P.; Carvalho, S.; Bussink, J.; Monshouwer, R.; Haibe-Kains, B.; Rietveld, D.; et al. Decoding tumour phenotype by noninvasive imaging using a quantitative radiomics approach. Nat. Commun. 2014, 5, 4006. [Google Scholar] [CrossRef] [PubMed]
- Abrol, S.; Kotrotsou, A.; Salem, A.; Zinn, P.O.; Colen, R.R. Radiomic Phenotyping in Brain Cancer to Unravel Hidden Information in Medical Images. Top. Magn. Reson. Imaging. 2017, 26, 43–53. [Google Scholar] [CrossRef] [PubMed]
- Valdora, F.; Houssami, N.; Rossi, F.; Calabrese, M.; Tagliafico, A. Rapid review: Radiomics and breast cancer. Breast Cancer Res. Treat. 2018, 169, 217–229. [Google Scholar] [CrossRef] [PubMed]
- Sun, X.Y.; Feng, Q.X.; Xu, X.; Zhang, J.; Zhu, F.P.; Yang, Y.H.; Zhang, Y.D. Radiologic-Radiomic Machine Learning Models for Differentiation of Benign and Malignant Solid Renal Masses: Comparison with Expert-Level Radiologists. AJR Am. J. Roentgenol. 2020, 214, W44–W54. [Google Scholar] [CrossRef] [PubMed]
- Yu, H.; Scalera, J.; Khalid, M.; Touret, A.S.; Bloch, N.; Li, B.; Qureshi, M.M.; Soto, J.A.; Anderson, S.W. Texture analysis as a radiomic marker for differentiating renal tumors. Abdom. Radiol. 2017, 42, 2470–2478. [Google Scholar] [CrossRef] [PubMed]
- Yang, R.; Wu, J.; Sun, L.; Lai, S.; Xu, Y.; Liu, X.; Ma, Y.; Zhen, X. Radiomics of small renal masses on multiphase CT: Accuracy of machine learning-based classification models for the differentiation of renal cell carcinoma and benign renal tumors. Eur. Radiol. 2019, 29, 4768–4777. [Google Scholar]
- Bhandari, A.; Ibrahim, M.; Sharma, C.; Liong, R.; Gustafson, S.; Prior, M. CT-based radiomics for differentiating renal tumours: A systematic review. Abdom. Radiol. 2021, 46, 2052–2063. [Google Scholar] [CrossRef] [PubMed]
- Suarez-Ibarrola, R.; Basulto-Martinez, M.; Heinze, A.; Gratzke, C.; Miernik, A. Radiomics Applications in Renal Tumor Assessment: A Comprehensive Review of the Literature. Cancers 2020, 12, 1387. [Google Scholar] [CrossRef] [PubMed] [PubMed Central]
- Yu, W.; Liang, G.; Zeng, L.; Yang, Y.; Wu, Y. Accuracy of CT texture analysis for differentiating low-grade and high-grade renal cell carcinoma: Systematic review and meta-analysis. BMJ Open 2021, 11, e051470. [Google Scholar] [CrossRef] [PubMed] [PubMed Central]
- Sun, X.; Liu, L.; Xu, K.; Li, W.; Huo, Z.; Liu, H.; Shen, T.; Pan, F.; Jiang, Y.; Zhang, M. Radiomics-based prediction of ISUP grading in clear cell renal cell carcinoma. J. Med. Imaging 2021, 8, 014502. [Google Scholar]
- Moldovanu, C.G.; Boca, B.; Lebovici, A.; Tamas-Szora, A.; Feier, D.S.; Crisan, N.; Andras, I.; Buruian, M.M. Preoperative Predicting the WHO/ISUP Nuclear Grade of Clear Cell Renal Cell Carcinoma by Computed Tomography-Based Radiomics Features. J. Pers. Med. 2020, 11, 8. [Google Scholar] [CrossRef] [PubMed] [PubMed Central]
- Ding, J.; Xing, Z.; Jiang, Z.; Chen, J.; Pan, L.; Qiu, J.; Xing, W. CT-based radiomic model predicts high grade of clear cell renal cell carcinoma. Eur. J. Radiol. 2018, 103, 51–56. [Google Scholar] [CrossRef] [PubMed]
- Nazari, M.; Shiri, I.; Zaidi, H. Radiomics-based machine learning model to predict risk of death within 5-years in clear cell renal cell carcinoma patients. Comput. Biol. Med. 2021, 129, 104135. [Google Scholar] [CrossRef] [PubMed]
- Samek, W.; Wiegand, T.; Müller, K.R. Explainable artificial intelligence: Understanding, visualizing and interpreting deep learning models. arXiv 2017, arXiv:1708.08296. [Google Scholar]
- Lundberg, S.M.; Nair, B.; Vavilala, M.S.; Horibe, M.; Eisses, M.J.; Adams, T.; Liston, D.E.; Low, D.K.; Newman, S.F.; Kim, J.; et al. Explainable machine-learning predictions for the prevention of hypoxaemia during surgery. Nat. Biomed. Eng. 2018, 2, 749–760. [Google Scholar] [CrossRef] [PubMed] [PubMed Central]
- Yu, R.; Liu, W.; Song, Y.; Zhang, J.; Liu, X.-H.; Zhou, L.; Yang, G. Identification of ISUP grade of clear cell renal cell carcinoma by radiomics on multi-phase CT images. Chin. J. Acad. Radiol. 2022, 5, 37–46. [Google Scholar] [CrossRef]
- Wang, R.; Hu, Z.; Shen, X.; Wang, Q.; Zhang, L.; Wang, M.; Feng, Z.; Chen, F. Computed Tomography-Based Radiomics Model for Predicting the WHO/ISUP Grade of Clear Cell Renal Cell Carcinoma Preoperatively: A Multicenter Study. Front. Oncol. 2021, 11, 543854. [Google Scholar] [CrossRef] [PubMed] [PubMed Central]
- Xv, Y.; Lv, F.; Guo, H.; Zhou, X.; Tan, H.; Xiao, M.; Zheng, Y. Machine learning-based CT radiomics approach for predicting WHO/ISUP nuclear grade of clear cell renal cell carcinoma: An exploratory and comparative study. Insights Imaging 2021, 12, 170. [Google Scholar] [CrossRef] [PubMed] [PubMed Central]
- Cui, E.; Li, Z.; Ma, C.; Li, Q.; Lei, Y.; Lan, Y.; Lin, F. Predicting the ISUP Grade of Clear Cell Renal Cell Carcinoma with Multiparametric MR and Multiphase CT Radiomics. Eur. Radiol. 2020, 30, 2912–2921. [Google Scholar] [CrossRef]
- Shu, J.; Wen, D.; Xi, Y.; Xia, Y.; Cai, Z.; Xu, W.; Yin, H. Clear Cell Renal Cell Carcinoma: Machine Learning-Based Computed Tomography Radiomics Analysis for the Prediction of WHO/ISUP Grade. Eur. J. Radiol. 2019, 121, 108738. [Google Scholar] [CrossRef]
- Gao, Y.; Wang, X.; Zhao, X.; Zhu, C.; Li, C.; Li, J.; Wu, X. Multiphase CT Radiomics Nomogram for Preoperatively Predicting the WHO/ISUP Nuclear Grade of Small (<4 cm) Clear Cell Renal Cell Carcinoma. BMC Cancer 2023, 23, 953. [Google Scholar]
- Gao, R.; Qin, H.; Lin, P.; Ma, C.; Li, C.; Wen, R.; Huang, J.; Wan, D.; Wen, D.; Liang, Y.; et al. Development and Validation of a Radiomic Nomogram for Predicting the Prognosis of Kidney Renal Clear Cell Carcinoma. Front Oncol. 2021, 11, 613668. [Google Scholar] [CrossRef] [PubMed] [PubMed Central]
- Aymerich, M.; García-Baizán, A.; Franco, P.N.; Otero-García, M. Exploratory Analysis of the Role of Radiomic Features in the Differentiation of Oncocytoma and Chromophobe RCC in the Nephrographic CT Phase. Life 2023, 13, 1950. [Google Scholar] [CrossRef] [PubMed]
- Zhou, Z.; Qian, X.; Hu, J.; Ma, X.; Zhou, S.; Dai, Y.; Zhu, J. CT-based peritumoral radiomics signatures for malignancy grading of clear cell renal cell carcinoma. Abdom. Radiol. 2021, 46, 2690–2698. [Google Scholar] [CrossRef] [PubMed]
- Zhang, W.; Guo, Y.; Jin, Q. Radiomics and Its Feature Selection: A Review. Symmetry 2023, 15, 1834. [Google Scholar] [CrossRef]
- Raptis, S.; Ilioudis, C.; Theodorou, K. From pixels to prognosis: Unveiling radiomics models with SHAP and LIME for enhanced interpretability. Biomed. Phys. Eng. Express. 2024, 10, 38498925. [Google Scholar] [CrossRef] [PubMed]
- Yasin, P.; Yimit, Y.; Abliz, D.; Mardan, M.; Xu, T.; Yusufu, A.; Cai, X.; Sheng, W.; Mamat, M. MRI-based interpretable radiomics nomogram for discrimination between Brucella spondylitis and Pyogenic spondylitis. Heliyon 2023, 10, e23584. [Google Scholar] [CrossRef] [PubMed] [PubMed Central]
- Nicoletti, G.; Mazzetti, S.; Maimone, G.; Cignini, V.; Cuocolo, R.; Faletti, R.; Gatti, M.; Imbriaco, M.; Longo, N.; Ponsiglione, A.; et al. Development and Validation of an Explainable Radiomics Model to Predict High-Aggressive Prostate Cancer: A Multicenter Radiomics Study Based on Biparametric MRI. Cancers 2024, 16, 203. [Google Scholar] [CrossRef]
- Longo, N.; Di Bello, F.; Napolitano, L.; Di Mauro, E.; Morra, S.; Granata, G.; Polverino, F.; Fraia, A.; Pezone, G.; La Rocca, R.; et al. Outcomes of Salvage Treatment after Primary Treatment for Renal Cell Cancer: A Systematic Review. Diagnostics 2025, 15, 838. [Google Scholar] [CrossRef]
- Choi, J.; Bang, S.; Suh, J.; Choi, C.I.; Song, W.; Yuk, H.D.; Lee, C.H.; Kang, M.; Choo, S.H.; Kim, J.K.; et al. Survival Pattern of Metastatic Renal Cell Carcinoma Patients According to WHO/ISUP Grade: A Long-Term Multi-Institutional Study. Sci. Rep. 2024, 14, 4740. [Google Scholar] [CrossRef]
- Zhao, Y.; Liu, G.; Sun, Q.; Zhai, G.; Wu, G.; Li, Z.C. Validation of CT Radiomics for Prediction of Distant Metastasis after Surgical Resection in Patients with Clear Cell Renal Cell Carcinoma: Exploring the Underlying Signaling Pathways. Eur. Radiol. 2021, 31, 5032–5040. [Google Scholar] [CrossRef] [PubMed]
- Nie, P.; Yang, G.; Wang, Y.; Xu, Y.; Yan, L.; Zhang, M.; Wang, Z. A CT-Based Deep Learning Radiomics Nomogram Outperforms the Existing Prognostic Models for Outcome Prediction in Clear Cell Renal Cell Carcinoma: A Multicenter Study. Eur. Radiol. 2023, 33, 8858–8868. [Google Scholar] [CrossRef] [PubMed]
- Orlhac, F.; Frouin, F.; Nioche, C.; Ayache, N.; Buvat, I. Validation of a Method to Compensate Multicenter Effects Affecting CT Radiomics. Radiology 2019, 291, 53–59. [Google Scholar] [CrossRef]
- Lambin, P.; Leijenaar, R.T.H.; Deist, T.M.; Peerlings, J.; de Jong, E.E.C.; van Timmeren, J.; Sanduleanu, S.; Larue, R.T.H.M.; Even, A.J.G.; Jochems, A.; et al. Radiomics: The bridge between medical imaging and personalized medicine. Nat. Rev. Clin. Oncol. 2017, 14, 749–762. [Google Scholar] [CrossRef] [PubMed]
- Zwanenburg, A.; Leger, S.; Vallières, M.; Löck, S. Image biomarker standardisation initiative. arXiv 2020, arXiv:1612.07003. [Google Scholar]
- European Society of Radiology (ESR). ESR statement on the validation of imaging biomarkers. Insights Imaging 2020, 11, 76. [Google Scholar] [CrossRef]


| High ISUP Grade (n = 67) | Low ISUP Grade (n = 42) | ||
|---|---|---|---|
| Sex | Male (n = 84) | 32 (85.1%) | 52 (64.3%) |
| Female (n = 25) | 10 (14.9%) | 15 (35.7%) | |
| Mean age (years) | 62.07 11.91 | 63.35 11.11 | |
| Laterality | Right (n = 59) | 40 (59.7%) | 19 (45.2%) |
| Left (n = 50) | 27 (20.3%) | 23 (54.8%) |
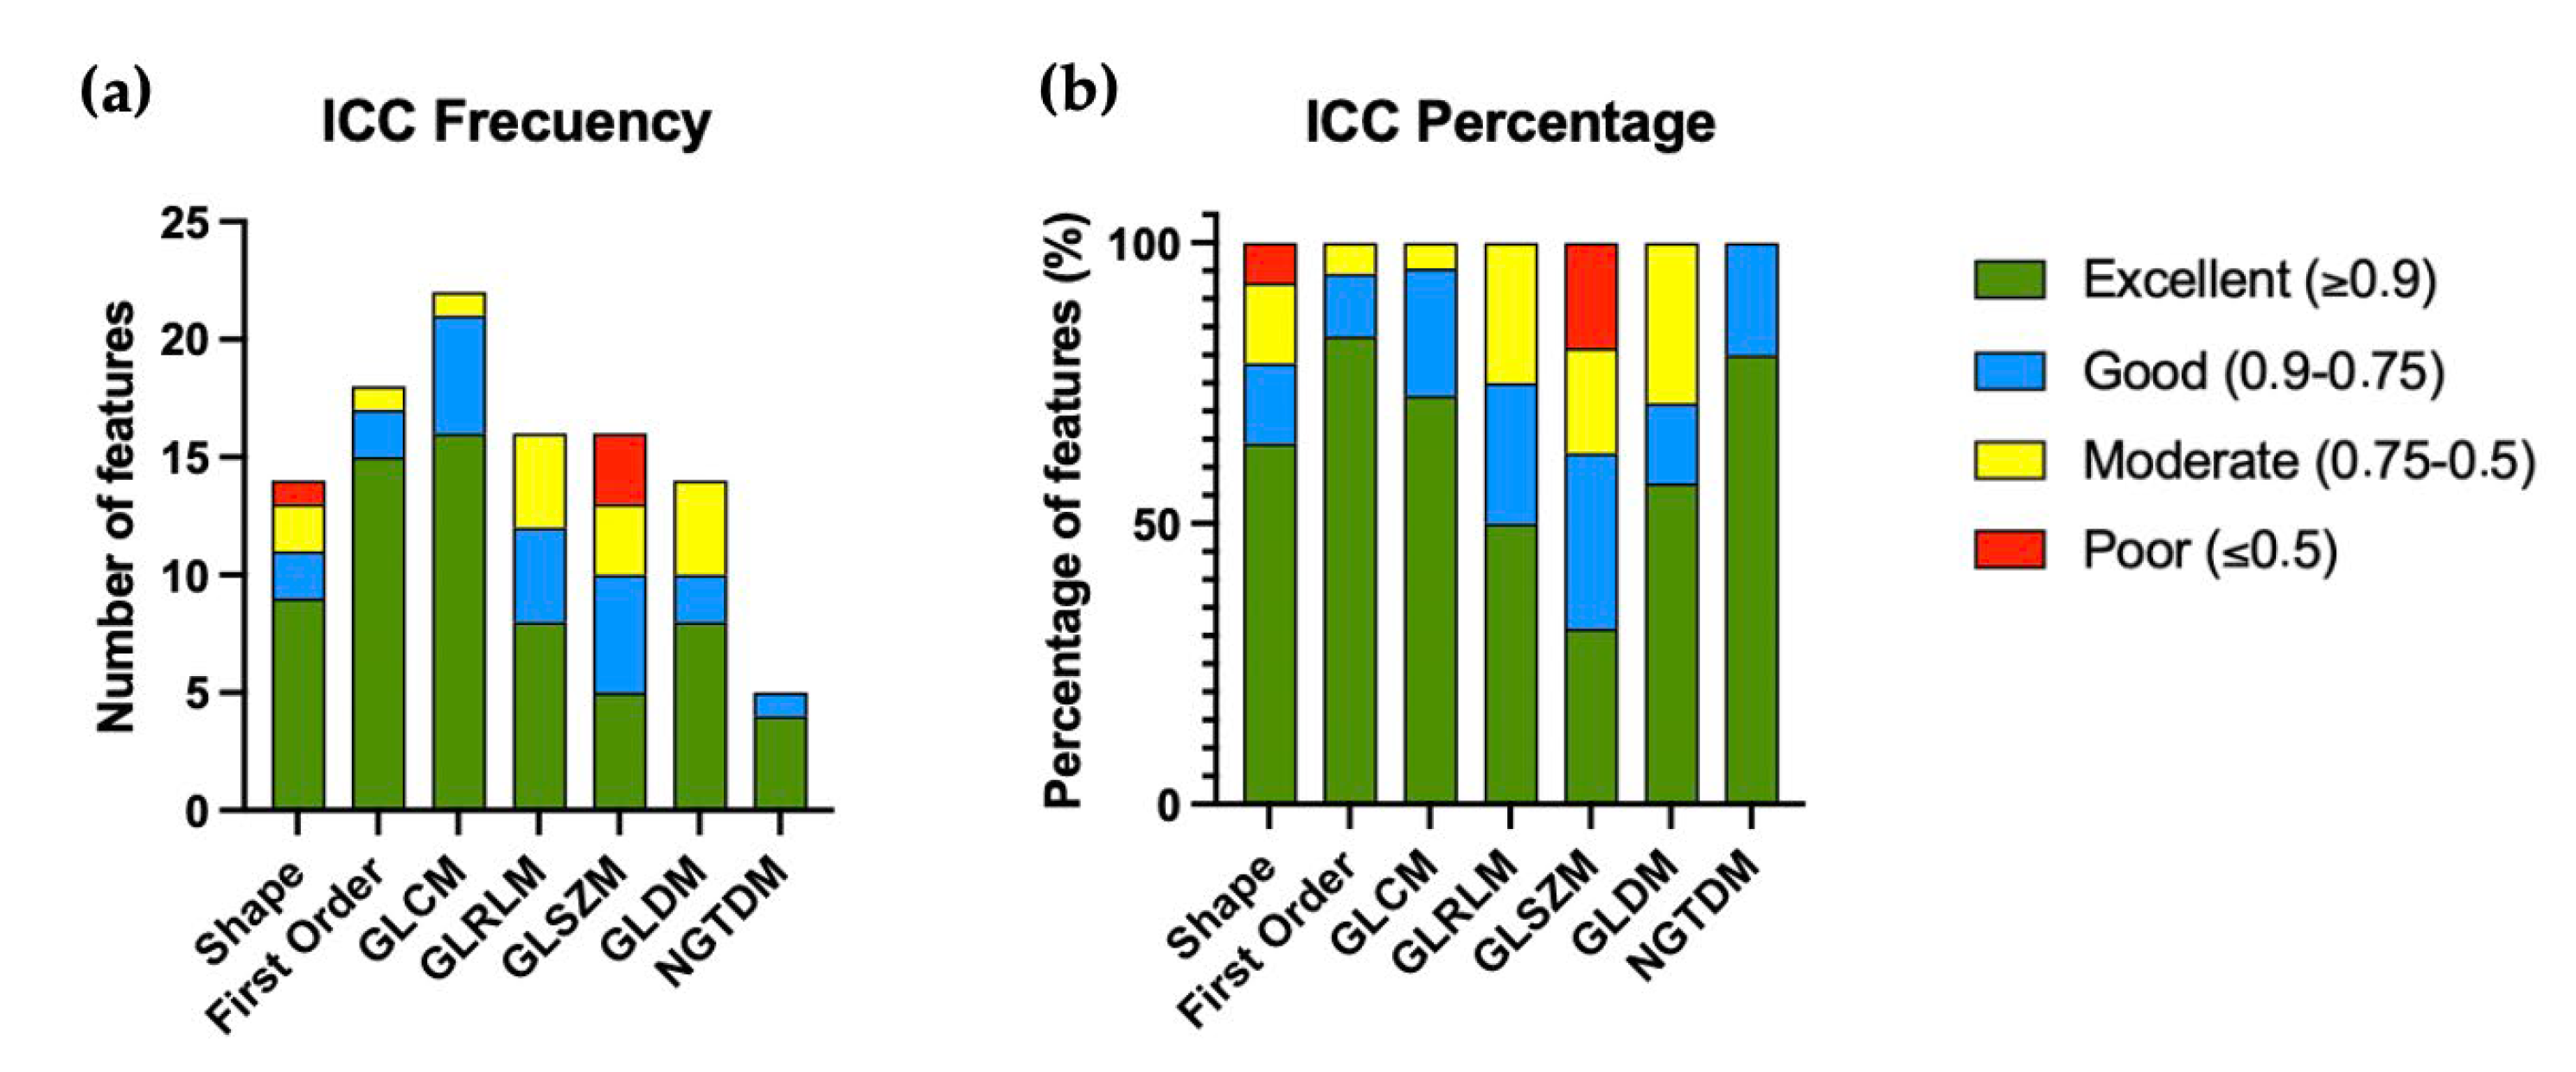
| Excellent (≥0.9) | Good (0.9–0.75) | Moderate (0.75–0.5) | Poor (≤0.5) | |
|---|---|---|---|---|
| Shape (15) | 9 (64.3%) | 2 (14.3%) | 2 (14.3%) | 1 (7.1%) |
| First Order (18) | 15 (83.3%) | 2 (11.1%) | 1 (5.6%) | 0 (0%) |
| GLCM (22) | 16 (72.7%) | 5 (22.7%) | 1 (4.6%) | 0 (0%) |
| GLRLM (16) | 8 (50.0%) | 4 (25.0%) | 4 (25.0%) | 0 (0%) |
| GLSZM (16) | 5 (31.3%) | 5 (31.3) | 3 (18.7%) | 3 (18.7%) |
| GLDM (14) | 8 (57.1%) | 2 (14.3%) | 4 (28.6%) | 0 (0%) |
| NGTDM (5) | 4 (80.0%) | 1 (20.0%) | 0 (0%) | 0 (0%) |
| Features After Applying Correlation (Threshold ≥ 0.9) | |
|---|---|
| Shape | Major axis length (ICC = 0.989) |
| First order | 10 th percentile (ICC = 0.985) Entropy (ICC = 0.911) Maximum (ICC = 0.971) Minimum (ICC = 0.938) Uniformity (ICC = 0.921) |
| GLCM | Prominence (ICC = 0.964) Shade (ICC = 0.916) Contrast (ICC = 0.977) Inverse difference moment (ICC = 0.976) Inverse variance (ICC = 0.967) |
| GLRLM | Run length emphasis (ICC = 0.986) Gray-level non-uniformity (ICC = 0.990) |
| GLZSM | Large area emphasis (ICC = 0.983) Percentage (ICC = 0.963) |
| GLDM | Low dependence high gray level emphasis (ICC = 0.915) |
| NGTDM | Busyness (ICC = 0.984) Complexity (ICC = 0.961) Contrast (ICC = 0.945) Strength (ICC = 0.919) |
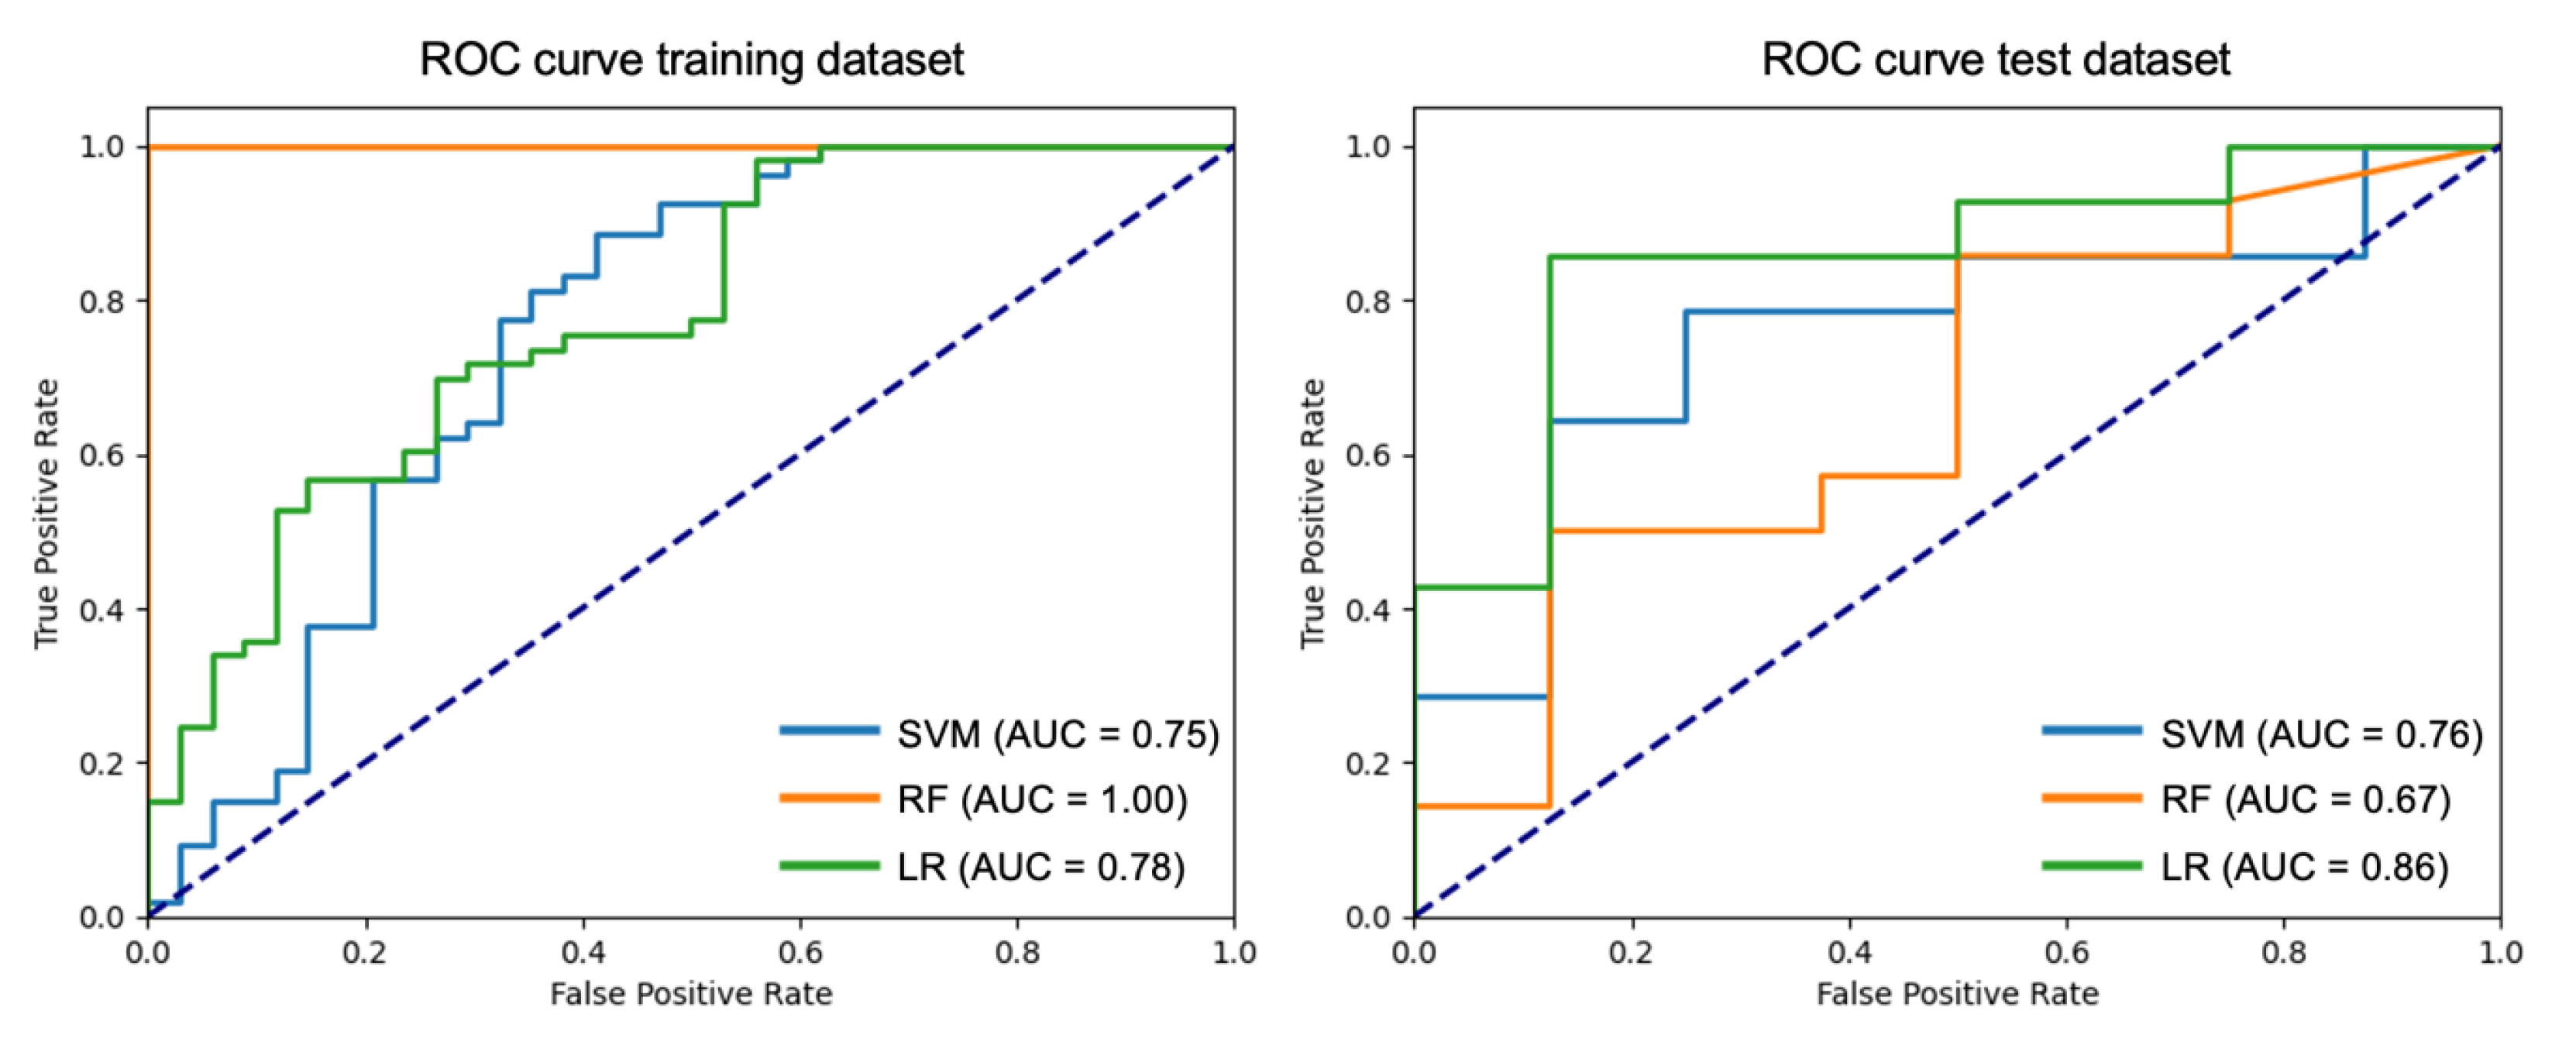
| Classification Metrics for the Test Subset | |||||
|---|---|---|---|---|---|
| Model | Accuracy | F1-Score | Precision | Recall | AUC (Confidence Interval) |
| Support Vector Machine (SVM) | 0.73 | 0.69 | 0.71 | 0.71 | 0.76 (0.56–0.92) |
| Random Forest (RF) | 0.64 | 0.61 | 0.61 | 0.61 | 0.67 (0.48–0.87) |
| Logistic Regression (LR) | 0.82 | 0.80 | 0.80 | 0.80 | 0.86 (0.71–1.00) |
Disclaimer/Publisher’s Note: The statements, opinions and data contained in all publications are solely those of the individual author(s) and contributor(s) and not of MDPI and/or the editor(s). MDPI and/or the editor(s) disclaim responsibility for any injury to people or property resulting from any ideas, methods, instructions or products referred to in the content. |
© 2025 by the authors. Licensee MDPI, Basel, Switzerland. This article is an open access article distributed under the terms and conditions of the Creative Commons Attribution (CC BY) license (https://creativecommons.org/licenses/by/4.0/).
Share and Cite
Aymerich, M.; García-Baizán, A.; Franco, P.N.; González, M.; San Miguel Fraile, P.; Ortiz-Rey, J.A.; Otero-García, M. Radiomics-Based Classification of Clear Cell Renal Cell Carcinoma ISUP Grade: A Machine Learning Approach with SHAP-Enhanced Explainability. Diagnostics 2025, 15, 1337. https://doi.org/10.3390/diagnostics15111337
Aymerich M, García-Baizán A, Franco PN, González M, San Miguel Fraile P, Ortiz-Rey JA, Otero-García M. Radiomics-Based Classification of Clear Cell Renal Cell Carcinoma ISUP Grade: A Machine Learning Approach with SHAP-Enhanced Explainability. Diagnostics. 2025; 15(11):1337. https://doi.org/10.3390/diagnostics15111337
Chicago/Turabian StyleAymerich, María, Alejandra García-Baizán, Paolo Niccolò Franco, Mariña González, Pilar San Miguel Fraile, José Antonio Ortiz-Rey, and Milagros Otero-García. 2025. "Radiomics-Based Classification of Clear Cell Renal Cell Carcinoma ISUP Grade: A Machine Learning Approach with SHAP-Enhanced Explainability" Diagnostics 15, no. 11: 1337. https://doi.org/10.3390/diagnostics15111337
APA StyleAymerich, M., García-Baizán, A., Franco, P. N., González, M., San Miguel Fraile, P., Ortiz-Rey, J. A., & Otero-García, M. (2025). Radiomics-Based Classification of Clear Cell Renal Cell Carcinoma ISUP Grade: A Machine Learning Approach with SHAP-Enhanced Explainability. Diagnostics, 15(11), 1337. https://doi.org/10.3390/diagnostics15111337