
Radiomics-Based Machine Learning Model for Diagnosis of Acute Pancreatitis Using Computed Tomography

 , , , ,
Abstract
1. Introduction
2. Materials and Methods
2.1. Study Population
2.2. Scanning Protocol
2.3. Automatic Segmentation, Feature Extraction and Selection and Statistical Analysis
3. Results
3.1. Patient Cohort
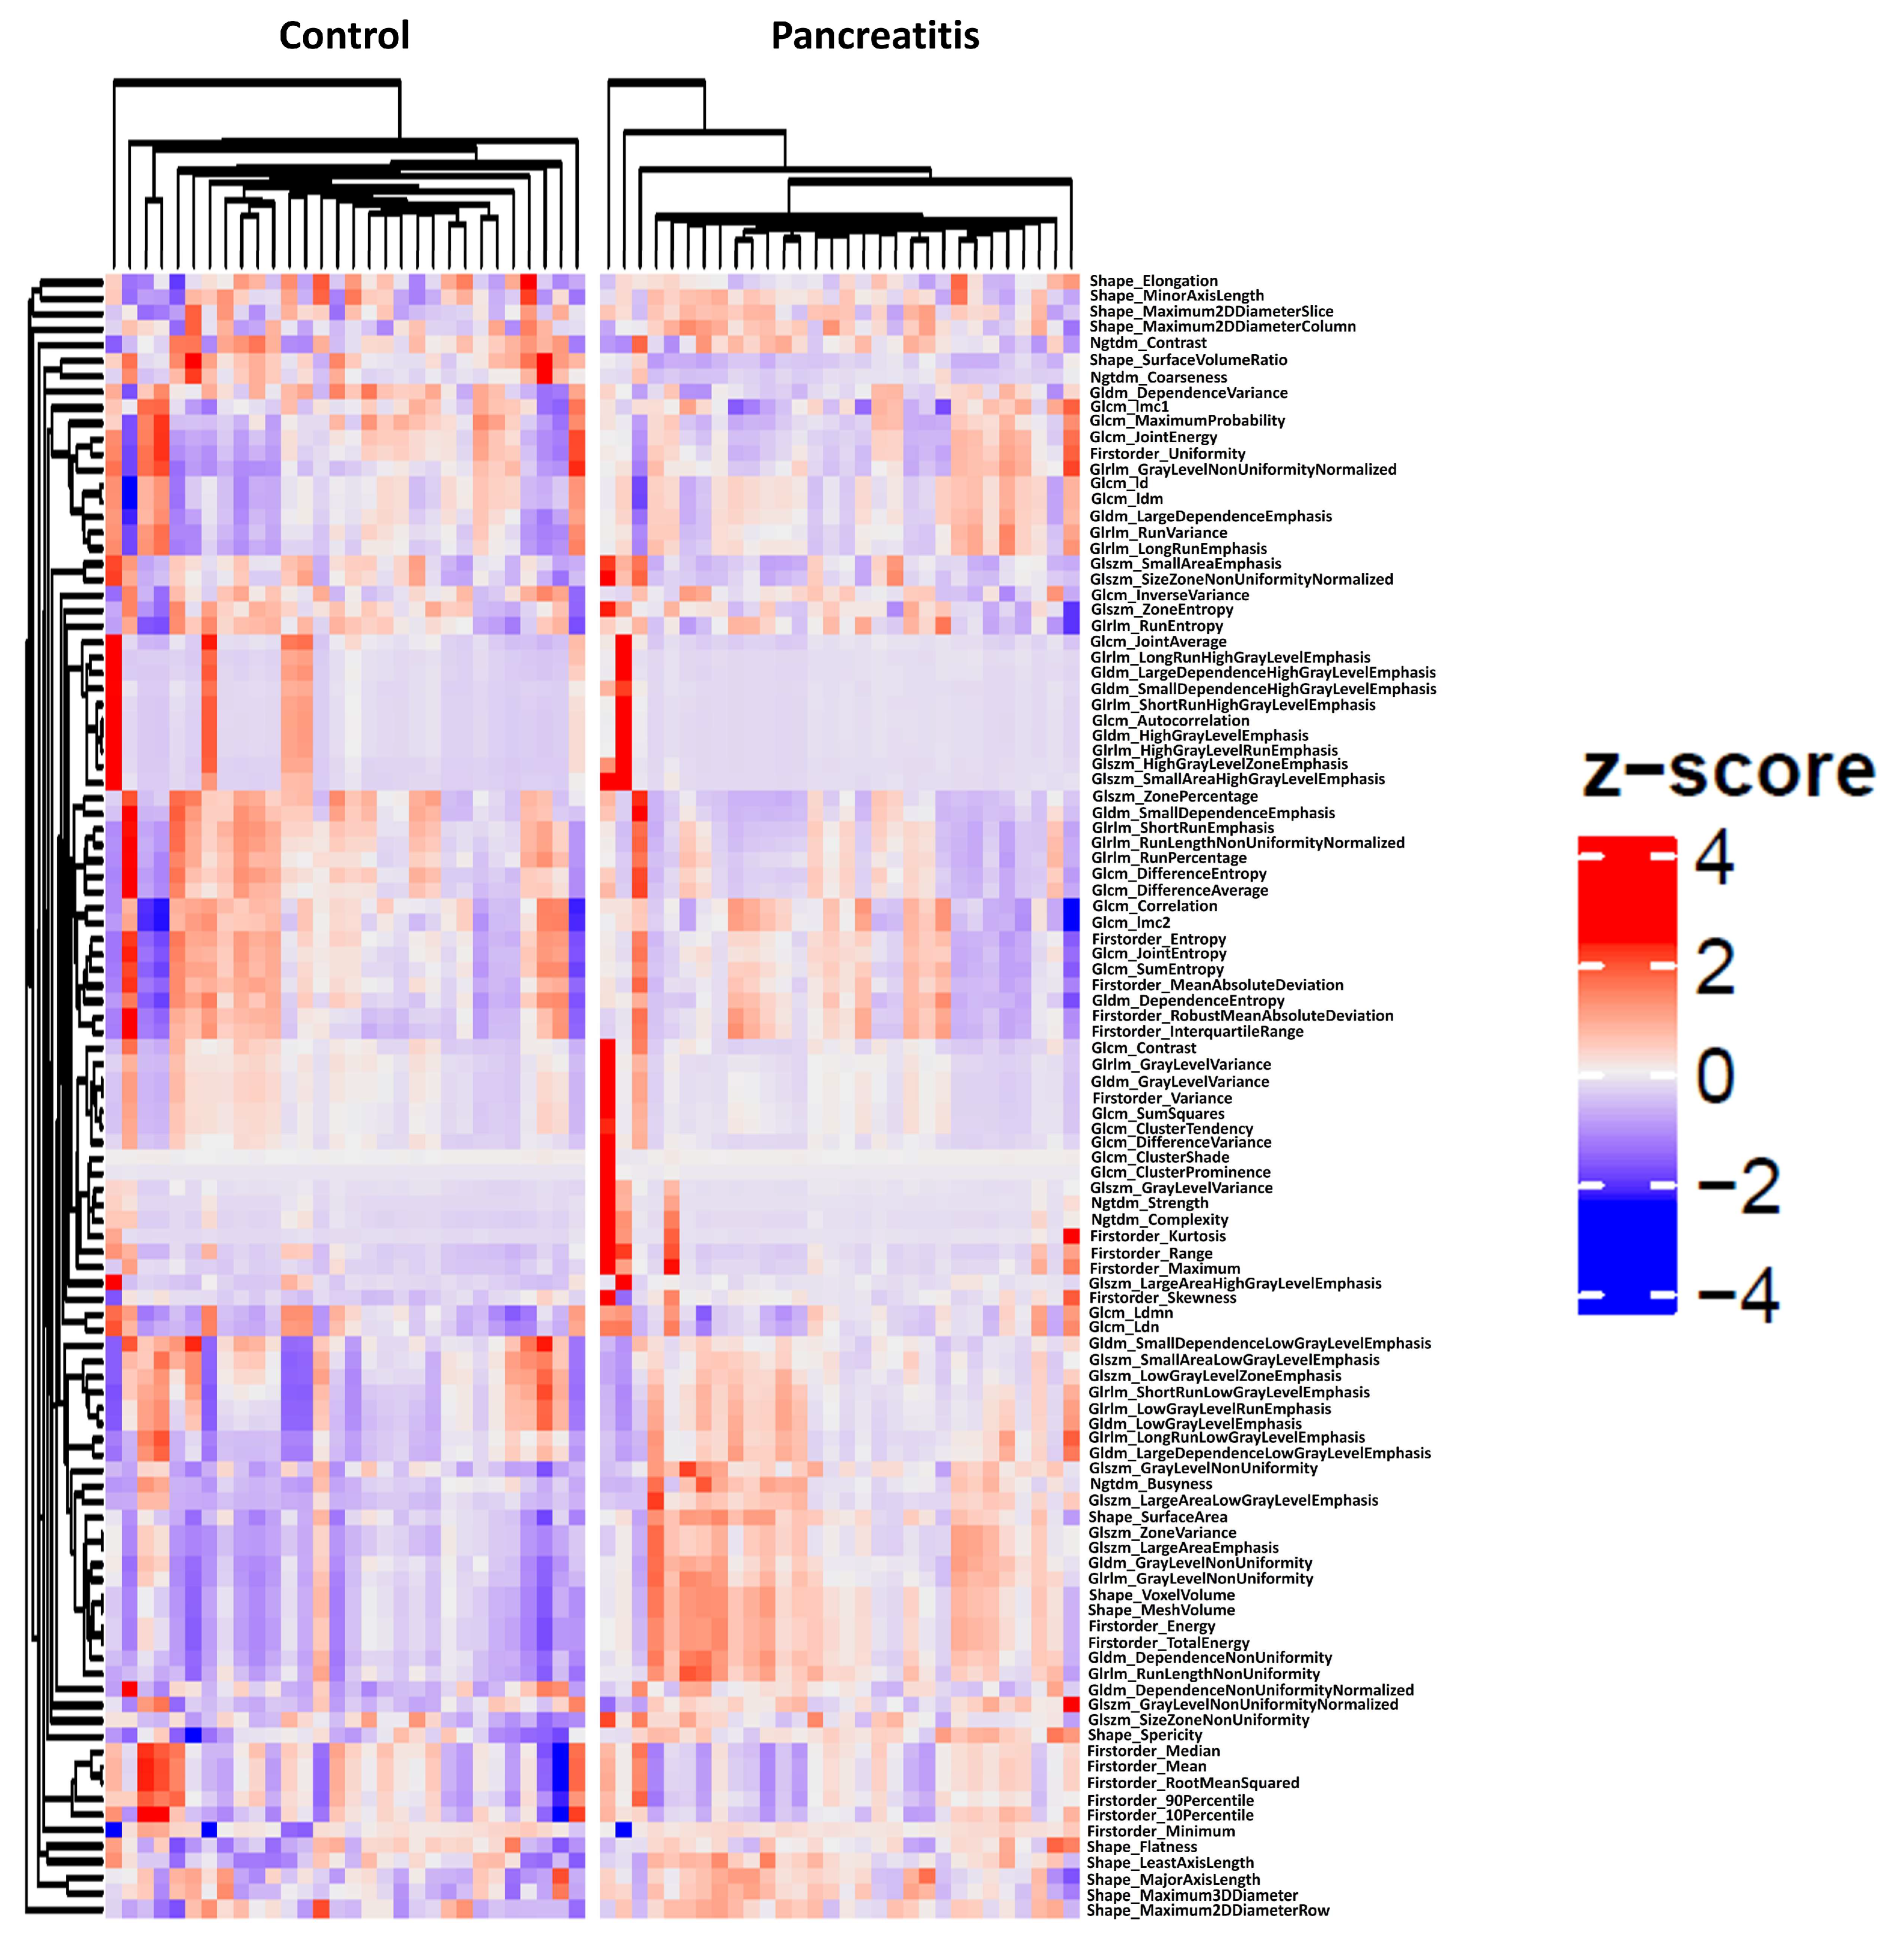
3.2. Cluster Analysis
3.3. Radiomics Feature Selection
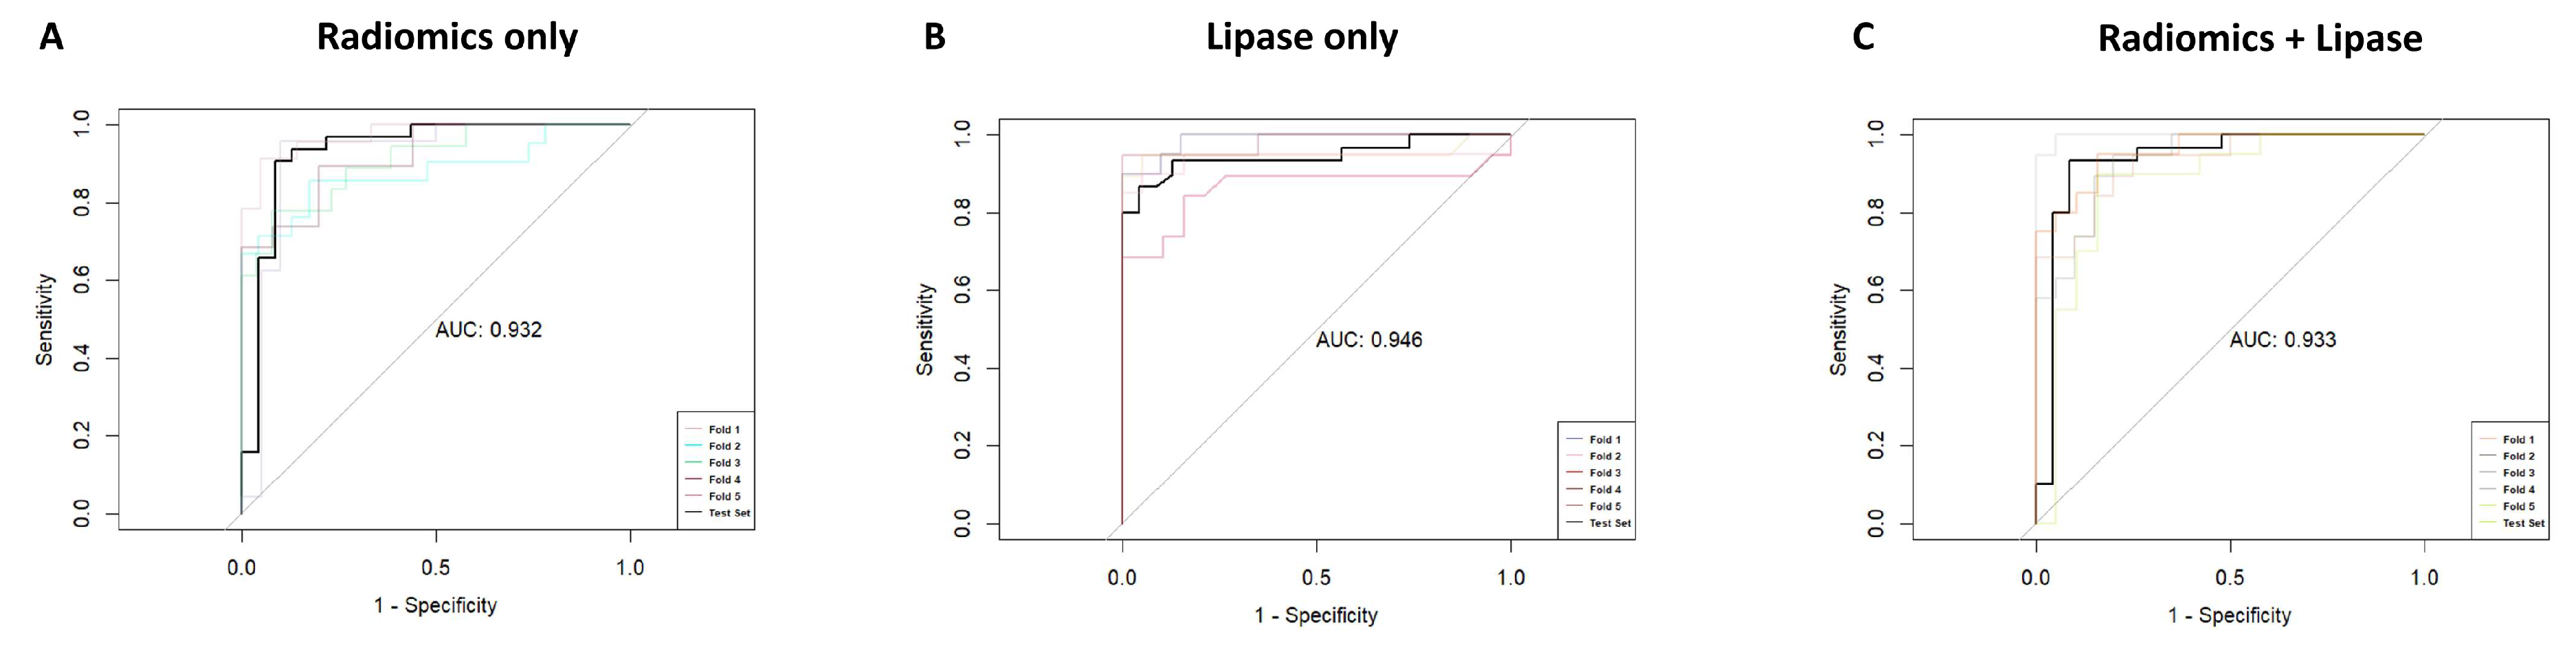
3.4. Logistic Regression Model
4. Discussion
5. Conclusions
Supplementary Materials
Author Contributions
Funding
Institutional Review Board Statement
Informed Consent Statement
Data Availability Statement
Conflicts of Interest
References
- Lee, P.J.; Papachristou, G.I. New Insights into Acute Pancreatitis. Nat. Rev. Gastroenterol. Hepatol. 2019, 16, 479–496. [Google Scholar] [CrossRef] [PubMed]
- Boxhoorn, L.; Voermans, R.P.; Bouwense, S.A.; Bruno, M.J.; Verdonk, R.C.; Boermeester, M.A.; van Santvoort, H.C.; Besselink, M.G. Acute Pancreatitis. Lancet 2020, 396, 726–734. [Google Scholar] [CrossRef] [PubMed]
- Banks, P.A.; Bollen, T.L.; Dervenis, C.; Gooszen, H.G.; Johnson, C.D.; Sarr, M.G.; Tsiotos, G.G.; Vege, S.S. Acute Pancreatitis Classification Working Group Classification of Acute Pancreatitis—2012: Revision of the Atlanta Classification and Definitions by International Consensus. Gut 2013, 62, 102–111. [Google Scholar] [CrossRef] [PubMed]
- Jang, S.; Kim, J.H.; Choi, S.-Y.; Park, S.J.; Han, J.K. Application of Computerized 3D-CT Texture Analysis of Pancreas for the Assessment of Patients with Diabetes. PLoS ONE 2020, 15, e0227492. [Google Scholar] [CrossRef] [PubMed]
- Chae, H.-D.; Park, C.M.; Park, S.J.; Lee, S.M.; Kim, K.G.; Goo, J.M. Computerized Texture Analysis of Persistent Part-Solid Ground-Glass Nodules: Differentiation of Preinvasive Lesions from Invasive Pulmonary Adenocarcinomas. Radiology 2014, 273, 285–293. [Google Scholar] [CrossRef] [PubMed]
- Sandrasegaran, K.; Lin, Y.; Asare-Sawiri, M.; Taiyini, T.; Tann, M. CT Texture Analysis of Pancreatic Cancer. Eur. Radiol. 2019, 29, 1067–1073. [Google Scholar] [CrossRef] [PubMed]
- Kulkarni, A.; Carrion-Martinez, I.; Dhindsa, K.; Alaref, A.A.; Rozenberg, R.; van der Pol, C.B. Pancreas Adenocarcinoma CT Texture Analysis: Comparison of 3D and 2D Tumor Segmentation Techniques. Abdom. Radiol. 2021, 46, 1027–1033. [Google Scholar] [CrossRef] [PubMed]
- Awe, A.M.; Rendell, V.R.; Lubner, M.G.; Winslow, E.R. Texture Analysis: An Emerging Clinical Tool for Pancreatic Lesions. Pancreas 2020, 49, 301–312. [Google Scholar] [CrossRef] [PubMed]
- Reinert, C.P.; Baumgartner, K.; Hepp, T.; Bitzer, M.; Horger, M. Complementary Role of Computed Tomography Texture Analysis for Differentiation of Pancreatic Ductal Adenocarcinoma from Pancreatic Neuroendocrine Tumors in the Portal-Venous Enhancement Phase. Abdom. Radiol. 2020, 45, 750–758. [Google Scholar] [CrossRef]
- Abunahel, B.M.; Pontre, B.; Kumar, H.; Petrov, M.S. Pancreas Image Mining: A Systematic Review of Radiomics. Eur. Radiol. 2021, 31, 3447–3467. [Google Scholar] [CrossRef]
- Zhong, J.; Hu, Y.; Xing, Y.; Ge, X.; Ding, D.; Zhang, H.; Yao, W. A Systematic Review of Radiomics in Pancreatitis: Applying the Evidence Level Rating Tool for Promoting Clinical Transferability. Insights Imaging 2022, 13, 139. [Google Scholar] [CrossRef] [PubMed]
- E, L.; Xu, Y.; Wu, Z.; Li, L.; Zhang, N.; Yang, H.; Schwartz, L.H.; Lu, L.; Zhao, B. Differentiation of Focal-Type Autoimmune Pancreatitis From Pancreatic Ductal Adenocarcinoma Using Radiomics Based on Multiphasic Computed Tomography. J. Comput. Assist. Tomogr. 2020, 44, 511–518. [Google Scholar] [CrossRef] [PubMed]
- Ren, S.; Zhao, R.; Zhang, J.; Guo, K.; Gu, X.; Duan, S.; Wang, Z.; Chen, R. Diagnostic Accuracy of Unenhanced CT Texture Analysis to Differentiate Mass-Forming Pancreatitis from Pancreatic Ductal Adenocarcinoma. Abdom. Radiol. 2020, 45, 1524–1533. [Google Scholar] [CrossRef] [PubMed]
- Ren, S.; Zhang, J.; Chen, J.; Cui, W.; Zhao, R.; Qiu, W.; Duan, S.; Chen, R.; Chen, X.; Wang, Z. Evaluation of Texture Analysis for the Differential Diagnosis of Mass-Forming Pancreatitis From Pancreatic Ductal Adenocarcinoma on Contrast-Enhanced CT Images. Front. Oncol. 2019, 9, 1171. [Google Scholar] [CrossRef] [PubMed]
- Park, S.; Chu, L.C.; Hruban, R.H.; Vogelstein, B.; Kinzler, K.W.; Yuille, A.L.; Fouladi, D.F.; Shayesteh, S.; Ghandili, S.; Wolfgang, C.L.; et al. Differentiating Autoimmune Pancreatitis from Pancreatic Ductal Adenocarcinoma with CT Radiomics Features. Diagn. Interv. Imaging 2020, 101, 555–564. [Google Scholar] [CrossRef] [PubMed]
- Ma, X.; Wang, Y.-R.; Zhuo, L.-Y.; Yin, X.-P.; Ren, J.-L.; Li, C.-Y.; Xing, L.-H.; Zheng, T.-T. Retrospective Analysis of the Value of Enhanced CT Radiomics Analysis in the Differential Diagnosis Between Pancreatic Cancer and Chronic Pancreatitis. Int. J. Gen. Med. 2022, 15, 233–241. [Google Scholar] [CrossRef] [PubMed]
- Liu, Z.; Li, M.; Zuo, C.; Yang, Z.; Yang, X.; Ren, S.; Peng, Y.; Sun, G.; Shen, J.; Cheng, C.; et al. Radiomics Model of Dual-Time 2-[18F]FDG PET/CT Imaging to Distinguish between Pancreatic Ductal Adenocarcinoma and Autoimmune Pancreatitis. Eur. Radiol. 2021, 31, 6983–6991. [Google Scholar] [CrossRef]
- Li, J.; Liu, F.; Fang, X.; Cao, K.; Meng, Y.; Zhang, H.; Yu, J.; Feng, X.; Li, Q.; Liu, Y.; et al. CT Radiomics Features in Differentiation of Focal-Type Autoimmune Pancreatitis from Pancreatic Ductal Adenocarcinoma: A Propensity Score Analysis. Acad. Radiol. 2022, 29, 358–366. [Google Scholar] [CrossRef]
- Chen, Y.; Chen, T.; Wu, C.; Lin, Q.; Hu, R.; Xie, C.; Zuo, H.; Wu, J.; Mu, Q.; Fu, Q.; et al. Radiomics Model of Contrast-Enhanced Computed Tomography for Predicting the Recurrence of Acute Pancreatitis. Eur. Radiol. 2019, 29, 4408–4417. [Google Scholar] [CrossRef]
- Iranmahboob, A.K.; Kierans, A.S.; Huang, C.; Ream, J.M.; Rosenkrantz, A.B. Preliminary Investigation of Whole-Pancreas 3D Histogram ADC Metrics for Predicting Progression of Acute Pancreatitis. Clin. Imaging 2017, 42, 172–177. [Google Scholar] [CrossRef]
- Lin, Q.; JI, Y.; Chen, Y.; Sun, H.; Yang, D.; Chen, A.; Chen, T.; Zhang, X.M. Radiomics Model of Contrast-enhanced MRI for Early Prediction of Acute Pancreatitis Severity. J. Magn. Reson. Imaging 2020, 51, 397–406. [Google Scholar] [CrossRef]
- Zhou, T.; Xie, C.; Chen, Y.; Deng, Y.; Wu, J.; Liang, R.; Yang, G.; Zhang, X. Magnetic Resonance Imaging–Based Radiomics Models to Predict Early Extrapancreatic Necrosis in Acute Pancreatitis. Pancreas 2021, 50, 1368–1375. [Google Scholar] [CrossRef]
- Mashayekhi, R.; Parekh, V.S.; Faghih, M.; Singh, V.K.; Jacobs, M.A.; Zaheer, A. Radiomic Features of the Pancreas on CT Imaging Accurately Differentiate Functional Abdominal Pain, Recurrent Acute Pancreatitis, and Chronic Pancreatitis. Eur. J. Radiol. 2020, 123, 108778. [Google Scholar] [CrossRef] [PubMed]
- Wasserthal, J.; Breit, H.-C.; Meyer, M.T.; Pradella, M.; Hinck, D.; Sauter, A.W.; Heye, T.; Boll, D.T.; Cyriac, J.; Yang, S.; et al. TotalSegmentator: Robust Segmentation of 104 Anatomic Structures in CT Images. Radiol. Artif. Intell. 2023, 5, e230024. [Google Scholar] [CrossRef]
- Fedorov, A.; Beichel, R.; Kalpathy-Cramer, J.; Finet, J.; Fillion-Robin, J.-C.; Pujol, S.; Bauer, C.; Jennings, D.; Fennessy, F.; Sonka, M.; et al. 3D Slicer as an Image Computing Platform for the Quantitative Imaging Network. Magn. Reson. Imaging 2012, 30, 1323–1341. [Google Scholar] [CrossRef]
- van Griethuysen, J.J.M.; Fedorov, A.; Parmar, C.; Hosny, A.; Aucoin, N.; Narayan, V.; Beets-Tan, R.G.H.; Fillion-Robin, J.-C.; Pieper, S.; Aerts, H.J.W.L. Computational Radiomics System to Decode the Radiographic Phenotype. Cancer Res. 2017, 77, e104–e107. [Google Scholar] [CrossRef]
- R Core Team R Development Core Team. R: A Language and Environment for Statistical Computing; R Foundation for Statistical Computing: Vienna, Austria, 2014. [Google Scholar]
- R Core Team R Development Core Team. RStudio Team RStudio: Integrated Development Environment for R. RStudio; PBC: Boston, MA, USA, 2020. [Google Scholar]
- Ayx, I.; Tharmaseelan, H.; Hertel, A.; Nörenberg, D.; Overhoff, D.; Rotkopf, L.T.; Riffel, P.; Schoenberg, S.O.; Froelich, M.F. Myocardial Radiomics Texture Features Associated with Increased Coronary Calcium Score-First Results of a Photon-Counting CT. Diagnostics 2022, 12, 1663. [Google Scholar] [CrossRef] [PubMed]
- Beyer, G.; Hoffmeister, A.; Michl, P.; Gress, T.M.; Huber, W.; Algül, H.; Neesse, A.; Meining, A.; Seufferlein, T.W.; Rosendahl, J.; et al. S3-Leitlinie Pankreatitis—Leitlinie Der Deutschen Gesellschaft Für Gastroenterologie, Verdauungs- Und Stoffwechselkrankheiten (DGVS)—September 2021—AWMF Registernummer 021-003. Z Gastroenterol. 2022, 60, 419–521. [Google Scholar] [CrossRef] [PubMed]
- Tharmaseelan, H.; Froelich, M.F.; Nörenberg, D.; Overhoff, D.; Rotkopf, L.T.; Riffel, P.; Schoenberg, S.O.; Ayx, I. Influence of Local Aortic Calcification on Periaortic Adipose Tissue Radiomics Texture Features—A Primary Analysis on PCCT. Int. J. Cardiovasc. Imaging 2022, 38, 2459–2467. [Google Scholar] [CrossRef]
- Parekh, V.; Jacobs, M.A. Radiomics: A New Application from Established Techniques. Expert Rev. Precis. Med. Drug Dev. 2016, 1, 207–226. [Google Scholar] [CrossRef]
- Deng, Y.; Ming, B.; Zhou, T.; Wu, J.; Chen, Y.; Liu, P.; Zhang, J.; Zhang, S.; Chen, T.; Zhang, X.-M. Radiomics Model Based on MR Images to Discriminate Pancreatic Ductal Adenocarcinoma and Mass-Forming Chronic Pancreatitis Lesions. Front. Oncol. 2021, 11, 620981. [Google Scholar] [CrossRef] [PubMed]
- Hu, Y.; Liu, N.; Tang, L.; Liu, Q.; Pan, K.; Lei, L.; Huang, X. Three-Dimensional Radiomics Features of Magnetic Resonance T2-Weighted Imaging Combined With Clinical Characteristics to Predict the Recurrence of Acute Pancreatitis. Front. Med. 2022, 9, 777368. [Google Scholar] [CrossRef] [PubMed]
- Tang, L.; Ma, L.; Chen, Y.; Hu, Y.; Chen, X.; Huang, X.; Liu, N. Radiomics Analysis of Contrast-Enhanced T1W MRI: Predicting the Recurrence of Acute Pancreatitis. Sci. Rep. 2023, 13, 2762. [Google Scholar] [CrossRef] [PubMed]
- Zhao, Y.; Wei, J.; Xiao, B.; Wang, L.; Jiang, X.; Zhu, Y.; He, W. Early Prediction of Acute Pancreatitis Severity Based on Changes in Pancreatic and Peripancreatic Computed Tomography Radiomics Nomogram. Quant. Imaging Med. Surg. 2023, 13, 1927–1936. [Google Scholar] [CrossRef]
- Liu, N.; Wan, Y.; Tong, Y.; He, J.; Xu, S.; Hu, X.; Luo, C.; Xu, L.; Guo, F.; Shen, B.; et al. A Clinic-Radiomics Model for Predicting the Incidence of Persistent Organ Failure in Patients with Acute Necrotizing Pancreatitis. Gastroenterol. Res. Pract. 2023, 2023, 2831024. [Google Scholar] [CrossRef]


| AP (n = 137) | Control (n = 138) | |
|---|---|---|
| Sex, female (%) | 43/137 (31.4%) | 46/138 (33.3%) |
| Age, mean (± sd) | 59.4 (±16.7) | 61.1 (±17.9) |
| AP | ||
| 111/137 (81.0%) | n.a. |
| 26/137 (19.0%) | n.a. |
| Etiology of AP | ||
| 47/137 (34.3%) | n.a. |
| 37/137 (27.0%) | n.a. |
| 16/137 (11.7%) | n.a. |
| 22/137 (16.1%) | n.a. |
| Clinical symptoms control group | ||
| n.a. | 32/138 (23.2%) |
| n.a. | 35/138 (23.4%) |
| n.a. | 27/138 (19.6%) |
| n.a. | 11/138 (8.0%) |
| n.a. | 33/138 (23.9%) |
| Oral contrast agent | 51/137 (37.2%) | 54/138 (39.1%) |
| Common bile duct stenting | 25/137 (18.2%) | n.a. |
| Lipase (U/L), median (IQR) | 385 (124–600) | 24.5 (15–32) |
| Feature | Pancreatitis | Control | p-Value |
|---|---|---|---|
| shape_LeastAxisLength | 0.51 | −0.51 | <0.001 |
| shape_Maximum3DDiameter | 0.35 | −0.24 | 0.084 |
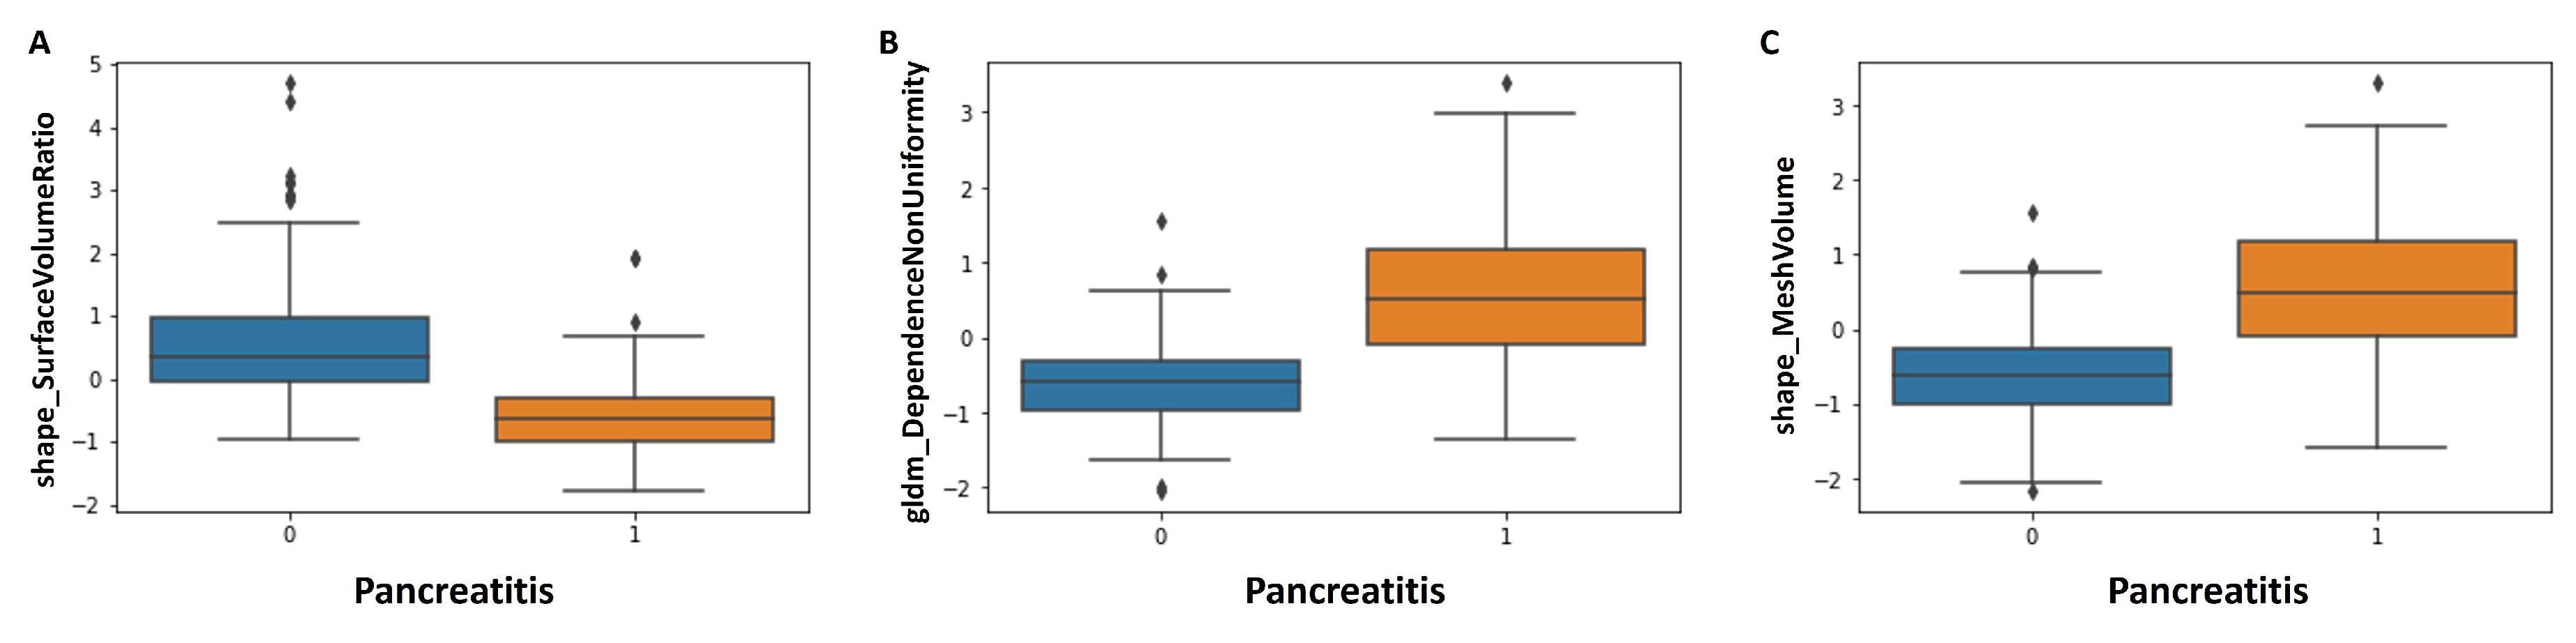
| shape_MeshVolume | 0.47 | −0.63 | <0.001 |
| shape_Sphericity | 0.34 | −0.41 | <0.001 |
| shape_SurfaceArea | 0.50 | −0.50 | <0.001 |
| shape_SurfaceVolumeRatio | −0.63 | 0.34 | <0.001 |
| shape_VoxelVolume | 0.47 | −0.63 | <0.001 |
| firstorder_Energy | 0.48 | −0.56 | <0.001 |
| firstorder_InterquartileRange | −0.01 | −0.10 | 1.000 |
| firstorder_Kurtosis | −0.25 | −0.22 | 0.245 |
| firstorder_Maximum | −0.33 | −0.30 | 1.000 |
| firstorder_Minimum | 0.35 | 0.20 | 0.013 |
| firstorder_Skewness | −0.06 | −0.21 | 0.207 |
| firstorder_TotalEnergy | 0.48 | −0.56 | <0.001 |
| glcm_ClusterShade | 0.03 | 0.02 | 0.179 |
| glrlm_GrayLevelNonUniformity | 0.39 | −0.57 | <0.001 |
| glrlm_RunLengthNonUniformity | 0.43 | −0.54 | <0.001 |
| glszm_GrayLevelNonUniformity | 0.36 | −0.51 | <0.001 |
| glszm_LargeAreaEmphasis | 0.33 | −0.63 | <0.001 |
| glszm_LargeAreaLowGrayLevelEmphasis | 0.14 | −0.58 | <0.001 |
| glszm_ZonePercentage | −0.58 | 0.22 | <0.001 |
| glszm_ZoneVariance | 0.33 | −0.63 | <0.001 |
| gldm_DependenceNonUniformity | 0.52 | −0.60 | <0.001 |
| gldm_DependenceNonUniformityNormalized | −0.06 | −0.37 | 0.221 |
| gldm_DependenceVariance | −0.15 | 0.31 | 0.008 |
| gldm_GrayLevelNonUniformity | 0.38 | −0.53 | <0.001 |
| gldm_LargeDependenceHighGrayLevelEmphasis | −0.34 | −0.26 | 0.113 |
| ngtdm_Coarseness | −0.46 | 0.05 | <0.001 |
Disclaimer/Publisher’s Note: The statements, opinions and data contained in all publications are solely those of the individual author(s) and contributor(s) and not of MDPI and/or the editor(s). MDPI and/or the editor(s) disclaim responsibility for any injury to people or property resulting from any ideas, methods, instructions or products referred to in the content. |
© 2024 by the authors. Licensee MDPI, Basel, Switzerland. This article is an open access article distributed under the terms and conditions of the Creative Commons Attribution (CC BY) license (https://creativecommons.org/licenses/by/4.0/).
Share and Cite
Bette, S.; Canalini, L.; Feitelson, L.-M.; Woźnicki, P.; Risch, F.; Huber, A.; Decker, J.A.; Tehlan, K.; Becker, J.; Wollny, C.; et al. Radiomics-Based Machine Learning Model for Diagnosis of Acute Pancreatitis Using Computed Tomography. Diagnostics 2024, 14, 718. https://doi.org/10.3390/diagnostics14070718
Bette S, Canalini L, Feitelson L-M, Woźnicki P, Risch F, Huber A, Decker JA, Tehlan K, Becker J, Wollny C, et al. Radiomics-Based Machine Learning Model for Diagnosis of Acute Pancreatitis Using Computed Tomography. Diagnostics. 2024; 14(7):718. https://doi.org/10.3390/diagnostics14070718
Chicago/Turabian StyleBette, Stefanie, Luca Canalini, Laura-Marie Feitelson, Piotr Woźnicki, Franka Risch, Adrian Huber, Josua A. Decker, Kartikay Tehlan, Judith Becker, Claudia Wollny, and et al. 2024. "Radiomics-Based Machine Learning Model for Diagnosis of Acute Pancreatitis Using Computed Tomography" Diagnostics 14, no. 7: 718. https://doi.org/10.3390/diagnostics14070718
APA StyleBette, S., Canalini, L., Feitelson, L.-M., Woźnicki, P., Risch, F., Huber, A., Decker, J. A., Tehlan, K., Becker, J., Wollny, C., Scheurig-Münkler, C., Wendler, T., Schwarz, F., & Kroencke, T. (2024). Radiomics-Based Machine Learning Model for Diagnosis of Acute Pancreatitis Using Computed Tomography. Diagnostics, 14(7), 718. https://doi.org/10.3390/diagnostics14070718