
Optimizing Arterial Vessel Contrast in Portal Venous Phase with Virtual Monoenergetic Images from Photon-Counting Detector CT Scans of the Abdomen—First Clinical Experiences

 ,
, 
Abstract
1. Introduction
2. Materials and Methods
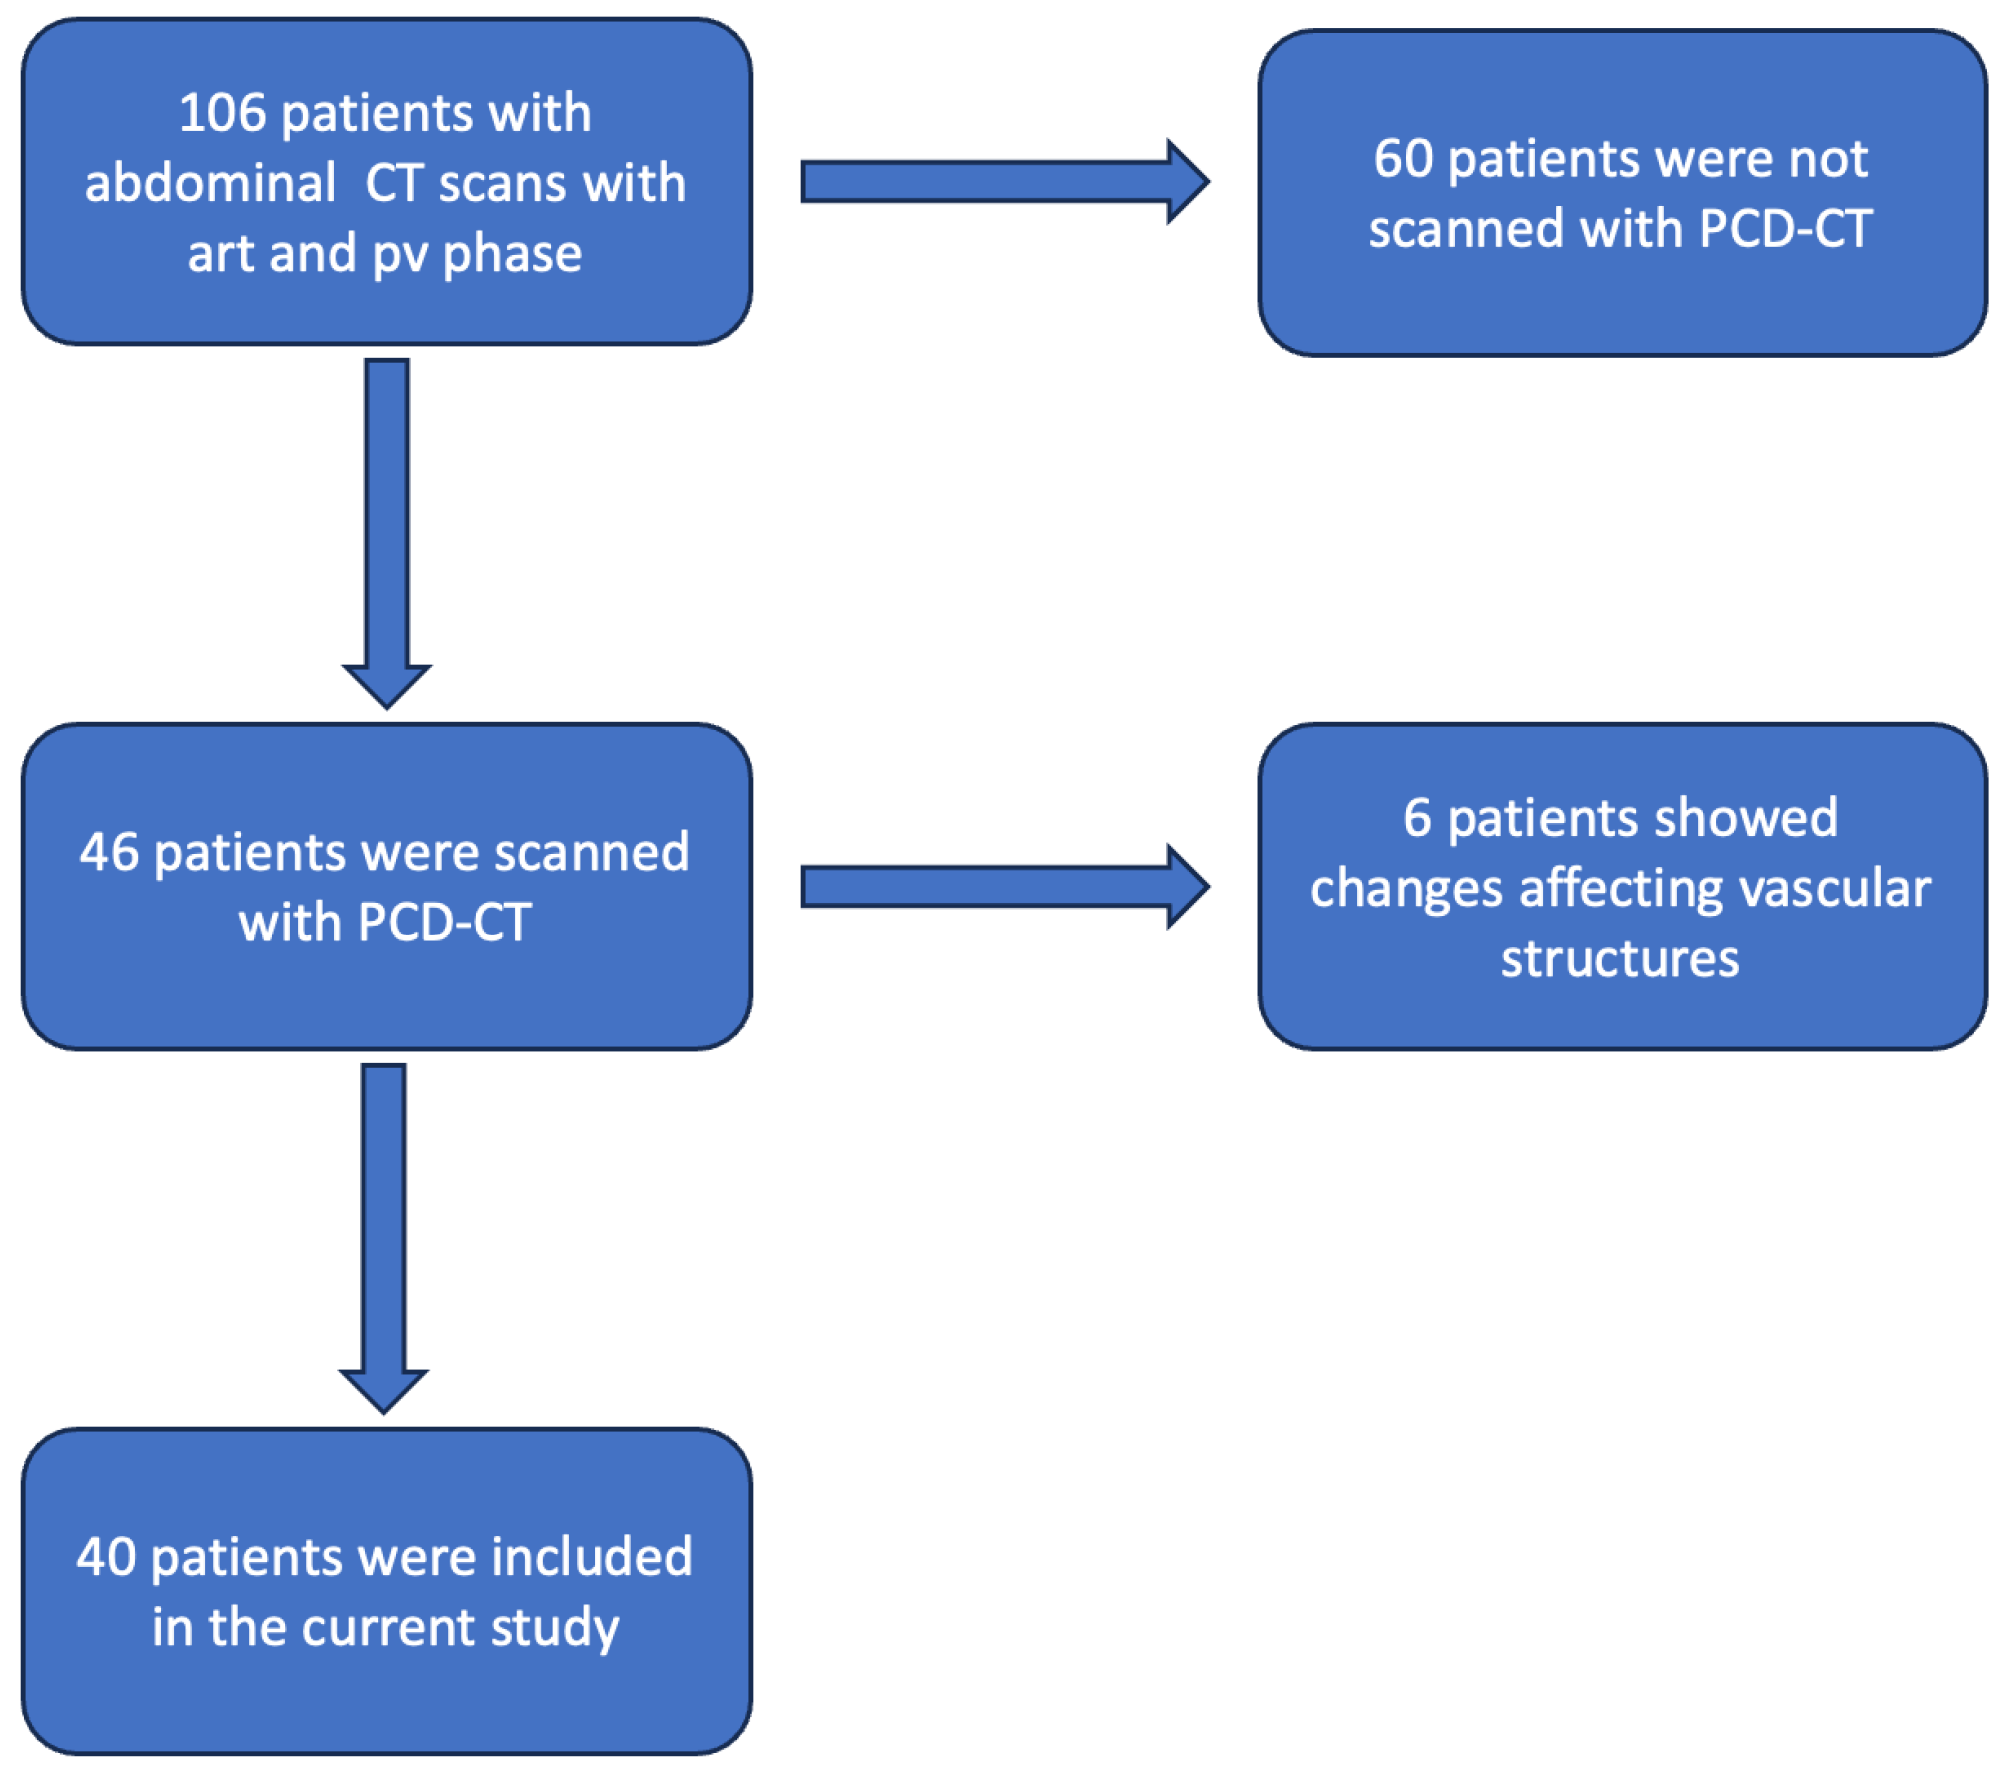
2.1. Study Population
2.2. Imaging Protocol
2.3. Objective Image Parameters
2.4. Subjective Image Analysis
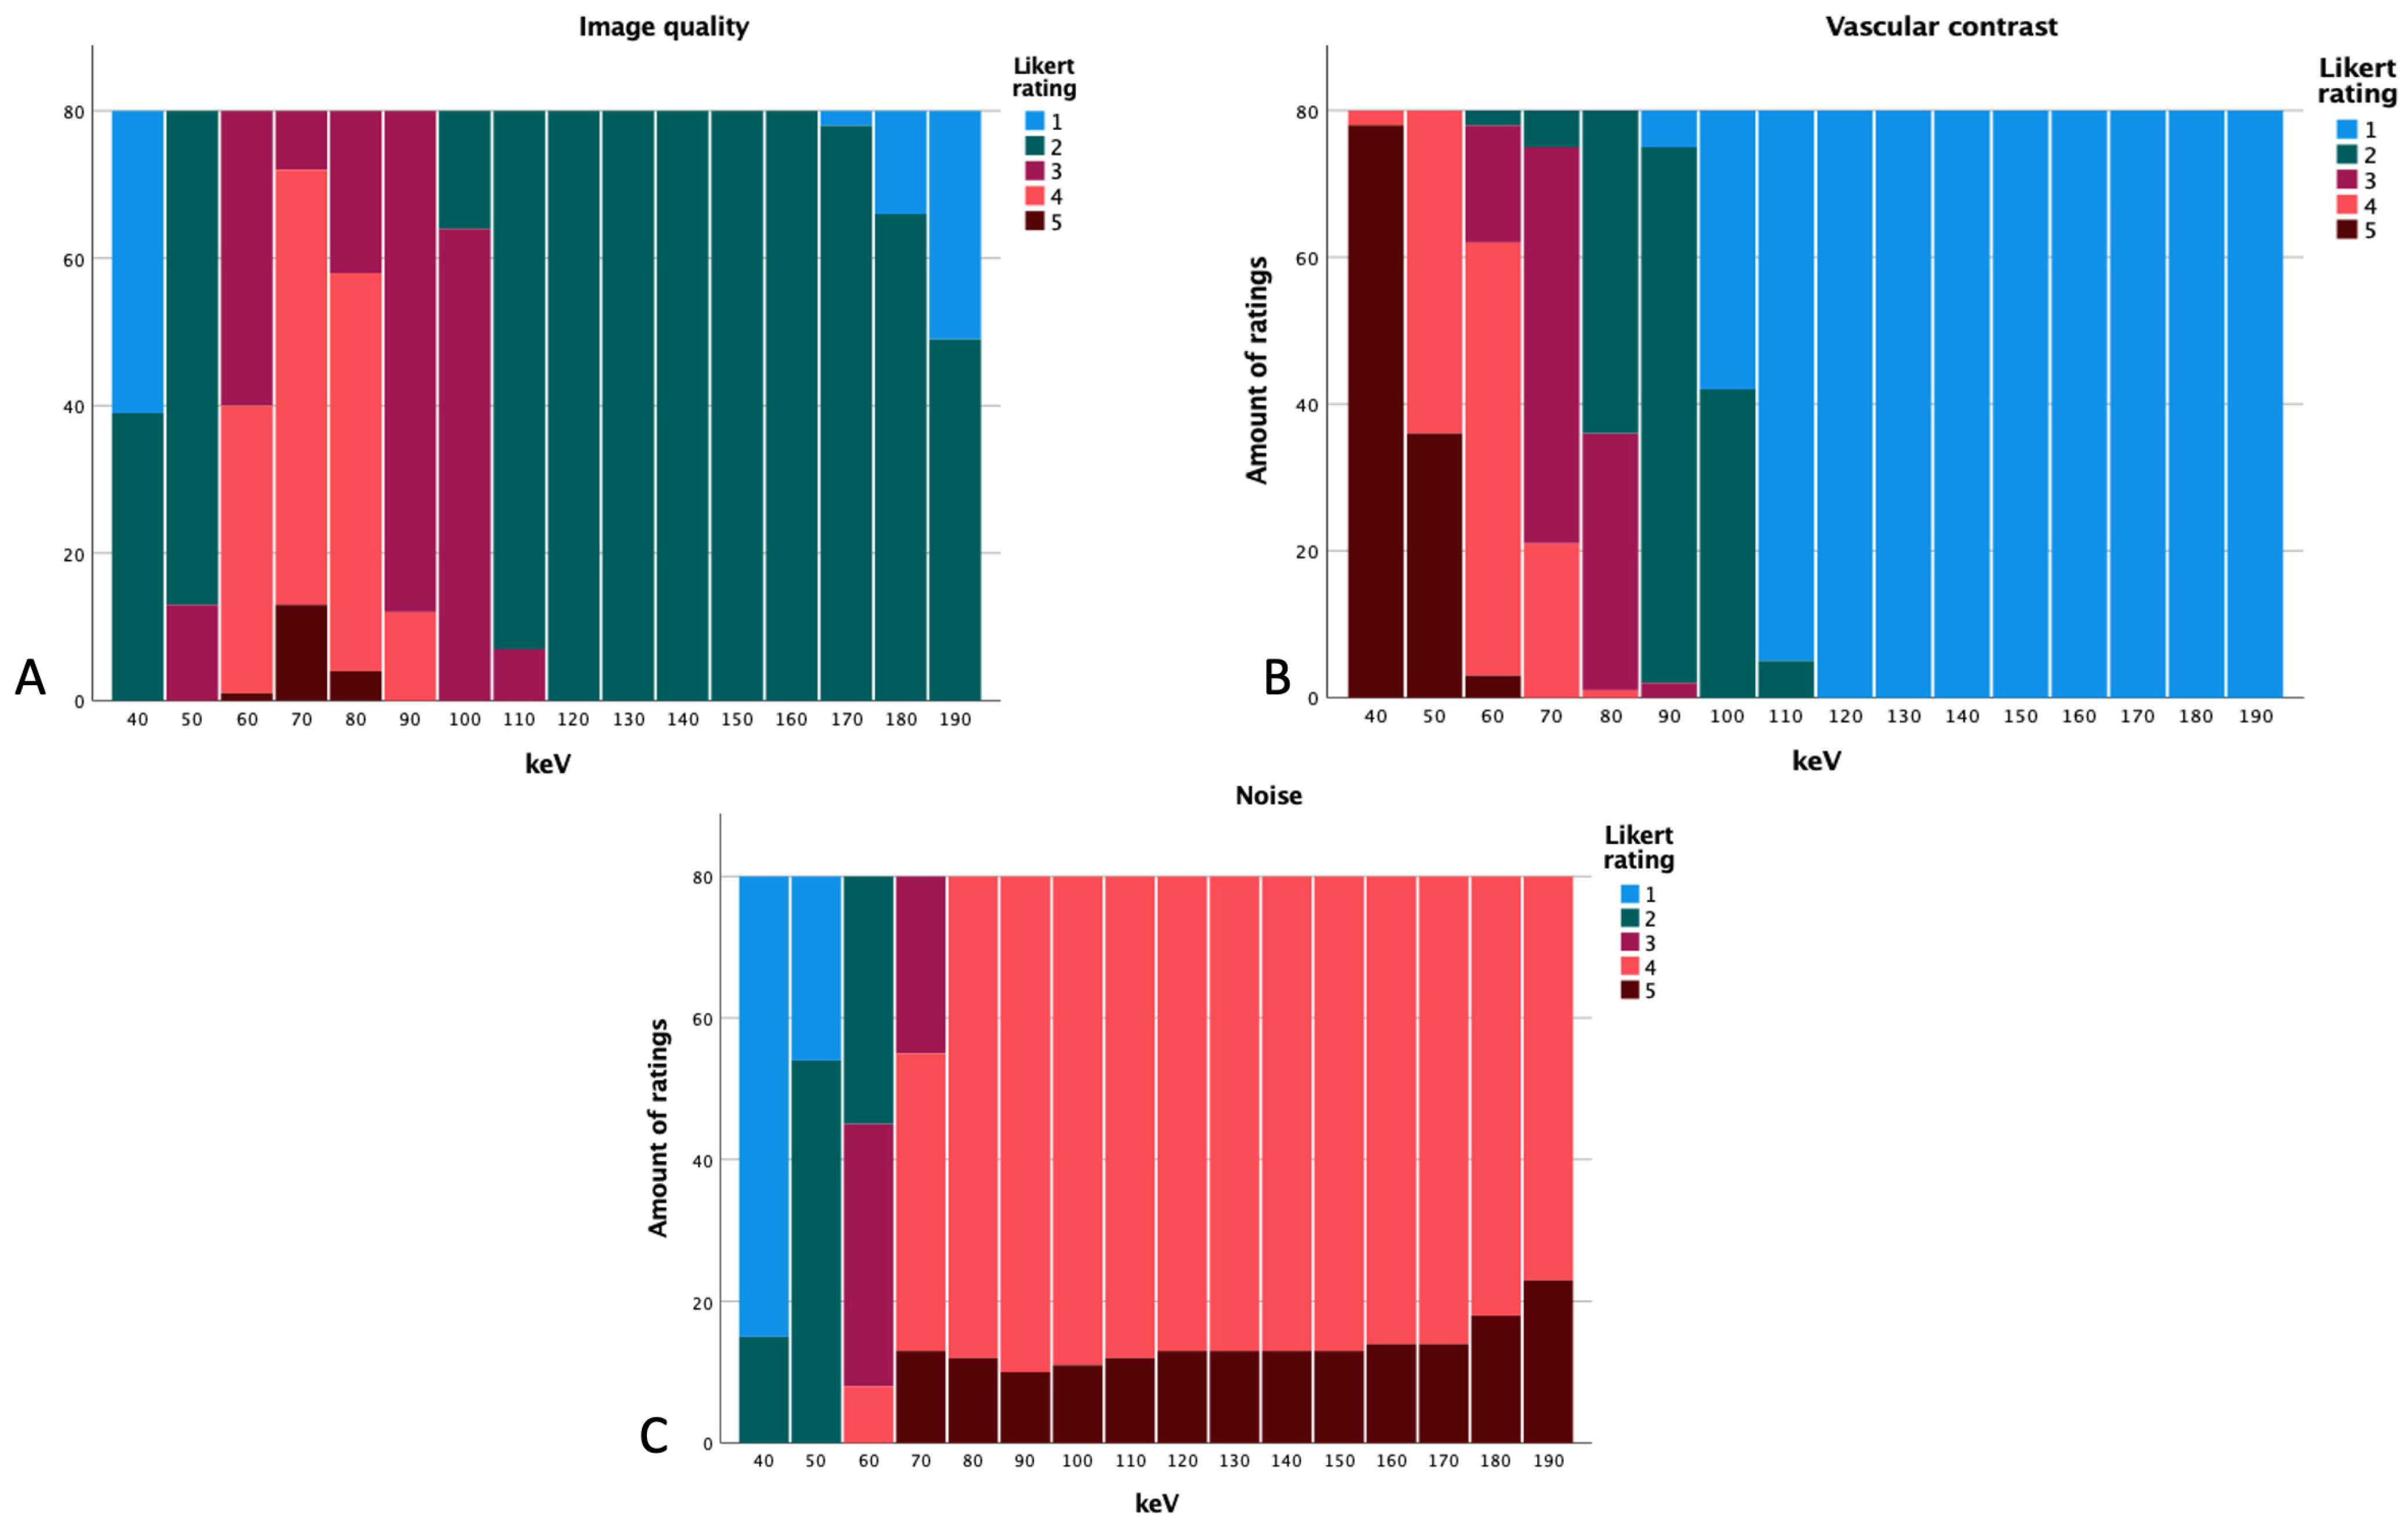
- Image quality:5 = optimal;4 = good;3 = acceptable;2 = poor;1 = very poor.
- Image noise:5 = none;4 = minor;3 = average;2 = more than average;1 = major.
- Vessel contrast:5 = optimal;4 = good;3 = acceptable;2 = poor;1 = not diagnostic.
2.5. Statistical Analysis
3. Results
3.1. Overall Data
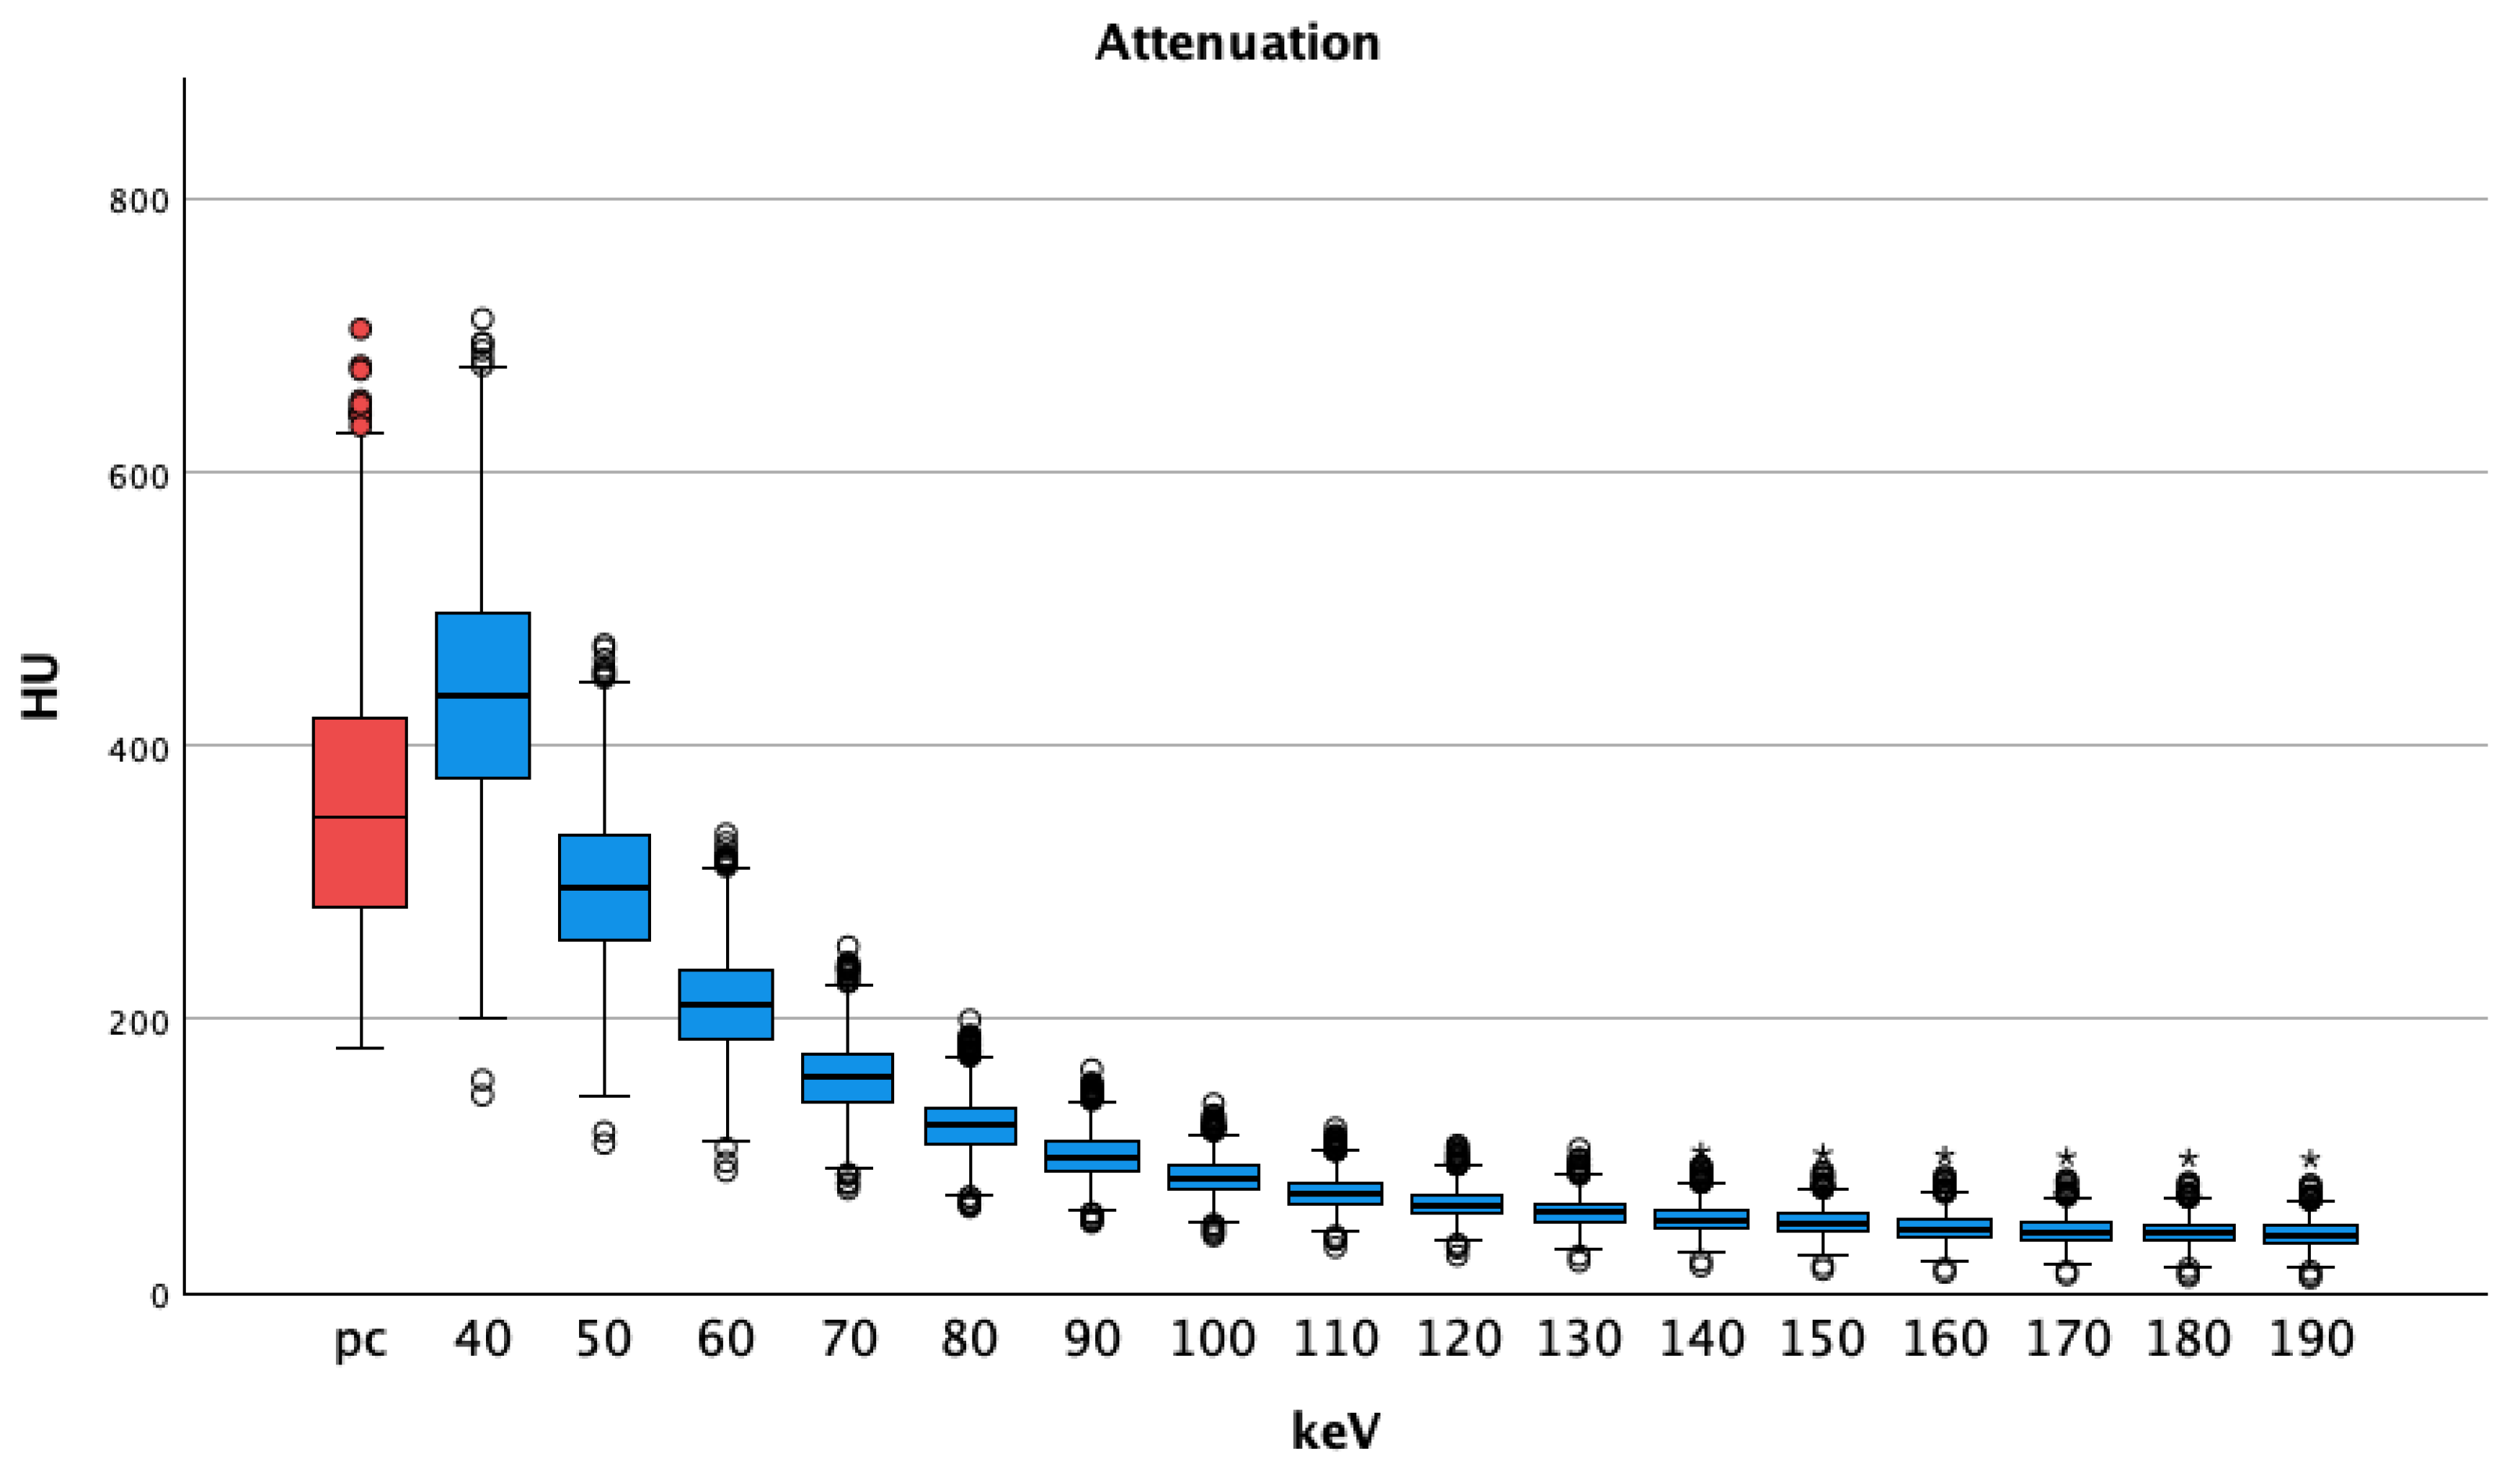
3.1.1. Attenuation
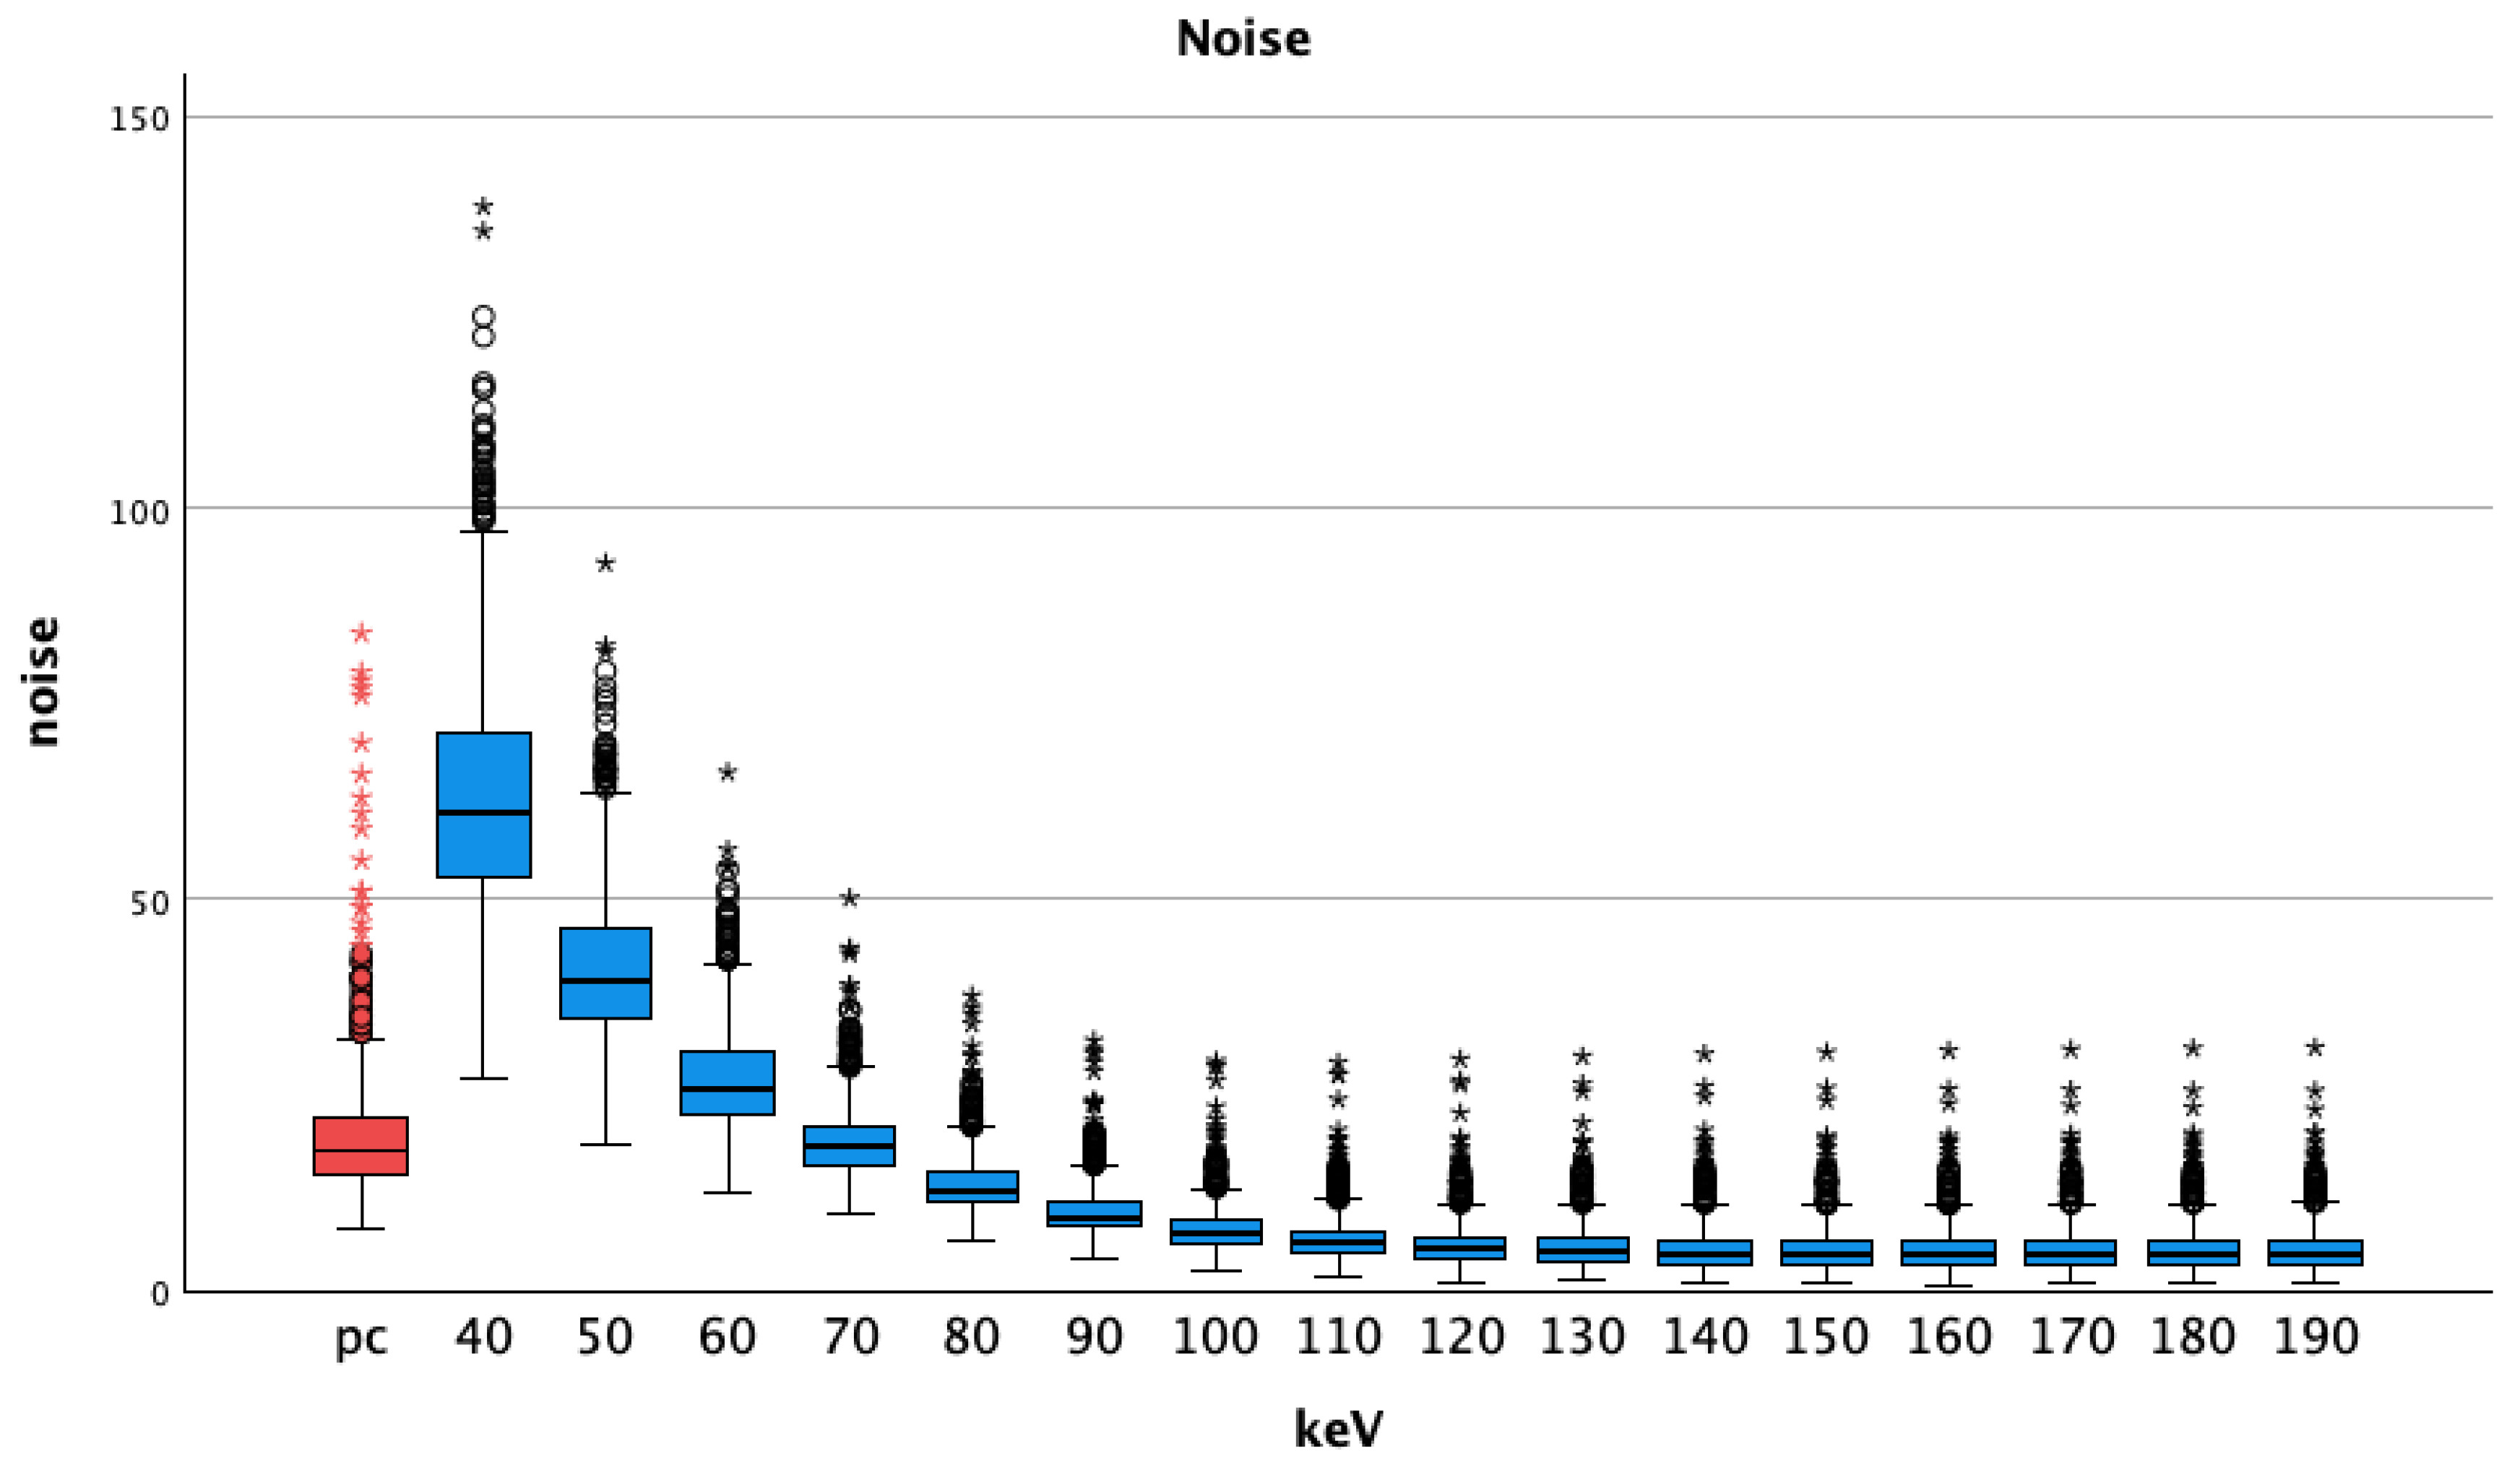
3.1.2. Noise
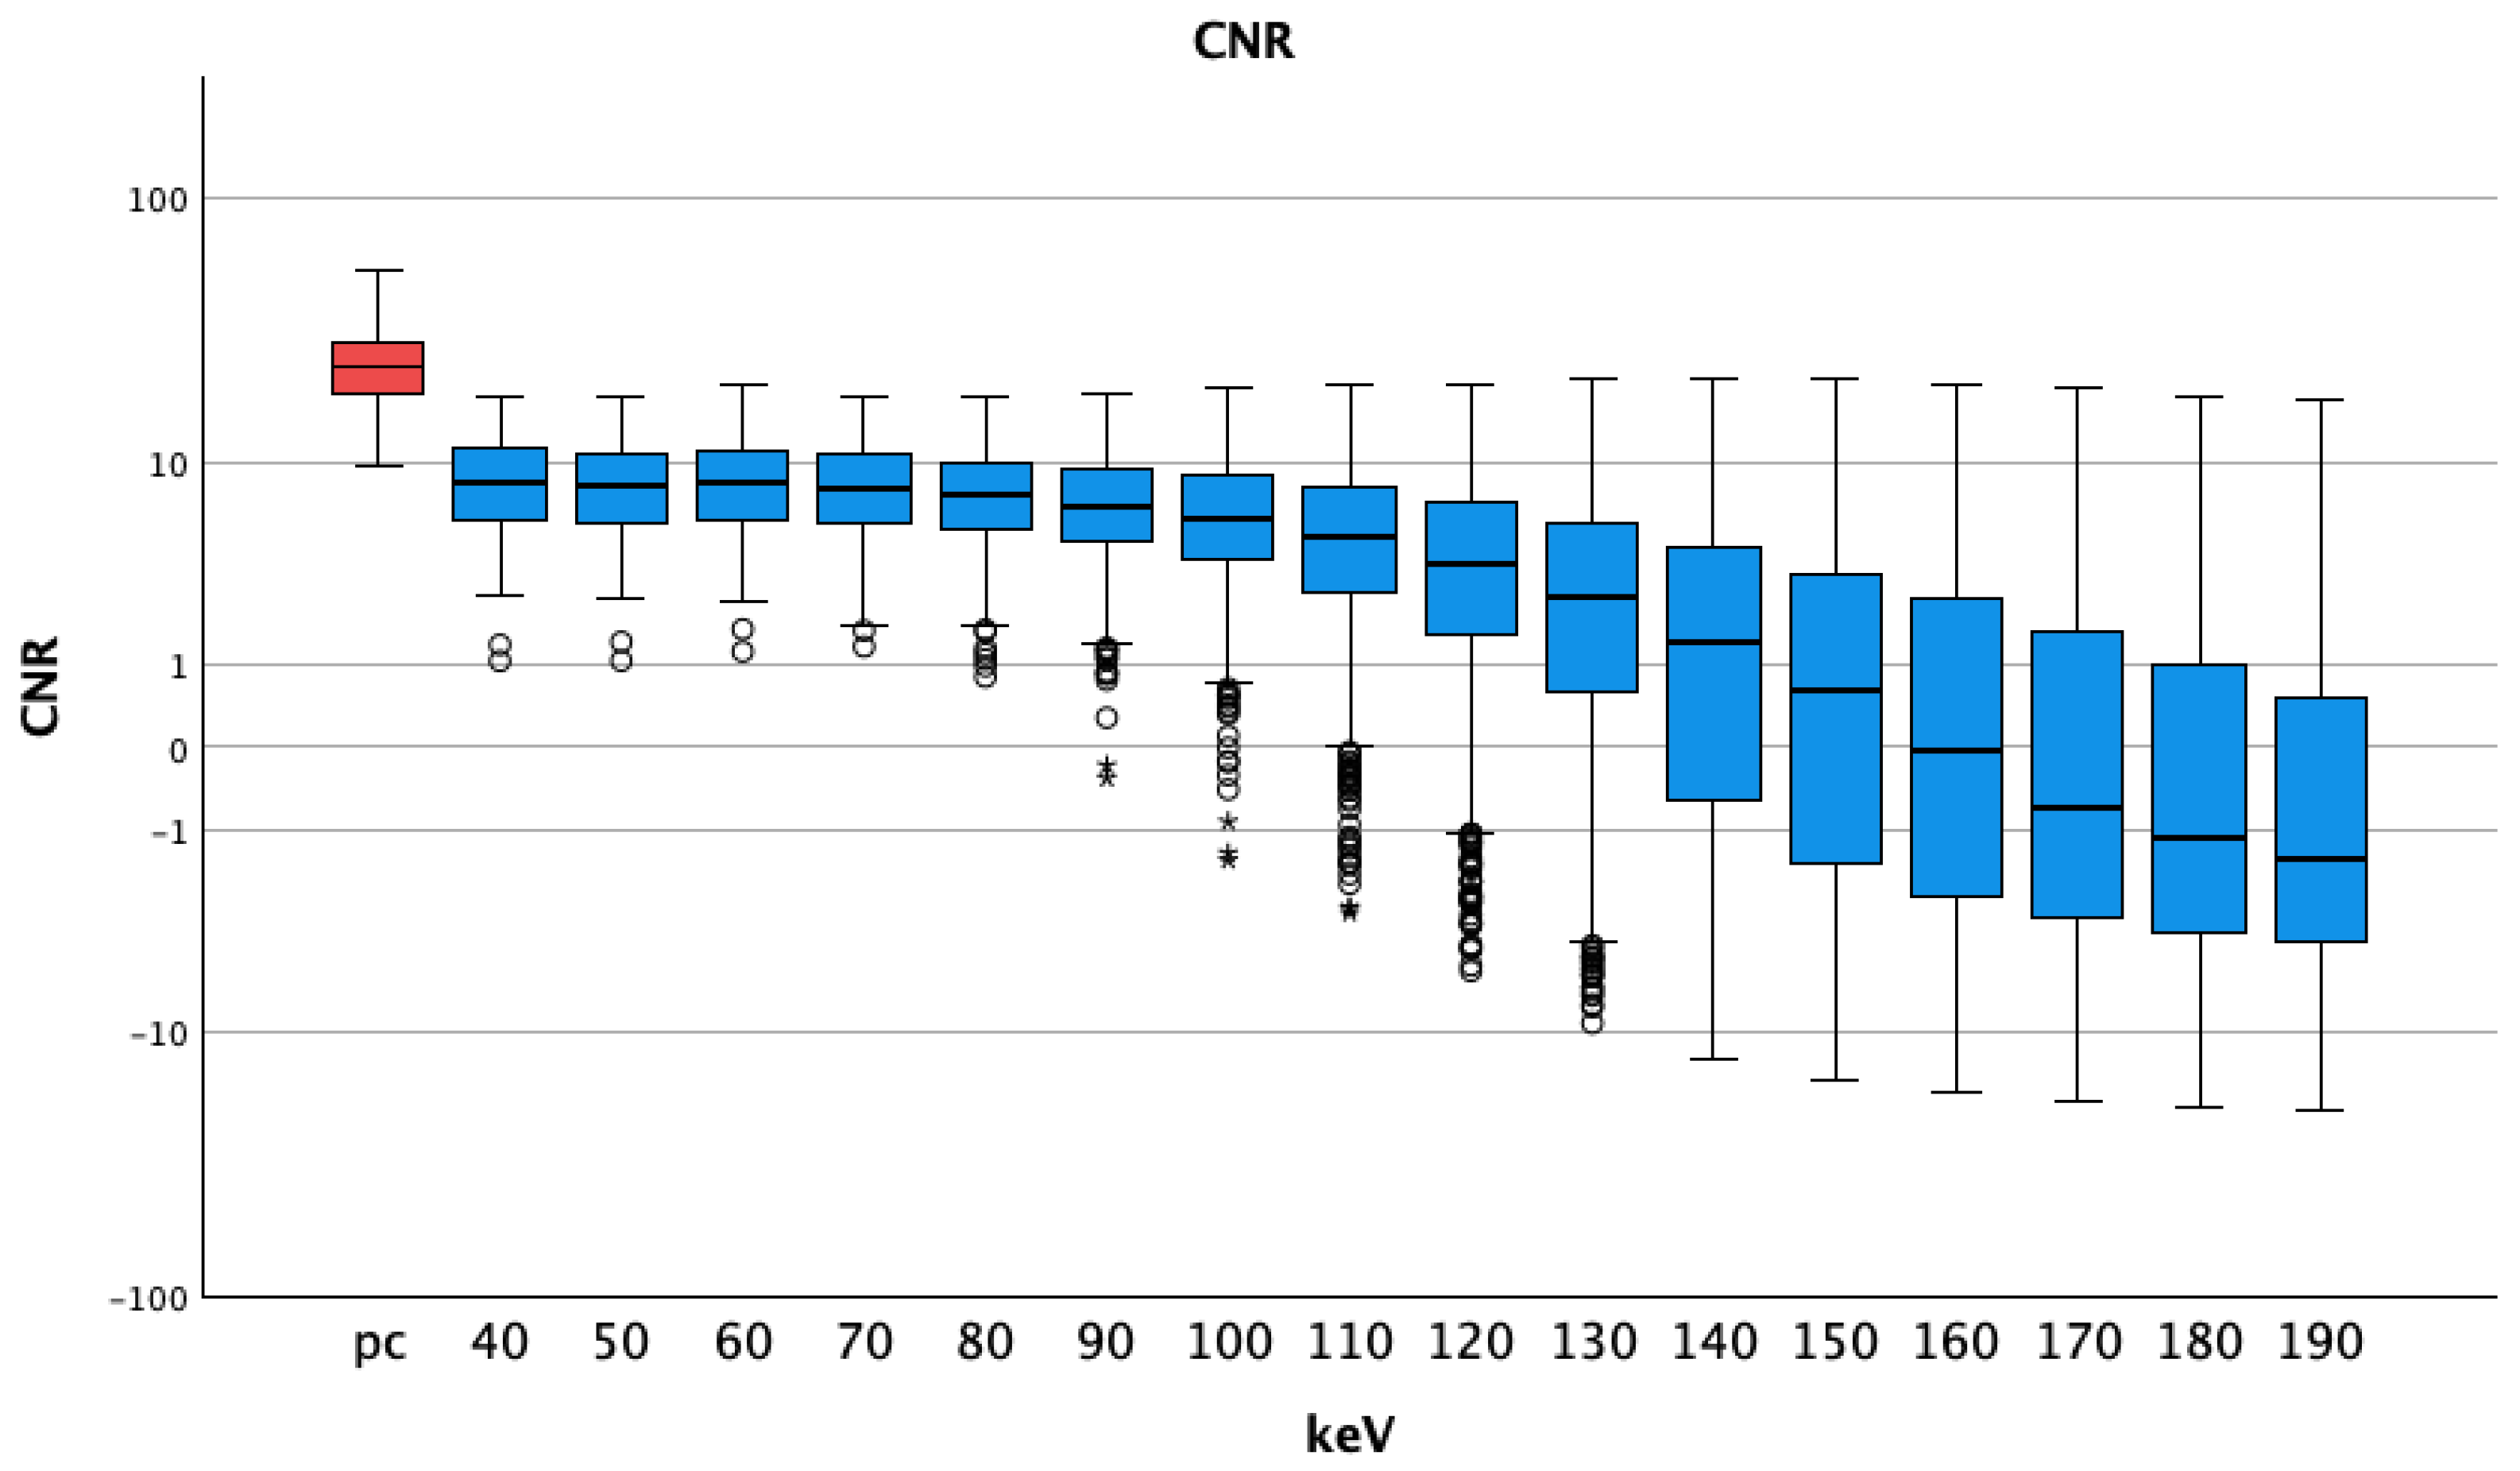
3.1.3. CNR
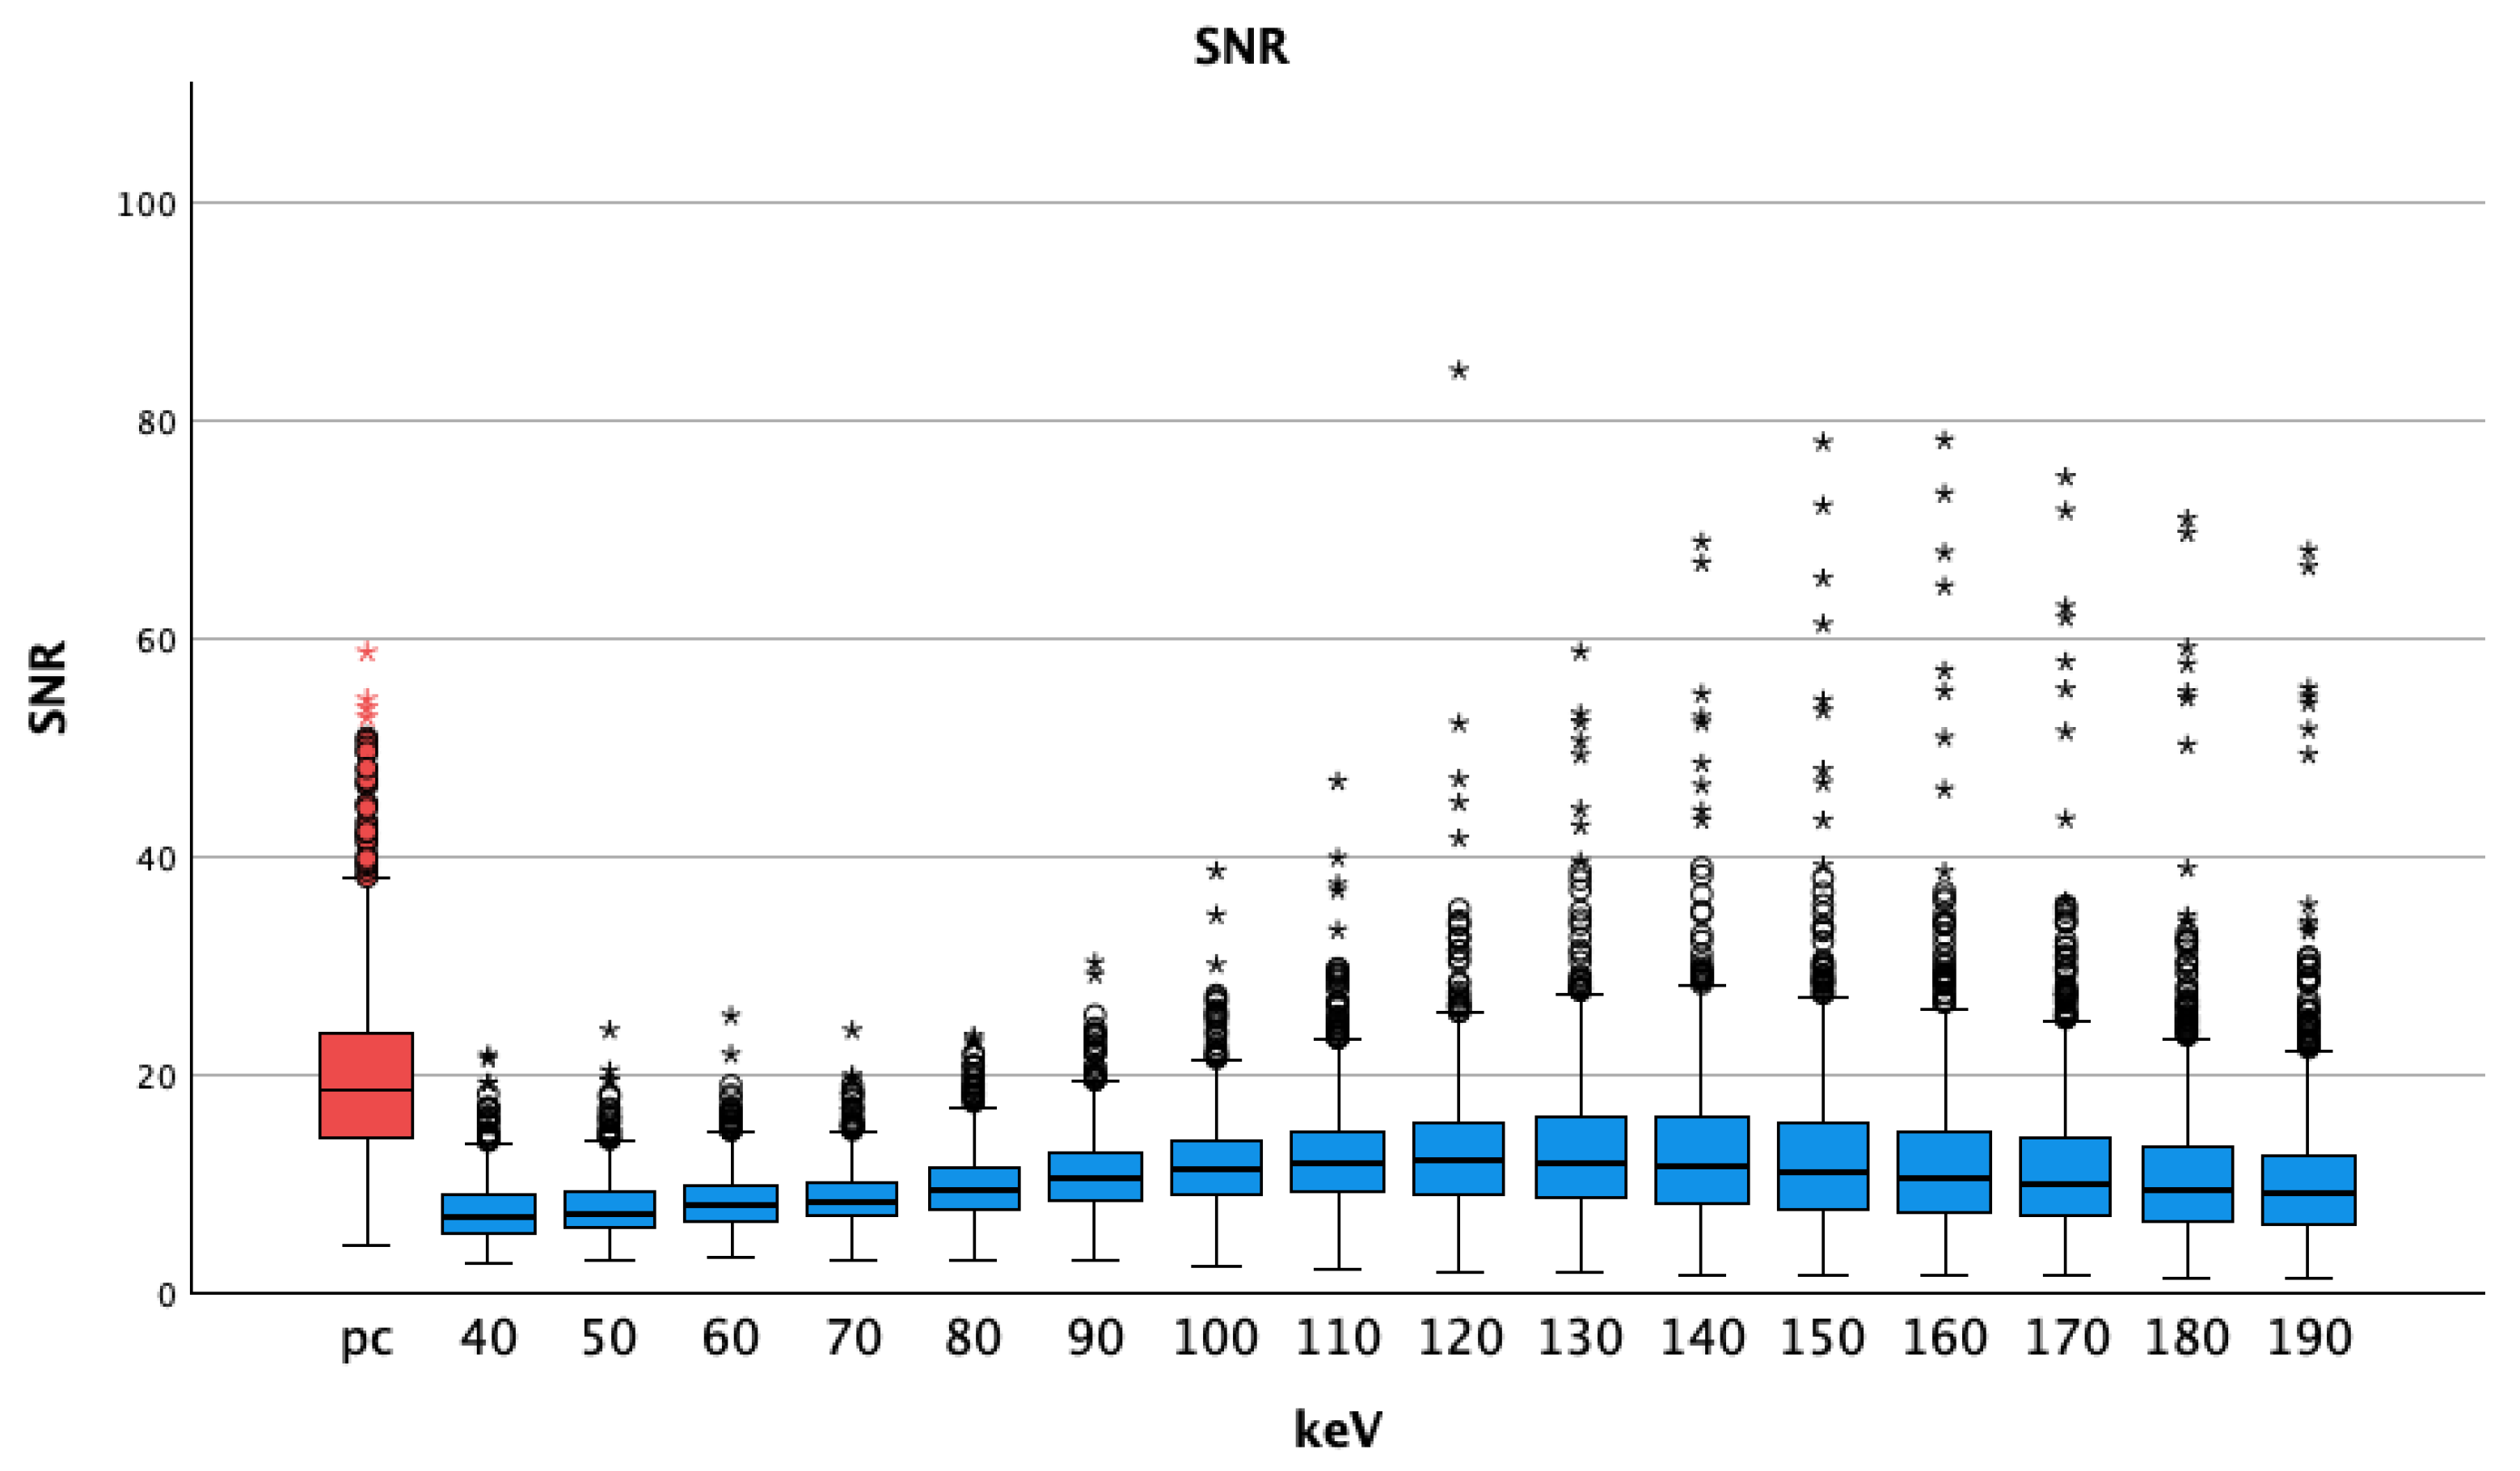
3.1.4. SNR
3.2. Vessel Specific Analysis
3.2.1. Attenuation
3.2.2. Noise
3.2.3. CNR
3.2.4. SNR
3.3. Subjective Image Quality
- Substantial agreement for vessel contrast (0.799);
- Substantial agreement for image quality (0.742);
- Substantial agreement for image noise (0.712).
4. Discussion
5. Conclusions
Author Contributions
Funding
Institutional Review Board Statement
Informed Consent Statement
Data Availability Statement
Conflicts of Interest
References
- Albrecht, M.H.; Scholtz, J.E.; Hüsers, K.; Beeres, M.; Bucher, A.M.; Kaup, M.; Martin, S.S.; Fischer, S.; Bodelle, B.; Bauer, R.W.; et al. Advanced image-based virtual monoenergetic dual-energy CT angiography of the abdomen: Optimization of kiloelectron volt settings to improve image contrast. Eur. Radiol. 2016, 26, 1863–1870. [Google Scholar] [CrossRef]
- Beeres, M.; Trommer, J.; Frellesen, C.; Nour-Eldin, N.E.A.; Scholtz, J.E.; Herrmann, E.; Vogl, T.J.; Wichmann, J.L. Evaluation of different keV-settings in dual-energy CT angiography of the aorta using advanced image-based virtual monoenergetic imaging. Int. J. Cardiovasc. Imaging 2016, 32, 137–144. [Google Scholar] [CrossRef]
- Doerner, J.; Wybranski, C.; Byrtus, J.; Houbois, C.; Hauger, M.; Heneweer, C.; Siedek, F.; Hickethier, T.; Große Hokamp, N.; Maintz, D.; et al. Intra-individual comparison between abdominal virtual mono-energetic spectral and conventional images using a novel spectral detector CT. PLoS ONE 2017, 12, e0183759. [Google Scholar] [CrossRef]
- Michalak, G.; Grimes, J.; Fletcher, J.; Halaweish, A.; Yu, L.; Leng, S.; McCollough, C. Selection of optimal tube potential settings for dual-energy CT virtual mono-energetic imaging of iodine in the abdomen. Abdom. Radiol. 2017, 42, 2289–2296. [Google Scholar] [CrossRef]
- Ren, H.; Zhen, Y.; Gong, Z.; Wang, C.; Chang, Z.; Zheng, J. Assessment of Virtual Monoenergetic Images in Run-off Computed Tomography Angiography: A Comparison Study to Conventional Images from Spectral Detector Computed Tomography. J. Comput. Assist. Tomogr. 2021, 45, 232–237. [Google Scholar] [CrossRef]
- Sudarski, S.; Apfaltrer, P.; Nance, J.W., Jr.; Schneider, D.; Meyer, M.; Schoenberg, S.O.; Fink, C.; Henzler, T. Optimization of keV-settings in abdominal and lower extremity dual-source dual-energy CT angiography determined with virtual monoenergetic imaging. Eur. J. Radiol. 2013, 82, e574–e581. [Google Scholar] [CrossRef] [PubMed]
- Doerner, J.; Luetkens, J.A.; Iuga, A.I.; Byrtus, J.; Haneder, S.; Maintz, D.; Hickethier, T. Poly-energetic and virtual mono-energetic images from a novel dual-layer spectral detector CT: Optimization of window settings is crucial to improve subjective image quality in abdominal CT angiographies. Abdom. Radiol. 2018, 43, 742–750. [Google Scholar] [CrossRef] [PubMed]
- Silva, A.C.; Morse, B.G.; Hara, A.K.; Paden, R.G.; Hongo, N.; Pavlicek, W. Dual-energy (spectral) CT: Applications in abdominal imaging. Radiographics 2011, 31, 1031–1046. [Google Scholar] [CrossRef] [PubMed]
- Buls, N.; Van Gompel, G.; Van Cauteren, T.; Nieboer, K.; Willekens, I.; Verfaillie, G.; Evans, P.; Macholl, S.; Newton, B.; de Mey, J. Contrast agent and radiation dose reduction in abdominal CT by a combination of low tube voltage and advanced image reconstruction algorithms. Eur. Radiol. 2015, 25, 1023–1031. [Google Scholar] [CrossRef] [PubMed]
- Lennartz, S.; Große Hokamp, N.; Zäske, C.; Zopfs, D.; Bratke, G.; Glauner, A.; Maintz, D.; Persigehl, T.; Chang, D.H.; Hickethier, T. Virtual monoenergetic images preserve diagnostic assessability in contrast media reduced abdominal spectral detector CT. Br. J. Radiol. 2020, 93, 20200340. [Google Scholar] [CrossRef] [PubMed]
- Flohr, T.; Petersilka, M.; Henning, A.; Ulzheimer, S.; Ferda, J.; Schmidt, B. Photon-counting CT review. Phys. Med. 2020, 79, 126–136. [Google Scholar] [CrossRef]
- Higashigaito, K.; Euler, A.; Eberhard, M.; Flohr, T.G.; Schmidt, B.; Alkadhi, H. Contrast-Enhanced Abdominal CT with Clinical Photon-Counting Detector CT: Assessment of Image Quality and Comparison with Energy-Integrating Detector CT. Acad. Radiol. 2022, 29, 689–697. [Google Scholar] [CrossRef]
- Kaatsch, H.L.; Fulisch, F.; Dillinger, D.; Kubitscheck, L.; Becker, B.V.; Piechotka, J.; Brockmann, M.A.; Froelich, M.F.; Schoenberg, S.O.; Overhoff, D.; et al. Ultra-low-dose photon-counting CT of paranasal sinus: An in vivo comparison of radiation dose and image quality to cone-beam CT. Dentomaxillofacial Radiol. 2024, 53, 103–108. [Google Scholar] [CrossRef]
- McCollough, C.; Rajendran, K.; Leng, S. Standardization and Quantitative Imaging with Photon-Counting Detector CT. Investig. Radiol. 2023, 58, 451–458. [Google Scholar] [CrossRef]
- Wehrse, E.; Klein, L.; Rotkopf, L.T.; Wagner, W.L.; Uhrig, M.; Heussel, C.P.; Ziener, C.H.; Delorme, S.; Heinze, S.; Kachelriess, M.; et al. Photon-counting detectors in computed tomography: From quantum physics to clinical practice. Radiologe 2021, 61, 1–10. [Google Scholar] [CrossRef] [PubMed]
- Wildberger, J.E.; Alkadhi, H. New Horizons in Vascular Imaging with Photon-Counting Detector CT. Investig. Radiol. 2023, 58, 499–504. [Google Scholar] [CrossRef]
- Willemink, M.J.; Persson, M.; Pourmorteza, A.; Pelc, N.J.; Fleischmann, D. Photon-counting CT: Technical Principles and Clinical Prospects. Radiology 2018, 289, 293–312. [Google Scholar] [CrossRef]
- Becker, B.V.; Kaatsch, H.L.; Nestler, K.; Overhoff, D.; Schneider, J.; Dillinger, D.; Piechotka, J.; Brockmann, M.A.; Ullmann, R.; Port, M.; et al. Initial experience on abdominal photon-counting computed tomography in clinical routine: General image quality and dose exposure. Eur. Radiol. 2023, 33, 2461–2468. [Google Scholar] [CrossRef]
- Graafen, D.; Müller, L.; Halfmann, M.; Düber, C.; Hahn, F.; Yang, Y.; Emrich, T.; Kloeckner, R. Photon-counting detector CT improves quality of arterial phase abdominal scans: A head-to-head comparison with energy-integrating CT. Eur. J. Radiol. 2022, 156, 110514. [Google Scholar] [CrossRef]
- Euler, A.; Higashigaito, K.; Mergen, V.; Sartoretti, T.; Zanini, B.; Schmidt, B.; Flohr, T.G.; Ulzheimer, S.; Eberhard, M.; Alkadhi, H. High-Pitch Photon-Counting Detector Computed Tomography Angiography of the Aorta: Intraindividual Comparison to Energy-Integrating Detector Computed Tomography at Equal Radiation Dose. Invest. Radiol. 2022, 57, 115–121. [Google Scholar] [CrossRef]
- Higashigaito, K.; Schmid, T.; Puippe, G.; Morsbach, F.; Lachat, M.; Seifert, B.; Pfammatter, T.; Alkadhi, H.; Husarik, D.B. CT Angiography of the Aorta: Prospective Evaluation of Individualized Low-Volume Contrast Media Protocols. Radiology 2016, 280, 960–968. [Google Scholar] [CrossRef]
- Rippel, K.; Luitjens, J.; Habeeballah, O.; Scheurig-Muenkler, C.; Bette, S.; Braun, F.; Kroencke, T.J.; Schwarz, F.; Decker, J.A. Evaluation of ECG-Gated, High-Pitch Thoracoabdominal Angiographies with Dual-Source Photon-Counting Detector Computed Tomography. J. Endovasc. Ther. 2024, 15266028241230943. [Google Scholar] [CrossRef]
- Kau, T.; Eicher, W.; Reiterer, C.; Niedermayer, M.; Rabitsch, E.; Senft, B.; Hausegger, K.A. Dual-energy CT angiography in peripheral arterial occlusive disease-accuracy of maximum intensity projections in clinical routine and subgroup analysis. Eur. Radiol. 2011, 21, 1677–1686. [Google Scholar] [CrossRef]
- Hu, D.K.; Pisimisis, G.T.; Sheth, R.A. Repair of abdominal aortic aneurysms: Preoperative imaging and evaluation. Cardiovasc. Diagn. Ther. 2018, 8, S157–S167. [Google Scholar] [CrossRef]
- O’Neill, S.; Kavanagh, R.G.; Carey, B.W.; Moore, N.; Maher, M.; O’Connor, O.J. Using body mass index to estimate individualised patient radiation dose in abdominal computed tomography. Eur. Radiol. Exp. 2018, 2, 38. [Google Scholar] [CrossRef]
- Rassouli, N.; Chalian, H.; Rajiah, P.; Dhanantwari, A.; Landeras, L. Assessment of 70-keV virtual monoenergetic spectral images in abdominal CT imaging: A comparison study to conventional polychromatic 120-kVp images. Abdom. Radiol. 2017, 42, 2579–2586. [Google Scholar] [CrossRef]
- Szucs-Farkas, Z.; Strautz, T.; Patak, M.A.; Kurmann, L.; Vock, P.; Schindera, S.T. Is body weight the most appropriate criterion to select patients eligible for low-dose pulmonary CT angiography? Analysis of objective and subjective image quality at 80 kVp in 100 patients. Eur. Radiol. 2009, 19, 1914–1922. [Google Scholar] [CrossRef]
- Landis, F., Jr.; Koch, G.G. The measurement of observer agreement for categorical data. Biometrics 1977, 33, 159–174. [Google Scholar] [CrossRef] [PubMed]
- Lennartz, S.; Laukamp, K.R.; Tandon, Y.; Jordan, M.; Große Hokamp, N.; Zopfs, D.; Pennig, L.; Obmann, M.; Gilkeson, R.C.; Herrmann, K.A.; et al. Abdominal vessel depiction on virtual triphasic spectral detector CT: Initial clinical experience. Abdom. Radiol. 2021, 46, 3501–3511. [Google Scholar] [CrossRef] [PubMed]
- Patel, A.A.; Sutphin, P.D.; Xi, Y.; Abbara, S.; Kalva, S.P. Arterial Phase CTA Replacement by a Virtual Arterial Phase Reconstruction from a Venous Phase CTA: Preliminary Results Using Detector-Based Spectral CT. Cardiovasc. Intervent. Radiol. 2019, 42, 250–259. [Google Scholar] [CrossRef]
- Sartoretti, T.; Landsmann, A.; Nakhostin, D.; Eberhard, M.; Roeren, C.; Mergen, V.; Higashigaito, K.; Raupach, R.; Alkadhi, H.; Euler, A. Quantum Iterative Reconstruction for Abdominal Photon-counting Detector CT Improves Image Quality. Radiology 2022, 303, 339–348. [Google Scholar] [CrossRef]
- Racine, D.; Mergen, V.; Viry, A. Photon-Counting Detector CT With Quantum Iterative Reconstruction: Impact on Liver Lesion Detection and Radiation Dose Reduction. Invest. Radiol. 2022, 58, 245–252. [Google Scholar] [CrossRef]
- Dillinger, D.; Overhoff, D.; Booz, C.; Kaatsch, H.L.; Piechotka, J.; Hagen, A.; Froelich, M.F.; Vogl, T.J.; Waldeck, S. Impact of CT Photon-Counting Virtual Monoenergetic Imaging on Visualization of Abdominal Arterial Vessels. Diagnostics 2023, 13, 938. [Google Scholar] [CrossRef]
- Grant, K.L.; Flohr, T.G.; Krauss, B.; Sedlmair, M.; Thomas, C.; Schmidt, B. Assessment of an advanced image-based technique to calculate virtual monoenergetic computed tomographic images from a dual-energy examination to improve contrast-to-noise ratio in examinations using iodinated contrast media. Invest. Radiol. 2014, 49, 586–592. [Google Scholar] [CrossRef]
- Almutairi, A.; Sun, Z.; Poovathumkadavi, A.; Assar, T. Dual Energy CT Angiography of Peripheral Arterial Disease: Feasibility of Using Lower Contrast Medium Volume. PLoS ONE 2015, 10, e0139275. [Google Scholar]
- Awai, K.; Hiraishi, K.; Hori, S. Effect of contrast material injection duration and rate on aortic peak time and peak enhancement at dynamic CT involving injection protocol with dose tailored to patient weight. Radiology 2004, 230, 142–150. [Google Scholar] [CrossRef]
- Bae, K.T. Optimization of contrast enhancement in thoracic MDCT. Radiol. Clin. N. Am. 2010, 48, 9–29. [Google Scholar] [CrossRef]
- Weininger, M.; Barraza, J.M.; Kemper, C.A.; Kalafut, J.F.; Costello, P.; Schoepf, U.J. Cardiothoracic CT angiography: Current contrast medium delivery strategies. AJR Am. J. Roentgenol. 2011, 196, W260–W272. [Google Scholar] [CrossRef] [PubMed]
- Higashigaito, K.; Angst, F.; Runge, V.M.; Alkadhi, H.; Donati, O.F. Metal Artifact Reduction in Pelvic Computed Tomography With Hip Prostheses: Comparison of Virtual Monoenergetic Extrapolations From Dual-Energy Computed Tomography and an Iterative Metal Artifact Reduction Algorithm in a Phantom Study. Invest. Radiol. 2015, 50, 828–834. [Google Scholar] [CrossRef] [PubMed]
- Neuhaus, V.; Hokamp, N.G.; Abdullayev, N.; Rau, R.; Mpotsaris, A.; Maintz, D.; Borggrefe, J. Metal artifact reduction by dual-layer computed tomography using virtual monoenergetic images. Eur. J. Radiol. 2017, 93, 143–148. [Google Scholar] [CrossRef] [PubMed]
- Neuhaus, V.; Hokamp, N.G.; Zopfs, D.; Laukamp, K.; Lennartz, S.; Abdullayev, N.; Maintz, D.; Borggrefe, J. Reducing artifacts from total hip replacements in dual layer detector CT: Combination of virtual monoenergetic images and orthopedic metal artifact reduction. Eur. J. Radiol. 2019, 111, 14–20. [Google Scholar] [CrossRef] [PubMed]
- Wellenberg, R.H.; Boomsma, M.F.; van Osch, J.A.; Vlassenbroek, A.; Milles, J.; Edens, M.A.; Streekstra, G.J.; Slump, C.H.; Maas, M. Computed Tomography Imaging of a Hip Prosthesis Using Iterative Model-Based Reconstruction and Orthopaedic Metal Artefact Reduction: A Quantitative Analysis. J. Comput. Assist. Tomogr. 2016, 40, 971–978. [Google Scholar] [CrossRef] [PubMed]


| Parameter | Overall Data | Male | Female |
|---|---|---|---|
| age (years) | 68 ± 13 | 68 ± 12 | 69 ± 16 |
| calculated diameter (cm) | 30.71 ± 3.81 | 30.83 ± 3.19 | 30.49 ± 4.9 |
| CTDI (mGy) | 6.17 ± 1.99 | 6.02 ± 1.74 | 6.45 ± 2.44 |
| DLP (mGy × cm) | 292.35 ± 105.56 | 295.5 ± 105.06 | 286.5 ± 110.12 |
| keV | pv Mean and SD | pc Arterial Mean and SD | |
|---|---|---|---|
| HU | 40 and pc | 440 ± 97 | 360 ± 97 |
| 50 | 298 ± 63 | ||
| 60 | 212 ± 42 | ||
| 70 | 159 ± 29 | ||
| 80 | 124 ± 22 | ||
| 90 | 101 ± 17 | ||
| 100 | 85 ± 15 | ||
| 110 | 74 ± 13 | ||
| 120 | 66 ± 12 | ||
| 130 | 59 ± 11 | ||
| 140 | 55 ± 11 | ||
| 150 | 51 ± 11 | ||
| 160 | 48 ± 10 | ||
| 170 | 46 ± 10 | ||
| 180 | 44 ± 10 | ||
| 190 | 43 ± 10 | ||
| noise | 40 and pc | 63.27 ± 16.05 | 19.95 ± 8.58 |
| 50 | 41.31 ± 10.25 | ||
| 60 | 27.17 ± 6.78 | ||
| 70 | 19.22 ± 4.81 | ||
| 80 | 13.63 ± 3.87 | ||
| 90 | 10.19 ± 3.40 | ||
| 100 | 8.08 ± 3.21 | ||
| 110 | 6.80 ± 3.15 | ||
| 120 | 6.05 ± 3.15 | ||
| 130 | 5.62 ± 3.16 | ||
| 140 | 5.40 ± 3.18 | ||
| 150 | 5.30 ± 3.19 | ||
| 160 | 5.26 ± 3.20 | ||
| 170 | 5.27 ± 3.20 | ||
| 180 | 5.32 ± 3.20 | ||
| 190 | 5.37 ± 3.21 | ||
| CNR | 40 and pc | 8.71 ± 3.53 | 25.10 ± 9.38 |
| 50 | 8.49 ± 3.46 | ||
| 60 | 8.63 ± 3.58 | ||
| 70 | 8.27 ± 3.44 | ||
| 80 | 7.75 ± 3.37 | ||
| 90 | 7.21 ± 3.51 | ||
| 100 | 6.52 ± 3.74 | ||
| 110 | 5.64 ± 3.98 | ||
| 120 | 4.55 ± 4.18 | ||
| 130 | 3.35 ± 4.34 | ||
| 140 | 2.14 ± 4.47 | ||
| 150 | 1.04 ± 4.57 | ||
| 160 | 0.10 ± 4.62 | ||
| 170 | −0.66 ± 4.60 | ||
| 180 | −1.26 ± 4.53 | ||
| 190 | −1.73 ± 4.49 | ||
| SNR | 40 and pc | 7.42 ± 2.73 | 20.10 ± 8.30 |
| 50 | 7.68 ± 2.72 | ||
| 60 | 8.28 ± 2.73 | ||
| 70 | 8.73 ± 2.71 | ||
| 80 | 9.73 ± 3.15 | ||
| 90 | 10.79 ± 3.70 | ||
| 100 | 11.77 ± 4.39 | ||
| 110 | 12.57 ± 5.24 | ||
| 120 | 13.09 ± 5.24 | ||
| 130 | 13.20 ± 6.88 | ||
| 140 | 13.06 ± 7.50 | ||
| 150 | 12.73 ± 7.98 | ||
| 160 | 12.25 ± 8.07 | ||
| 170 | 11.70 ± 7.84 | ||
| 180 | 11.08 ± 7.45 | ||
| 190 | 10.59 ± 7.13 |
| Vessel | Mean Attenuation ± Standard Deviation | p-Value | |
|---|---|---|---|
| aorta | HU.art pc | 356 ± 96 | <0.001 |
| HU.pv.40 | 470 ± 96 | ||
| coeliac trunk | HU.art pc | 362 ± 100 | <0.001 |
| HU.pv.40 | 440 ± 94 | ||
| superior mesenteric artery | HU.art pc | 368 ± 103 | <0.001 |
| HU.pv.40 | 436 ± 87 | ||
| left iliac artery | HU.art pc | 368 ± 96 | <0.001 |
| HU.pv.40 | 466 ± 96 | ||
| right iliac artery | HU.art pc | 365 ± 96 | <0.001 |
| HU.pv.40 | 465 ± 96 | ||
| right renal artery | HU.art pc | 353 ± 97 | <0.001 |
| HU.pv.40 | 404 ± 91 | ||
| left renal artery | HU.art pc | 345 ± 92 | <0.001 |
| HU.pv.40 | 397 ± 95 |
Disclaimer/Publisher’s Note: The statements, opinions and data contained in all publications are solely those of the individual author(s) and contributor(s) and not of MDPI and/or the editor(s). MDPI and/or the editor(s) disclaim responsibility for any injury to people or property resulting from any ideas, methods, instructions or products referred to in the content. |
© 2024 by the authors. Licensee MDPI, Basel, Switzerland. This article is an open access article distributed under the terms and conditions of the Creative Commons Attribution (CC BY) license (https://creativecommons.org/licenses/by/4.0/).
Share and Cite
Dillinger, D.; Overhoff, D.; Ayx, I.; Kaatsch, H.L.; Hagen, A.; Schönberg, S.O.; Waldeck, S. Optimizing Arterial Vessel Contrast in Portal Venous Phase with Virtual Monoenergetic Images from Photon-Counting Detector CT Scans of the Abdomen—First Clinical Experiences. Diagnostics 2024, 14, 627. https://doi.org/10.3390/diagnostics14060627
Dillinger D, Overhoff D, Ayx I, Kaatsch HL, Hagen A, Schönberg SO, Waldeck S. Optimizing Arterial Vessel Contrast in Portal Venous Phase with Virtual Monoenergetic Images from Photon-Counting Detector CT Scans of the Abdomen—First Clinical Experiences. Diagnostics. 2024; 14(6):627. https://doi.org/10.3390/diagnostics14060627
Chicago/Turabian StyleDillinger, Daniel, Daniel Overhoff, Isabelle Ayx, Hanns L. Kaatsch, Achim Hagen, Stefan O. Schönberg, and Stephan Waldeck. 2024. "Optimizing Arterial Vessel Contrast in Portal Venous Phase with Virtual Monoenergetic Images from Photon-Counting Detector CT Scans of the Abdomen—First Clinical Experiences" Diagnostics 14, no. 6: 627. https://doi.org/10.3390/diagnostics14060627
APA StyleDillinger, D., Overhoff, D., Ayx, I., Kaatsch, H. L., Hagen, A., Schönberg, S. O., & Waldeck, S. (2024). Optimizing Arterial Vessel Contrast in Portal Venous Phase with Virtual Monoenergetic Images from Photon-Counting Detector CT Scans of the Abdomen—First Clinical Experiences. Diagnostics, 14(6), 627. https://doi.org/10.3390/diagnostics14060627