
Analysis of the Porphyrin Peak Shift and Fluorescence Lifetime in Gliomas with Different Tumor Grades, Intratumoral Regions, and Visible Fluorescence Status


 ,
,  , , , , ,
  and
and
Abstract
1. Introduction
2. Materials and Methods
2.1. Preoperative Course
2.2. Neurosurgical Resection and Tissue Collection
2.3. Tissue Preparation
2.4. Imaging System and Post-Processing
2.5. Histopathological Analyses
2.6. Statistical Analysis
3. Results
3.1. Patient Characteristics
3.2. Glioma Resection with and Without 5-ALA Administration
3.3. Comparison of RPPC in Tissue with and Without Preoperative 5-ALA Administration
3.3.1. Tissue Specimens Without 5-ALA Administration
3.3.2. Glioma Tissue After 5-ALA Administration
3.4. Analysis of RPPC in Patients with 5-ALA Administration
3.4.1. Comparison of RPPC and WHO Grade
3.4.2. Comparison of RPPC and Fluorescence Status
3.4.3. Comparison of RPPC and Tumor Region
3.4.4. Comparison of RPPC and Subgroup Analysis
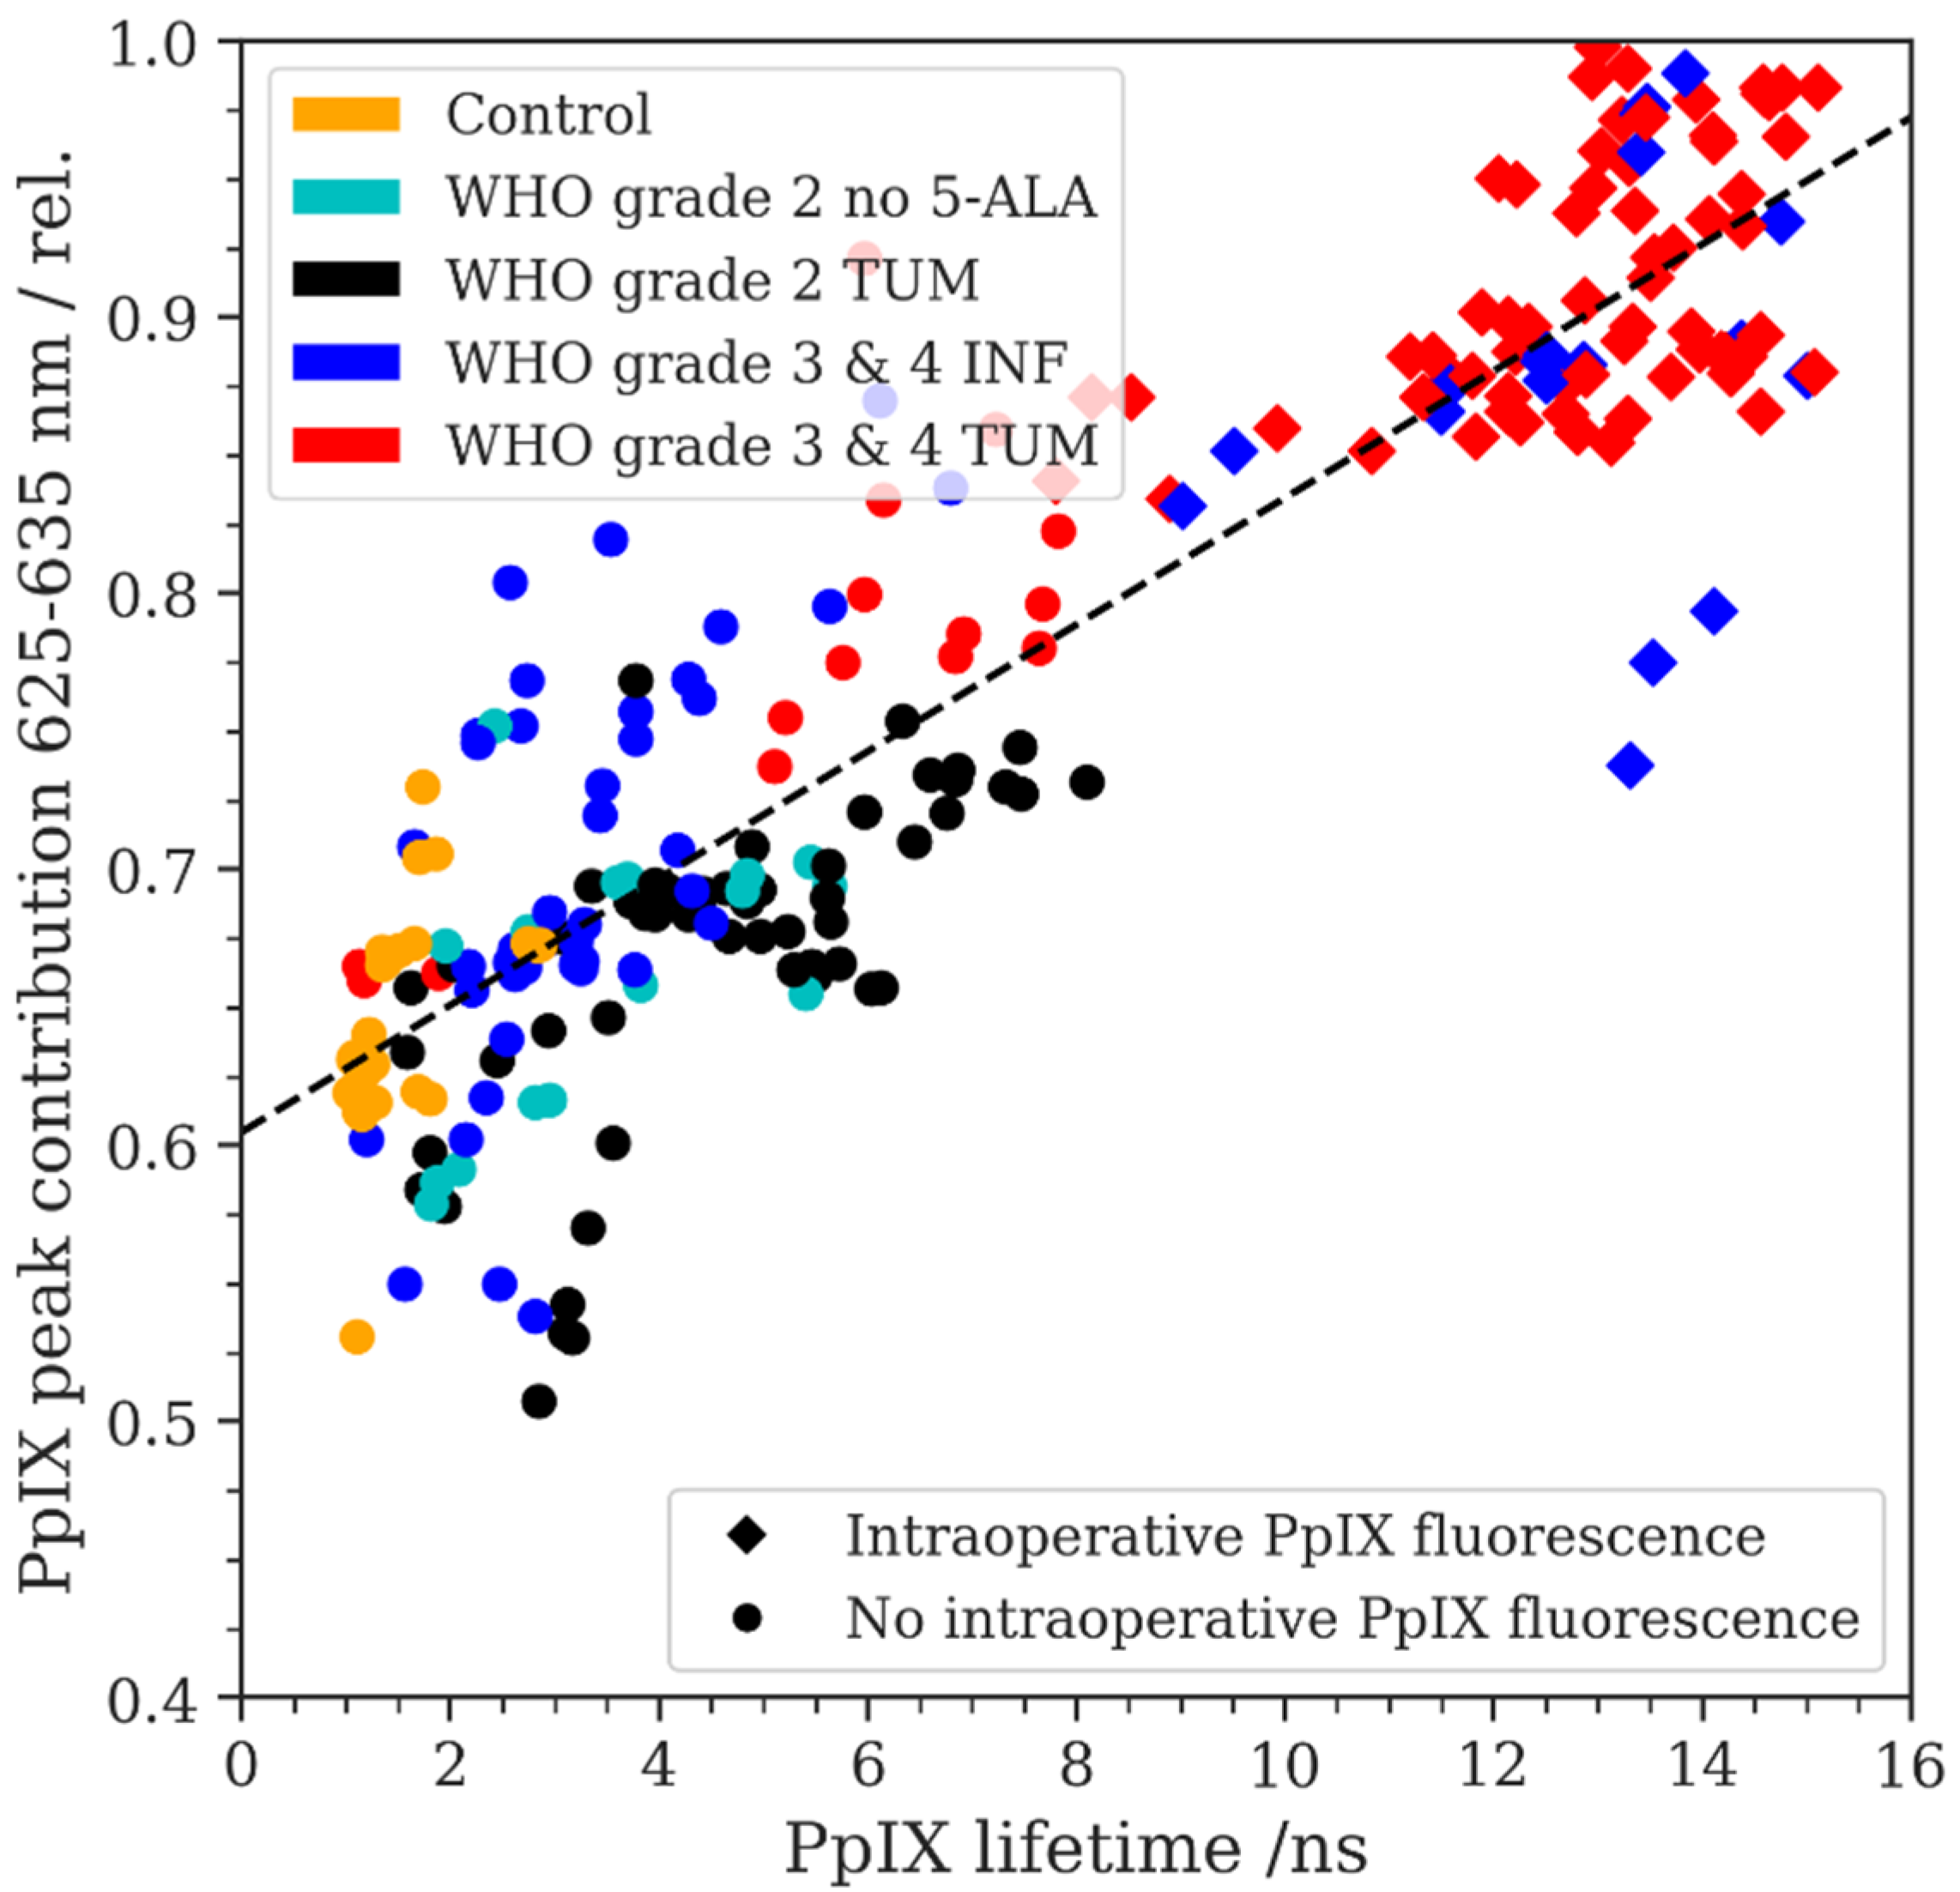
3.5. PpIX Fluorescence Emission Peak Shift and Fluorescence Lifetime
4. Discussion
5. Conclusions
Author Contributions
Funding
Institutional Review Board Statement
Informed Consent Statement
Data Availability Statement
Conflicts of Interest
References
- Stummer, W.; Pichlmeier, U.; Meinel, T.; Wiestler, O.D.; Zanella, F.; Reulen, H.-J. Fluorescence-guided surgery with 5-aminolevulinic acid for resection of malignant glioma: A randomised controlled multicentre phase III trial. Lancet Oncol. 2006, 7, 392–401. [Google Scholar] [CrossRef] [PubMed]
- Yamada, S.; Muragaki, Y.; Maruyama, T.; Komori, T.; Okada, Y. Role of neurochemical navigation with 5-aminolevulinic acid during intraoperative MRI-guided resection of intracranial malignant gliomas. Clin. Neurol. Neurosurg. 2015, 130, 134–139. [Google Scholar] [CrossRef] [PubMed]
- Coburger, J.; Engelke, J.; Scheuerle, A.; Thal, D.R.; Hlavac, M.; Wirtz, C.R.; König, R. Tumor detection with 5-aminolevulinic acid fluorescence and Gd-DTPA–enhanced intraoperative MRI at the border of contrast-enhancing lesions: A prospective study based on histopathological assessment. Neurosurg. Focus 2014, 36, E3. [Google Scholar] [CrossRef] [PubMed]
- Belykh, E.; Shaffer, K.V.; Lin, C.; Byvaltsev, V.A.; Preul, M.C.; Chen, L. Blood-Brain Barrier, Blood-Brain Tumor Barrier, and Fluorescence-Guided Neurosurgical Oncology: Delivering Optical Labels to Brain Tumors. Front. Oncol. 2020, 10, 739. [Google Scholar] [CrossRef] [PubMed]
- Mischkulnig, M.; Kiesel, B.; Lötsch, D.; Roetzer, T.; Borkovec, M.; Wadiura, L.I.; Mercea, P.A.; Jaklin, F.J.; Hervey-Jumper, S.; Roessler, K.; et al. TCGA mrna expression analysis of the heme biosynthesis pathway in diffusely infiltrating gliomas: A comparison of typically 5-ala fluorescent and non-fluorescent gliomas. Cancers 2020, 12, 2043. [Google Scholar] [CrossRef]
- Wadiura, L.I.; Mischkulnig, M.; Hosmann, A.; Borkovec, M.; Kiesel, B.; Rötzer, T.; Mercea, P.A.; Furtner, J.; Hervey-Jumper, S.; Rössler, K.; et al. Influence of Corticosteroids and Antiepileptic Drugs on Visible 5-Aminolevulinic Acid Fluorescence in a Series of Initially Suspected Low-Grade Gliomas Including World Health Organization Grade II, III, and IV Gliomas. World Neurosurg. 2020, 137, e437–e446. [Google Scholar] [CrossRef]
- Ewelt, C.; Floeth, F.W.; Felsberg, J.; Steiger, H.J.; Sabel, M.; Langen, K.-J.; Stoffels, G.; Stummer, W. Finding the anaplastic focus in diffuse gliomas: The value of Gd-DTPA enhanced MRI, FET-PET, and intraoperative, ALA-derived tissue fluorescence. Clin. Neurol. Neurosurg. 2011, 113, 541–547. [Google Scholar] [CrossRef]
- Widhalm, G.; Krssak, M.; Minchev, G.; Wöhrer, A.; Traub-Weidinger, T.; Czech, T.; Asenbaum, S.; Marosi, C.; Knosp, E.; Hainfellner, J.A.; et al. Value of 1H-magnetic resonance spectroscopy chemical shift imaging for detection of anaplastic foci in diffusely infiltrating gliomas with non-significant contrast-enhancement. J. Neurol. Neurosurg. Psychiatry 2011, 82, 512–520. [Google Scholar] [CrossRef]
- Kiesel, B.; Freund, J.; Reichert, D.; Wadiura, L.; Erkkilae, M.T.; Woehrer, A.; Hervey-Jumper, S.; Berger, M.S.; Widhalm, G. 5-ALA in Suspected Low-Grade Gliomas: Current Role, Limitations, and New Approaches. Front. Oncol. 2021, 11, 699301. [Google Scholar] [CrossRef]
- Jaber, M.; Ewelt, C.; Wölfer, J.; Brokinkel, B.; Thomas, C.; Hasselblatt, M.; Grauer, O.; Stummer, W. Is Visible Aminolevulinic Acid-Induced Fluorescence an Independent Biomarker for Prognosis in Histologically Confirmed (World Health Organization 2016) Low-Grade Gliomas? Neurosurgery 2019, 84, 1214–1224. [Google Scholar] [CrossRef]
- Potapov, A.A.; Goryaynov, S.A.; Danilov, G.V.; Chelushkin, D.M.; Okhlopkov, V.A.; Shimanskiy, V.N.; Beshplav, S.T.; Poshataev, V.K.; Shishkina, L.V.; Zakharova, N.E.; et al. Intraoperative fluorescence diagnostics in surgery of intracranial meningiomas: Analysis of 101 cases. Zhurnal Vopr. Neirokhirurgii Im. N. N. Burdenko 2018, 82, 17–29. [Google Scholar] [CrossRef] [PubMed]
- Wadiura, L.I.; Millesi, M.; Makolli, J.; Wais, J.; Kiesel, B.; Mischkulnig, M.; Mercea, P.A.; Roetzer, T.; Knosp, E.; Rössler, K.; et al. High Diagnostic Accuracy of Visible 5-ALA Fluorescence in Meningioma Surgery According to Histopathological Analysis of Tumor Bulk and Peritumoral Tissue. Lasers Surg. Med. 2021, 53, 300–308. [Google Scholar] [CrossRef] [PubMed]
- Marbacher, S.; Klinger, E.; Schwyzer, L.; Fischer, I.; Nevzati, E.; Diepers, M.; Roelcke, U.; Fathi, A.-R.; Coluccia, D.; Fandino, J. Use of fluorescence to guide resection or biopsy of primary brain tumors and brain metastases. Neurosurg. Focus 2014, 36, E10. [Google Scholar] [CrossRef] [PubMed]
- Hadjipanayis, C.G.; Widhalm, G.; Stummer, W. What is the surgical benefit of utilizing 5-aminolevulinic acid for fluorescence-guided surgery of malignant gliomas? Neurosurgery 2015, 77, 663–673. [Google Scholar] [CrossRef]
- Meza, D.; Wang, D.; Wang, Y.; Borwege, S.; Sanai, N.; Liu, J.T.C. Comparing high-resolution microscopy techniques for potential intraoperative use in guiding low-grade glioma resections. Lasers Surg. Med. 2015, 47, 289–295. [Google Scholar] [CrossRef]
- Hosmann, A.; Millesi, M.; Wadiura, L.I.; Kiesel, B.; Mercea, P.A.; Mischkulnig, M.; Borkovec, M.; Furtner, J.; Roetzer, T.; Wolfsberger, S.; et al. 5-ala fluorescence is a powerful prognostic marker during surgery of low-grade gliomas (Who grade ii)—experience at two specialized centers. Cancers 2021, 13, 2540. [Google Scholar] [CrossRef]
- Valdés, P.A.; Jacobs, V.; Harris, B.T.; Wilson, B.C.; Leblond, F.; Paulsen, K.D.; Roberts, D.W. Quantitative fluorescence using 5-aminolevulinic acid-induced protoporphyrin IX biomarker as a surgical adjunct in low-grade glioma surgery. J. Neurosurg. 2015, 123, 771–780. [Google Scholar] [CrossRef]
- Valdés, P.A.; Kim, A.; Leblond, F.; Conde, O.M.; Harris, B.T.; Paulsen, K.D.; Wilson, B.C.; Roberts, D.W. Combined fluorescence and reflectance spectroscopy for in vivo quantification of cancer biomarkers in low- and high-grade glioma surgery. J. Biomed. Opt. 2011, 16, 116007. [Google Scholar] [CrossRef]
- Valdés, P.A.; Jacobs, V.L.; Leblond, F.; Wilson, B.C.; Paulsen, K.D.; Roberts, D.W. Quantitative spectrally resolved intraoperative fluorescence imaging for neurosurgical guidance in brain tumor surgery: Pre-clinical and clinical results. In Proceedings of the SPIE BiOS 2014: Optical Techniques in Neurosurgery, Neurophotonics, and Optogenetics, San Francisco, CA, USA, 1–6 February 2014; p. 892809. [Google Scholar] [CrossRef]
- Erkkilä, M.T.; Bauer, B.; Hecker-Denschlag, N.; Medina, M.J.M.; Leitgeb, R.A.; Unterhuber, A.; Gesperger, J.; Roetzer, T.; Hauger, C.; Drexler, W.; et al. Widefield fluorescence lifetime imaging of protoporphyrin IX for fluorescence-guided neurosurgery: An ex vivo feasibility study. J. Biophotonics 2019, 12, e201800378. [Google Scholar] [CrossRef]
- Nasir-Moin, M.; Wadiura, L.I.; Sacalean, V.; Juros, D.; Movahed-Ezazi, M.; Lock, E.K.; Smith, A.; Lee, M.; Weiss, H.; Müther, M.; et al. Localization of protoporphyrin IX during glioma-resection surgery via paired stimulated Raman histology and fluorescence microscopy. Nat. Biomed. Eng. 2024, 8, 672–688. [Google Scholar] [CrossRef]
- Erkkilä, M.T.; Reichert, D.; Hecker-Denschlag, N.; Wilzbach, M.; Hauger, C.; Leitgeb, R.A.; Gesperger, J.; Kiesel, B.; Roetzer, T.; Widhalm, G.; et al. Surgical microscope with integrated fluorescence lifetime imaging for 5-aminolevulinic acid fluorescence-guided neurosurgery. J. Biomed. Opt. 2020, 25, 071202. [Google Scholar] [CrossRef] [PubMed]
- Reichert, D.; Erkkilae, M.T.; Gesperger, J.; Wadiura, L.I.; Lang, A.; Roetzer, T.; Woehrer, A.; Andreana, M.; Unterhuber, A.; Wilzbach, M.; et al. Fluorescence Lifetime Imaging and Spectroscopic Co-Validation for Protoporphyrin IX-Guided Tumor Visualization in Neurosurgery. Front. Oncol. 2021, 11, 741303. [Google Scholar] [CrossRef] [PubMed]
- Stummer, W.; Stepp, H.; Möller, G.; Ehrhardt, A.; Leonhard, M.; Reulen, H.J. Technical Principles for Protoporphy-rin-IX-Fluorescence Guided Microsurgical Resection of Malignant Glioma Tissue. Acta Neurochir. 1998, 140, 995–1000. [Google Scholar] [CrossRef] [PubMed]
- Alston, L.; Rousseau, D.; Hebert, M.; Mahieu-Williame, L. Nonlinear relation between concentration and fluorescence emission of protoporphyrin IX in calibrated phantoms. J. Biomed. Opt. 2018, 23, 097002. [Google Scholar] [CrossRef] [PubMed]
- Alston, L.; Mahieu-Williame, L.; Hebert, M.; Kantapareddy, P.; Meyronet, D.; Rousseau, D.; Guyotat, J.; Montcel, B. Spectral complexity of 5-ALA induced PpIX fluorescence in guided surgery: A clinical study towards the discrimination of healthy tissue and margin boundaries in high and low grade gliomas. Biomed. Opt. Express 2019, 10, 2478–2492. [Google Scholar] [CrossRef]
- Widhalm, G.; Olson, J.; Weller, J.; Bravo, J.; Han, S.J.; Phillips, J.; Hervey-Jumper, S.L.; Chang, S.M.; Roberts, D.W.; Berger, M.S. The value of visible 5-ALA fluorescence and quantitative protoporphyrin IX analysis for improved surgery of suspected low-grade gliomas. J. Neurosurg. 2019, 133, 79–88. [Google Scholar] [CrossRef]
- Molina, E.S.; Black, D.; Walke, A.; Azemi, G.; D’alessandro, F.; König, S.; Stummer, W. Unraveling the blue shift in porphyrin fluorescence in glioma: The 620 nm peak and its potential significance in tumor biology. Front. Neurosci. 2023, 17, 1261679. [Google Scholar] [CrossRef]
- DeWitt, J.C.; Jordan, J.T.; Frosch, M.P.; Samore, W.R.; Iafrate, A.J.; Louis, D.N.; Lennerz, J.K. Cost-effectiveness of IDH testing in diffuse gliomas according to the 2016 WHO classification of tumors of the central nervous system recommendations. Neuro-Oncology 2017, 19, 1640–1650. [Google Scholar] [CrossRef]
- Louis, D.N.; Perry, A.; Wesseling, P.; Brat, D.J.; Cree, I.A.; Figarella-Branger, D.; Hawkins, C.; Ng, H.K.; Pfister, S.M.; Reifenberger, G.; et al. The 2021 WHO Classification of Tumors of the Central Nervous System: A summary. Neuro-Oncology 2021, 23, 1231–1251. [Google Scholar] [CrossRef]
- Louis, D.N.; Perry, A.; Reifenberger, G.; Von Deimling, A.; Figarella-Branger, D.; Cavenee, W.K.; Ohgaki, H.; Wiestler, O.D.; Kleihues, P.; Ellison, D.W. The 2016 World Health Organization Classification of Tumors of the Central Nervous System: A summary. Acta Neuropathol. 2016, 131, 803–820. [Google Scholar] [CrossRef]
- Black, P.M.; Alexander, E.; Martin, C.; Moriarty, T.; Nabavi, A.; Wong, T.Z.; Schwartz, R.B.; Jolesz, F. Craniotomy for Tumor Treatment in an Intraoperative Magnetic Resonance Imaging Unit. Neurosurgery 1999, 45, 423–433. [Google Scholar] [CrossRef] [PubMed]
- Mert, A.; Gan, L.S.; Knosp, E.; Sutherland, G.R.; Wolfsberger, S. Advanced Cranial Navigation. Neurosurgery 2013, 72 (Suppl. S1), A43–A53. [Google Scholar] [CrossRef] [PubMed]
- Falco, J.; Cavallo, C.; Vetrano, I.G.; de Laurentis, C.; Siozos, L.; Schiariti, M.; Broggi, M.; Ferroli, P.; Acerbi, F. Fluorescein Application in Cranial and Spinal Tumors Enhancing at Preoperative MRI and Operated with a Dedicated Filter on the Surgical Microscope: Preliminary Results in 279 Patients Enrolled in the FLUOCERTUM Prospective Study. Front. Surg. 2019, 6, 49. [Google Scholar] [CrossRef] [PubMed]
- Cho, S.S.; Salinas, R.; Lee, J.Y.K. Indocyanine-green for fluorescence-guided surgery of brain tumors: Evidence, techniques, and practical experience. Front. Surg. 2019, 6, 11. [Google Scholar] [CrossRef] [PubMed]
- Acerbi, F.; Broggi, M.; Schebesch, K.-M.; Höhne, J.; Cavallo, C.; De Laurentis, C.; Eoli, M.; Anghileri, E.; Servida, M.; Boffano, C.; et al. Fluorescein-guided surgery for resection of high-grade gliomas: A multicentric prospective phase II study (FLUOGLIO). Clin. Cancer Res. 2018, 24, 52–61. [Google Scholar] [CrossRef]
- Wadiura, L.I.; Reichert, D.; Sperl, V.; Lang, A.; Kiesel, B.; Erkkilae, M.; Woehrer, A.; Furtner, J.; Roetzer, T.; Leitgeb, R.; et al. Influence of dexamethasone on visible 5-ALA fluroescence and quantitative PpIX accumulation measured by fluorescence lifetime imaging in glioblastomas: Is pretreatment obligatory before fluorescence-guided surgery? J. Neurosurg. 2021, 136, 1542–1550. [Google Scholar] [CrossRef]
- Valdes, P.A.; Bekelis, K.; Harris, B.T.; Wilson, B.C.; Leblond, F.; Kim, A.; Simmons, N.E.; Erkmen, K.; Paulsen, K.D.; Roberts, D.W. 5-Aminolevulinic acid-induced protoporphyrin IX fluorescence in meningioma: Qualitative and quantita-tive measurements in Vivo. Oper. Neurosurg. 2014, 10, 74–83. [Google Scholar] [CrossRef]
- Montcel, B.; Mahieu-Williame, L.; Armoiry, X.; Meyronet, D.; Guyotat, J. Two-peaked 5-ALA-induced PpIX fluorescence emission spectrum distinguishes glioblastomas from low grade gliomas and infiltrative component of glioblastomas. Biomed. Opt. Express 2013, 4, 548–558. [Google Scholar] [CrossRef]
- Montcel, B.; Mahieu-Williame, L.; Armoiry, X.; Meyronet, D.; Guyotat, J. 5-ALA-induced PpIX fluorescence emission spectrum in low grade gliomas and in the infiltrative component of glioblastomas. In Proceedings of the European Conference on Biomedical Optics (ECBO), Miami, FL, USA, 26–30 April 2014. [Google Scholar] [CrossRef]
- Yeh, S.-C.A.; Patterson, M.S.; Hayward, J.E.; Fang, Q. Time-resolved fluorescence in photodynamic therapy. Photonics 2014, 1, 530–564. [Google Scholar] [CrossRef]
- Croce, A.; Bottiroli, G. Autofluorescence spectroscopy and imaging: A tool for biomedical research and diagnosis. Eur. J. Histochem. 2014, 58, 2461. [Google Scholar] [CrossRef]
- Croney, J.C.; Helms, M.K.; Jameson, D.M.; Larsen, R.W. Conformational dynamics and temperature dependence of photoinduced electron transfer within self-assembled coproporphyrin:Cytochrome c complexes. Biophys. J. 2003, 84, 4135–4143. [Google Scholar] [CrossRef] [PubMed]
- Black, D.; Kaneko, S.; Walke, A.; König, S.; Stummer, W.; Molina, E.S. Characterization of autofluorescence and quantitative protoporphyrin IX biomarkers for optical spectroscopy-guided glioma surgery. Sci. Rep. 2021, 11, 20009. [Google Scholar] [CrossRef] [PubMed]

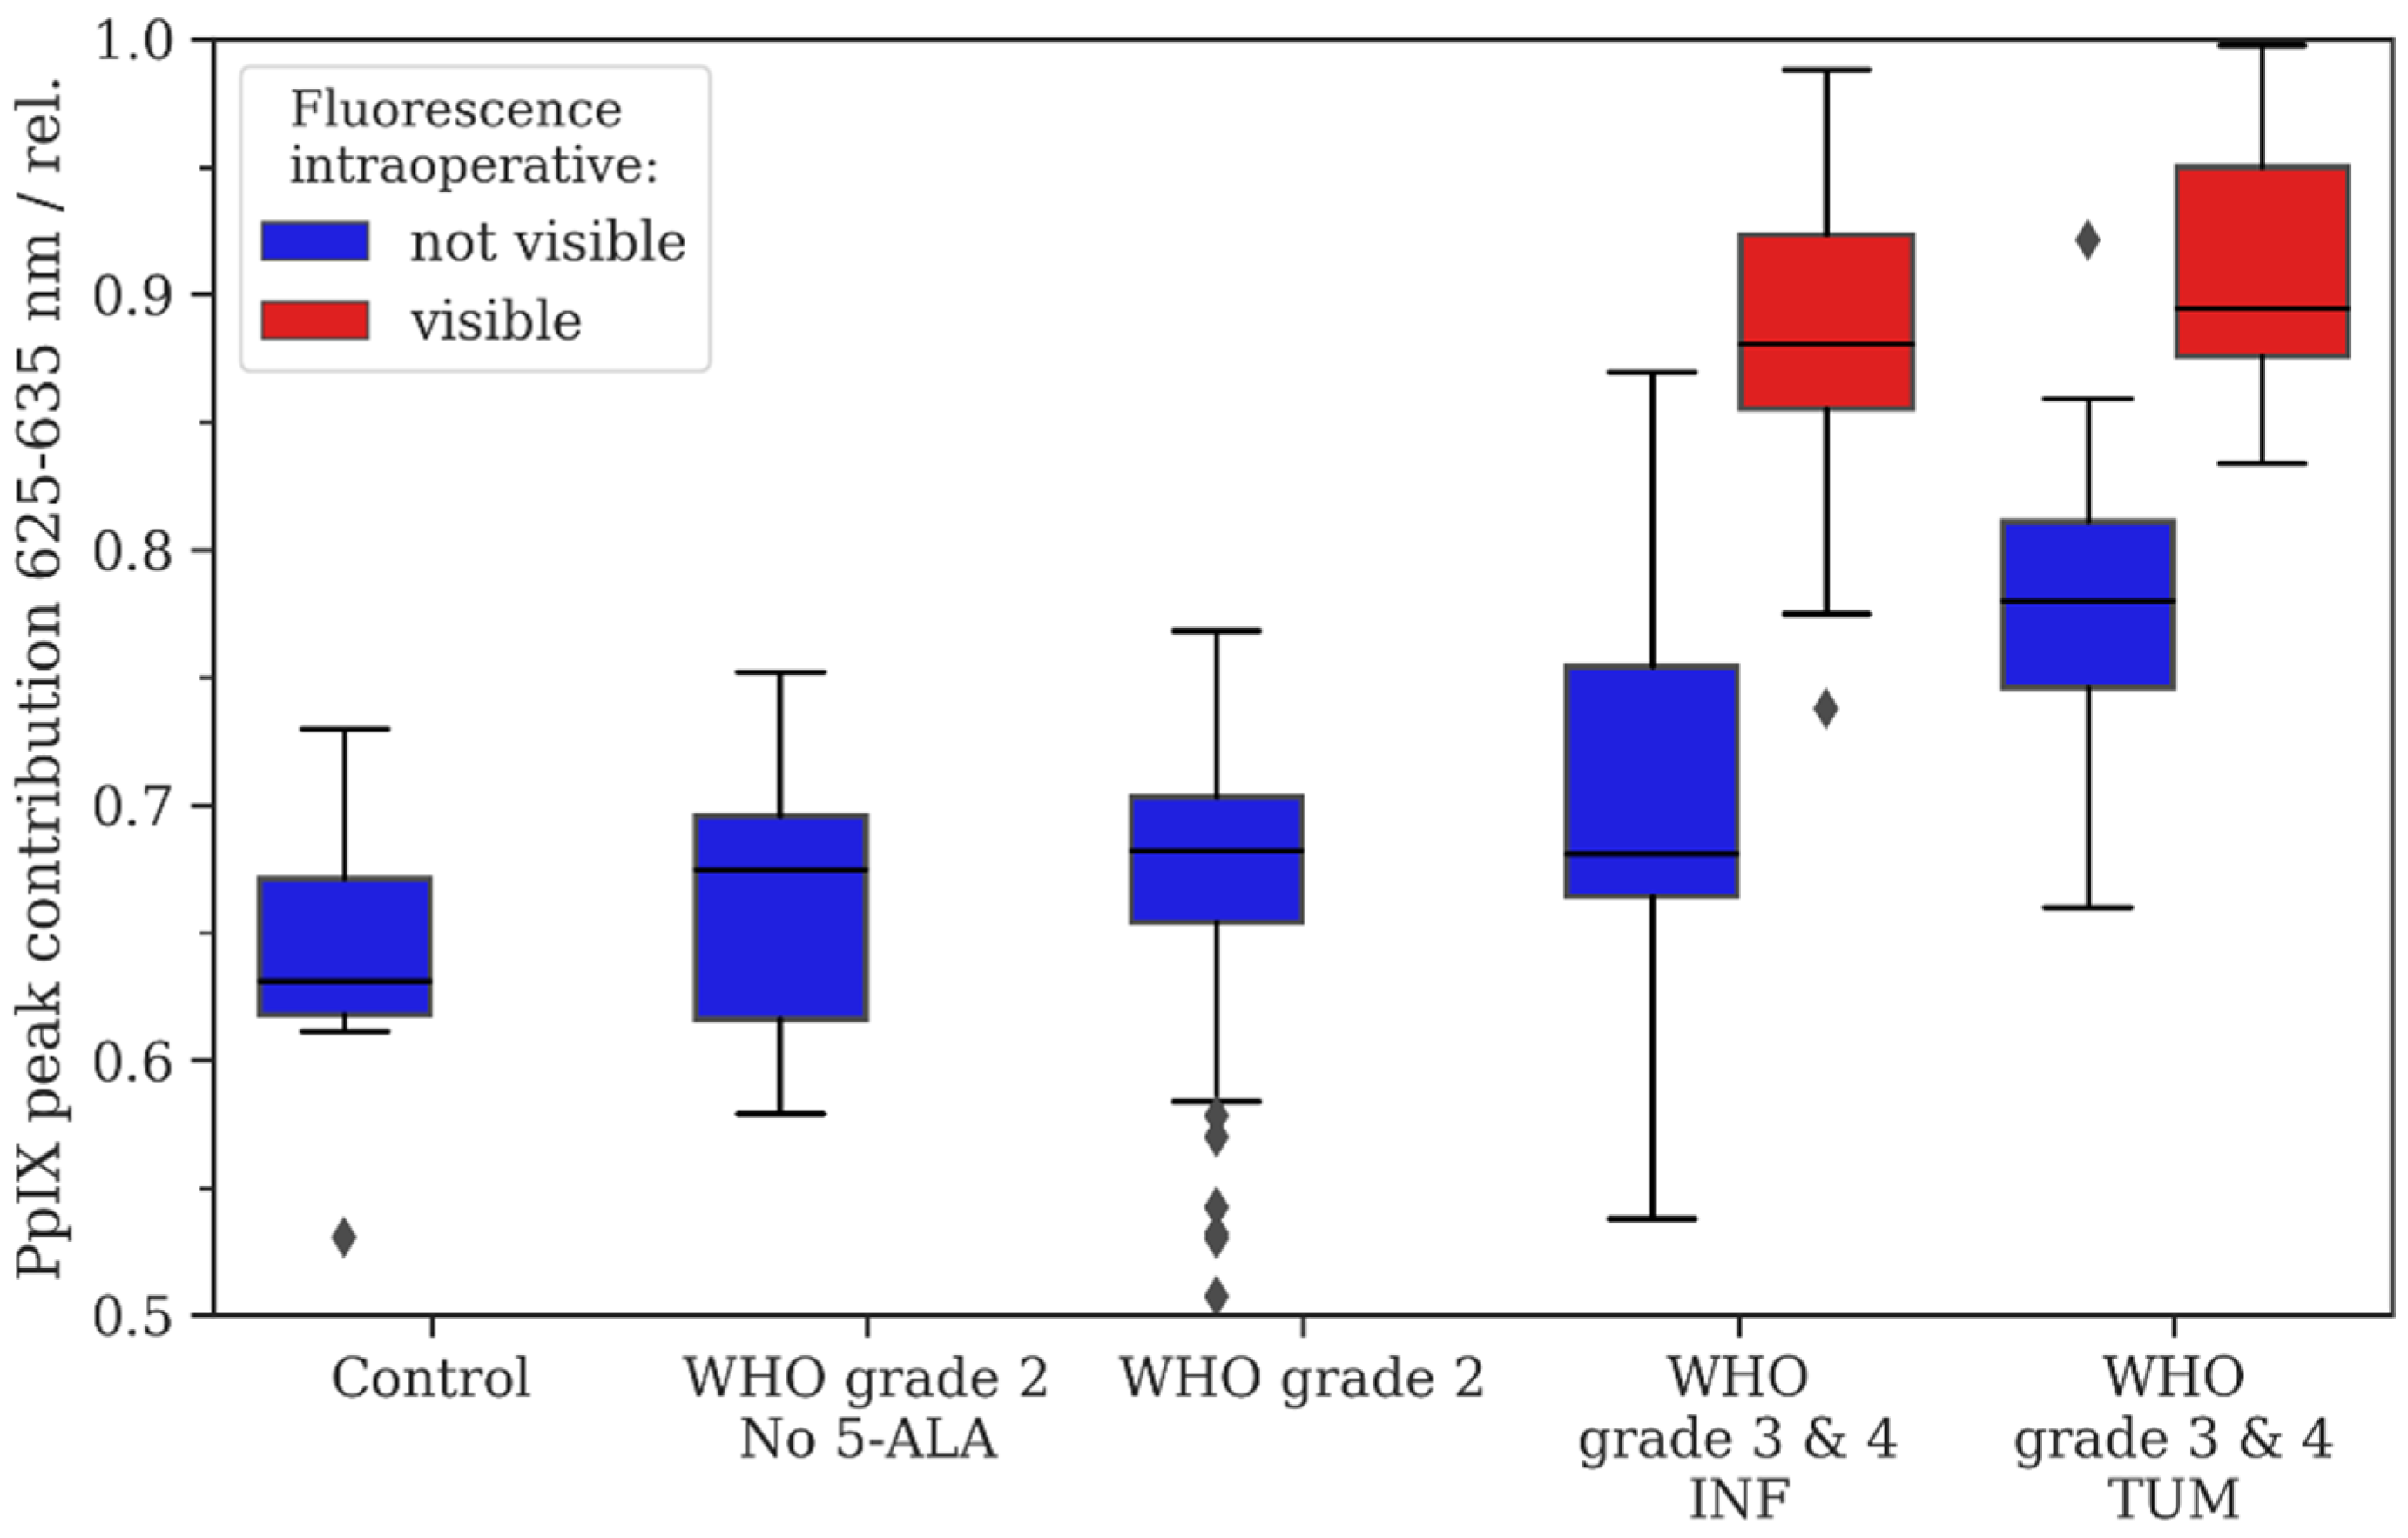
| Control | WHO Grade 2 No 5-ALA | WHO Grade 2 with 5-ALA | WHO Grade 3/4 INF | WHO Grade 3/4 TUM | |||
|---|---|---|---|---|---|---|---|
| Intraoperative fluorescence-status | not visible | not visible | not visible | not visible | visible | not visible | visible |
| N samples | 6 | 5 | 13 | 18 | 27 | ||
| N regions of interest (ROI) | 27 | 16 | 52 | 43 | 18 | 15 | 65 |
| Mean | 0.64 | 0.66 | 0.67 | 0.71 | 0.88 | 0.78 | 0.91 |
| Median | 0.63 | 0.68 | 0.68 | 0.68 | 0.88 | 0.78 | 0.89 |
| 0.25 quartile | 0.62 | 0.62 | 0.65 | 0.66 | 0.86 | 0.75 | 0.88 |
| 0.75 quartile | 0.67 | 0.7 | 0.7 | 0.75 | 0.92 | 0.81 | 0.95 |
| p-value | - | p = 0.193 | p = 0.007 | p = 0.001 | p = < 0.001 | p = < 0.001 | p = < 0.001 |
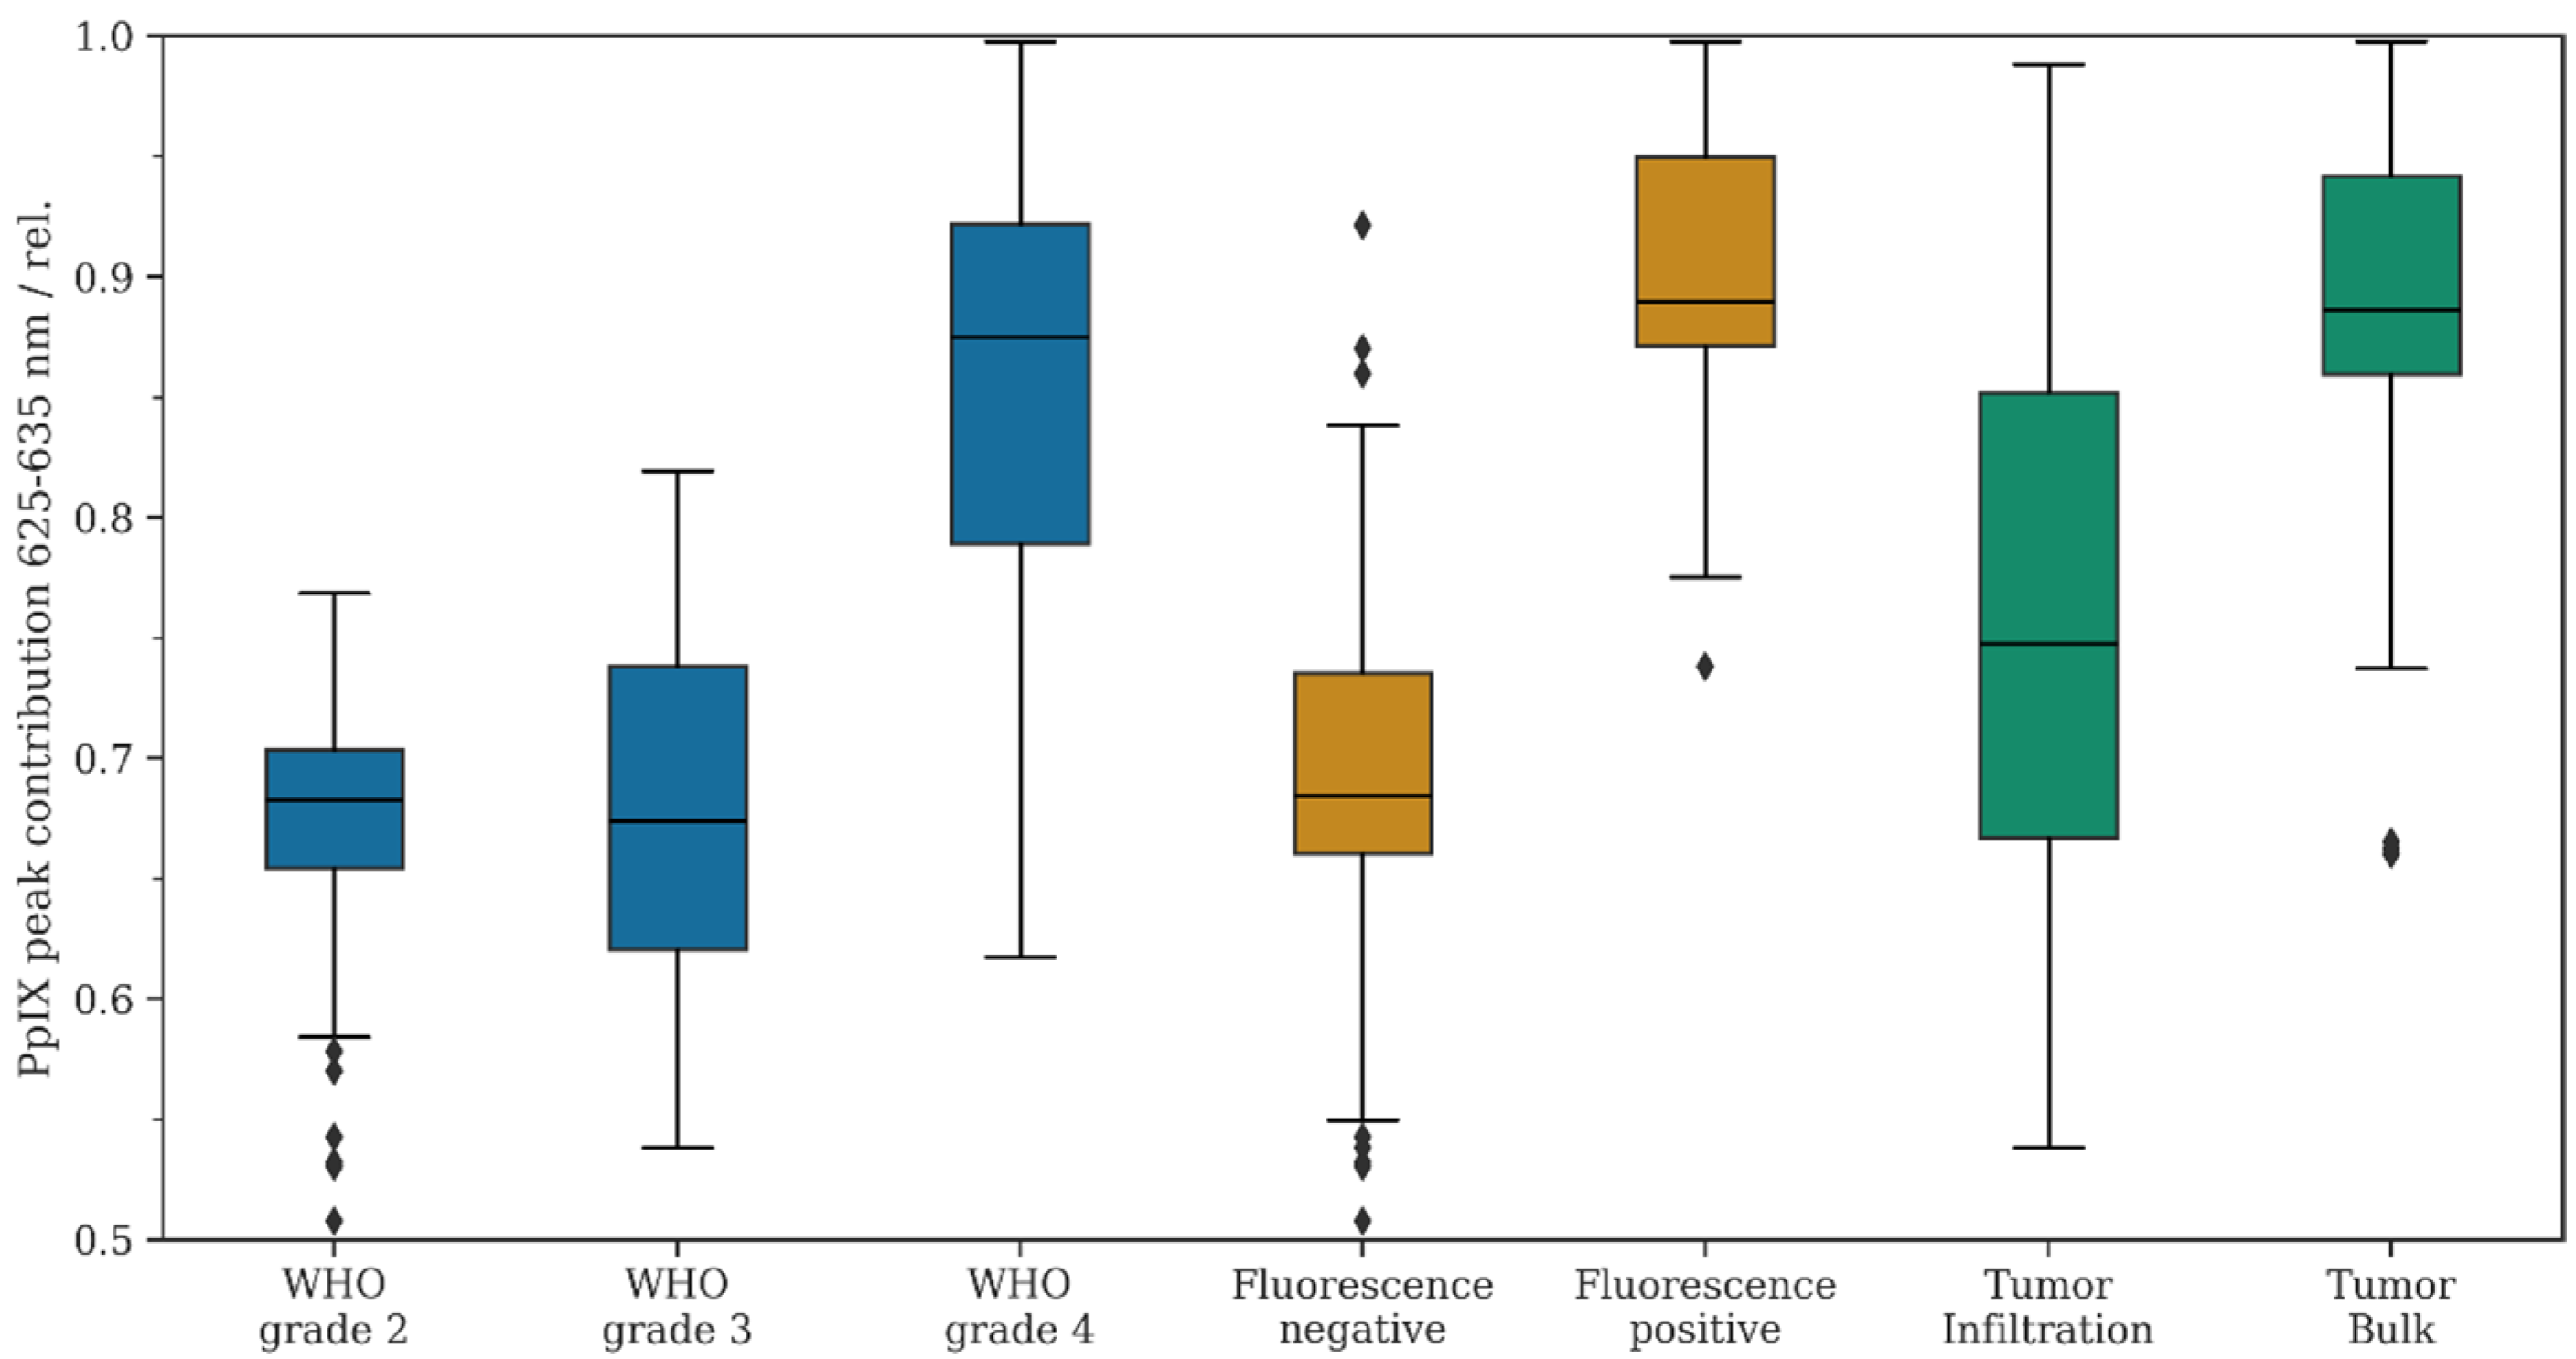
| WHO Grade 2 | WHO Grade 3 | WHO Grade 4 | Fluorescence Negative | Fluorescence Positive | Tumor Infiltration | Tumor Bulk | |
|---|---|---|---|---|---|---|---|
| N ROI | 52 | 19 | 122 | 126 | 83 | 61 | 80 |
| Mean | 0.67 | 0.70 | 0.85 | 0.69 | 0.90 | 0.76 | 0.89 |
| Median | 0.68 | 0.67 | 0.88 | 0.68 | 0.89 | 0.75 | 0.89 |
| 0.25 quartile | 0.65 | 0.62 | 0.79 | 0.66 | 0.87 | 0.67 | 0.86 |
| 0.75 quartile | 0.70 | 0.74 | 0.92 | 0.73 | 0.95 | 0.85 | 0.94 |
| p-value | WHO grade 2 vs. 4: p = < 0.001 | WHO grade 3 vs. grade 2: p = 0.365 | WHO grade 4 vs. 3: p = < 0.001 | - | Pos. vs. neg. p = < 0.001 | - | Bulk vs. Inf. p = < 0.001 |
Disclaimer/Publisher’s Note: The statements, opinions and data contained in all publications are solely those of the individual author(s) and contributor(s) and not of MDPI and/or the editor(s). MDPI and/or the editor(s) disclaim responsibility for any injury to people or property resulting from any ideas, methods, instructions or products referred to in the content. |
© 2024 by the authors. Licensee MDPI, Basel, Switzerland. This article is an open access article distributed under the terms and conditions of the Creative Commons Attribution (CC BY) license (https://creativecommons.org/licenses/by/4.0/).
Share and Cite
Körner, L.I.; Reichert, D.; Andreana, M.; Unterhuber, A.; Erkkilae, M.T.; Makolli, J.; Kiesel, B.; Mischkulnig, M.; Rötzer-Pejrimovsky, T.; Wöhrer, A.; et al. Analysis of the Porphyrin Peak Shift and Fluorescence Lifetime in Gliomas with Different Tumor Grades, Intratumoral Regions, and Visible Fluorescence Status. Diagnostics 2024, 14, 2651. https://doi.org/10.3390/diagnostics14232651
Körner LI, Reichert D, Andreana M, Unterhuber A, Erkkilae MT, Makolli J, Kiesel B, Mischkulnig M, Rötzer-Pejrimovsky T, Wöhrer A, et al. Analysis of the Porphyrin Peak Shift and Fluorescence Lifetime in Gliomas with Different Tumor Grades, Intratumoral Regions, and Visible Fluorescence Status. Diagnostics. 2024; 14(23):2651. https://doi.org/10.3390/diagnostics14232651
Chicago/Turabian StyleKörner, Lisa Irina, David Reichert, Marco Andreana, Angelika Unterhuber, Mikael T. Erkkilae, Jessica Makolli, Barbara Kiesel, Mario Mischkulnig, Thomas Rötzer-Pejrimovsky, Adelheid Wöhrer, and et al. 2024. "Analysis of the Porphyrin Peak Shift and Fluorescence Lifetime in Gliomas with Different Tumor Grades, Intratumoral Regions, and Visible Fluorescence Status" Diagnostics 14, no. 23: 2651. https://doi.org/10.3390/diagnostics14232651
APA StyleKörner, L. I., Reichert, D., Andreana, M., Unterhuber, A., Erkkilae, M. T., Makolli, J., Kiesel, B., Mischkulnig, M., Rötzer-Pejrimovsky, T., Wöhrer, A., Berger, M. S., Leitgeb, R., & Widhalm, G. (2024). Analysis of the Porphyrin Peak Shift and Fluorescence Lifetime in Gliomas with Different Tumor Grades, Intratumoral Regions, and Visible Fluorescence Status. Diagnostics, 14(23), 2651. https://doi.org/10.3390/diagnostics14232651