Article

Mathematical Modelling of Cervical Precancerous Lesion Grade Risk Scores: Linear Regression Analysis of Cellular Protein Biomarkers and Human Papillomavirus E6/E7 RNA Staining Patterns

by
Sureewan Bumrungthai
1,2,3,
Tipaya Ekalaksananan
3,4,
Pilaiwan Kleebkaow
5,
Khajohnsilp Pongsawatkul
6,
Pisit Phatnithikul
7,
Jirad Jaikan
7,
Puntanee Raumsuk
7,
Sureewan Duangjit
8,
Datchani Chuenchai
2 and
Chamsai Pientong
3,4,*
1
Division of Biopharmacy, Faculty of Pharmaceutical Sciences, Ubon Ratchathani University, Ubon Ratchathani 34190, Thailand
2
Division of Microbiology and Parasitology, School of Medical Sciences, University of Phayao, Phayao 56000, Thailand
3
HPV & EBV and Carcinogenesis Research Group, Khon Kaen University, Khon Kaen 40002, Thailand
4
Department of Microbiology, Faculty of Medicine, Khon Kaen University, Khon Kaen 40002, Thailand
5
Department of Obstetrics and Gynecology, Faculty of Medicine, Khon Kaen University, Khon Kaen 40002, Thailand
6
Department of Social Medicine, Phayao Hospital, Phayao 56000, Thailand
7
Department of Cytopathology, Phayao Hospital, Phayao 56000, Thailand
8
Division of Pharmaceutical Chemistry and Technology, Faculty of Pharmaceutical Sciences, Ubon Ratchathani University, Ubon Ratchathani 34190, Thailand
*
Author to whom correspondence should be addressed.
Diagnostics 2023, 13(6), 1084; https://doi.org/10.3390/diagnostics13061084
Submission received: 23 December 2022 / Revised: 1 March 2023 / Accepted: 9 March 2023 / Published: 13 March 2023
(This article belongs to the Section Machine Learning and Artificial Intelligence in Diagnostics)

Abstract

:
The current practice of determining histologic grade with a single molecular biomarker can facilitate differential diagnosis but cannot predict the risk of lesion progression. Cancer is caused by complex mechanisms, and no single biomarker can both make accurate diagnoses and predict progression risk. Modelling using multiple biomarkers can be used to derive scores for risk prediction. Mathematical models (MMs) may be capable of making predictions from biomarker data. Therefore, this study aimed to develop MM–based scores for predicting the risk of precancerous cervical lesion progression and identifying precancerous lesions in patients in northern Thailand by evaluating the expression of multiple biomarkers. The MMs (Models 1–5) were developed in the test sample set based on patient age range (five categories) and biomarker levels (cortactin, p16INK4A, and Ki–67 by immunohistochemistry [IHC], and HPV E6/E7 ribonucleic acid (RNA) by in situ hybridization [ISH]). The risk scores for the prediction of cervical lesion progression (“risk biomolecules”) ranged from 2.56–2.60 in the normal and low–grade squamous intraepithelial lesion (LSIL) cases and from 3.54–3.62 in cases where precancerous lesions were predicted to progress. In Model 4, 23/86 (26.7%) normal and LSIL cases had biomolecule levels that suggested a risk of progression, while 5/86 (5.8%) cases were identified as precancerous lesions. Additionally, histologic grading with a single molecular biomarker did not identify 23 cases with risk, preventing close patient monitoring. These results suggest that biomarker level–based risk scores are useful for predicting the risk of cervical lesion progression and identifying precancerous lesion development. This multiple biomarker–based strategy may ultimately have utility for predicting cancer progression in other contexts.

1. Introduction

Almost all cervical cancers and their precursor lesions, including squamous intraepithelial lesions (SIL) and cervical intraepithelial neoplasia (CIN), are caused by persistent infection with high–risk (HR) human papillomavirus (HPV) genotypes [1,2,3,4,5]. Cytopathology reveals metaplastic cervical epithelium in approximately 20–30% of HPV–infected patients, but these features generally resolve spontaneously within one year after HPV infections [6]. In the history model of HPV–driven cervical carcinogenesis, abnormal cells gradually grow, progress to precursor lesions (i.e., CIN 3, approximating carcinoma in situ), and invade [6,7]. It is estimated that over 70% of women worldwide will be infected with HPV during their lifetime [8]. However, infections persist in fewer than 10% of women, who then experience an increased risk of developing carcinomas in situ [1,2,3]. These carcinomas gradually grow into large precancerous lesions that have a 30–50% risk of invasion over the remainder of a woman’s life [9]. Among HR–HPV genotypes, HPV16 and HPV18 confer the highest risk of carcinoma in situ and of invasive cancer [10]. Various biomarkers can predict a small proportion of HPV infections associated with carcinoma in situ. For example, an increased expression of the viral oncogenes E6 and E7, which interfere with cell cycle control and apoptosis and induce chromosomal instability [11], is a hallmark of the transition from acute infection to carcinoma in situ. These oncoproteins also induce abnormal chromosome copy numbers and microRNA expression. Techniques for detecting HR–HPV E6/E7 ribonucleic acid (RNA) have been developed; their sensitivity and specificity for detecting CIN 2 have been reported to be 71.4% and 75.8%, respectively [12,13,14,15,16]. Detection of E6/E7 RNA may be more useful than HR–HPV DNA testing for diagnosing CIN 2+ and predicting disease progression [17]. Real–time multiplex nucleic acid sequence-based assays (e.g., the NucliSENS EasyQ HPV assay) show that HPV E6/E7 RNA testing has a specificity of 50% and a positive predictive value (PPV) of 62% for CIN 2+, both of which are higher than the corresponding values for HPV DNA testing (specificity of 18% and PPV of 52%). The higher specificity and PPV of HPV E6/E7 RNA testing are valuable in predicting insignificant HPV DNA infection among cases with borderline cytological findings [18]. Moreover, droplet digital PCR is more sensitive than real-time PCR for detecting HPV DNA and RNA [19,20]. Transcriptionally active HR-HPV in patients with head and neck squamous cell carcinoma (HNSCC) was previously visualized using a novel E6/E7 RNA in situ hybridization (ISH) method [21,22]. Additionally, chromogenic ISH and p16INK4A/Ki–67 dual immunohistochemical staining on formalin-fixed paraffin-embedded (FFPE) cervical specimens correlated with E6/E7 RNA expression [23]. Therefore, the detection of HPV E6/E7 RNA, combined with human protein biomarker assays, may facilitate the diagnosis of abnormal cervical lesions and predict their progression.
In developed countries, molecular techniques for HPV DNA detection (e.g., Hybrid Capture® 2) are combined with assays for host protein biomarkers, such as p16INK4A and Ki–67, for the early detection of abnormal cervical lesions and the prediction of lesion grades; p16INK4A is a surrogate biomarker for HPV in women with invasive cervical cancer, and its expression is highly associated with pathological grading [24,25]. The histologic evaluation of p16INK4A and Ki–67 improves diagnostic accuracy [26]; dual staining was introduced mainly to increase the reproducibility and specificity of stand–alone p16INK4A staining. Regardless of HPV status, diffuse p16INK4A immunostaining is a hallmark of high-grade squamous intraepithelial lesions [27] and is an efficient screening tool [28]. Several candidate biomarkers and combinations thereof are being explored to predict the transition step [29]. However, which biomarkers should be used clinically remains unknown. At present, many clinicians and researchers continue to rely on traditional histological gradations—CIN 1, CIN 2, and CIN 3 (including carcinoma in situ); however, this approach is limited by subjectivity and poor reproducibility, especially in diagnosing CIN 1 and CIN 2 [30]. The accuracy of histopathological diagnosis is also limited by the tendency of colposcopic biopsies to miss small CIN 3 lesions almost 50% of the time [31]. Discovering biomarkers to clarify the risk of progression in the pathogenesis of cervical cancer is a major goal [32].
A preliminary study by our group found that the expression of HR-HPV E6/E7 RNA is positively associated with the expression of cortactin. The CTTN gene, which encodes cortactin (the “cortical actin-binding protein”) is located on chromosome 11q13. Cortactin recruits Arp2/3 complex proteins and binds to actin microfilaments. It also promotes lamellipodia and invadopodia formation, cell migration, endocytosis, cell mortality, and tumor invasiveness [33,34]. Cortactin is overexpressed in many cancers [35,36] at high risk of invasiveness and metastasis, including hepatocellular carcinoma [37], colorectal cancer, glioblastoma, HNSCC, oral squamous cell carcinoma, lung squamous cell carcinoma, gliosarcoma, breast cancer, and melanoma [35]. Amplification of the CTTN gene and the resulting overexpression of cortactin have been observed in 15% of primary metastatic breast carcinomas and nearly 30% of HNSCCs [33,38]. Cortactin may also be associated with E6/E7 RNA in HR-HPV-associated cervical cancer and is a potential diagnostic biomarker studied by our group. Furthermore, the majority of these highly sensitive techniques have not yet been introduced to clinical practice.
Over the last two decades, a variety of machine learning techniques and feature selection algorithms have been widely applied to determine disease prognosis and predict certain conditions [39]. These techniques are used in conjunction with logistic regression models to assess the importance of various genes. After important genes are identified, the same logistic regression model is then used for cancer classification and risk prediction [39]. Several prediction models are currently widely used in clinical practice, including the model for breast cancer incidence [40,41] and the predictive risk-scoring model for central lymph node metastasis [42]. The prediction model for breast cancer recurrence can be viewed at https://breast.predict.nhs.uk/predict.html (accessed on 8 March 2023). Mathematical models (MMs) are also used to determine the likelihood of relapse and predict responses to chemotherapy among patients with breast cancer [43], as well as to diagnose precancerous cervical lesions and predict progression [44,45].
In the comparison between histopathological method and modelling using multiple biomarkers, this study showed more advantages that can be used to derive scores for risk prediction, not only for the diagnosis of cervical lesion from similar biopsy samples. However, the current practice of histologic grading or using a single molecular biomarker can facilitate differential diagnosis.
Our study investigated the expression of cortactin in FFPE cervical specimens with diverse lesion grades in combination with other related biomarkers. Biomarkers p16INK4A and Ki–67 were used as protein biomarker controls during immunohistochemical (IHC) staining. HPV E6/E7 RNA ISH was also used. The relationship between IHC staining and ISH data was evaluated in association with clinical characteristics, and MMs were developed to estimate risk scores using linear regression analysis. Receiver operating characteristic (ROC) curves and areas under the curve (AUC) were used to identify the best MMs. Risk scores from the model were then used to predict the risk of abnormal or precancerous cervical lesion progression and may have utility in other cancer contexts in the future.

2. Materials and Methods

2.1. Specimens

Three hundred and sixty-three FFPE cervical tissue samples were collected from women who underwent routine cervical cancer testing with a colposcopy at Phayao Hospital, Phayao, Thailand in 2012 (233 samples) and 2013 (130 samples). This work was approved by the Human Research Ethics Committee of the University of Phayao (2/015/59) and Phayao Hospital (HE–59–02–0008). The sample size was calculated according to the known prevalence of HPV in the community as follows: N (case/age group) = Z21−a P(1 − P)/d2″. The required number of participants was calculated from a mean ± SD of 52.9 ± 32.1% of HPV prevalence, a Z of 1.96 for the 95% confidence level, and a d of 0.05 [46].
All FFPE cervical tissues were reviewed by two pathologists, and the following histopathological grades were assigned: normal (211 cases), low-grade squamous intraepithelial lesion (LSIL; 65 cases), HSIL (58 cases), and invasive cervical cancer (squamous cell carcinoma [SCC]; 29 cases). The 233 samples collected in 2012 were defined as the “test sample set” and the 130 samples collected in 2013 as the “confirmed sample set” (Table 1). The test sample set was used to develop the MM using a linear regression model, and the confirmed sample set was used to test the regression model.

2.2. Tissue Microarray (TMA) Preparation

The selected areas of the FFPE cervical tissues were stained with hematoxylin and eosin and graded by a pathologist according to the World Health Organization criteria. Paraffin tissue blocks were made by removing 1.5 mm cores of the tissues and organized into TMAs (Arraymold, Salt Lake City, UT, USA).

2.3. HR-HPV E6/E7 RNA Chromogenic ISH

E6/E7 RNA chromogenic ISH was performed using the RNAscope 2.5 HD Detection Kit (BROWN) and Quick Guide for FFPE Tissues (Advanced Cell Diagnostics, Hayward, CA, USA) with specific combinations of E6 or E7 probes to detect 18 different HR-HPV types when low copy target gene expression was anticipated (1–20 copies per cell). The FFPE sections (5 µm) were de–paraffinized through xylene and ethanol washes and treated as follows: pre–treatment 1 (endogenous hydrogen peroxide block solution) for 10 min at RT; pre–treatment 2 for 45 min at 105 °C; and pre–treatment 3 (protease digestion) for 30 min at 40 °C. After the treatments, the sections were rinsed with water. The tissues were hybridized in a hybridization solution with E6/E7 RNA chromogenic ISH probes in a moist chamber and without a cover slip for 2–3 h at 40 °C. Thereafter, the hybridized probe’s signal was amplified through the serial application of Amp 1 (pre–amplifier step), Amp 2 (signal enhancer step), Amp 3 (amplifier step), Amp 4 (label probe step), Amp 5, and Amp 6 (signal amplification steps); this was followed by the washing steps. Horseradish peroxidase (HRP) activity was then evaluated through the application of 3, 3′–diaminobenzidine (DAB) for 10 min at RT. The sections were then counterstained with hematoxylin, cleared in xylene, and mounted with Permount. The expression signal data were recorded according to negative and positive staining. The internal controls used for the RNAscope chromogenic ISH were proprietary probes for human sequence ubiquitin C (positive control to demonstrate detectable RNA in the FFPE samples) and Bacillus subtilis (B. subtilis) dapB RNA targets (negative control). Ubiquitin C staining was scored to confirm the presence of the signal and its intensity. B. subtilis dapB staining was reviewed to confirm the absence of staining.

2.4. IHC Staining

IHC staining was performed on the TMAs to determine the expression of cortactin, p16INK4A, and Ki–67. Briefly, following de–paraffinization and re–hydration, the tissue sections on the slides were antigen-retrieved using a target retrieval solution (citrate buffer, pH 6.0) at 105 °C in an autoclave for 30 min. Rabbit monoclonal anti–cortactin antibody clone Ep1922Y (Abcam, Cambridge, MA, USA), mouse monoclonal anti–human p16INK4A clone D25 (EMD Millipore Corporation, Temecula, CA, USA), and Ki–67 monoclonal antibody clone 20Raj1 (eBioscienceTM, Thermo Fisher Scientific, San Diego, CA, USA) were applied at dilutions of 1:200, 1:100, and 1:100, respectively, in 1× phosphate-buffered saline for 60 min. This was followed by incubation with secondary detection antibodies using the Genemed Power–StainTM 1.0 Poly HRP DAB Kit for Mouse + Rabbit (Sakura Finetek, Torrance, CA, USA). Immunostaining results were evaluated using light microscopy with a 40× objective, and both Allred score (AS; score and intensity of staining) and positive/negative status were recorded.
IHC staining patterns were scored in reference to the proportion of cells that stained: 0 = negative; 1 = rarely positive (<1%); 2 = focally positive (1–25%); 3 = variably positive (25–75%); and 4 = uniformly positive (>75%). In terms of the staining intensity, the IHC staining patterns were scored as follows: 0 = negative; 1 = weakly positive; 2 = moderately positive; and 3 = strongly positive. These scores were added to achieve an Allred scored (AS) ranging from 0 to 7 [47].
The criteria for distinguishing positive and negative IHC statuses are shown in Table 2.

2.5. Mathematical Models (MM) and Risk Score Development

A linear regression model in SPSS version 16 was used to develop the MMs for the expected cervical lesion grade. The model stepwise was Y = β0 + β1 X1 + β2 X2 + β3 X3 + … + βn Xn [48,49,50]. Y is the dependent variable, where 1 represents a normal value and 3, 4, and 5 represent LSIL, HSIL, and SCC, respectively. The independent variables (X, X1, X2, X3…Xn) consisted of the five age groups (groups 1–5: 19–30, 31–40, 41–50, 51–60, and >60 years, respectively); IHC results of p16INK4A, Ki–67, and cortactin; and E6/E7 RNA ISH results. The IHC positive/negative status was recorded as “2” (positive) or “1” (negative), whereas the AS of the staining intensity ranged from 0 to 7. The E6/E7 RNA expression in the chromogenic ISH was recorded as “2” (positive) or “1” (negative) (Supplementary Table S1). B (β0, β1, β2, β3…βn) was the regression coefficient demonstrated as tolerance (0–1) and variance inflation factor (VIF; 1 to infinity). When the tolerance or VIF was near 1, a smaller association with the dependent variable (Y) was considered. When tolerance was near 0 or the VIF was high (>1), a high association with the dependent variable was considered. To develop the linear regression model, we used the test sample set (233 samples) (Table 1). The expected cervical lesion grade and risk score for the progression of abnormal cervical precancerous lesions were calculated.

2.6. Statistical Analysis

Statistical analysis was performed using SPSS version 16. The correlations between the cervical grade and the protein marker (positive/negative) were evaluated using the Pearson Chi-square test (significance level: p < 0.05). The correlations between the cervical grade and the protein marker (AS) were evaluated using one-way ANOVA (significance level: p < 0.05). The MM was included in the regression analysis (significance level: p < 0.05), and the ROC curves and AUC were evaluated using SPSS.

3. Results

3.1. Baseline Characteristics

A total of 363 FFPE cervical tissue samples were studied. These samples were retrieved in 2012 (233 samples) and 2013 (130 samples) from women aged 19–95 years. Table 1 shows the sample characteristics. The most common age group in both 2012 and 2013 was the 41–50–year age group. LSILs and HSILs were common based on the abnormal histopathological grades.

3.2. HR–HPV E6/E7 RNA Chromogenic ISH

Positive E6/E7 RNA signals were mostly present in the cells (Figure 1). An increase in positive E6/E7 RNA signals was associated with a severe grade of cervical lesions (Table 3). Table 4 shows the sensitivity, specificity, positive predictive value (PPV), and negative predictive value (NPV) of RNA E6/E7 for detecting LSIL+ * and HSIL+ ** compared with normal cervical tissues. An association between p16INK4A and RNA E6/E7 was found in this study, which was consistent with Zappacosta R. et al. (2013) [32].

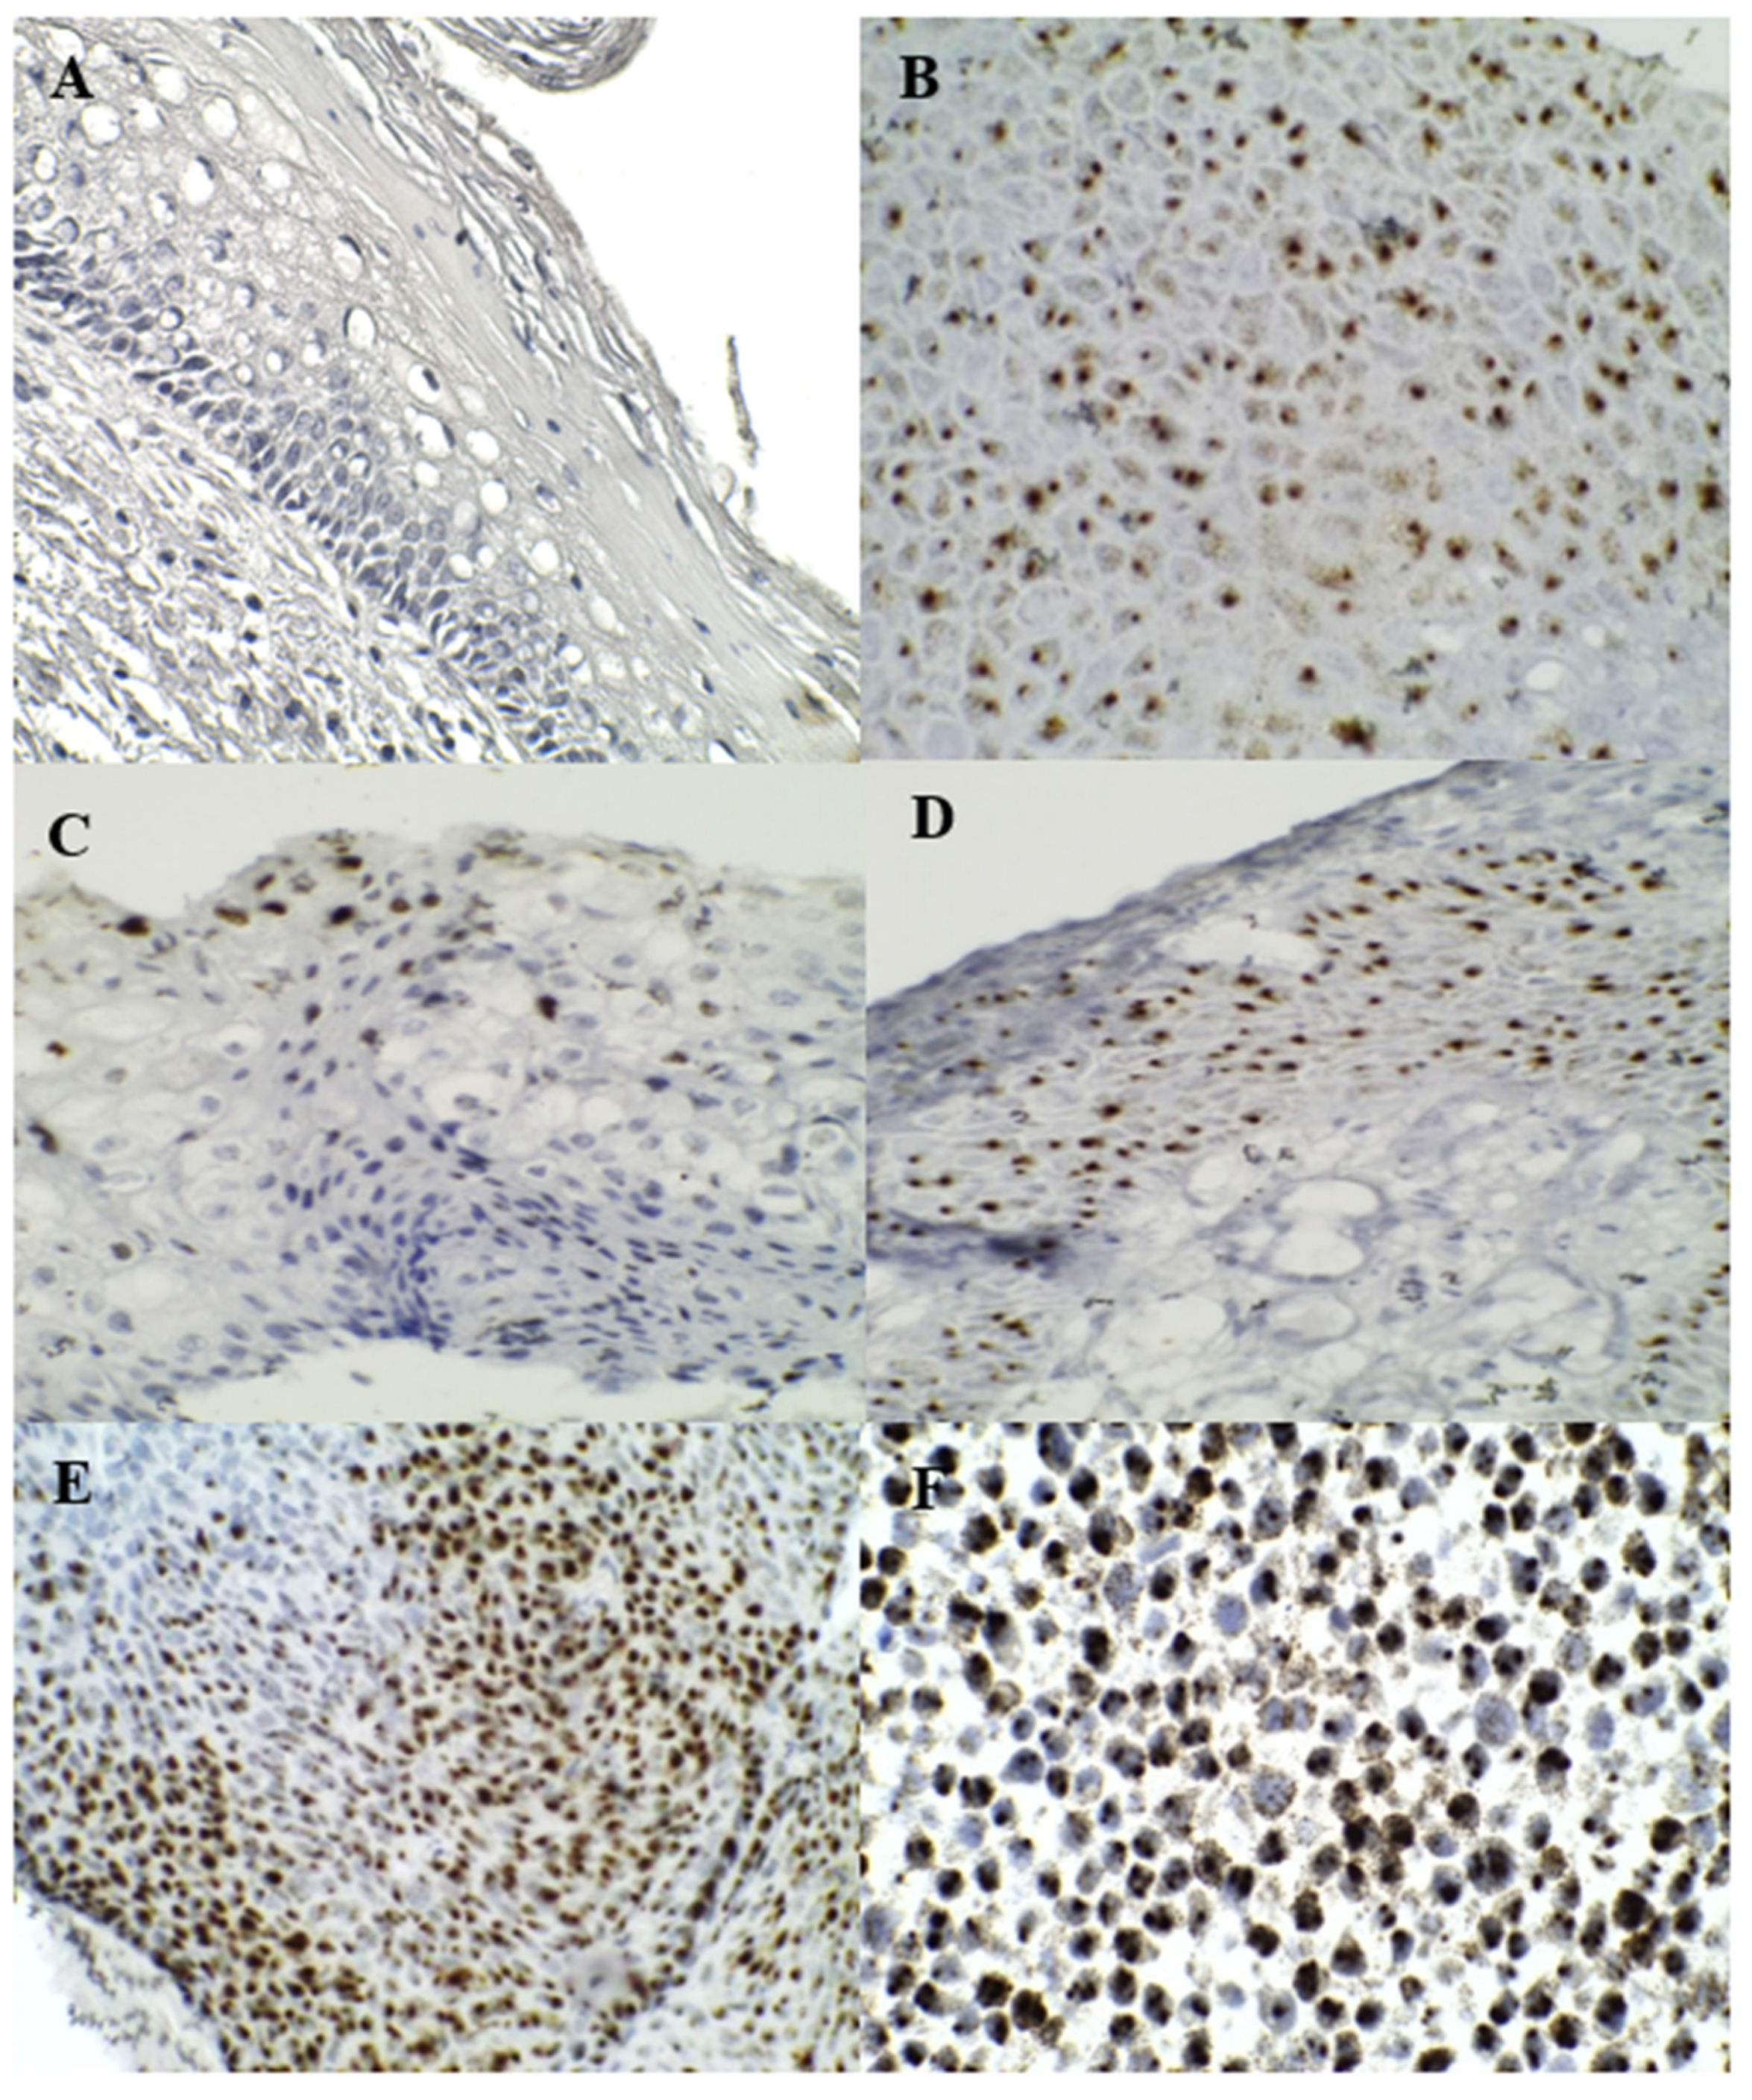
3.3. p16INK4A and Ki–67 Immunostaining

The expression patterns of p16INK4a and Ki–67 are shown in Figure 2 and Figure 3, respectively. A positive expression and the AS of p16INK4a and Ki–67 were significantly associated with increasing severity grades of the cervical lesions, as shown in Table 3. Table 4 shows the sensitivity and specificity of p16INK4A and Ki–67 for detecting LSIL+ and normal cases and for detecting HSIL+ and normal cases, respectively.

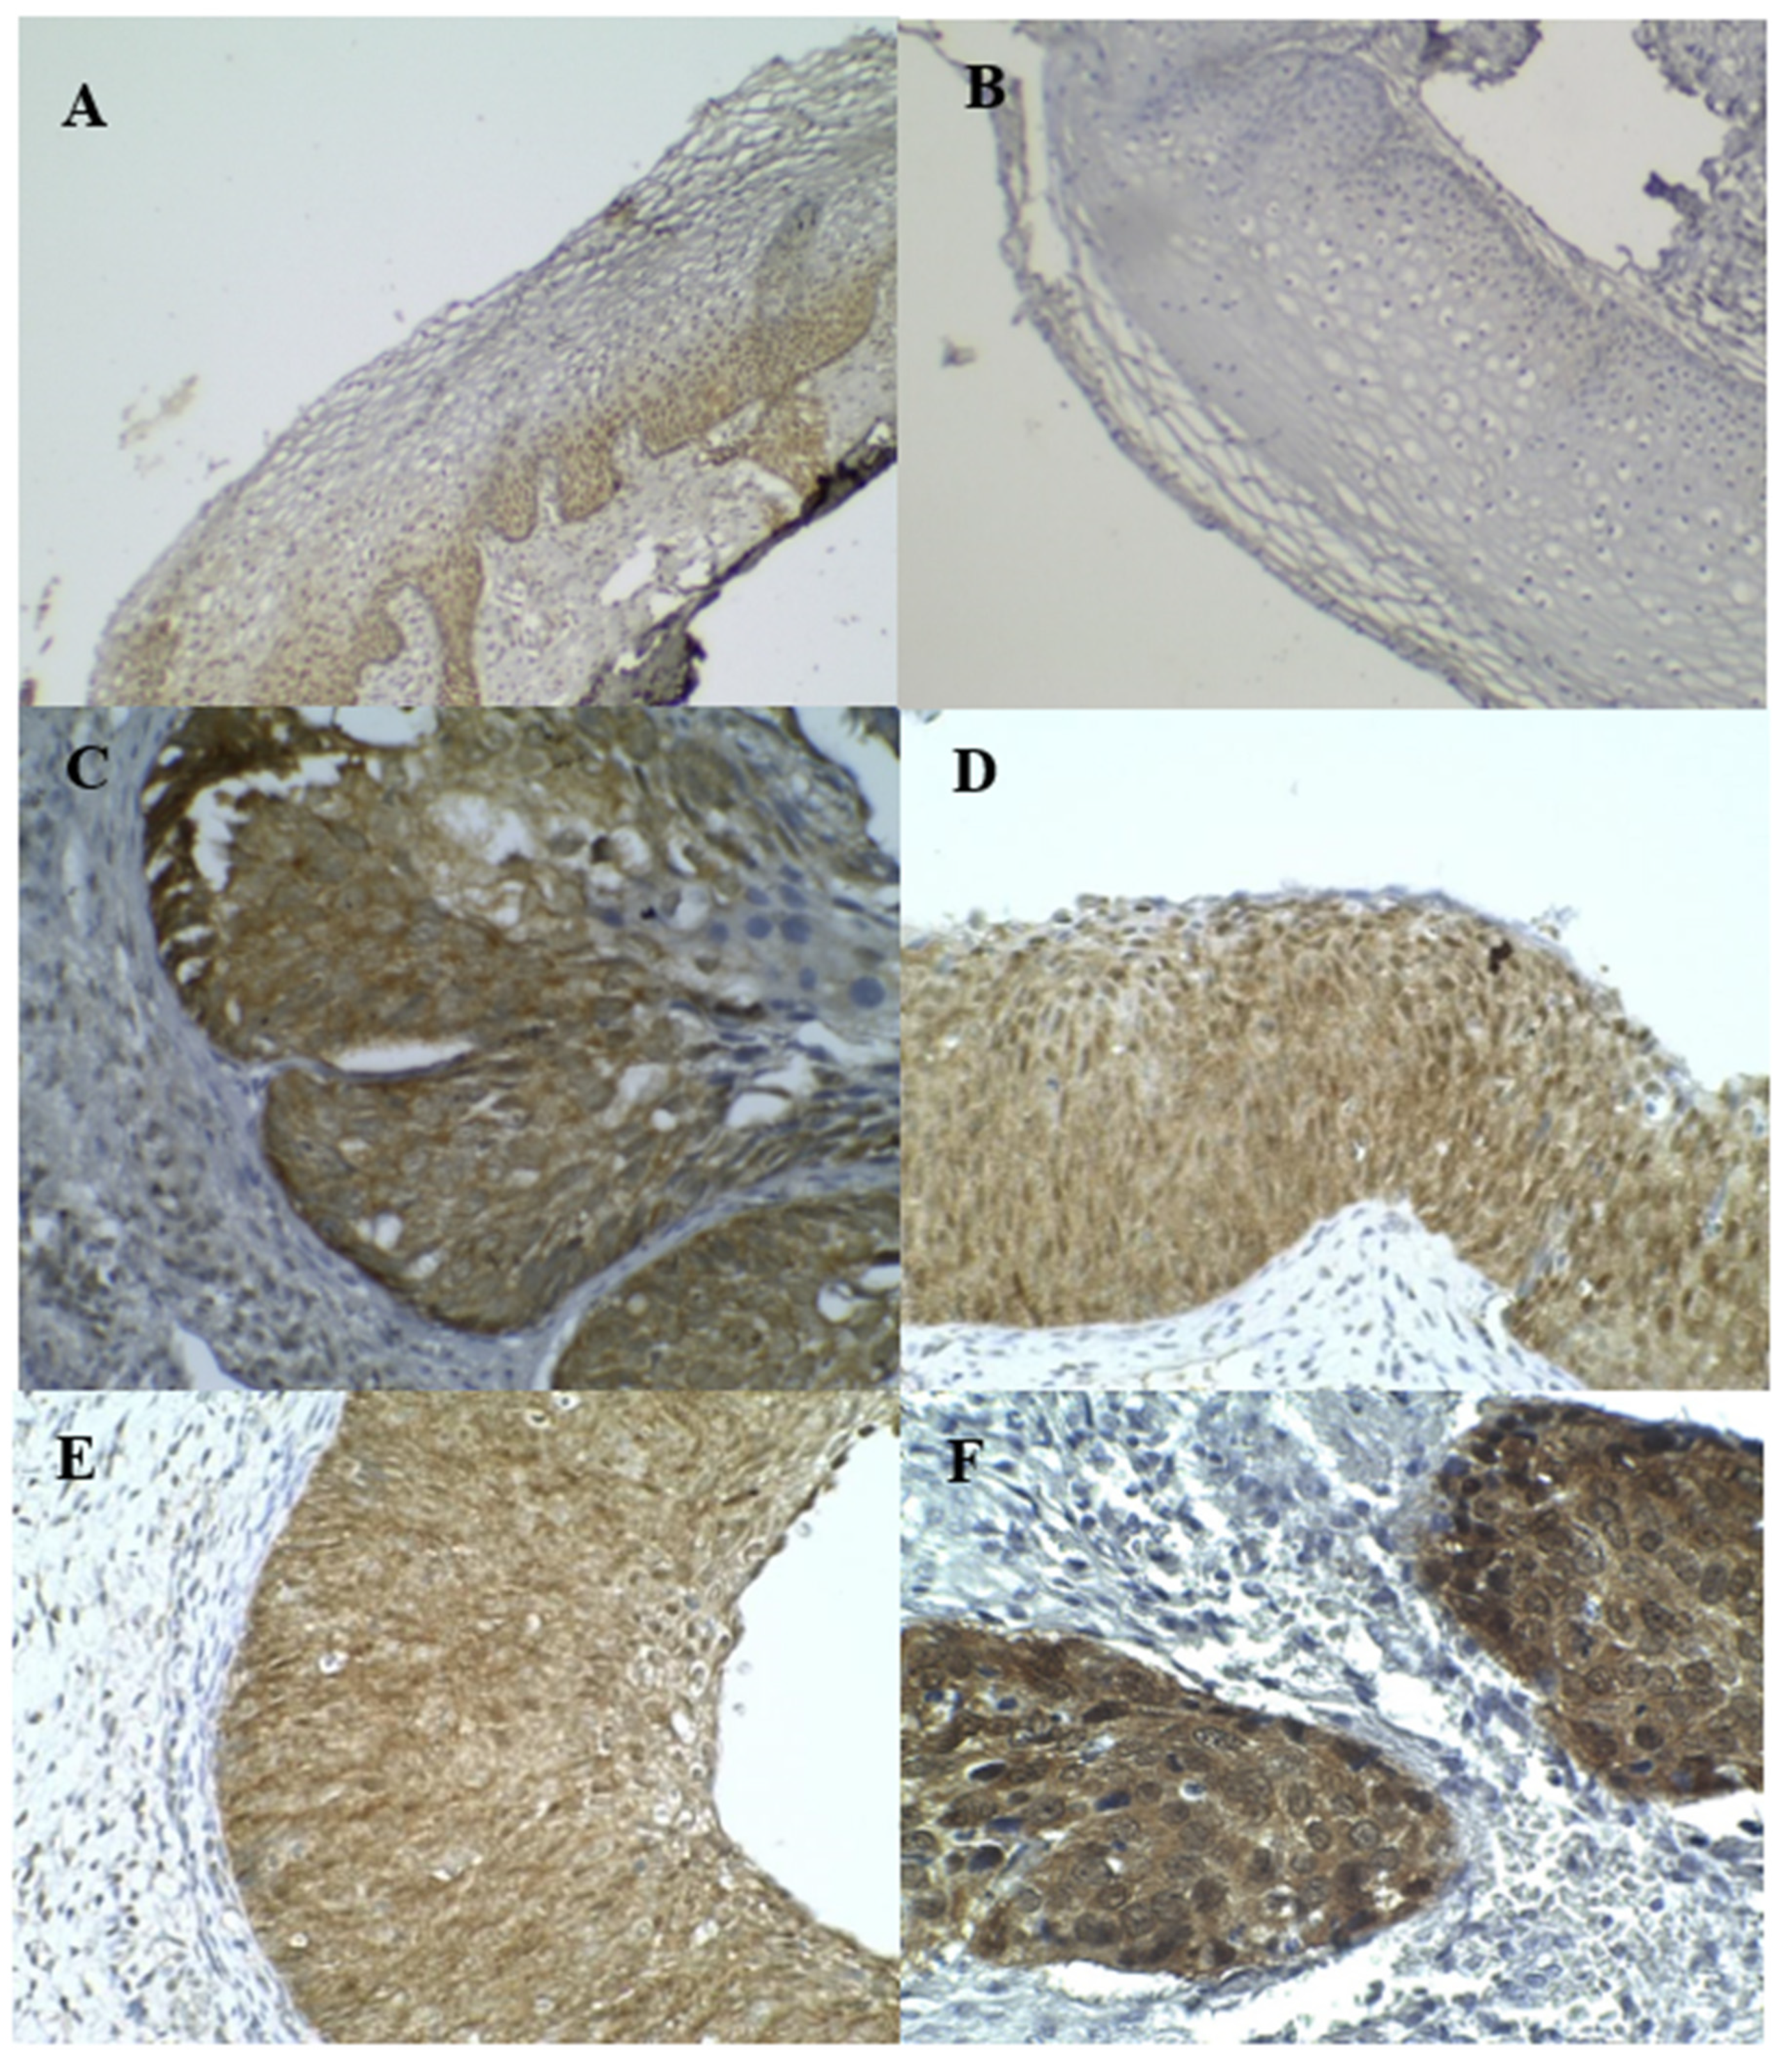
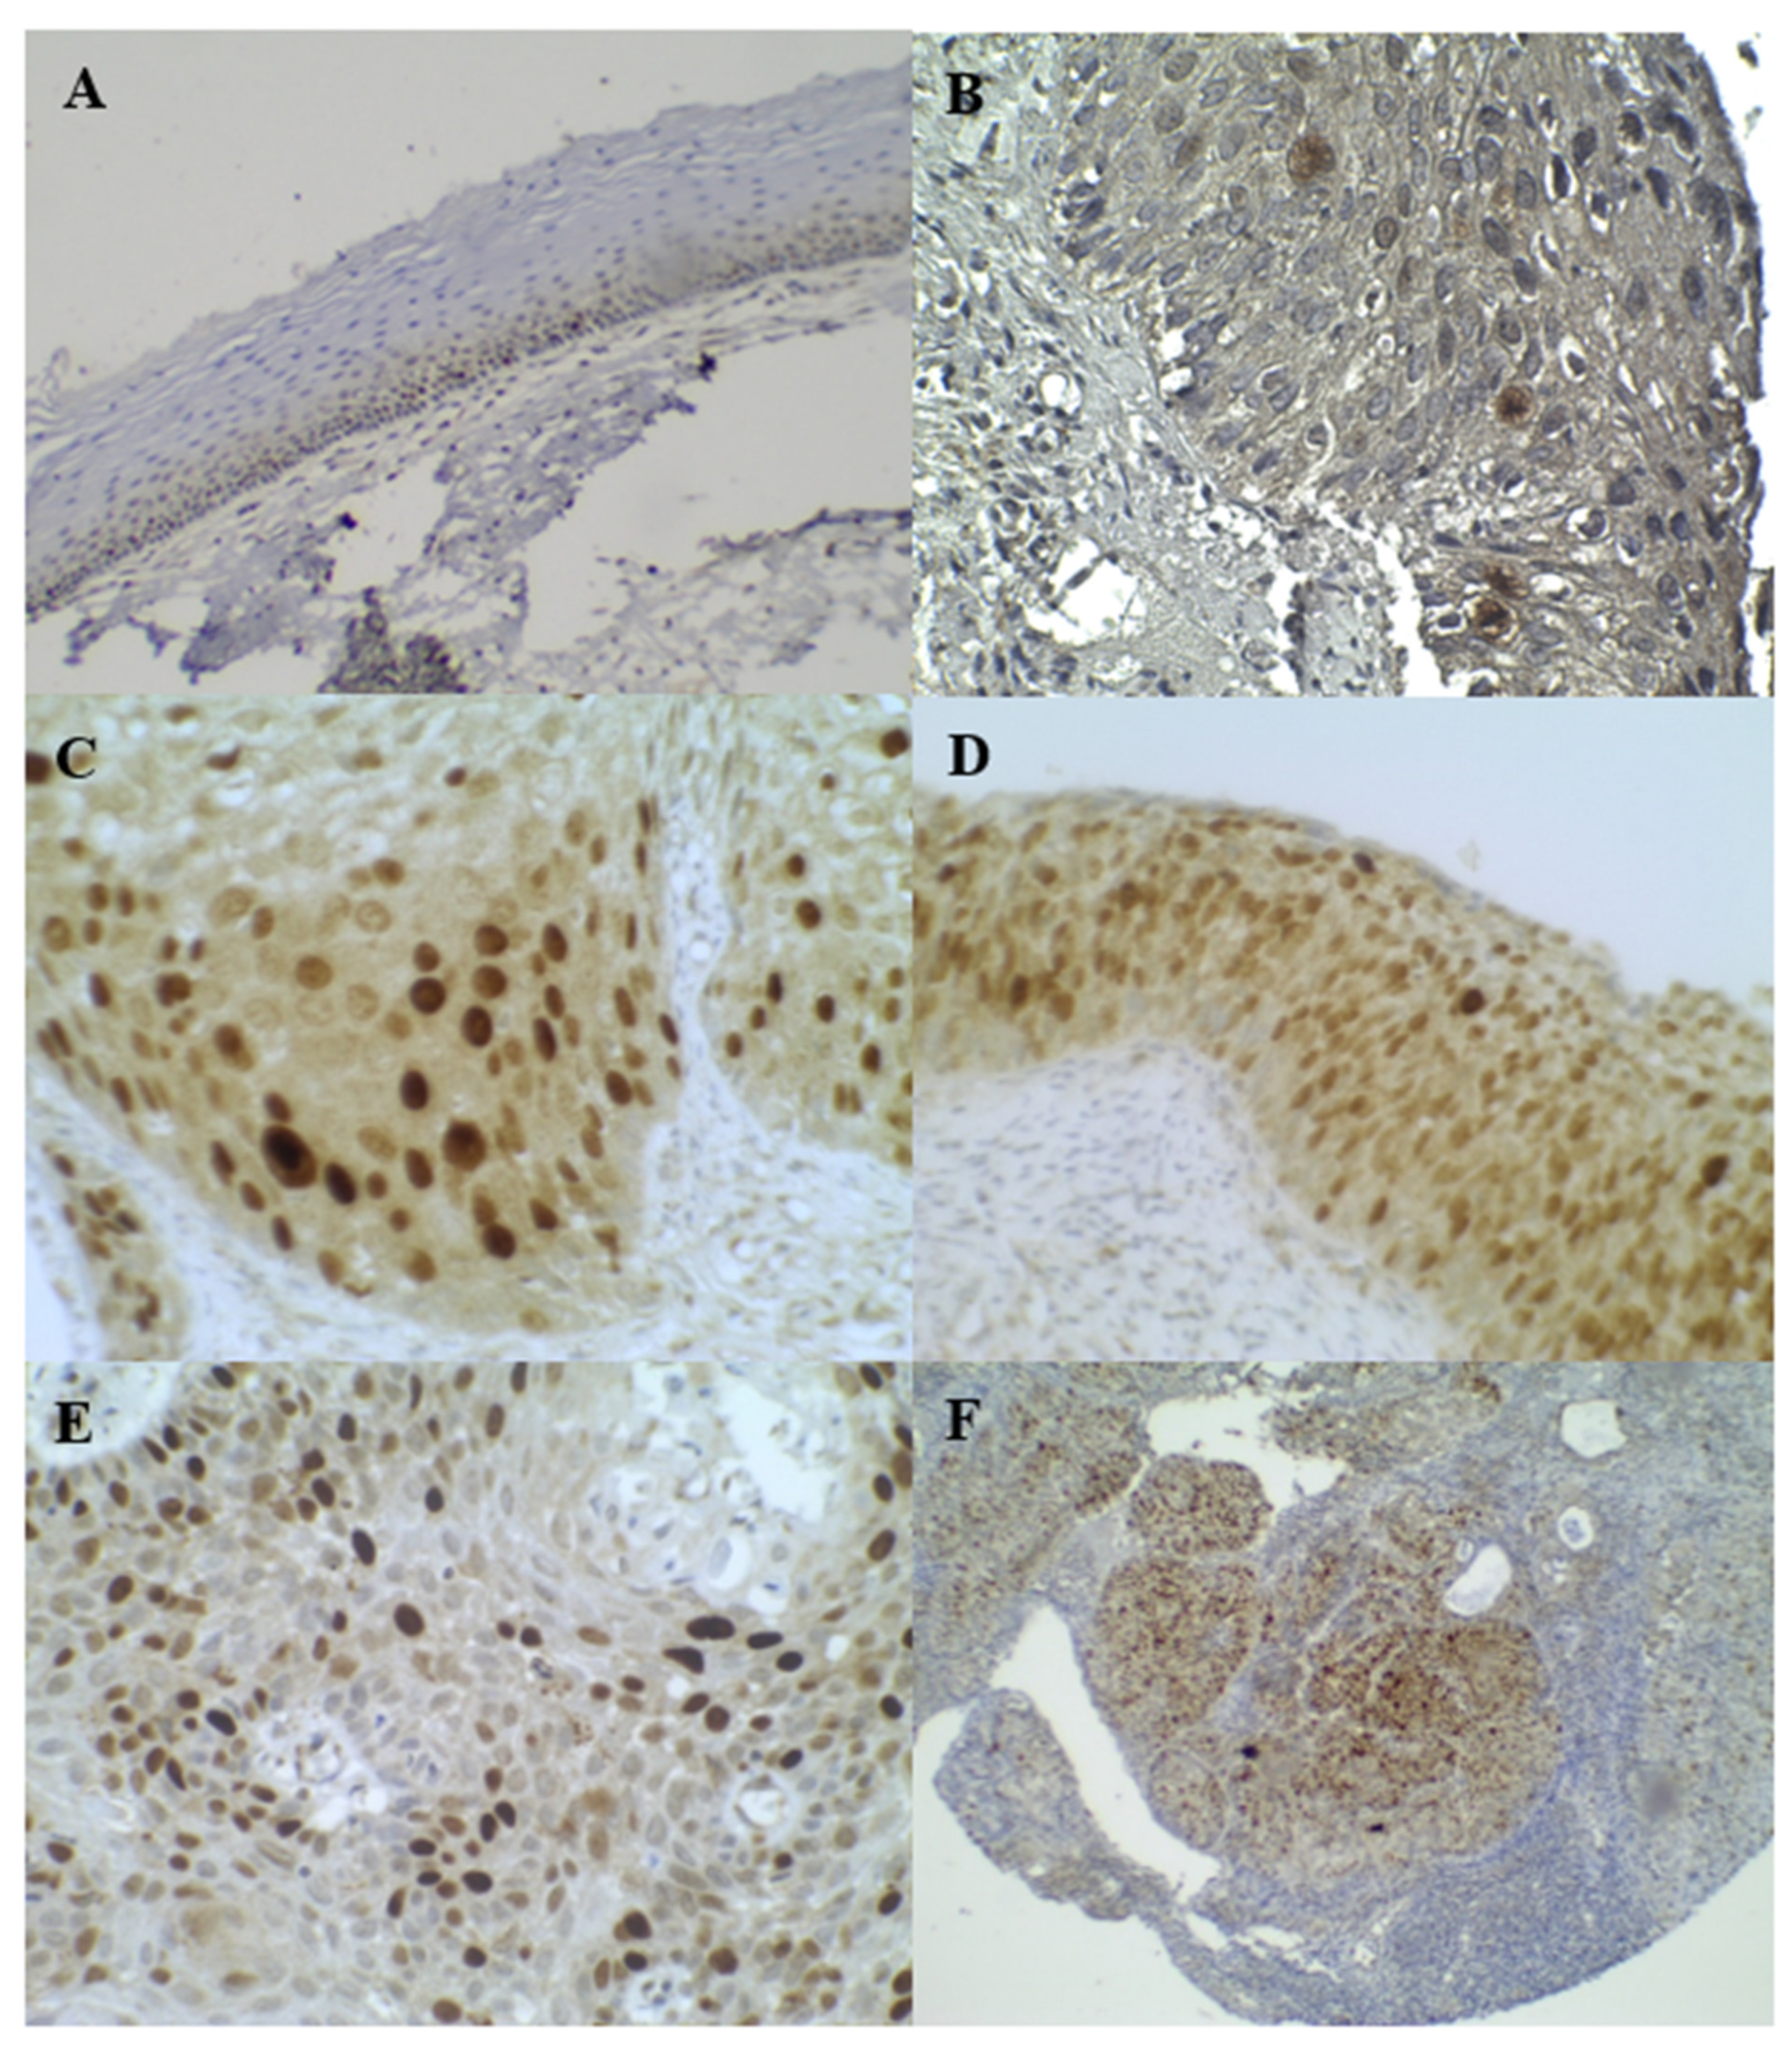
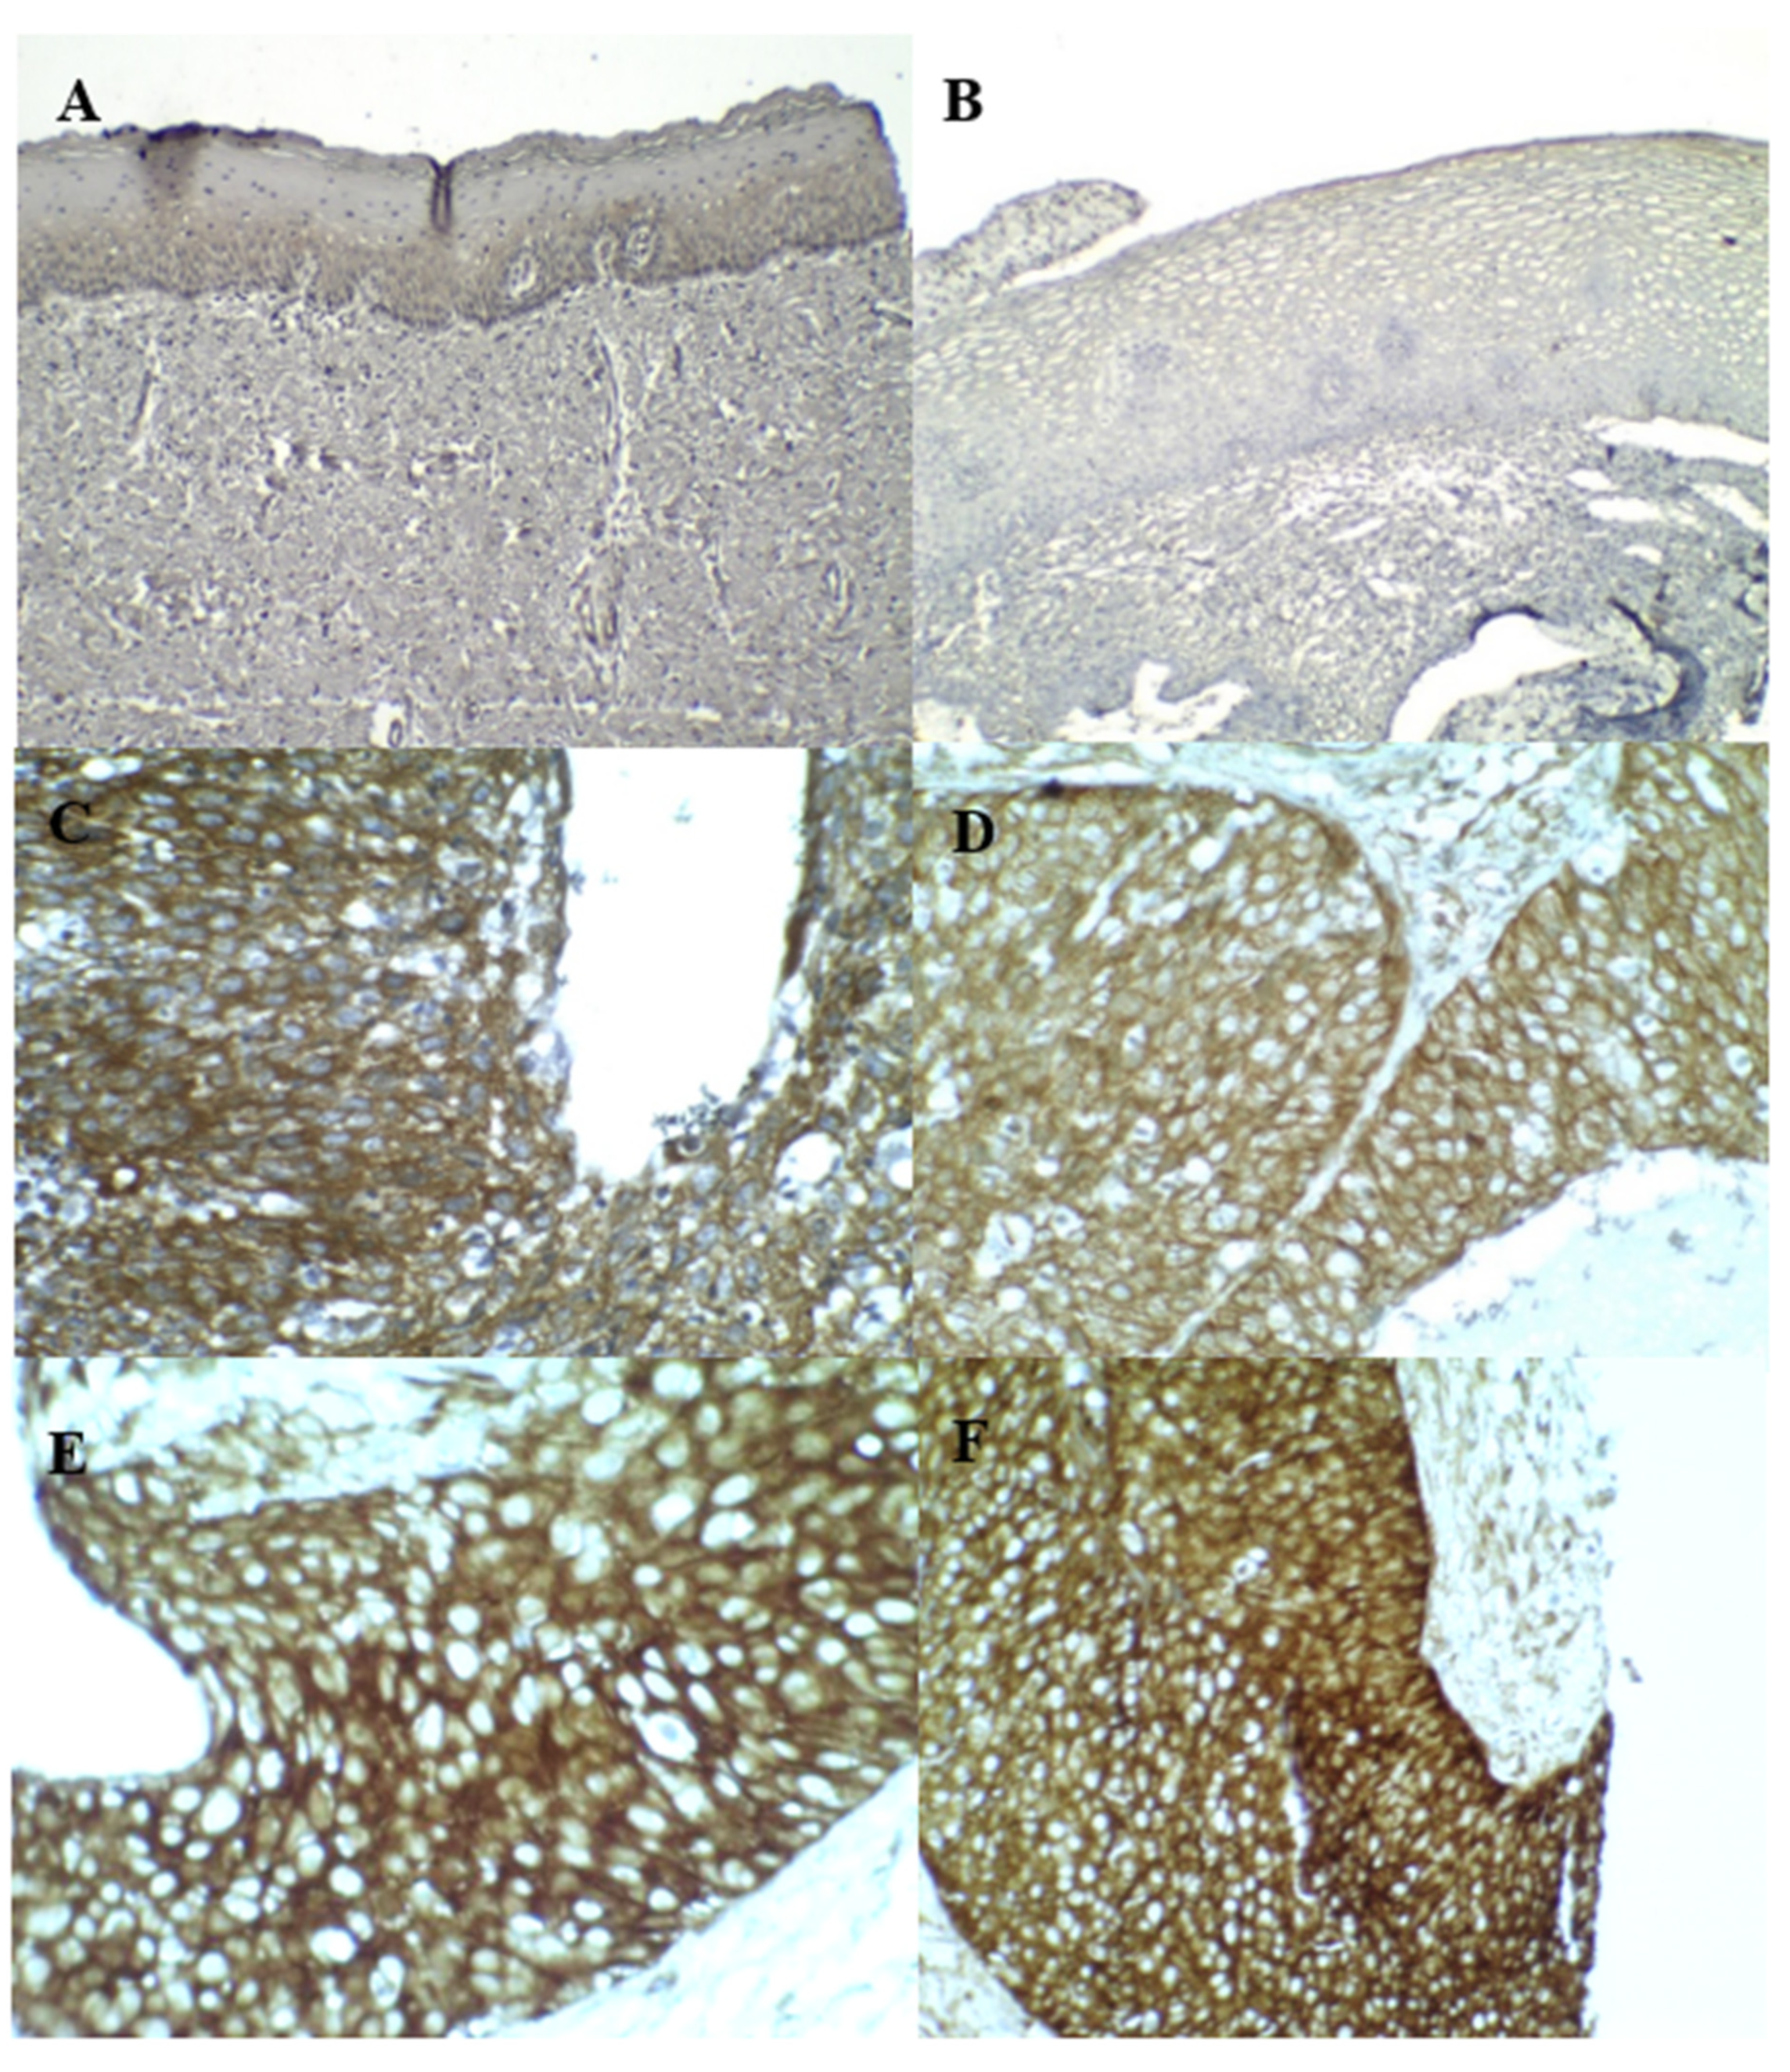
3.4. Cortactin Immunostaining

Five expression patterns of cortactin were observed according to their localization, staining, and intensity (Table 2). Positive cortactin staining was detected at significant levels in 84/211 normal cases (39.8%), 50/65 LSIL cases (76.9%), 46/58 HSIL cases (79.3%), and 24/29 SCC cases (82.8%). Figure 4 shows strong positive cytoplasmic overexpression staining (>75%, 2–3+) in some cases, with significant levels in 30/211 normal cases (14.21%), 28/65 LSIL cases (43.1%), 34/58 HSIL cases (58.6%), and 23/29 SCC cases (79.3%). Additionally, positive cortactin staining was characterized as a cytoplasmic membrane-positive staining pattern detected at significant levels in 10/211 normal cases (4.7%), 7/65 LSIL cases (10.8%), 3/58 HSIL cases (5.2%), and 10/29 SCC cases (34.5%). Meanwhile, the nuclear positive staining pattern was detected only in 1/58 (1.7%) HSIL case. The mean ASs were 2.7406, 4.4000, 5.0862, and 5.6552 for the normal cervical tissue, LSIL, HSIL, and SCC, respectively (Table 3). Positive cortactin staining was generally detected with significant differences across different grades of cervical lesions.

3.5. Mathematical Models (MM)

The MMs developed were simple linear regression models that included independent variables that consisted of age range (five categories) and the following biomarkers: cortactin, p16INK4A, Ki–67, and HPV E6/E7 RNA. The coefficients of the independent variables in the best five MMs are shown in Table 5. Table 6 shows the five best MMs used for calculating the expected value (mean ± SD) for each cervical lesion grade shown in Table 7, Supplementary Figure S1 and Supplementary Table S2. The risk score for the prediction of abnormal cervical progression and precancerous lesion was calculated on the basis of the mean ± SD of each cervical lesion grade. Based on the expected values (mean ± SD), none of the models could differentiate between the normal and LSIL cases (p > 0.05); therefore, the normal cases were included with the LSIL cases in the confirmed sample set. In model 3, the risk score for the progression from LSIL was 2.60 (mean ± SD: 1.4843 ± 1.10780). The risk scores for the progression from HSIL (mean ± SD: 3.5374 ± 1.01427) and SCC (mean ± SD: 3.9516 ± 0.41838) ranged from 3.54 to 4.56 and from 3.95 to 4.37, respectively (Table 7). In model 4, the risk scores were 2.60 for LSIL, 3.62–4.85 for HSIL, and 4.23–4.76 for SCC. In model 5, the risk scores were 2.56 for LSIL, 3.56–4.66 for HSIL, and 4.03–4.48 for SCC. Supplementary Table S3 shows the sensitivity and specificity of the five best models. Models 1–5 yielded a greater association with the variables with the disease outcome (OR) than did the other models. Models 3–5 revealed a great association with the variables with the disease outcome (OR). Models 2 and 3 could not differentiate between HSIL and SCC (p > 0.05). Interestingly, the predictive value of Models 1, 4, and 5 could significantly differentiate (1) the normal cases from HSIL–SCC (p < 0.001); (2) LSIL from HSIL–SCC (p < 0.001); and (3) HSIL from SCC (p < 0.05). The ROC curve and AUC of Models 3, 4, and 5 are shown in Supplementary Figure S2. These MMs might have good value for the detection of cervical lesion progression and precancerous lesions.
Models 3, 4, and 5 were selected to assess the risk of abnormal cervical lesion progression and precancerous lesions in the confirmed sample set. The expected value (Y) was calculated in each case and compared with the risk score. When Y was equal to or lower than the risk score, the cervical lesions were suggested to have biomolecules characteristic of the baseline (i.e., normal tissues). When Y was higher than the risk score, the individuals were expected to be at risk of progression or to have “risk biomolecules.” Such individuals should be monitored. For example, when a histopathological LSIL case was evaluated by Model 3 and showed a predictive value of 1.59 (risk score: <2.60), the presence of LSIL with “baseline characteristic biomolecules” was suggested. However, when a histopathological LSIL case showed a predictive value of 3.02 (risk score: >2.60), it was suggested to be an LSIL case with present “risk biomolecules”. For the prediction of precancerous lesions in the normal and LSIL cases, the cases were predicted to have precancerous lesions when Y was higher than the risk score for HSIL (risk score: >3.54).
Supplementary Figures S3 and S4 demonstrate the prediction of cervical lesions using Models 3, 4, and 5. Model 4 showed the highest detection rate of cases with risk biomolecules in the LSIL (23/86 normal + LSIL cases, 26.7%) and HSIL groups (29/34 cases, 85.3%). The traditional histologic grading of the biopsies did not identify the 23 normal and LSIL cases. Without this knowledge, 23 patients would not have undergone close monitoring.
The next best models were Models 5 and 3. Model 4 best predicted the cases with precancerous lesions in the LSIL (5/86 cases, 5.8%) and HSIL groups (24/34 cases, 70.6%), while Models 3 and 5 predicted the cases with precancerous lesions in 3/86 (3.5%) cases in the LSIL group and 20/34 (58.8%) cases in the HSIL group. As shown in Table 8, the risk scores obtained by Models 3, 4, and 5 were suitable for detecting abnormal cervical lesions among patients in the LSIL group and for determining the risk of LSIL and HSIL. The ROC curve and AUC of Model 4 were significantly higher than those of Models 3 and 5 (p = 0.000) in terms of predicting the histopathological normal and LSIL cases with risk biomolecules and precancerous lesions (Supplementary Figures S3 and S4). In the comparison between the sensitivity and specificity of Models 3 to 5 to distinguish between normal tissue and LSIL+HSIL in the confirmed sample set (Supplementary Figure S3), the AUC values for predicting risk biomolecules were 0.757, 0.793, and 0.751, respectively. In the comparison between the sensitivity and specificity of Models 3 to 5 to distinguish between LSIL and HSIL in the confirmed sample set (Supplementary Figure S4), the AUC values for predicting precancerous lesions were 0.777, 0.824, and 0.762, respectively.

4. Discussion

As previously reported, atypical cervical cells slowly grow and progress to precancerous lesions over a period of 10–20 years. Patients with these abnormal cells need to be monitored closely to prevent cervical cancer. In low–income countries, including Thailand, it is difficult to monitor these patients since they are usually lost in the follow–up. In this study, we were able to collect data from the initial presentations of our patients; however, we were unable to obtain follow–up results. Some of the patients might be at risk of developing cervical cancer.
Many studies have reported the clinical significance of p16INK4A and Ki–67 expression as risk factors for cervical cancer. However, to date, no biomarkers have accurately predicted the progression of abnormal cervical cells and the development of precancerous lesions. The present study aimed to develop MMs and risk scores using a new biomarker, cortactin, combined with p16INK4A, Ki–67, and HPV mRNA. We intended to identify the best MM and risk score to predict the progression from normal cervical tissues to LSILs and HSILs and the risk of developing cervical precancerous lesions. We found that the sensitivity, specificity, PPV, and NPV of p16INK4A/Ki–67 were 68%, 69%, 61%, and 74% for detecting LSIL+ and 92%, 68%, 91%, and 96% for detecting HSIL+, respectively. These results are comparable to those of other studies. Li and colleagues found that the sensitivity, specificity, PPV, and NPV of p16INK4A/Ki–67 FFPE were 94%, 88%, 69%, and 98% for CIN 2+ detection, respectively, and 84%, 96%, 88%, and 96%, respectively, for CIN 3+ detection [51,52]. Among women with CIN 2, positive IHC staining for p16INK4A and Ki–67 was strongly associated with disease progression [53].
Cortactin can promote cell migration, cell mortality, and tumor invasiveness in melanoma, colorectal cancer, and glioblastoma [33,34], and its expression was demonstrated to be significantly associated with poorer survival rates in patients with OSCC [54,55,56]. Meta-analyses have concluded that an overexpression of p16INK4A [57,58] in cervical cancer relates to increased overall and disease-free survival rates, which differs from the function of cortactin. We found that cortactin staining (Table 3) might be a useful molecular diagnostic aid for cervical cancer screening, based on its sensitivity and specificity. However, the cellular functions of cortactin in cervical cancer require further investigation. The abnormal expression of cortactin was manifested both in intensity and localized distribution (Table 2). Correspondingly, a study of invasive and metastatic melanomas showed cortactin expression with a high density of (very strong) expression in SCC of 83% [59]. However, different distribution patterns of cortactin were also seen, such as in cases of nevi. This study reported that weak staining with low intensity was evenly distributed in the cytoplasm in normal nevi tissue and that strong staining was found in the cytoplasm of high-grade lesions. In contrast, strong staining was accentuated in the cell’s periphery in most melanomas. This was also seen in cultured melanoma cells, in which cortactin was distributed in the membrane ruffles and lamellipodia [59]. Therefore, the level of protein expression and the distribution of cortactin may reflect the abnormal upregulation of protein expression. The expression of cortactin in cervical cancer, which is reported for the first time by our group, may act as a biomarker for cervical cancer progression.
An increased expression of HR-HPV E6 and E7 correlates with the progression to high-grade lesions [60] and eventually to carcinoma in situ. These oncoproteins have been shown to induce abnormal chromosome copy numbers and miRNA expression in infectious processes [12,13,14,15,16]. The detection of HPV E6/E7 RNA was combined with assays of biomarkers of human DNA, RNA, or protein for the diagnosis and prediction of abnormal cervical lesions. The sensitivity and specificity of HPV E6/E7 RNA for detecting high-grade cytology (CIN 2) were 71.4% and 75.8% [12,13,14,15,16], respectively. The corresponding values for detecting CIN 2+ and CIN 3+ were 87.0% (75.6–93.6) and 88.0% (70.0–95.8), respectively. The specificity of HPV E6/E7 RNA was 82.5% (77.3–86.8) for detecting CIN 2+ and 39.6% (34.0–45.5) for detecting CIN 3+ [59]. Herein, the sensitivity and specificity of HPV E6/E7 RNA were 88% and 54% for predicting LSIL+, and they were 93% and 44% for predicting HSIL+, respectively (Table 4). The presence of HPV E6/E7 RNA was associated with the future development of CIN 2+ among women with LSIL [60]. Moreover, the higher specificity (54% for LSIL+ and 44% for HSIL+) and NPV (81% for LSIL+ and 93% for HSIL+) of HPV E6/E7 mRNA testing are valuable in predicting clinically insignificant HPV DNA infections and helping to avoid aggressive procedures (biopsies and over–referral for transient HPV infections), as well as for reducing patients’ anxieties and frequencies of follow up [18,61].
Several prediction models are currently widely used in clinical practice, including the model for breast cancer incidence, the Adjuvant Online Decision Aid [41,44,62] and that from http://www.predict.nhs.uk/predict.html (accessed on 8 March 2023), which uses MMs to determine the likelihood of relapse and to predict responses to chemotherapy for breast cancer [41]. Three of our five best MMs were evaluated using the confirmed sample set; Model 4. with risk scores of >2.60 and >3.62. showed the highest sensitivity for predicting risk biomolecules in the normal and LSIL cases and precancerous lesions, respectively.
The mean time for abnormal cervical cell progression from LSIL to HSIL with 8/45 (18%) oncogenic HPV types was 73.3 months (95% CI: 64.8–81.8 months). For non-oncogenic HPV (1/28, 4%), the mean time was 91.3 months (95% CI: 85.1–97.4 months), while for the 2/44 (5%) cases negative for HPV, the mean time was 83.5 months (95% CI: 78.0–89.1 months) [63]. In Model 4, 10/31 (32%) cases with LSIL and positive risk biomolecules included 25% of those with oncogenic HPV infection and 75% of those without HPV infection. Five patients with LSILs were younger than 25 years (3/5 cases, mean score >2.60). Bruno (2020) reported that the CIN 2 regression rates in women over 25 years of age are poor [64]. Herein, 26 patients with LSIL were older than 25 years (6/26 [23%]). Therefore, the risk score determined using Model 4 might predict the spontaneous regression or progression of LSIL [64] in women over 25 years of age. In addition, we found that 5/86 (5.8%) normal and LSIL cases with “risk biomolecules” were predicted to have precancerous lesions (>3.62), which might progress to cancerous lesions.
Our model also suggested that 13–14/34 (38–41%) cases of HSIL with “risk biomolecules” (3.95–4.23) might progress to cervical cancer. This is in broad agreement with the findings by Austin (2020), wherein they determined that only around 30% of CIN 3 lesions would progress to cervical cancer in 30 years [65]. However, this study found that slides suffer from issues such as the positions of the biopsies.
Wu et al. (2021) validated a prediction model in two cohorts in China with a follow-up duration of 3 years. In the first cohort, 42 cases were diagnosed as CIN 2+, with thirty-seven cases predicted to progress and five cases to not progress. In the second cohort, 28 cases were diagnosed as CIN 2+, with 11 cases predicted to progress and 17 cases to not progress [66]. Although this is a starting point for research using machine learning, our study demonstrates that machine–learning–based algorithms using input data from the expression levels of multiple biomarkers have potential for diagnosing and predicting disease progression [67,68] and consequently for solving health problems currently considered unsolvable, such as cancer.

5. Conclusions

MM-based analysis of the expression levels of multiple biomarkers, including p16INK4A, Ki–67, cortactin, and HPV E6/E7 RNA, can provide a risk score for predicting the progression of abnormal cervical cells and the development of precancerous lesions in patients with normal histology and LSILs. For example, the relevant equation (Model 4) was Y = 0.535 + 0.387 (Ki–67AS) + 0.142(p16INK4A AS) + 0.530(cortactinP/N) + 0.506(RNA E6/E7P/N) − 0.786 (Ki–67P/N). These results suggest that monitoring patients with MM–based analyses of multiple biomarkers could help physicians design optimal therapeutic strategies and help predict cancer progression in the future.

Supplementary Materials

The following supporting information can be downloaded at: https://www.mdpi.com/article/10.3390/diagnostics13061084/s1, Tables S1–S3, Figures S1–S5. Supplement Table S1 Experimental results of substituting values in the development of mathematical models. Supplement Table S2 The expected prediction value from development of mathematical models. Supplement Table S3 Sensitivity, specificity, PPV and NPV of pathological grades analyzed by models 1 to 5 in the test sample set. Supplement Figure S1 Means of the expected values from the linear regression models and clinical pathological grades of confirmed sample sets. Supplement Figure S2 ROC curves and AUCs of models 1 to 5. Supplement Figures S3–S4 ROC curves and AUC of models 3 to 5. Supplement Figure S5 Means of the expected values from the 5 linear regression models.

Author Contributions

Conceptualization, S.B., C.P.; methodology, S.B., P.K. and K.P.; validation, S.B.; formal analysis, S.B.; investigation, S.B. and P.K.; data curation, S.B.; sample collection, S.B., K.P., P.R., P.P. and J.J.; writing—original draft preparation, S.B. and D.C.; writing—review and editing, S.B., C.P., T.E. and S.D.; visualization, S.B., C.P. and T.E.; supervision, S.B., C.P., T.E., K.P. and P.K.; funding acquisition, S.B., C.P. and T.E. All authors have read and agreed to the published version of the manuscript.

Funding

This work was supported by the Thailand Research Fund (TRF) through the Royal Golden Jubilee Program [Grant Numer: RAP60K0018)/Thailand Science Research and Innovation (TSRI) and Research and Graduate Studies, Khon Kaen University, Thailand (Grant Number: RP65-8-001).

Institutional Review Board Statement

This work was approved by the Human Research Ethics Committee of the University of Phayao (2/015/59) and Phayao Hospital (HE-59-02-0008). The date of approval on 18 April 2016 and 15 September 2016, respectively.

Informed Consent Statement

Patient consent was waived due to the absence of a link to personal patient data.

Data Availability Statement

Not applicable.

Acknowledgments

We thank the Phayao Hospital (Phayao), S.B. LAB Co., Ltd., (Chiang Mai) for the sample collection. We would like to acknowledge David Blair for editing the manuscript via Publication Clinic KKU, Thailand.

Conflicts of Interest

The authors declare no conflict of interest.

References

  1. Rotondo, J.C.; Bosi, S.; Bassi, C.; Ferracin, M.; Lanza, G.; Gafà, R.; Martini, F. Gene expression changes in pro-gression of cervical neoplasia revealed by microarray analysis of cervical neoplastic keratinocytes. J. Cell Physiol. 2015, 230, 806–812. [Google Scholar] [CrossRef]
  2. Mello, V.; Sundstrom, R.K. Cervical Intraepithelial Neoplasia. In StatPearls; StatPearls Publishing: Treasure Island, FL, USA, 2022. [Google Scholar]
  3. Øvestad, I.T.; Engesæter, B.; Halle, M.K.; Akbari, S.; Bicskei, B.; Lapin, M. High-Grade Cervical Intraepi-thelial Neoplasia (CIN) Associates with Increased Proliferation and Attenuated Immune Signaling. Int. J. Mol. Sci. 2021, 23, 373. [Google Scholar] [CrossRef]
  4. World Health Organization. WHO Guidelines for Treatment of Cervical Intraepithelial Neoplasia 2–3 and Adenocarcinoma In Situ: Cryotherapy, Large Loop Excision of the Transformation Zone, and Cold Knife Conization; World Health Organization: Geneva, Switzerland, 2014. [Google Scholar]
  5. Lyon, F. IARC Monographs on the Evaluation of Carcinogenic Risks to Humans: Human Papillomaviruses; IARC Working Group: Lyon, France, 2007. [Google Scholar]
  6. Schiffman, M. Integration of human papillomavirus vaccination, cytology, and human papillomavirus testing. Cancer 2007, 111, 145–153. [Google Scholar] [CrossRef]
  7. Schiffman, M.; Castle, P.E.; Jeronimo, J.; Rodriguez, A.C.; Wacholder, S. Human papillomavirus and cervical cancer. Lancet 2007, 370, 890–907. [Google Scholar] [CrossRef]
  8. Baseman, J.G.; Koutsky, L.A. The epidemiology of human papillomavirus infections. J. Clin. Virol. 2005, 32 (Suppl. S1), S16–S24. [Google Scholar] [CrossRef]
  9. McCredie, M.R.; Sharples, K.J.; Paul, C.; Baranyai, J.; Medley, G.; Jones, R.W.; Skegg, D.C. Natural history of cervical neoplasia and risk of invasive cancer in women with cervical intraepithelial neoplasia 3: A retrospective cohort study. Lancet Oncol. 2008, 9, 425–434. [Google Scholar] [CrossRef]
  10. Khan, M.J.; Castle, P.E.; Lorincz, A.T.; Wacholder, S.; Sherman, M.; Scott, D.R.; Schiffman, M. The elevated 10-year risk of cervical precancer and cancer in women with human papillomavirus (HPV) type 16 or 18 and the possible utility of type-specific HPV testing in clinical practice. J. Natl. Cancer Inst. 2005, 97, 1072–1079. [Google Scholar] [CrossRef] [PubMed]
  11. Duensing, S.; Munger, K. The human papillomavirus type 16 E6 and E7 oncoproteins independently induce numerical and structural chromosome instability. Cancer Res. 2002, 62, 7075–7082. [Google Scholar] [PubMed]
  12. Yu, L.L.; Chen, W.; Lei, X.Q.; Qin, Y.; Wu, Z.N.; Pan, Q.J.; Qiao, Y.L. Evaluation of p16/Ki-67 dual staining in detection of cervical precancer and cancers: A multicenter study in China. Oncotarget 2016, 7, 21181–21189. [Google Scholar] [CrossRef] [PubMed]
  13. Cuzick, J.; Arbyn, M.; Sankaranarayanan, R.; Tsu, V.; Ronco, G.; Mayrand, M.H.; Meijer, C.J. Overview of human papillomavirus-based and other novel options for cervical cancer screening in developed and developing countries. Vaccine 2008, 26 (Suppl. S10), K29–K41. [Google Scholar] [CrossRef]
  14. Gravitt, P.E.; Coutlée, F.; Iftner, T.; Sellors, J.W.; Quint, W.G.; Wheeler, C.M. New technologies in cervical cancer screening. Vaccine 2008, 26 (Suppl. S10), K42–K52. [Google Scholar] [CrossRef]
  15. Wentzensen, N.; von Knebel Doeberitz, M. Biomarkers in cervical cancer screening. Dis. Markers 2007, 23, 315–330. [Google Scholar] [CrossRef]
  16. Ghittoni, R.; Accardi, R.; Hasan, U.; Gheit, T.; Sylla, B.; Tommasino, M. The biological properties of E6 and E7 oncoproteins from human papillomaviruses. Virus Genes 2010, 40, 1–13. [Google Scholar] [CrossRef] [PubMed]
  17. Sokolova, I.; Algeciras-Schimnich, A.; Song, M.; Sitailo, S.; Policht, F.; Kipp, B.R.; Morrison, L. Chromosomal biomarkers for detection of human papillomavirus associated genomic instability in epithelial cells of cervical cytology specimens. J. Mol. Diagn. 2007, 9, 604–611. [Google Scholar] [CrossRef] [PubMed]
  18. Johansson, H.; Bjelkenkrantz, K.; Darlin, L.; Dilllner, J.; Forslund, O. Presence of High-Risk HPV mRNA in Relation to Future High-Grade Lesions among High-Risk HPV DNA Positive Women with Minor Cytological Abnormalities. PLoS ONE 2015, 10, e0124460. [Google Scholar] [CrossRef]
  19. Rotondo, J.C.; Oton-Gonzalez, L.; Mazziotta, C.; Lanzillotti, C.; Iaquinta, M.R.; Tognon, M. Simultaneous Detection and Viral DNA Load Quantification of Different Human Papillomavirus Types in Clinical Specimens by the High Analytical Droplet Digital PCR Method. Front. Microbiol. 2020, 11, 591452. [Google Scholar] [CrossRef]
  20. Carow, K.; Read, C.; Häfner, N.; Runnebaum, I.B.; Corner, A.; Dürst, M. A comparative study of digital PCR and real-time qPCR for the detection and quantification of HPV mRNA in sentinel lymph nodes of cervical cancer patients. BMC Res. Notes 2017, 10, 532. [Google Scholar] [CrossRef] [PubMed]
  21. Duvlis, S.; Jankovic, K.P.; Arsova, Z.S.; Memeti, S.; Popeska, Z.; Plaseska-Karanfilska, D. HPV E6/E7 mRNA Versus HPV DNA Biomarker in Cervical Cancer Screening of a Group of Macedonian Women. J. Med. Virol. 2015, 87, 1578–1586. [Google Scholar] [CrossRef]
  22. Bishop, J.A.; Ma, X.J.; Wang, H.; Luo, Y.; Illei, P.B.; Begum, S.; Westra, W.H. Detection of transcriptionally active high-risk HPV in patients with head and neck squamous cell carcinoma as visualized by a novel E6/E7 mRNA in situ hybridization method. Am. J. Surg. Pathol. 2012, 36, 1874–1882. [Google Scholar] [CrossRef]
  23. Brown, R.E.; Naqvi, S.; McGuire, M.F.; Buryanek, J.; Karni, R.J. Morphoproteomics, E6/E7 in-situ hybridization, and biomedical analytics define the etiopathogenesis of HPV-associated oropharyngeal carcinoma and provide targeted therapeutic options. J. Otolaryngol. Head Neck Surg. 2017, 46, 52. [Google Scholar] [CrossRef]
  24. Koliopoulos, G.; Arbyn, M.; Martin-Hirsch, P.; Kyrgiou, M.; Prendiville, W.; Paraskevaidis, E. Diagnostic accuracy of human papillomavirus testing in primary cervical screening: A systematic review and meta-analysis of non-randomized studies. Gynecol. Oncol. 2007, 104, 232–246. [Google Scholar] [CrossRef]
  25. Sarwath, H.; Bansal, D.; Husain, N.E.; Mohamed, M.; Sultan, A.A.; Bedri, S. Introduction of p16INK4a as a surrogate biomarker for HPV in women with invasive cervical cancer in Sudan. Infect. Agent Cancer 2017, 12, 50. [Google Scholar] [CrossRef]
  26. Sarma, U.; Biswas, I.; Das, A.; Das, G.C.; Saikia, C.; Sarma, B. p16INK4a Expression in Cervical Lesions Correlates with Histologic Grading—A Tertiary Level Medical Facility Based Retrospective Study. Asian Pac. J. Cancer Prev. 2017, 18, 2643–2647. [Google Scholar]
  27. Singh, C.; Manivel, J.C.; Truskinovsky, A.M.; Savik, K.; Amirouche, S.; Holler, J.; Pambuccian, S.E. Variability of Pathologists’ Utilization of p16 and Ki-67 Immunostaining in the Diagnosis of Cervical Biopsies in Routine Pathology Practice and Its Impact on the Frequencies of Cervical Intraepithelial Neoplasia Diagnoses and Cytohistologic Correlations. Arch. Pathol. Lab. Med. 2014, 138, 76–87. [Google Scholar] [CrossRef] [PubMed]
  28. Ahmed, S.A.; Obaseki, D.E.; Mayun, A.A.; Mohammed, A.; Rafindadi, A.H.; Abdul, M.A. The Role of Biomarkers (p16INK4a and Ki-67) in Cervical Cancer Screening: An Appraisal. Ann. Trop. Pathol. 2017, 8, 1–4. [Google Scholar] [CrossRef]
  29. Cuschieri, K.; Wentzensen, N. Human papillomavirus mRNA and p16 detection as biomarkers for the improved diagnosis of cervical neoplasia. Cancer Epidemiol. Biomarkers Prev. 2008, 17, 2536–2545. [Google Scholar] [CrossRef]
  30. Carreon, J.D.; Sherman, M.E.; Guillen, D.; Solomon, D.; Herrero, R.; Jerónimo, J.; Schiffman, M. CIN 2 is a much less reproducible and less valid diagnosis than CIN 3: Results from a histological review of population-based cervical samples. Int. J. Gynecol. Pathol. 2007, 26, 441–446. [Google Scholar] [CrossRef] [PubMed]
  31. Jeronimo, J.; Schiffman, M. Colposcopy at a crossroads. Am. J. Obstet. Gynecol. 2006, 195, 349–353. [Google Scholar] [CrossRef] [PubMed]
  32. Zappacosta, R.; Colasante, A.; Viola, P.; D’Antuono, T.; Lattanzio, G.; Capanna, S.; Rosini, S. Chromogenic in situ hybridization and p16/Ki67 dual staining on formalin-fixed paraffin-embedded cervical specimens: Correlation with HPV-DNA test, E6/E7 mRNA test, and potential clinical applications. Biomed. Res. Int. 2013, 2013, 453606. [Google Scholar] [CrossRef]
  33. MacGrath, S.M.; Koleske, A.J. Cortactin in cell migration and cancer at a glance. J. Cell Sci. 2012, 125, 1621–1626. [Google Scholar] [CrossRef]
  34. Cosen-Binker, L.I.; Kapus, A. Cortactin. The Gray Eminence of the Cytoskeleton. Physiology 2006, 21, 352–361. [Google Scholar] [CrossRef] [PubMed]
  35. Weaver, A.M. Cortactin in tumor invasiveness. Cancer Lett. 2008, 265, 157–166. [Google Scholar] [CrossRef]
  36. Yin, M.; Ma, W.; An, L. Cortactin in cancer cell migration and invasion. Oncotarget 2017, 8, 88232–88243. [Google Scholar] [CrossRef]
  37. Buday, L.; Downward, J. Roles of cortactin in tumor pathogenesis. Biochim. Biophys. Acta 2007, 1775, 263–273. [Google Scholar] [CrossRef]
  38. Gibcus, J.H.; Mastik, M.F.; Menkema, L.; De Bock, G.H.; Kluin, P.M.; Schuuring, E.; Van Der Wal, J.E. Cortactin expression predicts poor survival in laryngeal carcinoma. Br. J. Cancer 2008, 98, 950–955. [Google Scholar] [CrossRef] [PubMed]
  39. Belfatto, A.; Riboldi, M.; Ciardo, D.; Cattani, F.; Cecconi, A.; Lazzari, R.; Cerveri, P. Kinetic Models for Predicting Cervical Cancer Response to Radiation Therapy on Individual Basis Using Tumor Regression Measured In Vivo With Volumetric Imaging. Technol. Cancer Res. Treat. 2016, 15, 146–158. [Google Scholar] [CrossRef] [PubMed]
  40. Zhou, X.; Liu, K.Y.; Wong, S.T. Cancer classification and prediction using logistic regression with Bayesian gene selection. J. Biomed. Inform. 2004, 37, 249–259. [Google Scholar] [CrossRef]
  41. Vickers, A.J. Prediction models in cancer care. CA Cancer J. Clin. 2011, 61, 315–326. [Google Scholar] [CrossRef]
  42. Jiang, L.; Yin, K.; Wen, Q.; Chen, C.; Ge, M.H.; Tan, Z. Predictive Risk-scoring Model For Central Lymph Node Metastasis and Predictors of Recurrence in Papillary Thyroid Carcinoma. Sci. Rep. 2020, 10, 710. [Google Scholar] [CrossRef]
  43. Enderling, H.; Chaplain, M.A.; Anderson, A.R.; Vaidya, J.S. A mathematical model of breast cancer development, local treatment and recurrence. J. Theor. Biol. 2007, 246, 245–259. [Google Scholar] [CrossRef]
  44. Murphy, H.; Jaafari, H.; Dobrovolny, H.M. Differences in predictions of ODE models of tumor growth: A cautionary example. BMC Cancer 2016, 16, 163. [Google Scholar] [CrossRef]
  45. Lin, M.; Ye, M.; Zhou, J.; Wang, Z.P.; Zhu, X. Recent Advances on the Molecular Mechanism of Cervical Carcinogenesis Based on Systems Biology Technologies. Comput. Struct. Biotechnol. J. 2019, 17, 241–250. [Google Scholar] [CrossRef]
  46. Charan, J.; Biswas, T. How to calculate sample size for different study designs in medical research? Indian J. Psychol. Med. 2013, 35, 121–126. [Google Scholar] [CrossRef]
  47. Bumrungthai, S.; Munjal, K.; Nandekar, S.; Cooper, K.; Ekalaksananan, T.; Pientong, C.; Evans, M.F. Epidermal growth factor receptor pathway mutation and expression profiles in cervical squamous cell carcinoma: Therapeutic implications. J. Transl. Med. 2015, 13, 244. [Google Scholar] [CrossRef]
  48. Devasena, K.; Shana, J. Building Machine Learning Model for Predicting Breast Cancer Using different Regression Techniques. In IOP Conference Series: Materials Science and Engineering; IOP Publishing: Bristol, UK, 2021; Volume 1166, p. 12029. [Google Scholar] [CrossRef]
  49. Xu, J.; Xue, D. Cell Carcinosis Prediction using Linear Regression with Nuclear Statistics. In Proceedings of the 2022 International Conference on Big Data, Information and Computer Network (BDICN), Sanya, China, 20–22 January 2022; pp. 276–282. [Google Scholar] [CrossRef]
  50. Murugan, S.; Kumar, B.M.; Amudha, S. Classification and Prediction of Breast Cancer using Linear Regression, Decision Tree and Random Forest. In Proceedings of the 2017 International Conference on Current Trends in Computer, Electrical, Electronics and Communication (CTCEEC), Mysore, India, 8–9 September 2017; pp. 763–766. [Google Scholar] [CrossRef]
  51. Shi, Q.; Xu, L.; Yang, R.; Meng, Y.; Qiu, L. Ki-67 and P16 proteins in cervical cancer and precancerous lesions of young women and the diagnostic value for cervical cancer and precancerous lesions. Oncol. Lett. 2019, 18, 1351–1355. [Google Scholar] [CrossRef]
  52. Murphy, N.; Ring, M.; Killalea, A.G.; Uhlmann, V.; O’Donovan, M.; Mulcahy, F.; O’Leary, J.J. p16INK4A as a marker for cervical dyskaryosis: CIN and cGIN in cervical biopsies and ThinPrep smears. J. Clin. Pathol. 2003, 56, 56–63. [Google Scholar] [CrossRef]
  53. Leite, P.M.B.O.; Tafuri, L.; Costa, M.Z.B.O.; Lima, M.I.B.M.; Simões, R.T. Evaluation of the p16 and Ki-67 Biomarkers as Predictors of the Recurrence of Premalignant Cervical Cancer Lesions after LEEP Conization. Rev. Bras. Ginecol. Obstet. 2017, 39, 288–293. [Google Scholar] [CrossRef]
  54. Chuma, M.; Sakamoto, M.; Yasuda, J.; Fujii, G.; Nakanishi, K.; Tsuchiya, A.; Hirohashi, S. Overexpression of cortactin is involved in motility and metastasis of hepatocellular carcinoma. J. Hepatol. 2004, 41, 629–636. [Google Scholar] [CrossRef] [PubMed]
  55. Bissinger, O.; Kolk, A.; Drecoll, E.; Straub, M.; Lutz, C.; Wolff, K.D.; Götz, C. EGFR and Cortactin: Markers for potential double target therapy in oral squamous cell carcinoma. Exp. Ther. Med. 2017, 14, 4620–4626. [Google Scholar] [PubMed]
  56. Timpson, P.; Wilson, A.S.; Lehrbach, G.M.; Sutherland, R.L.; Musgrove, E.A.; Daly, R.J. Aberrant Expression of Cortactin in Head and Neck Squamous Cell Carcinoma Cells Is Associated with Enhanced Cell Proliferation and Resistance to the Epidermal Growth Factor Receptor Inhibitor Gefitinib. Cancer Res. 2007, 67, 9304–9314. [Google Scholar] [CrossRef] [PubMed]
  57. Miyamoto, S.; Hasegawa, J.; Morioka, M.; Hirota, Y.; Kushima, M.; Sekizawa, A. The association between p16 and Ki-67 immunohistostaining and the progression of cervical intraepithelial neoplasia grade 2. Int. J. Gynaecol. Obstet. 2016, 134, 45–48. [Google Scholar] [CrossRef] [PubMed]
  58. Lin, J.; Albers, A.E.; Qin, J.; Kaufmann, A.M. Prognostic Significance of Overexpressed p16INK4a in Patients with Cervical Cancer: A Meta-Analysis. PLoS ONE 2014, 9, e106384. [Google Scholar] [CrossRef] [PubMed]
  59. Xu, X.Z.; Garcia, M.V.; Li, T.Y.; Khor, L.Y.; Gajapathy, R.S.; Spittle, C.; Wu, H. Cytoskeleton alterations in melanoma: Aberrant expression of cortactin, an actin-binding adapter protein, correlates with melanocytic tumor progression. Mod. Pathol. 2010, 23, 187–196. [Google Scholar] [CrossRef] [PubMed]
  60. Liu, S.; Minaguchi, T.; Lachkar, B.; Zhang, S.; Xu, C.; Tenjimbayashi, Y.; Satoh, T. Separate analysis of human papillomavirus E6 and E7 messenger RNAs to predict cervical neoplasia progression. PLoS ONE 2018, 13, e0193061. [Google Scholar] [CrossRef] [PubMed]
  61. Zhu, Y.; Ren, C.; Yang, L.; Zhang, X.; Liu, L.; Wang, Z. Performance of p16/Ki67 immunostaining, HPV E6/E7 mRNA testing, and HPV DNA assay to detect high-grade cervical dysplasia in women with ASCUS. BMC Cancer 2019, 19, 271. [Google Scholar] [CrossRef] [PubMed]
  62. Kourou, K.; Exarchos, T.P.; Exarchos, K.P.; Karamouzis, M.V.; Fotiadis, D.I. Machine learning applications in cancer prognosis and prediction. Comput. Struct. Biotechnol. J. 2014, 13, 8–17. [Google Scholar] [CrossRef] [PubMed]
  63. Schlecht, N.F.; Platt, R.W.; Duarte-Franco, E.; Costa, M.C.; Sobrinho, J.P.; Prado, J.C.; Franco, E.L. Human papillomavirus infection and time to progression and regression of cervical intraepithelial neoplasia. J. Natl. Cancer Inst. 2003, 95, 1336–1343. [Google Scholar] [CrossRef] [PubMed]
  64. Bruno, M.T.; Scalia, G.; Cassaro, N.; Costanzo, M.; Boemi, S. Conservative management of CIN 2 p16 positive lesions in women with multiple HPV infection. BMC Infect. Dis. 2020, 20, 801. [Google Scholar] [CrossRef] [PubMed]
  65. Austin, R.M.; Onisko, A.; Zhao, C. Are CIN 3 risk or CIN 3+ risk measures reliable surrogates for invasive cervical cancer risk? J. Am. Soc. Cytopathol. 2020, 9, 602–606. [Google Scholar] [CrossRef] [PubMed]
  66. Wu, Z.; Li, T.; Han, Y.; Jiang, M.; Yu, Y.; Xu, H.; Chen, W. Development of models for cervical cancer screening: Construction in a cross-sectional population and validation in two screening cohorts in China. BMC Med. 2021, 19, 197. [Google Scholar] [CrossRef] [PubMed]
  67. Deo, R.C. Machine Learning in Medicine. Circulation 2015, 132, 1920–1930. [Google Scholar] [CrossRef] [PubMed]
  68. Erickson, B.J.; Korfiatis, P.; Akkus, Z.; Kline, T.L. Machine Learning for Medical Imaging. Radiographics 2017, 37, 505–515. [Google Scholar] [CrossRef] [PubMed]
Figure 1. ISH staining of HPV E6/E7 RNA: (A) was normal, (B,C) were LSIL, (D,E) were HSIL, (F) is positive cervical cell line control.
Diagnostics 13 01084 g001
Figure 2. IHC staining of p16INK4A: (A,B) were normal, (CE) were HSIL, (F) was SCC.
Diagnostics 13 01084 g002
Figure 3. IHC staining of Ki–67: (A) was Normal, (B) was LSIL, (C,D) were HSIL, (E,F) were SCC.
Diagnostics 13 01084 g003
Figure 4. IHC staining for cortactin: (A) (weak cytoplasmic, normal cortactin expression) and (B) (negative) were normal. (CF) were HSIL (positive cytoplasmic overexpression).
Diagnostics 13 01084 g004
Table 1. Characteristics of the samples.
Group 1
(233 Cases)
Group 2
(130 Cases)
Total
(363 Cases)
p-Value
Age (years)Mean46.1445.8946.050.835 *
SD10.8111.2110.93
Age groups (years)19–3011 (4.72%)10 (7.69%)21(5.78%)
31–4056 (24.03%)28 (21.53%)84 (23.14%)
41–5094 (40.34%)43 (33.07%)137 (37.74%)
51–6054 (23.17%)38 (29.23%)92 (25.34%)
>6019 (8.15%)11(8.46%)29 (7.98%)
Pathological gradesNormal156 (66.95%)55 (42.30%)211 (58.12%)
LSIL34 (14.59%)31 (23.84%)65 (17.90%)
HSIL24 (10.30%)34 (26.15%)58 (15.97%)
SCC19 (8.15%)10 (7.69%)29 (7.98%)
Note: * Student t-test, Group 1 = test sample set, Group 2 = confirmed sample set.
Table 2. Criteria for distinguishing positive and negative IHC statuses.
BiomarkersPattern of ExpressionInterpretation
p16INK4A(1) Staining was assessed as strong positive (block positive) according to the amount of uniform strong positive staining in the cytoplasm and nucleus in ~1/3 to 3/3 thickness, signal strength (which would appear as a dark brown color), and diffusion (the signal involved >50% of the epithelium).“Positive”
(2) Positive ambiguous results were further grouped into three patterns:
(2.1) Strong/basal (strong, diffuse, continuous staining of the lower third of the epithelium without upward extension).
(2.2) Weak/diffuse (weak, diffuse, discontinuous staining reaching at least two third of the epithelium).
(2.3) Strong/focal (strong, focal, and discontinuous staining located at any level of the epithelium).
“Positive”
(3) Negative results were defined as either the total absence of staining or weak, focal, and discontinuous staining.“Negative”
Ki–67Negative Ki–67 staining was defined as either the total absence of staining or weak basal staining.“Negative”
Cortactin(1) Negative, weak cytoplasmic and/or nuclear staining.
(2) Weak focal staining in the cytoplasm or nucleus (heterogeneous).
“Negative”
“Normal cortactin expression”
(3) Uniformly strong cytoplasmic staining, “positive cytoplasmic overexpression,” or strong focal staining in the cytoplasm or nucleus (heterogeneous).
(4) Uniform strong cytoplasmic staining, focal nuclear staining, and “positive nuclear and cytoplasmic overexpression”.
(5) Strong cytoplasmic membrane staining.
“Positive”
Note: IHC = immunohistochemistry.
Table 3. Correlation between the pathological grades and IHC staining results (positive/negative status and mean ± SD Allred score).
Biomarkers NNormal
(211 Cases)
LSIL
(65 Cases)
HSIL
(58 Cases)
SCC
(29 Cases)
Total
(363 Cases)
p–Value
p16INK4AP/NP9 (4.2%)7 (10.8%)40 (69.0%)28 (96.6%)103 (28.4%)0.000 *
N202 (95.2%)58 (89.2%)18 (31.0%)1 (3.4%)260 (71.6%)
ASMean0.351.464.626.241.700.000 **
SD1.152.252.981.382.70
Ki-67P/NP52 (24.6%)18 (27.7%)50 (86.2%)27 (93.1%)147 (40.5%)0.000 *
N159 (75.4%)47 (72.3%)8 (13.8%)2 (6.9%)216 (59.5%)
ASMean1.12261.29235.22415.96552.19230.000 **
SD1.842.102.191.902.68
CortactinP/NP84 (39.8%)50 (76.9%)46 (79.3%)24 (82.8%)204 (56.2%)0.000 *
N127 (60.2%)15 (23.1%)12 (20.7%)5 (17.2%)159 (43.8%)
ASMean2.744.405.095.653.640.000 **
SD2.362.452.272.682.62
RNA E6/E7 NNormal
(154 cases)
LSIL
(62 cases)
HSIL
(75 cases)
SCC
(29 cases)
Total
(320 cases)
p–Value
P/NP71 (46.1%)49 (79.0%)69 (92.0%)28 (96.6%)217 (67.8%)0.000 *
N83 (53.9%)13 (21.0%)6 (8.0%)1 (3.4%)103 (32.2%)
Note: * Pearson Chi–Square, ** one–way ANOVA, P/N = positive or negative status, AS = Allred score, SD = standard deviation.
Table 4. Sensitivity, specificity, PPV, and NPV of several markers for detecting the pathological grades.
SensitivitySpecificityPPVNPV
LSIL+ * vs. Normal
p16INK4A49968972
Ki-6763756574
Cotactin79605980
RNA E6/E788546781
HSIL+ ** vs. Normal
p16INK4A78948193
Ki-6789755295
Cotactin80513489
RNA E6/E793444593
Note: PPV = Positive predictive value. NPV = Negative predictive value. LSIL+ * indicates cervical lesion grades of LSIL and more severe (HSIL and SCC). HSIL+ ** was cervical lesion grades as HSIL and SCC.
Table 5. Coefficients of the linear regression models (five best models).
ModelUnstandardized CoefficientsSig.Collinearity Statistics
BStd. ErrorToleranceVIF
Model 1(Constant)1.1500.1010.000
p16INK4A AS0.1970.0380.0000.5741.742
Ki–67AS0.2690.0390.0000.5741.742
Model 2(Constant)0.3580.2350.130
Ki–67AS0.2670.0370.0000.5741.742
p16INK4A P/N0.1720.0370.0000.5551.801
CortactinP/N0.5700.1540.0000.9381.066
Model 3(Constant)−0.3460.3140.272
Ki–67 AS0.2450.0370.0000.5561.799
p16INK4A AS0.1520.0360.0000.5391.854
CortactinP/N0.5570.1500.0000.9371.067
RNA E6/E7 P/N0.5180.1590.0010.8411.189
Model 4(Constant)0.5350.5060.292
Ki–67AS0.3870.0740.0000.1347.446
p16INK4A AS0.1420.0360.0000.5311.883
CortactinP/N0.5300.1480.0000.9311.074
RNA E6/E7 P/N0.5060.1570.0020.8401.190
Ki-67 P/N−0.7860.3560.0290.1666.040
Model 5(Constant)0.9200.5340.087
Ki–67AS0.3870.0730.0000.1347.446
p16INK4A AS0.1390.0360.0000.5301.886
CortactinP/N0.5390.1470.0000.9301.075
RNA E6/E7 P/N0.5170.1550.0010.8391.191
Ki–67P/N−0.7470.3530.0360.1656.057
Age groups−0.1530.0730.0390.9871.014
Note: P/N = positive or negative status, AS = Allred scored, B = regression coefficient, Std. Error = Standard Error, VIF = variance inflation factor.
Table 6. Equations of the linear regression models for calculating the expected value.
ModelEquations
Model 1Y = 1.150 + 0.197 (p16INK4A AS) + 0.269 (Ki–67AS)
Model 2Y = −0.358+ 0.267 (Ki–67AS) + 0.172 (p16INK4A P/N) + 0.570 (CortactinP/N)
Model 3Y = −0.346 + 0.245 (Ki–67AS) + 0.152 (p16INK4AAS) + 0.557 (CortactinP/N) + 0.518 (RNA E6/E7 P/N)
Model 4Y = 0.535 + 0.387 (Ki–67AS) + 0.142 (p16INK4A AS) + 0.530 (CortactinP/N) + 0.506 (RNA E6/E7 P/N) − 0.786 (Ki–67 P/N)
Model 5Y = 0.920 + 0.387 (Ki–67 AS) + 0.139 (p16INK4A AS) + 0.539 (Cortactin P/N) + 0.517 (RNA E6/E7 P/N) − 0.747 (Ki–67 P/N) − 0.153 (Age groups)
Note: P/N = positive or negative status, AS = Allred scored. Means of the expected values from five linear regression models in clinical pathological grades (each sample) of confirmed sample sets were shown in Supplementary Figure S5.
Table 7. Means and SDs of the expected values from the linear regression models and clinical pathological grades of the test and confirmed sample sets.
Test Sample SetConfirmed Sample Set
NMeanSDp–ValueNMeanSDp–Value
Model 1Normal1561.49130.533910.000551.61460.58640.000
LSIL341.64020.87461 311.94500.8526
HSIL243.43011.01324 343.49061.0748
SCC193.99610.39674 103.96190.7745
Total2331.91701.06639 1302.36461.2106
Model 2Normal1560.85890.499710.000551.09390.70410.000
LSIL341.00080.63920 311.38920.7130
HSIL242.34300.73615 342.35410.7170
SCC192.63920.33303 102.56780.7772
Total2331.17700.82221 1301.60730.9170
Model 3Normal1561.20440.654800.000551.20690.86860.000
LSIL341.48431.10780 312.19600.9162
HSIL243.53741.01427 343.30831.1946
SCC193.95160.41838 103.96860.7087
Total2331.70961.22683 1302.20481.3778
Model 4Normal1561.43160.730410.000551.78650.92710.000
LSIL341.65420.98381 312.02581.1043
HSIL243.62261.23028 343.83661.1726
SCC194.23010.52538 104.21661.2110
Total2331.91801.25429 1302.56671.4364
Model 5Normal1561.20140.627990.000551.18620.85200.000
LSIL341.47281.08656 312.23050.9044
HSIL243.55541.10289 343.37331.2589
SCC194.02820.45701 103.94810.7920
Total2331.71401.24210 1302.21971.4076
Note: one–way ANOVA.
Table 8. Sensitivity, specificity, PPV, and NPV of the pathological grade in Models 3 to 5 in the confirmed sample set.
Risk Biomolecules Prediction Precancerous Lesion Prediction
LSIL Group (Normal + LSIL) vs. HSIL LSIL Group (Normal + LSIL) vs. HSIL
SensitivitySpecificityPPVNPVORSensitivitySpecificityPPVNPVOR
Model 36884628710.85997878639.5
Model 48573569315.97194838938.8
Model 5688361879.95697868435.0
Note: PPV = Positive predictive value, NPV = Negative predictive value, OR = odds ratio.
Disclaimer/Publisher’s Note: The statements, opinions and data contained in all publications are solely those of the individual author(s) and contributor(s) and not of MDPI and/or the editor(s). MDPI and/or the editor(s) disclaim responsibility for any injury to people or property resulting from any ideas, methods, instructions or products referred to in the content.

