

Metabolic Dysfunction-Associated Fatty Liver Disease in Taiwanese Patients with Inflammatory Bowel Disease: A Study in Patients with Clinical Remission
 , , and
Abstract
:1. Introduction
2. Materials and Methods
2.1. Inclusion Criteria
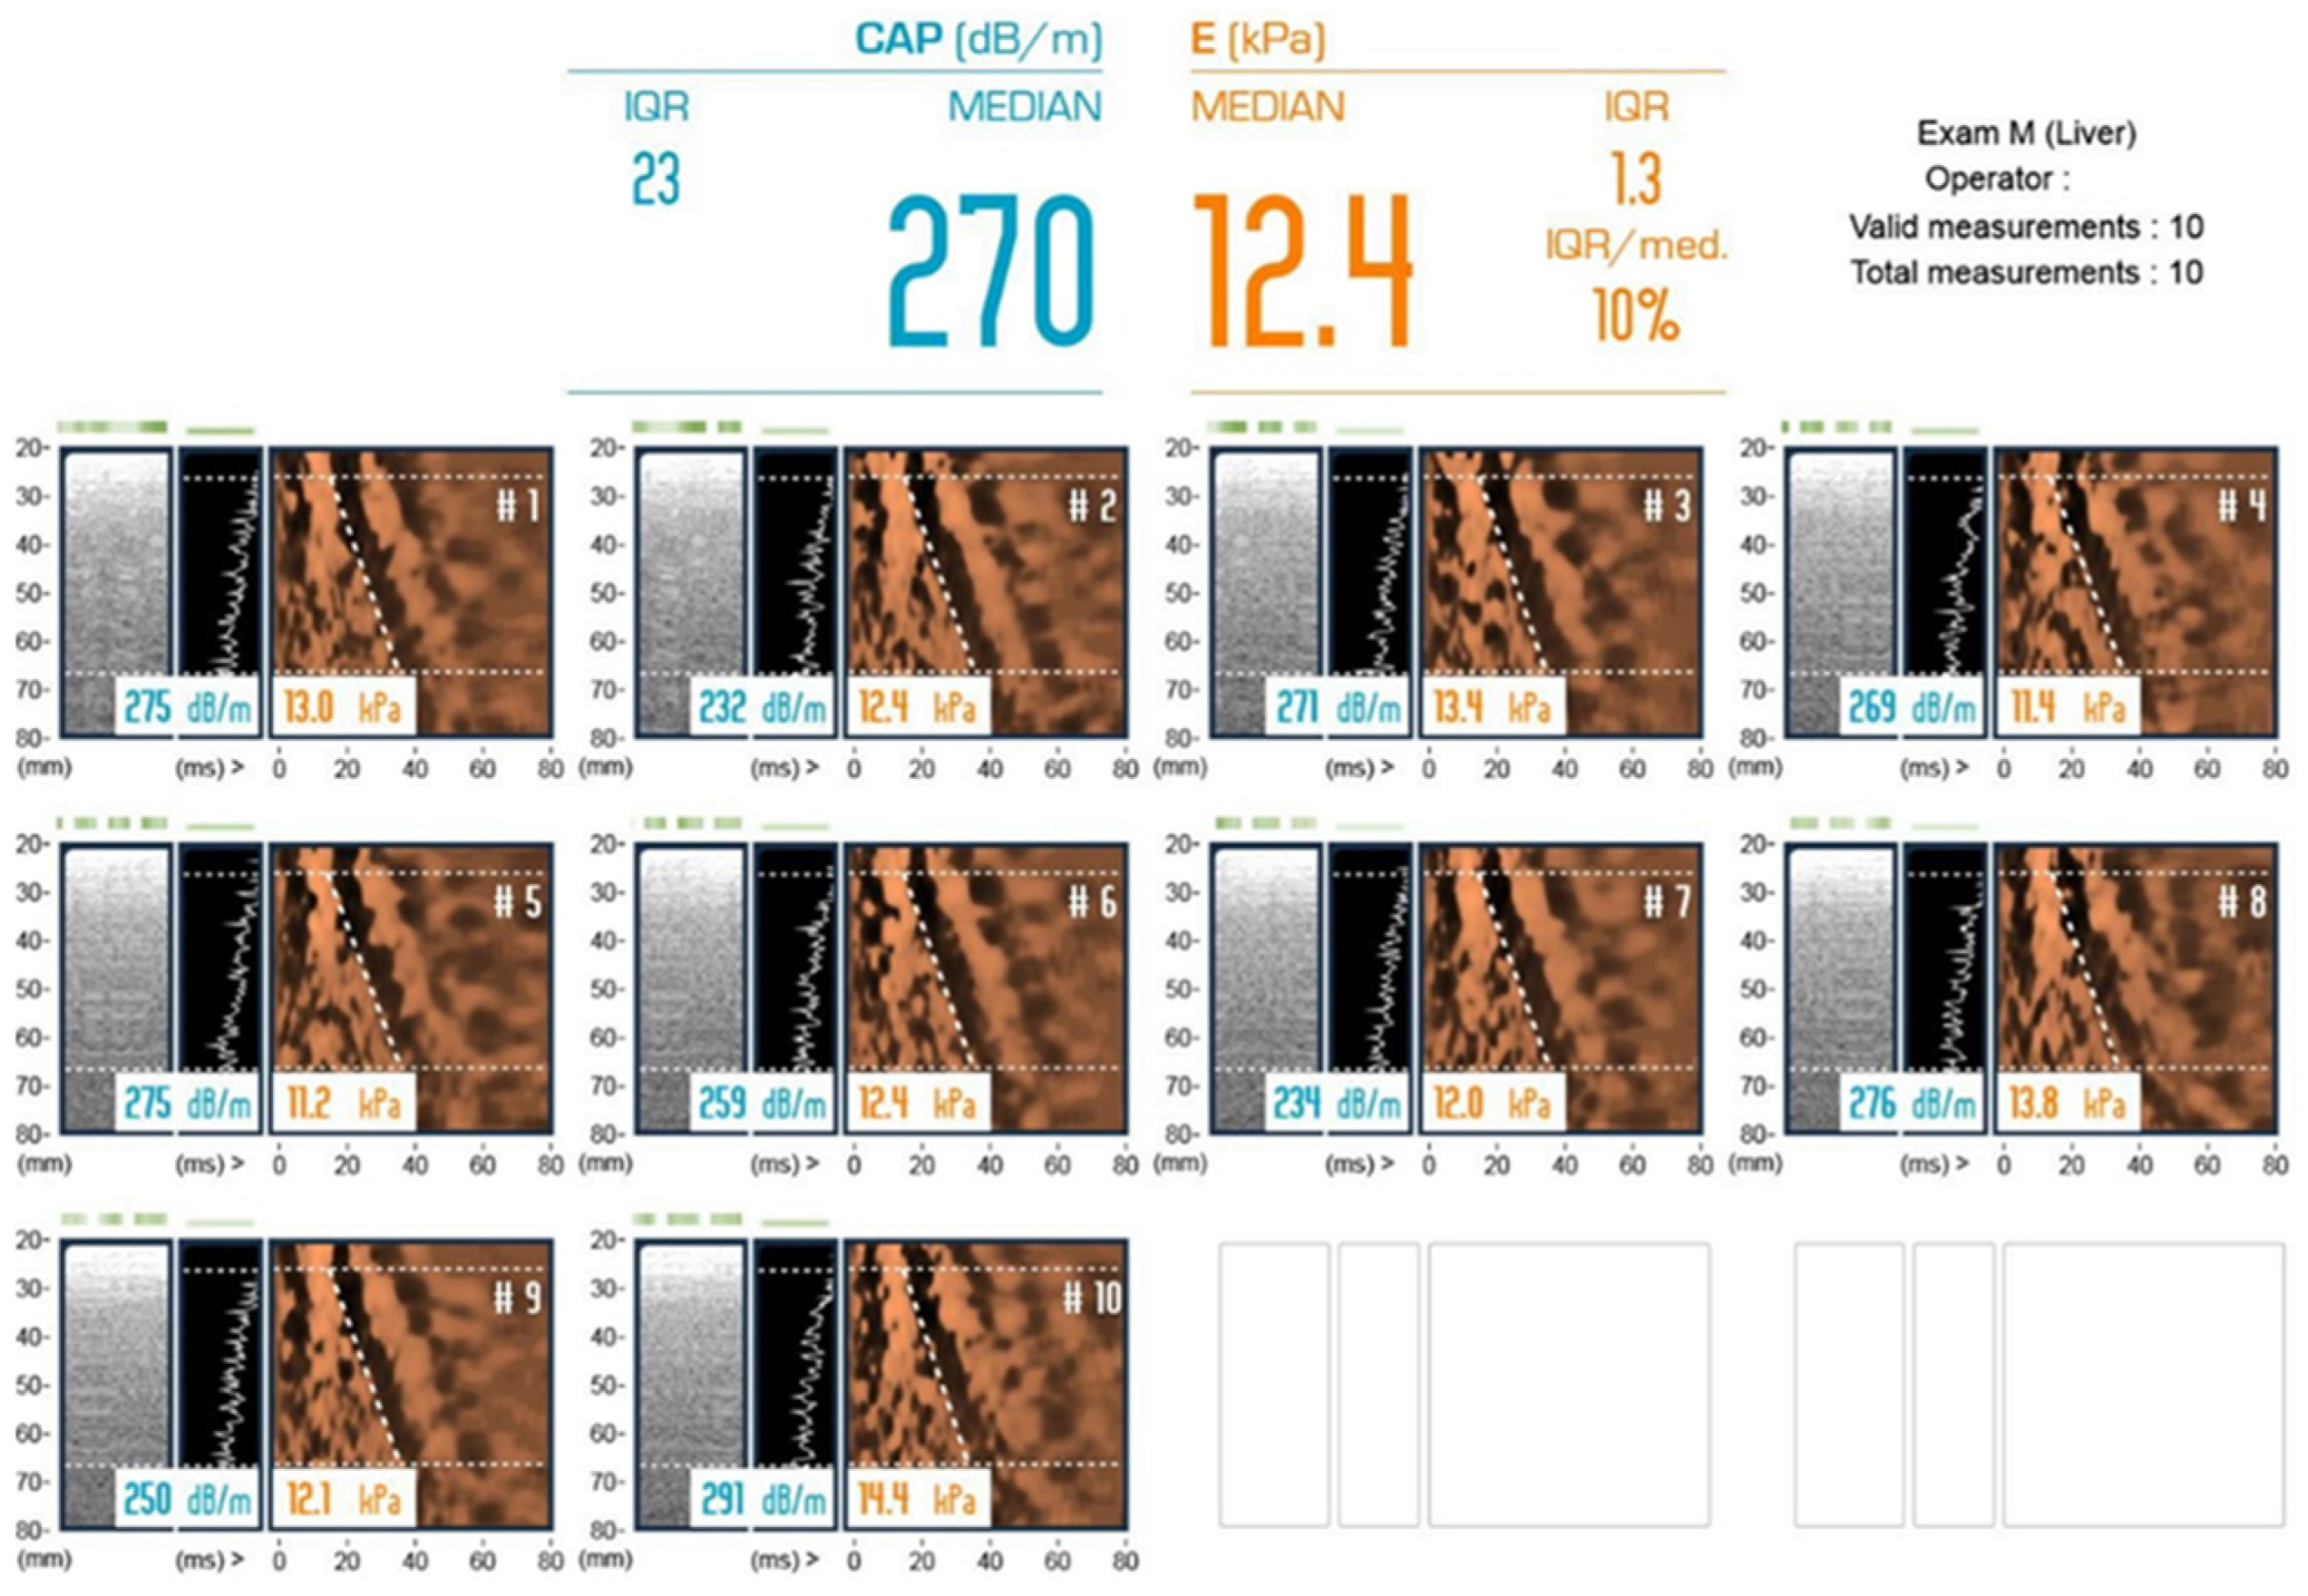
2.2. Metabolic Dysfunction-Associated Fatty Liver Diseases
2.3. Statistical Analysis
3. Results
3.1. Baseline Characteristics of IBD, including CD and UC
3.2. Comparison of MAFLD with Non-MAFLD
3.3. Multivariate Analysis of Factors Associated with MAFLD
3.4. Factors Associated with Significant Fibrosis
4. Discussion
5. Conclusions
Author Contributions
Funding
Institutional Review Board Statement
Informed Consent Statement
Data Availability Statement
Conflicts of Interest
References
- Guan, Q. A Comprehensive Review and Update on the Pathogenesis of Inflammatory Bowel Disease. J. Immunol. Res. 2019, 2019, 7247238. [Google Scholar] [CrossRef]
- Ng, S.C.; Bernstein, C.N.; Vatn, M.H.; Lakatos, P.L.; Loftus, E.V.; Tysk, C.; O’Morain, C.; Moum, B.; Colombel, J.F. Geographical variability and environmental risk factors in inflammatory bowel disease. Gut 2013, 62, 630–649. [Google Scholar] [CrossRef]
- Yen, H.H.; Weng, M.T.; Tung, C.C.; Wang, Y.T.; Chang, Y.T.; Chang, C.H.; Shieh, M.J.; Wong, J.M.; Wei, S.C. Epidemiological trend in inflammatory bowel disease in Taiwan from 2001 to 2015: A nationwide populationbased study. Intest. Res. 2019, 17, 54–62. [Google Scholar] [CrossRef]
- Ong, J.; Alswat, K.; Hamid, S.; El-Kassas, M. Nonalcoholic Fatty Liver Disease in Asia, Africa, and Middle East Region. Clin. Liver Dis. 2023, 27, 287–299. [Google Scholar] [CrossRef]
- Zou, Z.Y.; Shen, B.; Fan, J.G. Systematic Review with Meta-analysis: Epidemiology of Nonalcoholic Fatty Liver Disease in Patients with Inflammatory Bowel Disease. Inflamm. Bowel Dis. 2019, 25, 1764–1772. [Google Scholar] [CrossRef]
- Adams, L.A.; Lymp, J.F.; St Sauver, J.; Sanderson, S.O.; Lindor, K.D.; Feldstein, A.; Angulo, P. The natural history of nonalcoholic fatty liver disease: A population-based cohort study. Gastroenterology 2005, 129, 113–121. [Google Scholar] [CrossRef]
- Eslam, M.; Newsome, P.N.; Sarin, S.K.; Anstee, Q.M.; Targher, G.; Romero-Gomez, M.; Zelber-Sagi, S.; Wong, V.W.S.; Dufour, J.F.; Schattenberg, J.M.; et al. A new definition for metabolic dysfunction-associated fatty liver disease: An international expert consensus statement. J. Hepatol. 2020, 73, 202–209. [Google Scholar] [CrossRef]
- Zamani, M.; Alizadeh-Tabari, S.; Singh, S.; Loomba, R. Meta-analysis: Prevalence of, and risk factors for, non-alcoholic fatty liver disease in patients with inflammatory bowel disease. Aliment. Pharmacol. Ther. 2022, 55, 894–907. [Google Scholar] [CrossRef]
- Sourianarayanane, A.; Garg, G.; Smith, T.H.; Butt, M.I.; McCullough, A.J.; Shen, B. Risk factors of non-alcoholic fatty liver disease in patients with inflammatory bowel disease. J. Crohn’s Colitis 2013, 7, e279–e285. [Google Scholar] [CrossRef]
- Yen, H.H.; Su, P.Y.; Huang, S.P.; Wu, L.; Hsu, T.C.; Zeng, Y.H.; Chen, Y.Y. Evaluation of non-alcoholic fatty liver disease in patients with inflammatory bowel disease using controlled attenuation parameter technology: A Taiwanese retrospective cohort study. PLoS ONE 2021, 16, e0252286. [Google Scholar] [CrossRef]
- Principi, M.; Iannone, A.; Losurdo, G.; Mangia, M.; Shahini, E.; Albano, F.; Rizzi, S.F.; La Fortezza, R.F.; Lovero, R.; Contaldo, A.; et al. Nonalcoholic Fatty Liver Disease in Inflammatory Bowel Disease: Prevalence and Risk Factors. Inflamm. Bowel Dis. 2018, 24, 1589–1596. [Google Scholar] [CrossRef] [PubMed]
- Haas, L.; Chevalier, R.; Major, B.T.; Enders, F.; Kumar, S.; Tung, J. Biologic Agents Are Associated with Excessive Weight Gain in Children with Inflammatory Bowel Disease. Dig. Dis. Sci. 2017, 62, 3110–3116. [Google Scholar] [CrossRef] [PubMed]
- Magrì, S.; Paduano, D.; Chicco, F.; Cingolani, A.; Farris, C.; Delogu, G.; Tumbarello, F.; Lai, M.; Melis, A.; Casula, L.; et al. Nonalcoholic fatty liver disease in patients with inflammatory bowel disease: Beyond the natural history. World J. Gastroenterol. 2019, 25, 5676–5686. [Google Scholar] [CrossRef]
- Lapumnuaypol, K.; Kanjanahattakij, N.; Pisarcik, D.; Thongprayoon, C.; Wijarnpreecha, K.; Cheungpasitporn, W. Effects of inflammatory bowel disease treatment on the risk of nonalcoholic fatty liver disease: A meta-analysis. Eur. J. Gastroenterol. Hepatol. 2018, 30, 854–860. [Google Scholar] [CrossRef]
- Wong, V.W.; Vergniol, J.; Wong, G.L.; Foucher, J.; Chan, H.L.; Le Bail, B.; Choi, P.C.; Kowo, M.; Chan, A.W.; Merrouche, W.; et al. Diagnosis of fibrosis and cirrhosis using liver stiffness measurement in nonalcoholic fatty liver disease. Hepatology 2010, 51, 454–462. [Google Scholar] [CrossRef]
- Wong, V.W.; Adams, L.A.; de Lédinghen, V.; Wong, G.L.; Sookoian, S. Noninvasive biomarkers in NAFLD and NASH—Current progress and future promise. Nat. Rev. Gastroenterol. Hepatol. 2018, 15, 461–478. [Google Scholar] [CrossRef]
- Dasarathy, S.; Dasarathy, J.; Khiyami, A.; Joseph, R.; Lopez, R.; McCullough, A.J. Validity of real time ultrasound in the diagnosis of hepatic steatosis: A prospective study. J. Hepatol. 2009, 51, 1061–1067. [Google Scholar] [CrossRef]
- Consultation, W.E. Appropriate body-mass index for Asian populations and its implications for policy and intervention strategies. Lancet 2004, 363, 157–163. [Google Scholar] [CrossRef]
- Sagami, S.; Ueno, Y.; Tanaka, S.; Fujita, A.; Hayashi, R.; Oka, S.; Hyogo, H.; Chayama, K. Significance of non-alcoholic fatty liver disease in Crohn’s disease: A retrospective cohort study. Hepatol. Res. 2017, 47, 872–881. [Google Scholar] [CrossRef]
- Li, D.; Lu, C.; Yu, C. High incidence of non-alcoholic fatty liver disease in patients with Crohn’s disease but not ulcerative colitis. Int. J. Clin. Exp. Pathol. 2017, 10, 10633–10639. [Google Scholar]
- Hyun, H.K.; Lee, H.W.; Park, J.; Park, S.J.; Park, J.J.; Kim, T.I.; Lee, J.S.; Kim, B.K.; Park, J.Y.; Kim, D.Y.; et al. Hepatic Steatosis but Not Fibrosis Is Independently Associated with Poor Outcomes in Patients with Inflammatory Bowel Disease. Gut Liver 2023. Epub ahead of print. [Google Scholar] [CrossRef]
- Chen, Y.Y.; Lin, C.Y.; Yen, H.H.; Su, P.Y.; Zeng, Y.H.; Huang, S.P.; Liu, I.L. Machine-Learning Algorithm for Predicting Fatty Liver Disease in a Taiwanese Population. J. Pers. Med. 2022, 12, 1026. [Google Scholar] [CrossRef]
- Flores, A.; Burstein, E.; Cipher, D.J.; Feagins, L.A. Obesity in Inflammatory Bowel Disease: A Marker of Less Severe Disease. Dig. Dis. Sci. 2015, 60, 2436–2445. [Google Scholar] [CrossRef] [PubMed]
- Saroli Palumbo, C.; Restellini, S.; Chao, C.Y.; Aruljothy, A.; Lemieux, C.; Wild, G.; Afif, W.; Lakatos, P.L.; Bitton, A.; Cocciolillo, S.; et al. Screening for Nonalcoholic Fatty Liver Disease in Inflammatory Bowel Diseases: A Cohort Study Using Transient Elastography. Inflamm. Bowel Dis. 2019, 25, 124–133. [Google Scholar] [CrossRef] [PubMed]
- Yki-Järvinen, H. Non-alcoholic fatty liver disease as a cause and a consequence of metabolic syndrome. Lancet Diabetes Endocrinol. 2014, 2, 901–910. [Google Scholar] [CrossRef] [PubMed]
- Rodriguez-Duque, J.C.; Calleja, J.L.; Iruzubieta, P.; Hernández-Conde, M.; Rivas-Rivas, C.; Vera, M.I.; Garcia, M.J.; Pascual, M.; Castro, B.; García-Blanco, A.; et al. Increased risk of MAFLD and Liver Fibrosis in Inflammatory Bowel Disease Independent of Classic Metabolic Risk Factors. Clin. Gastroenterol. Hepatol. 2023, 21, 406–414.e407. [Google Scholar] [CrossRef]
- Veltkamp, C.; Lan, S.; Korompoki, E.; Weiss, K.H.; Schmidt, H.; Seitz, H.K. Hepatic Steatosis and Fibrosis in Chronic Inflammatory Bowel Disease. J. Clin. Med. 2022, 11, 2623. [Google Scholar] [CrossRef]
- Ritaccio, G.; Stoleru, G.; Abutaleb, A.; Cross, R.K.; Shetty, K.; Sakiani, S.; Wong, U. Nonalcoholic Fatty Liver Disease Is Common in IBD Patients However Progression to Hepatic Fibrosis by Noninvasive Markers Is Rare. Dig. Dis. Sci. 2021, 66, 3186–3191. [Google Scholar] [CrossRef]
- Bessissow, T.; Le, N.H.; Rollet, K.; Afif, W.; Bitton, A.; Sebastiani, G. Incidence and Predictors of Nonalcoholic Fatty Liver Disease by Serum Biomarkers in Patients with Inflammatory Bowel Disease. Inflamm. Bowel Dis. 2016, 22, 1937–1944. [Google Scholar] [CrossRef]
- Yen, H.-H.; Hsu, Y.-C.; Kuo, C.-H.; Hsu, T.-C.; Chen, Y.-Y. Real-world experience of adalimumab therapy for patients with ulcerative colitis: A single tertiary medical center experience in Central Taiwan. Adv. Dig. Med. 2023, 10, 28–33. [Google Scholar] [CrossRef]


| Variable | All Patients (120) | CD (45) | UC (75) | p-Value |
|---|---|---|---|---|
| Gender, Male, n (%) | 81 (67.5%) | 33 (73.3%) | 48 (64.0%) | 0.291 |
| Age, year, Median (IQR) | 43.5 (34–53.5) | 37 (29–52) | 45 (37–54) | 0.089 |
| BMI, kg/m2, Median (IQR) | 22.6 (20.3–25.8) | 22.7 (20–25.7) | 22.6 (20.8–26.3) | 0.584 |
| AC, cm, Median (IQR) | 81 (74–89) | 82.5 (74–88) | 81 (74.5–89.5) | 0.807 |
| Weight, Class n (%) | 0.483 | |||
| Underweight | 12 (10.0%) | 5 (11.1%) | 7 (9.3%) | |
| Normal weight | 51 (42.5%) | 18 (40.0%) | 33 (44.0%) | |
| Overweight | 40 (33.3%) | 18 (40.0%) | 22 (29.3%) | |
| Obesity | 17 (14.2%) | 4 (8.9%) | 13 (17.3%) | |
| IBD Duration, year, Median (IQR) | 4.1 (1.4–7.5) | 3.4 (2–6.1) | 4.7 (1.3–9.4) | 0.443 |
| HTN, n (%) | 17 (14.2%) | 5 (11.1%) | 12 (16.0%) | 0.457 |
| T2DM, n (%) | 7 (5.8%) | 3 (6.7%) | 4 (5.3%) | 1.000 |
| CHB, n (%) | 15 (12.5%) | 6 (13.3%) | 9 (12.0%) | 0.831 |
| CHC, n (%) | 3 (2.5%) | 1 (2.2%) | 2 (2.7%) | 1.000 |
| GB Stone, n (%) | 17 (14.2%) | 12 (26.7%) | 5 (6.7%) | 0.002 |
| Bowel resection history, n (%) | 23 (19.2%) | 21 (46.7%) | 2 (2.7%) | <0.001 |
| WBC count, ×103/μL, Median (IQR) | 6 (4.9–7.5) | 6 (5–7.5) | 6 (4.8–7.5) | 0.519 |
| Neutrophil-to-Lymphocyte ratio, Mean ± SD | 2.87 ± 1.96 | 3.42 ± 2.3 | 2.53 ± 1.65 | 0.027 |
| Hb, g/dL, Median (IQR) | 13.8 (12.5–14.6) | 13.4 (11.7–14.4) | 14 (12.7–14.7) | 0.120 |
| Platelet count, ×103/μL, Median (IQR) | 261 (222–319) | 257 (220–330) | 268 (223–311) | 0.597 |
| ESR, mm/h, Median (IQR) | 11 (5–22) | 11 (5–28) | 12 (5–17) | 0.363 |
| Albumin, g/dL, Median (IQR) | 4.4 (4–4.6) | 4.2 (3.9–4.6) | 4.4 (4.1–4.6) | 0.023 |
| AST, U/L, Median (IQR) | 23 (19–28) | 25 (19–29) | 23 (19–28) | 0.552 |
| ALT, U/L, Median (IQR) | 19 (13–28) | 17 (12–27) | 19 (13–29) | 0.295 |
| CRP, mg/dL, Median (IQR) | 0.13 (0.05–0.51) | 0.24 (0.05–1.01) | 0.12 (0.05–0.28) | 0.045 |
| Creatinine, mg/dL, Mean ± SD | 0.81 ± 0.2 | 0.83 ± 0.19 | 0.8 ± 0.2 | 0.414 |
| Cholesterol, mg/dL, Mean ± SD | 166 ± 38 | 151 ± 37 | 174 ± 37 | 0.005 |
| TG, mg/dL, Median (IQR) | 89 (66–132) | 86 (62–129) | 90 (69–135) | 0.429 |
| HDL-C, mg/dL, Median (IQR) | 47 (41–60) | 44 (38–63) | 48 (42–58) | 0.571 |
| LDL-C, mg/dL, Mean ± SD | 104 ± 31 | 86 ± 29 | 113 ± 28 | <0.001 |
| ALK-P, U/L, Median (IQR) | 59 (50–72) | 72 (59–79) | 56 (49–65) | 0.003 |
| γ-GT, U/L, Median (IQR) | 16 (12–25) | 16 (12–27) | 17 (12–24) | 0.886 |
| Fasting glucose, mg/dL, Median (IQR) | 94 (89–100) | 94 (89–103) | 93 (89–97) | 0.887 |
| HbA1c, %, Median (IQR) | 5.5 (5.2–5.8) | 5.4 (5.2–5.9) | 5.5 (5.2–5.8) | 0.921 |
| Fasting insulin, μIU/mL, Median (IQR) | 5.46 (3.64–9.22) | 4.86 (2.92–9.22) | 5.51 (3.67–9.92) | 0.533 |
| HOMA-IR, Median (IQR) | 1.29 (0.86–2.23) | 1.09 (0.64–2.14) | 1.3 (0.86–2.5) | 0.458 |
| FIB-4, Median (IQR) | 0.82 (0.55–1.31) | 0.83 (0.53–1.33) | 0.81 (0.57–1.29) | 0.891 |
| LSM, kPa, Median (IQR) | 5.1 (4.2–5.6) | 5.2 (4.1–5.6) | 5.1 (4.2–5.6) | 0.591 |
| CAP, dB/m, Median (IQR) | 217 (190–261) | 216 (171–258) | 217 (196–261) | 0.432 |
| Significant fibrosis, LSM of ≥7.2 kPa, n (%) | 8 (6.7%) | 4 (8.9%) | 4 (5.3%) | 0.471 |
| Variable | All Patients (120) | With MAFLD (35) | Without MAFLD (85) | p-Value |
|---|---|---|---|---|
| Gender, Male, n (%) | 81 (67.5%) | 28 (80.0%) | 53 (62.4%) | 0.061 |
| Age, year, Median (IQR) | 43.5 (34–53.5) | 42 (35–52) | 44 (34–55) | 0.931 |
| BMI, kg/m2, Median (IQR) | 22.6 (20.3–25.8) | 26.3 (25.1–28.6) | 21.5 (19.7–23.5) | <0.001 |
| AC, cm, Median (IQR) | 81 (74–89) | 93 (87–99) | 76 (71–83) | <0.001 |
| Weight Class, n (%) | <0.001 | |||
| Under-weight | 12 (10.0%) | 0 (0.0%) | 12 (14.1%) | 0.018 |
| Normal weight | 51 (42.5%) | 1 (2.9%) | 50 (58.8%) | <0.001 |
| Overweight | 40 (33.3%) | 22 (62.9%) | 18 (21.2%) | <0.001 |
| Obesity | 17 (14.2%) | 12 (34.3%) | 5 (5.9%) | <0.001 |
| IBD type, n (%) | 0.717 | |||
| UC | 75 (62.5%) | 21 (60.0%) | 54 (63.5%) | |
| CD | 45 (37.5%) | 14 (40.0%) | 31 (36.5%) | |
| IBD Duration, year, Median (IQR) | 4.1 (1.4–7.5) | 2.8 (0.6–5.1) | 5.3 (2–9.4) | 0.017 |
| Anti-tumor necrosis factor α, n (%) | 31 (25.8%) | 10 (28.6%) | 21 (24.7%) | 0.660 |
| Vedolizumab, n (%) | 12 (10.0%) | 2 (5.7%) | 10 (11.8%) | 0.505 |
| HTN, n (%) | 17 (14.2%) | 9 (25.7%) | 8 (9.4%) | 0.040 |
| T2DM, n (%) | 7 (5.8%) | 6 (17.1%) | 1 (1.2%) | 0.002 |
| CHB, n (%) | 15 (12.5%) | 4 (11.4%) | 11 (12.9%) | 1.000 |
| CHC, n (%) | 3 (2.5%) | 0 (0.0%) | 3 (3.5%) | 0.555 |
| GB Stone, n (%) | 17 (14.2%) | 7 (20.0%) | 10 (11.8%) | 0.258 |
| Bowel resection history, n (%) | 23 (19.2%) | 10 (28.6%) | 13 (15.3%) | 0.093 |
| WBC count, ×103/μL, Median (IQR) | 6 (4.9–7.5) | 6.9 (5.2–7.7) | 5.7 (4.8–7.2) | 0.090 |
| Neutrophil-to-Lymphocyte ratio, Median (IQR) | 2.2 (1.65–3.38) | 2.31 (1.51–4.11) | 2.2 (1.66–3.28) | 0.670 |
| Hb, g/dL, Median (IQR) | 13.8 (12.5–14.6) | 14.2 (13.4–15) | 13.4 (12.2–14.5) | 0.014 |
| Platelet count, ×103/μL, Median (IQR) | 261 (222–319) | 258 (231–307) | 261 (221–323) | 0.571 |
| ESR, mm/h, Median (IQR) | 11 (5–22) | 11 (6–22) | 12 (5–22) | 0.943 |
| Albumin, g/dL, Median (IQR) | 4.4 (4–4.6) | 4.4 (4.2–4.6) | 4.3 (4–4.5) | 0.061 |
| AST, U/L, Median (IQR) | 23 (19–28) | 26 (19–31) | 23 (19–28) | 0.179 |
| ALT, U/L, Median (IQR) | 19 (13–28) | 24 (15–34) | 17 (12–25) | 0.003 |
| CRP, mg/dL, Median (IQR) | 0.13 (0.05–0.51) | 0.17 (0.09–0.41) | 0.11 (0.04–0.63) | 0.161 |
| Creatinine, mg/dL, Mean ± SD | 0.81 ± 0.2 | 0.91 ± 0.21 | 0.78 ± 0.18 | 0.001 |
| eGFR, mL/min/1.73 m2, Mean ± SD | 100.32 ± 21.14 | 91.37 ± 20 | 103.92 ± 20.61 | 0.004 |
| Cholesterol, mg/dL, Mean ± SD | 166 ± 38 | 174 ± 44 | 162 ± 35 | 0.158 |
| TG, mg/dL, Median (IQR) | 89 (66–132) | 132 (86–185) | 74 (57–111) | <0.001 |
| HDL-C, mg/dL, Median (IQR) | 47 (41–60) | 44 (35–52) | 49 (42–63) | 0.026 |
| LDL-C, mg/dL, Mean ± SD | 104 ± 31 | 117 ± 37 | 98 ± 26 | 0.016 |
| ALK-P, U/L, Median (IQR) | 59 (50–72) | 59 (55–73) | 59 (49–71) | 0.436 |
| γ-GT, U/L, Median (IQR) | 16 (12–25) | 24 (17–49) | 13 (10–21) | <0.001 |
| Fasting glucose, mg/dL, Median (IQR) | 94 (89–100) | 96 (89–106) | 93 (89–97) | 0.154 |
| HbA1c, %, Median (IQR) | 5.5 (5.2–5.8) | 5.6 (5.3–5.9) | 5.4 (5.2–5.8) | 0.250 |
| Fasting insulin, μIU/mL, Median (IQR) | 5.46 (3.64–9.22) | 8.47 (5.56–14.17) | 3.94 (3.38–6.86) | 0.001 |
| HOMA-IR, Median (IQR) | 1.29 (0.86–2.23) | 1.91 (1.3–3.09) | 0.9 (0.77–1.76) | 0.003 |
| FIB-4, Median (IQR) | 0.82 (0.55–1.31) | 0.8 (0.52–1.31) | 0.83 (0.57–1.25) | 0.874 |
| LSM, kPa, Median (IQR) | 5.1 (4.2–5.6) | 5.3 (4.7–6.1) | 4.9 (4.1–5.6) | 0.024 |
| CAP, dB/m, Median (IQR) | 217 (190–261) | 286 (263–323) | 201 (177–220) | <0.001 |
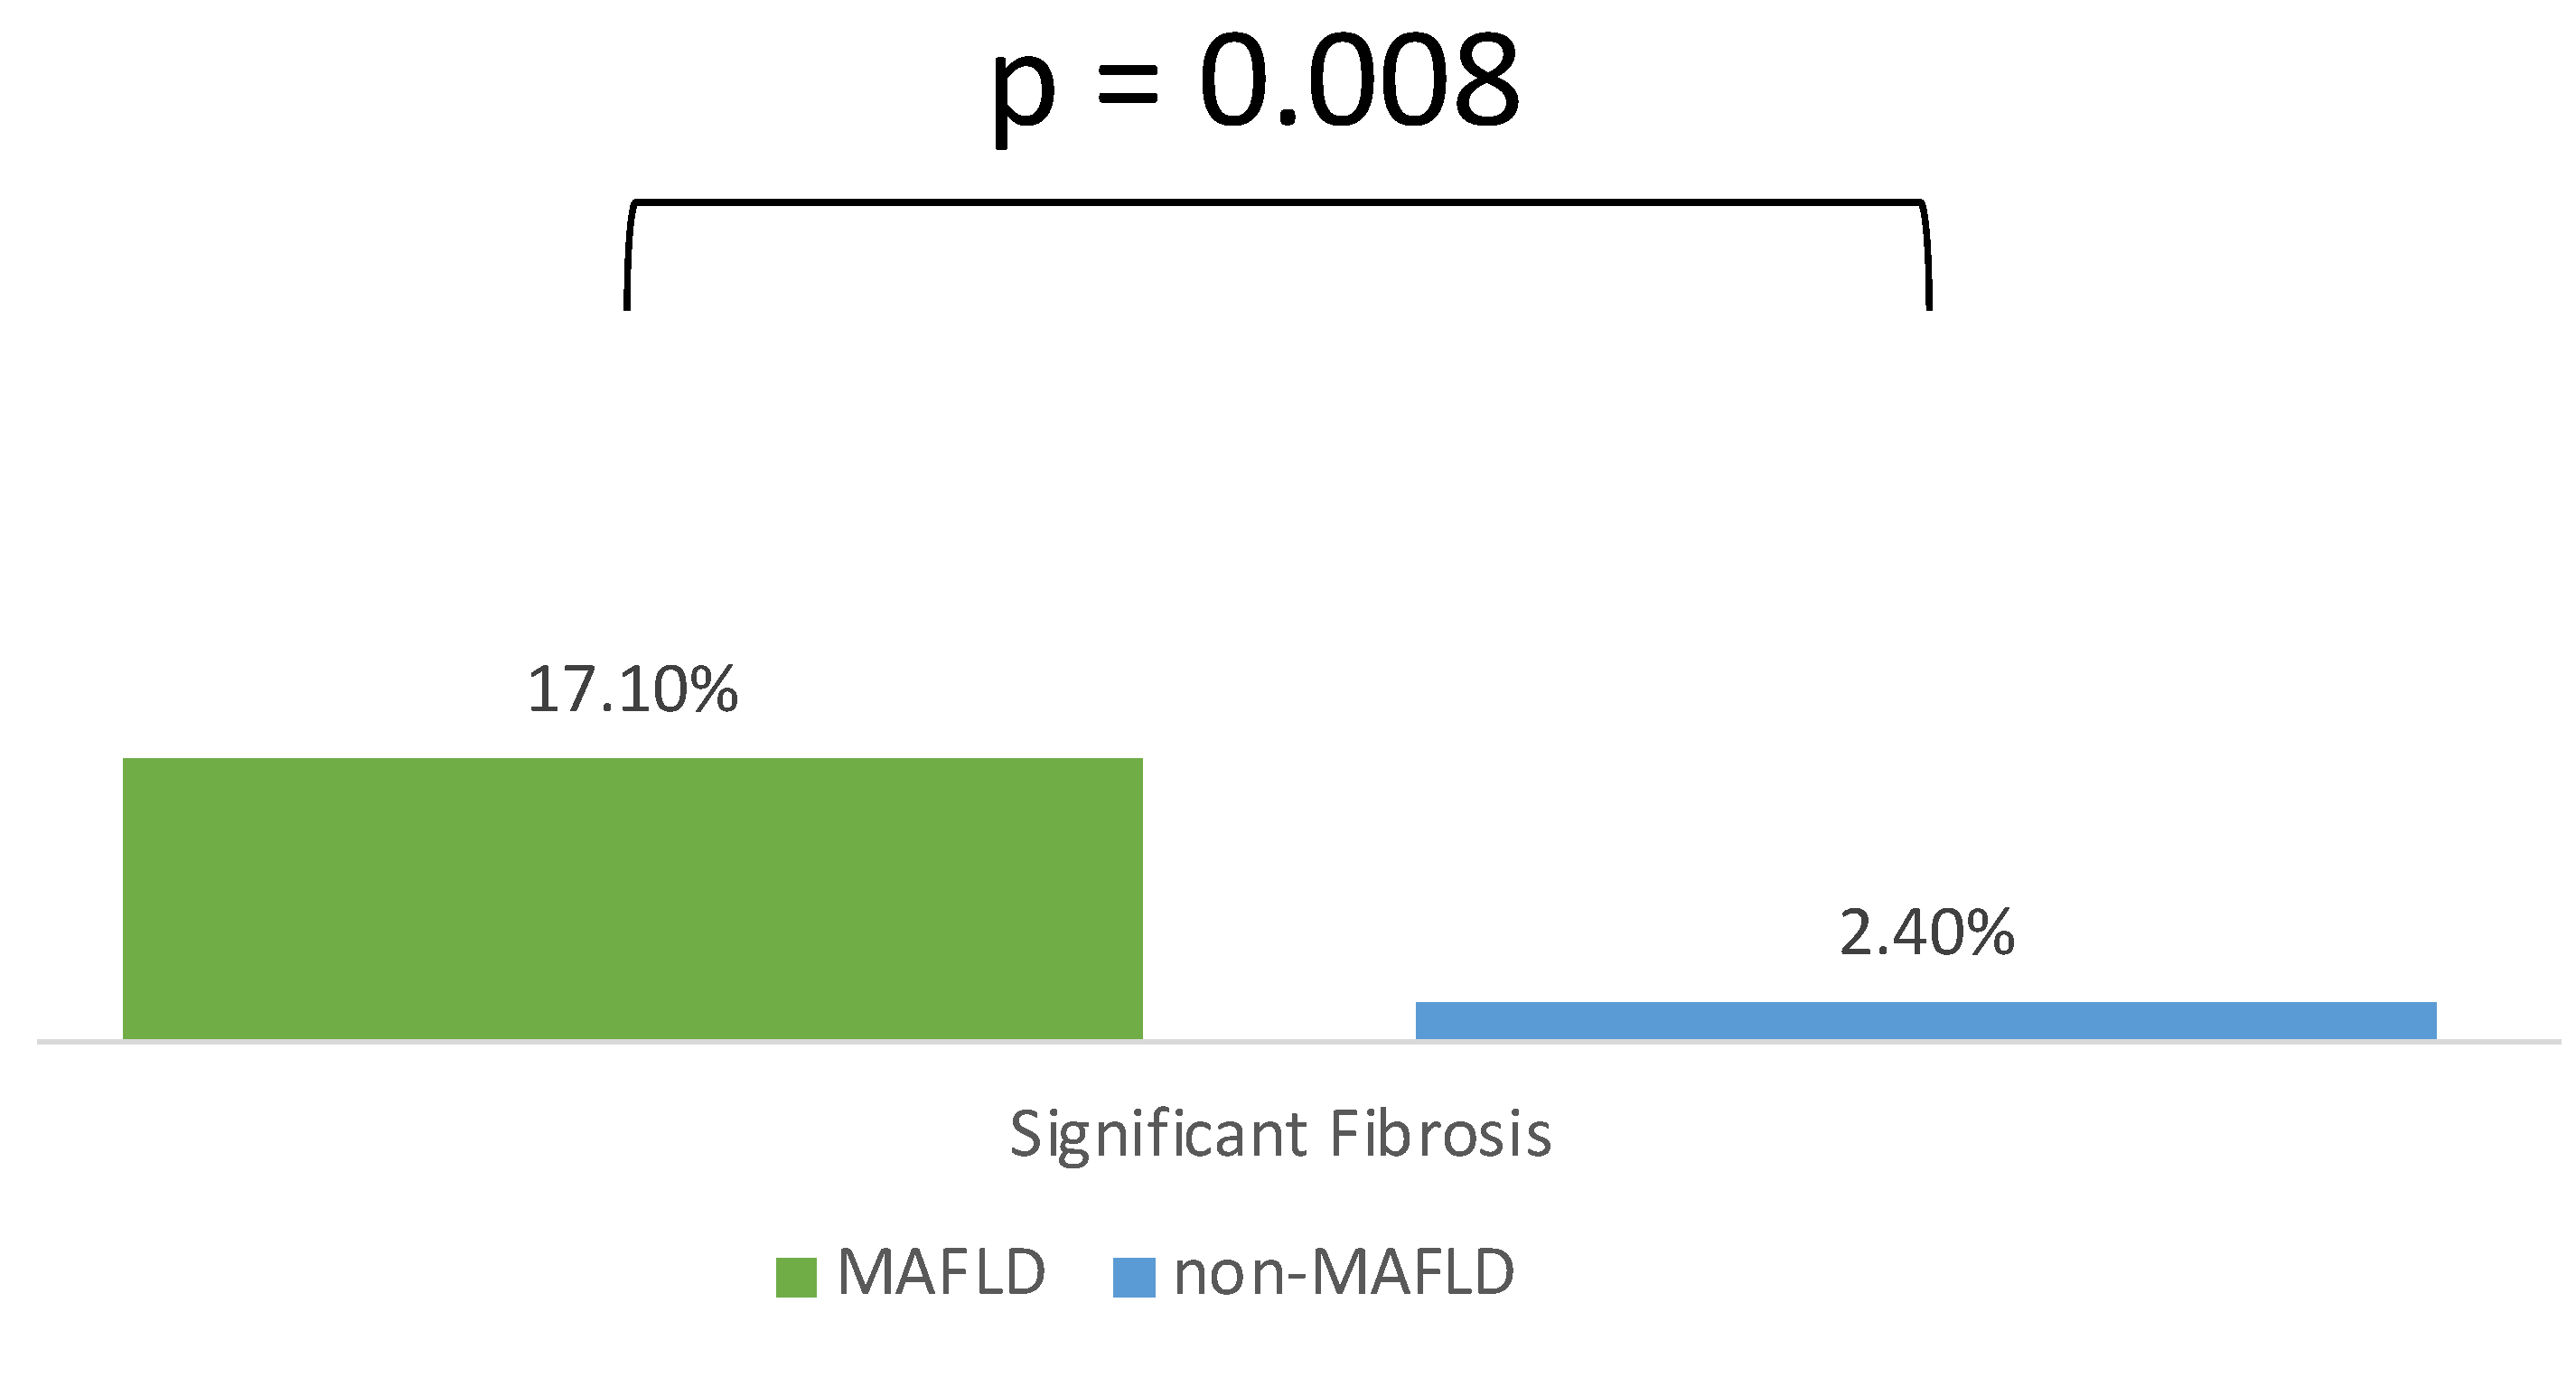
| Significant fibrosis | 8 (6.7%) | 6 (17.1%) | 2 (2.4%) | 0.008 |
| Variables | Crude OR | p-Value | Adjusted OR | p-Value |
|---|---|---|---|---|
| Gender, Male | 2.42 (0.95, 6.17) | 0.065 | - | - |
| IBD Duration | 0.92 (0.85, 1.01) | 0.078 | - | - |
| Bowel resection history | 2.22 (0.86, 5.68) | 0.098 | - | - |
| WBC count, ×103/μL | 1.16 (0.98, 1.38) | 0.081 | - | - |
| Hb, g/dL | 1.33 (1.05, 1.69) | 0.020 | 1.91 (1.17, 3.13) | 0.010 |
| Albumin, g/dL | 2.72 (0.99, 7.46) | 0.052 | - | - |
| ALT, U/L | 1.02 (1, 1.05) | 0.060 | - | - |
| eGFR, mL/min/1.73 m2 | 0.97 (0.95, 0.99) | 0.005 | - | - |
| LDL-C, mg/dL | 1.02 (1, 1.04) | 0.021 | - | - |
| γ-GT, U/L | 1.09 (1.04, 1.15) | 0.001 | 1.11 (1.02, 1.21) | 0.013 |
| Significant fibrosis, LSM of ≥7.2 kPa, n (%) | 8.59 (1.64, 44.94) | 0.011 | 31.25 (1.2, 815.55) | 0.039 |
| Variable | MAFLD (35) | Significant Fibrosis (6) | Nonsignificant Fibrosis (29) | p-Value |
|---|---|---|---|---|
| Gender, Male, n (%) | 28 (80.0%) | 5 (83.3%) | 23 (79.3%) | 1.000 |
| Age, year, Median (IQR) | 42 (35–52) | 58.5 (52–64) | 40 (35–48) | 0.004 |
| BMI, kg/m2, Median (IQR) | 26.3 (25.1–28.6) | 26.4 (25.2–27.8) | 26.3 (25.1–28.6) | 0.983 |
| AC, cm, Median (IQR) | 93 (87–99) | 96.5 (93–99) | 90 (86–99) | 0.213 |
| IBD disease type, n (%) | 0.664 | |||
| UC | 21 (60.0%) | 3 (50.0%) | 18 (62.1%) | |
| CD | 14 (40.0%) | 3 (50.0%) | 11 (37.9%) | |
| IBD Duration, year, Median (IQR) | 2.8 (0.6–5.1) | 4.9 (3.4–5.7) | 1.6 (0.6–4.8) | 0.051 |
| Anti-tumor necrosis factor α, n (%) | 10 (28.6%) | 3 (50.0%) | 7 (24.1%) | 0.322 |
| Vedolizumab, n (%) | 2 (5.7%) | 1 (16.7%) | 1 (3.4%) | 0.318 |
| HTN, n (%) | 9 (25.7%) | 3 (50.0%) | 6 (20.7%) | 0.162 |
| T2DM, n (%) | 6 (17.1%) | 3 (50.0%) | 3 (10.3%) | 0.049 |
| Bowel resection history, n (%) | 10 (28.6%) | 3 (50.0%) | 7 (24.1%) | 0.322 |
| Platelet count, ×103/μL, Median (IQR) | 258 (231–307) | 195 (91–279) | 261 (237–311) | 0.049 |
| AST, U/L, Median (IQR) | 26 (19–31) | 33 (21–36) | 25 (19–28) | 0.128 |
| ALT, U/L, Median (IQR) | 24 (15–34) | 36 (26–50) | 23 (15–32) | 0.057 |
| HOMA-IR, Median (IQR) | 1.91 (1.3–3.09) | 3.88 (3.88–3.88) | 1.9 (1.3–3.05) | 0.400 |
| CAP, dB/m, Median (IQR) | 286 (263–323) | 289.5 (270–351) | 286 (261–311) | 0.460 |
| Disease Type | Fatty Liver | Number | Year | Prevalence | Diagnostic Method | Fibrosis | Diagnostic Method | |
|---|---|---|---|---|---|---|---|---|
| China [20] | IBD | NAFLD | 206 | 2017 | 10.7% | Ultrasound | - | - |
| Japan [19] | CD | NAFLD | 303 | 2017 | 21.8% | Ultrasound | - | - |
| Republic of Korea [21] | IBD | NAFLD | 3356 | 2023 | 16.7% | Hepatic steatosis index ≥ 30 | 5.3% | Fib-4 ≥ 1.45 |
| Taiwan | IBD | MAFLD | 120 | 2023 | 29.2% | TE | 17.1% | LSM |
Disclaimer/Publisher’s Note: The statements, opinions and data contained in all publications are solely those of the individual author(s) and contributor(s) and not of MDPI and/or the editor(s). MDPI and/or the editor(s) disclaim responsibility for any injury to people or property resulting from any ideas, methods, instructions or products referred to in the content. |
© 2023 by the authors. Licensee MDPI, Basel, Switzerland. This article is an open access article distributed under the terms and conditions of the Creative Commons Attribution (CC BY) license (https://creativecommons.org/licenses/by/4.0/).
Share and Cite
Hsiao, S.-W.; Chen, T.-C.; Su, P.-Y.; Yang, C.-T.; Huang, S.-P.; Chen, Y.-Y.; Yen, H.-H. Metabolic Dysfunction-Associated Fatty Liver Disease in Taiwanese Patients with Inflammatory Bowel Disease: A Study in Patients with Clinical Remission. Diagnostics 2023, 13, 3268. https://doi.org/10.3390/diagnostics13203268
Hsiao S-W, Chen T-C, Su P-Y, Yang C-T, Huang S-P, Chen Y-Y, Yen H-H. Metabolic Dysfunction-Associated Fatty Liver Disease in Taiwanese Patients with Inflammatory Bowel Disease: A Study in Patients with Clinical Remission. Diagnostics. 2023; 13(20):3268. https://doi.org/10.3390/diagnostics13203268
Chicago/Turabian StyleHsiao, Shun-Wen, Ting-Chun Chen, Pei-Yuan Su, Chen-Ta Yang, Siou-Ping Huang, Yang-Yuan Chen, and Hsu-Heng Yen. 2023. "Metabolic Dysfunction-Associated Fatty Liver Disease in Taiwanese Patients with Inflammatory Bowel Disease: A Study in Patients with Clinical Remission" Diagnostics 13, no. 20: 3268. https://doi.org/10.3390/diagnostics13203268
APA StyleHsiao, S.-W., Chen, T.-C., Su, P.-Y., Yang, C.-T., Huang, S.-P., Chen, Y.-Y., & Yen, H.-H. (2023). Metabolic Dysfunction-Associated Fatty Liver Disease in Taiwanese Patients with Inflammatory Bowel Disease: A Study in Patients with Clinical Remission. Diagnostics, 13(20), 3268. https://doi.org/10.3390/diagnostics13203268