

Molecular Analysis of Biliary Tract Cancers with the Custom 3′ RACE-Based NGS Panel

 , , , , , and
Abstract
:1. Introduction
2. Materials and Methods
2.1. Patients and Samples
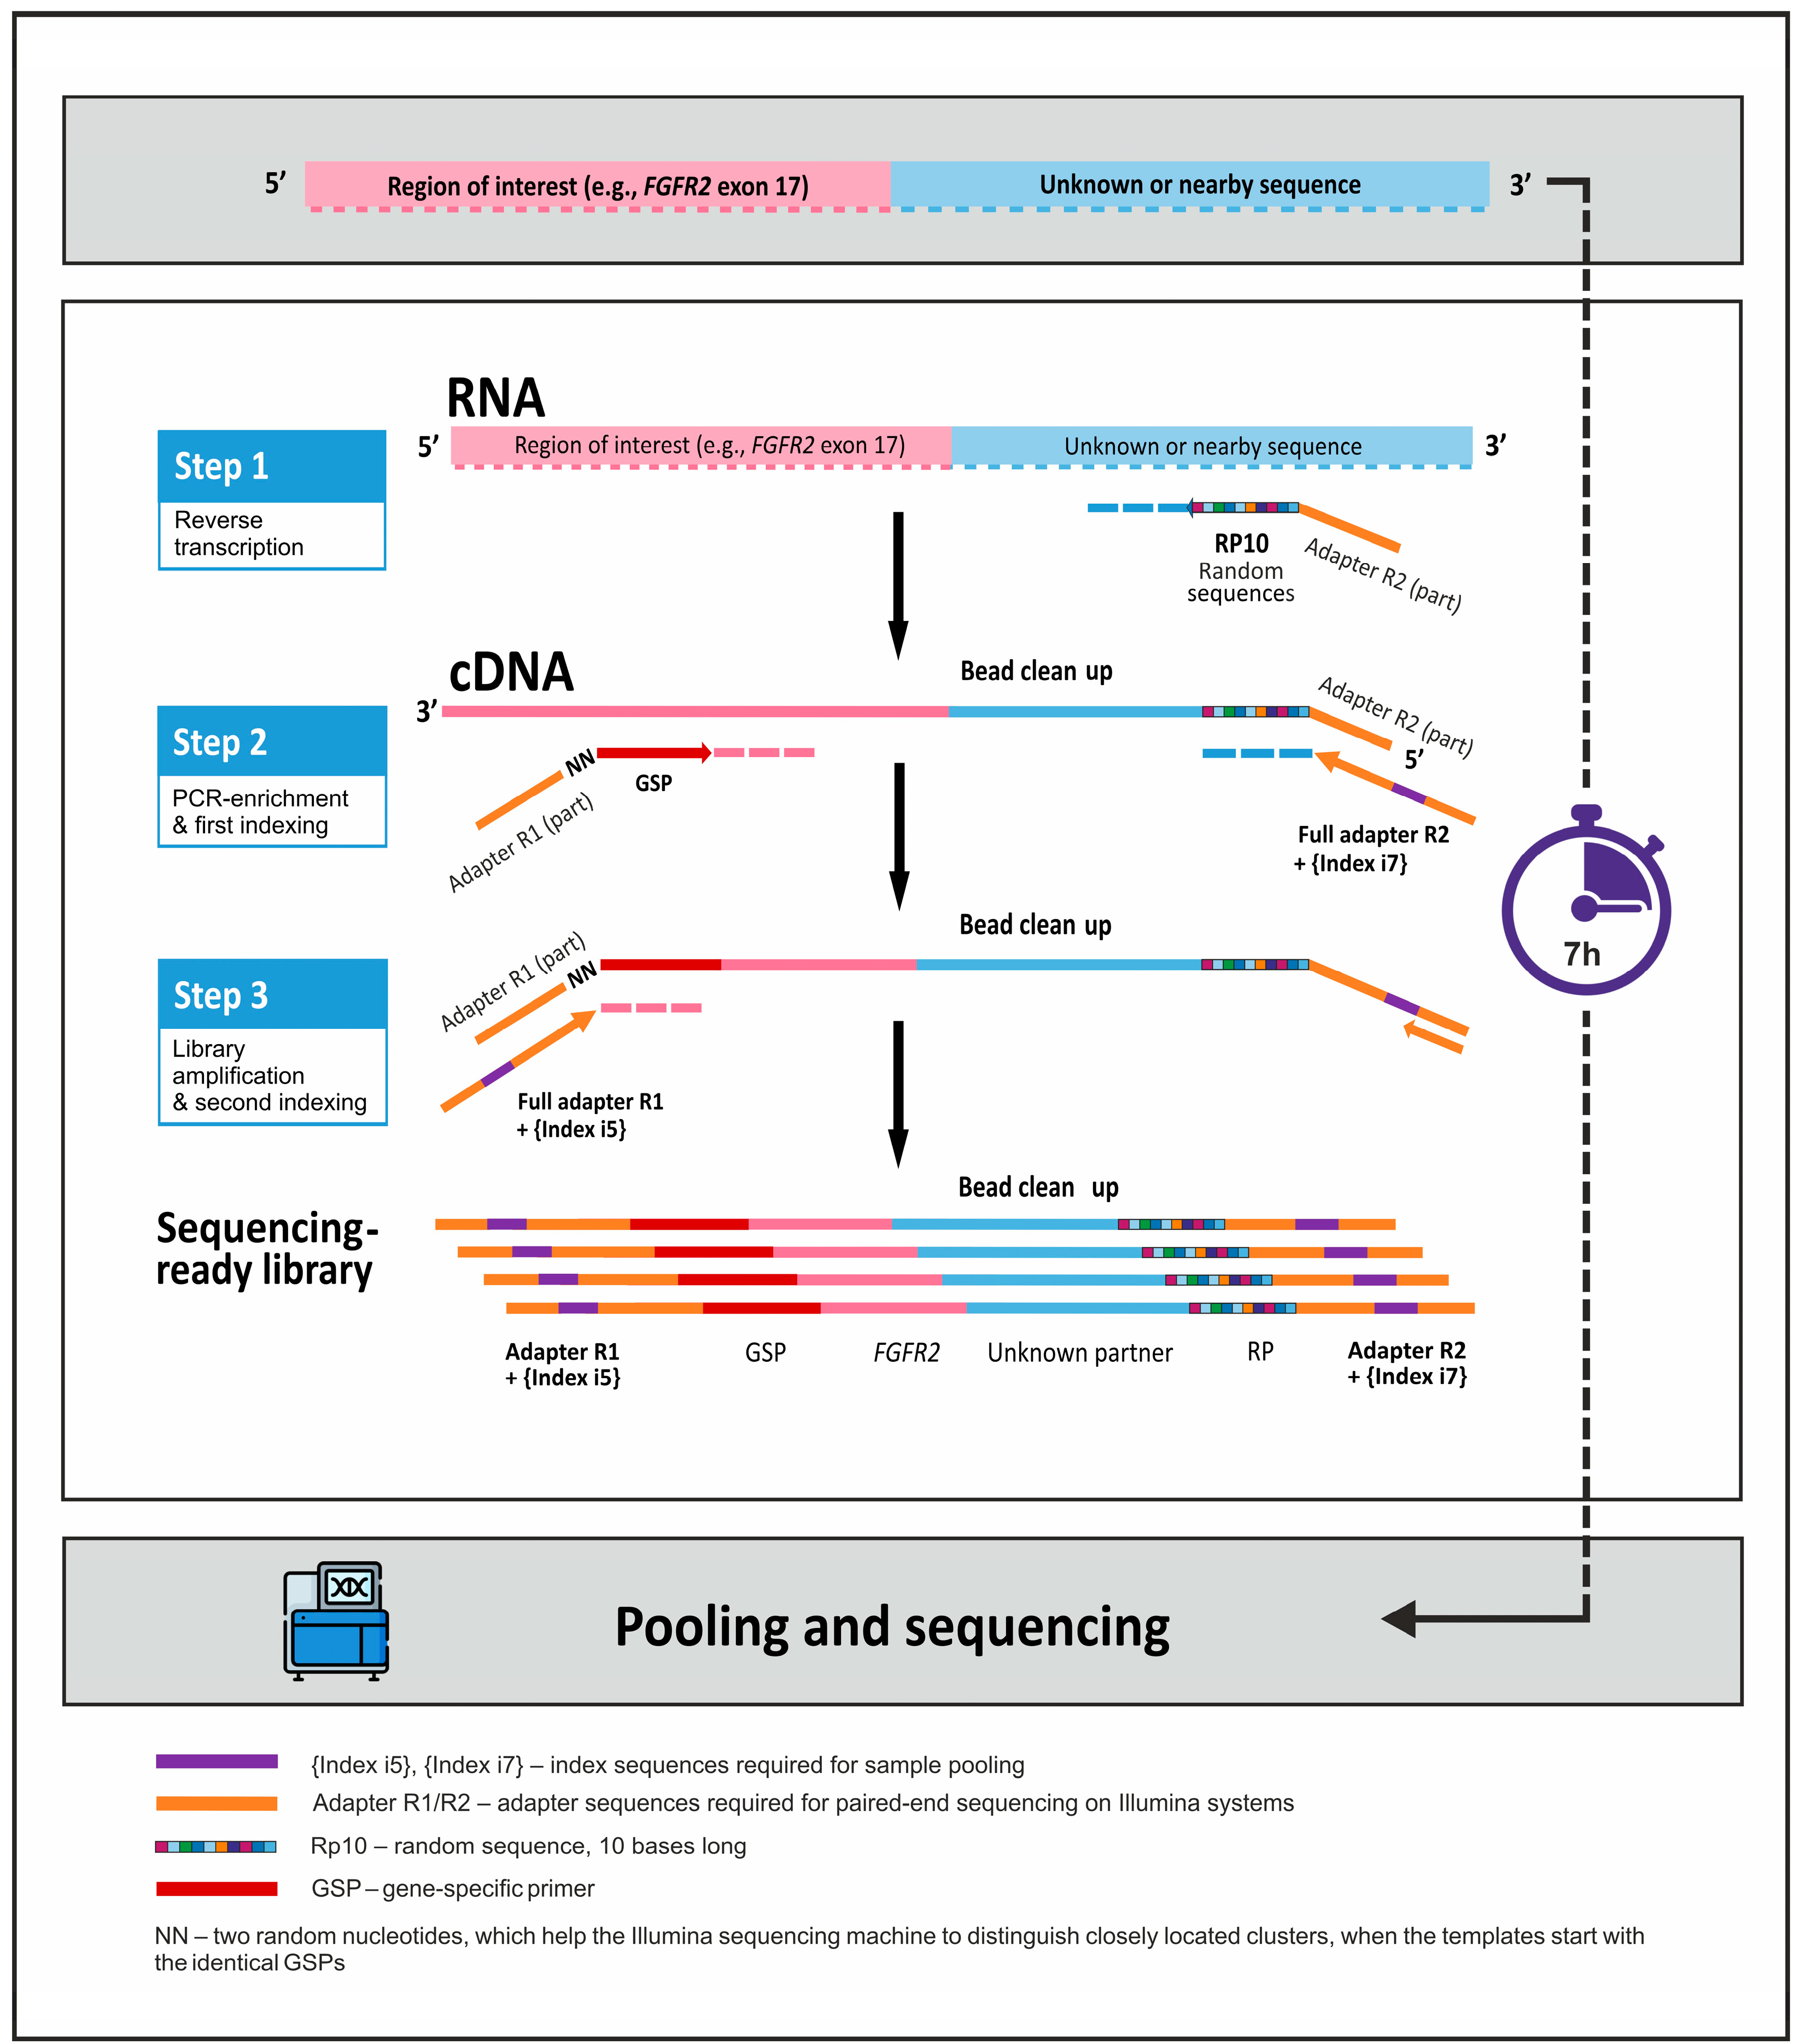
2.2. Preparation of NGS Libraries Using 3′ RACE-Based Method
2.3. Preparation of NGS Libraries Using the Illumina TruSight Tumor 170 Kit
2.4. Bioinformatics and Statistical Analysis
3. Results
3.1. Development of the Targeted RNA Sequencing Panel on the Basis of 3′ RACE Technology
3.2. Analysis of BTCs Using the 3′ RACE Targeted RNA Sequencing Panel
3.3. Analysis of a Subset of iCCA Cases with Illumina TruSight Tumor 170 Kit: Comparison of the Results Obtained with the Two Methods
3.4. Other Genetic Alterations Detected in iCCA
4. Discussion
Supplementary Materials
Author Contributions
Funding
Institutional Review Board Statement
Informed Consent Statement
Data Availability Statement
Conflicts of Interest
References
- Lim, J.H. Liver flukes: The malady neglected. Korean J. Radiol. 2011, 12, 269–279. [Google Scholar] [CrossRef] [PubMed]
- Baria, K.; De Toni, E.N.; Yu, B.; Jiang, Z.; Kabadi, S.M.; Malvezzi, M. Worldwide Incidence and Mortality of Biliary Tract Cancer. Gastro Hep Adv. 2022, 1, 618–626. [Google Scholar] [CrossRef]
- Ilyas, S.I.; Affo, S.; Goyal, L.; Lamarca, A.; Sapisochin, G.; Yang, J.D.; Gores, G.J. Cholangiocarcinoma—Novel biological insights and therapeutic strategies. Nat. Rev. Clin. Oncol. 2023, 20, 470–486. [Google Scholar] [CrossRef]
- Lo, J.H.; Agarwal, R.; Goff, L.W.; Heumann, T.R. Immunotherapy in Biliary Tract Cancers: Current Standard-of-Care and Emerging Strategies. Cancers 2023, 15, 3312. [Google Scholar] [CrossRef] [PubMed]
- Abou-Alfa, G.K.; Sahai, V.; Hollebecque, A.; Vaccaro, G.; Melisi, D.; Al-Rajabi, R.; Paulson, A.S.; Borad, M.J.; Gallinson, D.; Murphy, A.G.; et al. Pemigatinib for previously treated, locally advanced or metastatic cholangiocarcinoma: A multicentre, open-label, phase 2 study. Lancet Oncol. 2020, 21, 671–684. [Google Scholar] [CrossRef]
- Javle, M.; Roychowdhury, S.; Kelley, R.K.; Sadeghi, S.; Macarulla, T.; Weiss, K.H.; Waldschmidt, D.-T.; Goyal, L.; Borbath, I.; El-Khoueiry, A.; et al. Infigratinib (BGJ398) in previously treated patients with advanced or metastatic cholangiocarcinoma with FGFR2 fusions or rearrangements: Mature results from a multicentre, open-label, single-arm, phase 2 study. Lancet Gastroenterol. Hepatol. 2021, 6, 803–815. [Google Scholar] [CrossRef] [PubMed]
- Goyal, L.; Meric-Bernstam, F.; Hollebecque, A.; Valle, J.W.; Morizane, C.; Karasic, T.B.; Abrams, T.A.; Furuse, J.; Kelley, R.K.; Cassier, P.A.; et al. Fu-tibatinib for FGFR2-Rearranged Intrahepatic Cholangiocarcinoma. N. Engl. J. Med. 2023, 388, 228–239. [Google Scholar] [CrossRef] [PubMed]
- Abou-Alfa, G.K.; Macarulla, T.; Javle, M.M.; Kelley, R.K.; Lubner, S.J.; Adeva, J.; Cleary, J.M.; Catenacci, D.V.; Borad, M.J.; Bridgewater, J.; et al. Ivosidenib in IDH1-mutant, chemotherapy-refractory cholangiocarcinoma (ClarIDHy): A multicentre, randomised, double-blind, placebo-controlled, phase 3 study. Lancet Oncol. 2020, 21, 796–807. [Google Scholar] [CrossRef]
- Kendre, G.; Murugesan, K.; Brummer, T.; Segatto, O.; Saborowski, A.; Vogel, A. Charting co-mutation patterns associated with actionable drivers in intrahepatic cholangiocarcinoma. J. Hepatol. 2023, 78, 614–626. [Google Scholar] [CrossRef]
- Jusakul, A.; Cutcutache, I.; Yong, C.H.; Lim, J.Q.; Ni Huang, M.; Padmanabhan, N.; Nellore, V.; Kongpetch, S.; Ng, A.W.T.; Ng, L.M.; et al. Whole-Genome and Epigenomic Landscapes of Etiologically Distinct Subtypes of Cholangiocarcinoma. Cancer Discov. 2017, 7, 1116–1135. [Google Scholar] [CrossRef]
- Zingg, D.; Bhin, J.; Yemelyanenko, J.; Kas, S.M.; Rolfs, F.; Lutz, C.; Lee, J.K.; Klarenbeek, S.; Silverman, I.M.; Annunziato, S.; et al. Truncated FGFR2 is a clinically actionable oncogene in multiple cancers. Nature 2022, 608, 609–617. [Google Scholar] [CrossRef] [PubMed]
- Cleary, J.M.; Raghavan, S.; Wu, Q.; Li, Y.Y.; Spurr, L.F.; Gupta, H.V.; Rubinson, D.A.; Fetter, I.J.; Hornick, J.L.; Nowak, J.A.; et al. FGFR2 Extracellular Domain In-Frame Deletions Are Therapeutically Targetable Genomic Alterations that Function as Oncogenic Drivers in Cholangiocarcinoma. Cancer Discov. 2021, 11, 2488–2505. [Google Scholar] [CrossRef] [PubMed]
- Bitzer, M.; Spahn, S.; Babaei, S.; Horger, M.; Singer, S.; Schulze-Osthoff, K.; Missios, P.; Gatidis, S.; Nann, D.; Mattern, S.; et al. Targeting extracellular and juxtamembrane FGFR2 mutations in chemotherapy-refractory cholangiocarcinoma. NPJ Precis. Oncol. 2021, 5, 80. [Google Scholar] [CrossRef] [PubMed]
- Benayed, R.; Offin, M.; Mullaney, K.; Sukhadia, P.; Rios, K.; Desmeules, P.; Ptashkin, R.; Won, H.; Chang, J.; Halpenny, D.; et al. High Yield of RNA Sequencing for Targetable Kinase Fusions in Lung Adenocarcinomas with No Mitogenic Driver Alteration Detected by DNA Sequencing and Low Tumor Mutation Burden. Clin. Cancer Res. 2019, 25, 4712–4722. [Google Scholar] [CrossRef]
- Heydt, C.; Wölwer, C.B.; Camacho, O.V.; Wagener-Ryczek, S.; Pappesch, R.; Siemanowski, J.; Rehker, J.; Haller, F.; Agaimy, A.; Worm, K.; et al. Detection of gene fusions using targeted next-generation sequencing: A comparative evaluation. BMC Med. Genom. 2021, 14, 62. [Google Scholar] [CrossRef] [PubMed]
- Li, W.; Liu, Y.; Li, W.; Chen, L.; Ying, J. Intergenic Breakpoints Identified by DNA Sequencing Confound Targetable Kinase Fusion Detection in NSCLC. J. Thorac. Oncol. 2020, 15, 1223–1231. [Google Scholar] [CrossRef]
- Zheng, Z.; Liebers, M.; Zhelyazkova, B.; Cao, Y.; Panditi, D.; Lynch, K.D.; Chen, J.; E Robinson, H.; Shim, H.S.; Chmielecki, J.; et al. Anchored multiplex PCR for targeted next-generation sequencing. Nat. Med. 2014, 20, 1479–1484. [Google Scholar] [CrossRef]
- Singh, R.R. Target Enrichment Approaches for Next-Generation Sequencing Applications in Oncology. Diagnostics 2022, 12, 1539. [Google Scholar] [CrossRef]
- Park, H.J.; Baek, I.; Cheang, G.; Solomon, J.P.; Song, W. Comparison of RNA-Based Next-Generation Sequencing Assays for the Detection of NTRK Gene Fusions. J. Mol. Diagn. 2021, 23, 1443–1451. [Google Scholar] [CrossRef]
- Matter, M.S.; Chijioke, O.; Savic, S.; Bubendorf, L. Narrative review of molecular pathways of kinase fusions and diagnostic ap-proaches for their detection in non-small cell lung carcinomas. Transl. Lung Cancer Res. 2020, 9, 2645–2655. [Google Scholar] [CrossRef]
- Szurian, K.; Kashofer, K.; Liegl-Atzwanger, B. Role of Next-Generation Sequencing as a Diagnostic Tool for the Evaluation of Bone and Soft-Tissue Tumors. Pathobiology 2017, 84, 323–338. [Google Scholar] [CrossRef] [PubMed]
- Gilani, A.; Donson, A.; Davies, K.D.; Whiteway, S.L.; Lake, J.; DeSisto, J.; Hoffman, L.; Foreman, N.K.; Kleinschmidt-DeMasters, B.K.; Green, A.L. Targetable molecular alterations in congenital glioblastoma. J. Neurooncol. 2020, 146, 247–252. [Google Scholar] [CrossRef] [PubMed]
- Crotty, R.; Hu, K.; Stevenson, K.; Pontius, M.Y.; Sohani, A.R.; Ryan, R.J.H.; Rueckert, E.; A Brauer, H.; Hudson, B.; Berlin, A.M.; et al. Simultaneous Identification of Cell of Origin, Translocations, and Hotspot Mutations in Diffuse Large B-Cell Lymphoma Using a Single RNA-Sequencing Assay. Am. J. Clin. Pathol. 2021, 155, 748–754. [Google Scholar] [CrossRef] [PubMed]
- Wang, L.; Yekula, A.; Muralidharan, K.; Small, J.L.; Rosh, Z.S.; Kang, K.M.; Carter, B.S.; Balaj, L. Novel Gene Fusions in Glioblastoma Tumor Tissue and Matched Patient Plasma. Cancers 2020, 12, 1219. [Google Scholar] [CrossRef] [PubMed]
- Pinto, F.L.; Lindblad, P. A guide for in-house design of template-switch-based 5′ rapid amplification of cDNA ends systems. Anal. Biochem. 2010, 397, 227–232. [Google Scholar] [CrossRef]
- Ozawa, T.; Kondo, M.; Isobe, M. 3′ rapid amplification of cDNA ends (RACE) walking for rapid structural analysis of large tran-scripts. J. Hum. Genet. 2004, 49, 102–105. [Google Scholar] [CrossRef]
- Martianov, A.S.; Mitiushkina, N.V.; Ershova, A.N.; Martynenko, D.E.; Bubnov, M.G.; Amankwah, P.; Yanus, G.A.; Aleksakhina, S.N.; Tiurin, V.I.; Venina, A.R.; et al. KRAS, NRAS, BRAF, HER2 and MSI Status in a Large Consecutive Series of Colorectal Carcinomas. Int. J. Mol. Sci. 2023, 24, 4868. [Google Scholar] [CrossRef]
- Mitiushkina, N.V.; Kholmatov, M.M.; Tiurin, V.I.; Romanko, A.A.; Yatsuk, O.S.; Sokolova, T.N.; Ivantsov, A.O.; Kuligina, E.S.; Stepanov, I.A.; Belyaev, A.M.; et al. Comparative analysis of expression of mutant and wild-type alleles is essential for reliable PCR-based detection of MET exon 14 skipping. Biochimie 2019, 165, 267–274. [Google Scholar] [CrossRef]
- Mitiushkina, N.V.; Romanko, A.A.; Preobrazhenskaya, E.V.; Tiurin, V.I.; Ermachenkova, T.I.; Martianov, A.S.; Mulkidjan, R.S.; Sokolova, T.N.; Kholmatov, M.M.; Bizin, I.V.; et al. Comprehensive evaluation of the test for 5′-/3′-end mRNA unbalanced expression as a screening tool for ALK and ROS1 fusions in lung cancer. Cancer Med. 2022, 11, 3226–3237. [Google Scholar] [CrossRef]
- Tiurin, V.I.; Preobrazhenskaya, E.V.; Mitiushkina, N.V.; Romanko, A.A.; Anuskina, A.A.; Mulkidjan, R.S.; Saitova, E.S.; Krivosheyeva, E.A.; Kharitonova, E.D.; Shevyakov, M.P.; et al. Rapid and Cost-Efficient Detection of RET Rearrangements in a Large Consecutive Series of Lung Carcinomas. Int. J. Mol. Sci. 2023, 24, 10530. [Google Scholar] [CrossRef]
- Romanko, A.A.; Mulkidjan, R.S.; Tiurin, V.I.; Saitova, E.S.; Preobrazhenskaya, E.V.; Krivosheyeva, E.A.; Mitiushkina, N.V.; Shestakova, A.D.; Belogubova, E.V.; Ivantsov, A.O.; et al. Cost-Efficient Detection of NTRK1/2/3 Gene Fusions: Single-Center Analysis of 8075 Tumor Samples. Int. J. Mol. Sci. 2023, 24, 14203. [Google Scholar] [CrossRef] [PubMed]
- Mitiushkina, N.V.; Yanus, G.A.; Kuligina, E.S.; Laidus, T.A.; Romanko, A.A.; Kholmatov, M.M.; Ivantsov, A.O.; Aleksakhina, S.N.; Imyanitov, E.N. Preparation of Duplex Sequencing Libraries for Archival Paraffin-Embedded Tissue Samples Using Single-Strand-Specific Nuclease P1. Int. J. Mol. Sci. 2022, 23, 4586. [Google Scholar] [CrossRef] [PubMed]
- Haas, B.J.; Dobin, A.; Li, B.; Stransky, N.; Pochet, N.; Regev, A. Accuracy assessment of fusion transcript detection via read-mapping and de novo fusion transcript assembly-based methods. Genome Biol. 2019, 20, 213. [Google Scholar] [CrossRef] [PubMed]
- Pysam. Available online: https://github.com/pysam-developers/pysam (accessed on 31 August 2023).
- Smith, T.; Heger, A.; Sudbery, I. UMI-tools: Modeling sequencing errors in Unique Molecular Identifiers to improve quantification accuracy. Genome Res. 2017, 27, 491–499. [Google Scholar] [CrossRef]
- Dobin, A.; Davis, C.A.; Schlesinger, F.; Drenkow, J.; Zaleski, C.; Jha, S.; Batut, P.; Chaisson, M.; Gingeras, T.R. STAR: Ultrafast universal RNA-seq aligner. Bioinformatics 2013, 29, 15–21. [Google Scholar] [CrossRef]
- Eisenberg, E.; Levanon, E.Y. Human housekeeping genes, revisited. Trends Genet. 2013, 29, 569–574. [Google Scholar] [CrossRef]
- TruSight Tumor 170. Available online: https://www.illumina.com/products/by-type/informatics-products/basespace-sequence-hub/apps/trusight-tumor-170.html (accessed on 31 August 2023).
- Wang, K.; Li, M.; Hakonarson, H. ANNOVAR: Functional annotation of genetic variants from high-throughput sequencing data. Nucleic Acids Res. 2010, 38, e164. [Google Scholar] [CrossRef]
- Ensembl Canonical Transcript. Available online: https://www.ensembl.org/info/genome/genebuild/canonical.html (accessed on 31 August 2023).
- R Core Team. R: A Language and Environment for Statistical Computing; R Foundation for Statistical Computing: Vienna, Austria, 2018; Available online: https://www.R-project.org (accessed on 31 August 2023).
- Mondaca, S.; Razavi, P.; Xu, C.; Offin, M.; Myers, M.; Scaltriti, M.; Hechtman, J.F.; Bradley, M.; O’reilly, E.M.; Berger, M.F.; et al. Genomic Characterization of ERBB2-Driven Biliary Cancer and a Case of Response to Ado-Trastuzumab Emtansine. JCO Precis. Oncol. 2019, 3, PO.19.00223. [Google Scholar] [CrossRef]
- Helsten, T.; Elkin, S.; Arthur, E.; Tomson, B.N.; Carter, J.; Kurzrock, R. The FGFR Landscape in Cancer: Analysis of 4,853 Tumors by Next-Generation Sequencing. Clin. Cancer Res. 2016, 22, 259–267. [Google Scholar] [CrossRef]
- Gu, W.; Yang, J.; Wang, Y.; Xu, J.; Wang, X.; Du, F.; Hu, X.; Guo, H.; Song, C.; Tao, R.; et al. Comprehensive identification of FGFR1-4 alterations in 5 557 Chinese patients with solid tumors by next-generation sequencing. Am. J. Cancer Res. 2021, 11, 3893–3906. [Google Scholar]
- Chaganty, B.K.; Qiu, S.; Gest, A.; Lu, Y.; Ivan, C.; Calin, G.A.; Weiner, L.M.; Fan, Z. Trastuzumab upregulates PD-L1 as a potential mechanism of trastuzumab resistance through engagement of immune effector cells and stimulation of IFNγ secretion. Cancer Lett. 2018, 430, 47–56. [Google Scholar] [CrossRef]
- Yamashita, K.; Iwatsuki, M.; Yasuda-Yoshihara, N.; Morinaga, T.; Nakao, Y.; Harada, K.; Eto, K.; Kurashige, J.; Hiyoshi, Y.; Ishimoto, T.; et al. Trastuzumab upregulates programmed death ligand-1 expression through interaction with NK cells in gastric cancer. Br. J. Cancer. 2021, 124, 595–603. [Google Scholar] [CrossRef] [PubMed]
- ClinVar. Available online: https://www.ncbi.nlm.nih.gov/clinvar (accessed on 31 August 2023).
- Valery, M.; Facchinetti, F.; Malka, D.; Ducreux, M.; Friboulet, L.; Hollebecque, A. Cholangiocarcinoma with STRN-ALK translocation treated with ALK inhibitors. Dig. Liver Dis. 2021, 53, 1664–1665. [Google Scholar] [CrossRef] [PubMed]
- Favre, L.; Pujals, A.; Maille, P.; Poullot, E.; Calderaro, J. Identification of an EML4-ALK rearrangement in an intrahepatic cholangiocarcinoma. Pathol. Int. 2021, 71, 630–632. [Google Scholar] [CrossRef] [PubMed]
- Lim, S.M.; Yoo, J.E.; Lim, K.H.; Tai, D.W.M.; Cho, B.C.; Park, Y.N. Rare Incidence of ROS1 Rearrangement in Cholangiocarcinoma. Cancer Res. Treat. 2017, 49, 185–192. [Google Scholar] [CrossRef] [PubMed]
- Jakubowski, C.D.; Mohan, A.A.; Kamel, I.R.; Yarchoan, M. Response to Crizotinib in ROS1 Fusion-Positive Intrahepatic Cholangio-carcinoma. JCO Precis. Oncol. 2020, 4, 825–828. [Google Scholar] [CrossRef]
- Subbiah, V.; Cassier, P.A.; Siena, S.; Garralda, E.; Paz-Ares, L.; Garrido, P.; Nadal, E.; Vuky, J.; Lopes, G.; Kalemkerian, G.P.; et al. Pan-cancer efficacy of pralsetinib in patients with RET fusion-positive solid tumors from the phase 1/2 ARROW trial. Nat. Med. 2022, 28, 1640–1645. [Google Scholar] [CrossRef]
- Graham, R.P.; Fritcher, E.G.B.; Pestova, E.; Schulz, J.; Sitailo, L.A.; Vasmatzis, G.; Murphy, S.J.; McWilliams, R.R.; Hart, S.N.; Halling, K.C.; et al. Fibroblast growth factor receptor 2 translocations in intrahepatic cholangiocarcinoma. Hum. Pathol. 2014, 45, 1630–1638. [Google Scholar] [CrossRef]
- Arai, Y.; Totoki, Y.; Hosoda, F.; Shirota, T.; Hama, N.; Nakamura, H.; Ojima, H.; Furuta, K.; Shimada, K.; Okusaka, T.; et al. Fibroblast growth factor receptor 2 tyrosine kinase fusions define a unique molecular subtype of cholangiocarcinoma. Hepatology 2014, 59, 1427–1434. [Google Scholar] [CrossRef]
- Lowery, M.A.; Ptashkin, R.; Jordan, E.; Berger, M.F.; Zehir, A.; Capanu, M.; Kemeny, N.E.; O’Reilly, E.M.; El-Dika, I.; Jarnagin, W.R.; et al. Comprehensive Molecular Profiling of Intrahepatic and Extrahepatic Cholangiocarcinomas: Potential Targets for Intervention. Clin. Cancer Res. 2018, 24, 4154–4161. [Google Scholar] [CrossRef]
- Boscoe, A.N.; Rolland, C.; Kelley, R.K. Frequency and prognostic significance of isocitrate dehydrogenase 1 mutations in cholangiocarcinoma: A systematic literature review. J. Gastrointest. Oncol. 2019, 10, 751–765. [Google Scholar] [CrossRef] [PubMed]
- Kongpetch, S.; Jusakul, A.; Lim, J.Q.; Ng, C.C.Y.; Chan, J.Y.; Rajasegaran, V.; Lim, T.H.; Lim, K.H.; Choo, S.P.; Dima, S.; et al. Lack of Targetable FGFR2 Fusions in Endemic Fluke-Associated Cholangiocarcinoma. JCO Glob. Oncol. 2020, 6, 628–638. [Google Scholar] [CrossRef]
- Jain, A.; Kwong, L.N.; Javle, M. Genomic Profiling of Biliary Tract Cancers and Implications for Clinical Practice. Curr. Treat. Options Oncol. 2016, 17, 58. [Google Scholar] [CrossRef] [PubMed]
- Goeppert, B.; Frauenschuh, L.; Renner, M.; Roessler, S.; Stenzinger, A.; Klauschen, F.; Warth, A.; Vogel, M.N.; Mehrabi, A.; Hafezi, M.; et al. BRAF V600E-specific immunohistochemistry reveals low mutation rates in biliary tract cancer and restriction to intrahepatic cholangiocarcinoma. Mod. Pathol. 2014, 27, 1028–1034. [Google Scholar] [CrossRef] [PubMed]
- Rizzo, A.; Di Federico, A.; Ricci, A.D.; Frega, G.; Palloni, A.; Pagani, R.; Tavolari, S.; Di Marco, M.; Brandi, G. Targeting BRAF-Mutant Biliary Tract Cancer: Recent Advances and Future Challenges. Cancer Control 2020, 27, 1073274820983013. [Google Scholar] [CrossRef]
- Galdy, S.; Lamarca, A.; McNamara, M.G.; Hubner, R.A.; Cella, C.A.; Fazio, N.; Valle, J.W. HER2/HER3 pathway in biliary tract malignancies; systematic review and meta-analysis: A potential therapeutic target? Cancer Metastasis Rev. 2017, 36, 141–157. [Google Scholar] [CrossRef]
- Costa, B.A.; de Lara, P.T.; Park, W.; Keane, F.; Harding, J.J.; Khalil, D.N. Durable Response after Olaparib Treatment for Perihilar Cholangiocarcinoma with Germline BRCA2 Mutation. Oncol. Res. Treat. 2023, 46, 211–215. [Google Scholar] [CrossRef]
- Li, X.Y.; Chen, J.Q.; Aisa, A.; Ding, Y.W.; Zhang, D.; Yuan, Y. Targeting BRCA-mutant biliary tract cancer: Current evidence and future perspectives. J. Dig. Dis. 2023, 24, 85–97. [Google Scholar] [CrossRef]
- Shia, J. The diversity of tumours with microsatellite instability: Molecular mechanisms and impact upon microsatellite insta-bility testing and mismatch repair protein immunohistochemistry. Histopathology 2020, 78, 485–497. [Google Scholar] [CrossRef]


| Genes | Detected Alterations | Number of Primers |
|---|---|---|
| FGFR1–4 | translocations, mutations in hot-spot regions, overexpression (as a marker of gene amplification) | 29 |
| IDH1/2 | IDH1 p.R132, IDH2 p.R140 and IDH2 p.R172 hot-spot mutations | 3 |
| ERBB2 | overexpression (as a marker of the gene amplification), mutations in the hot-spot regions | 9 |
| KRAS/NRAS | mutations in the hot-spot regions (exons 2–4 for KRAS and exons 2–3 for NRAS) | 7 |
| BRAF | mutations in exon 15 | 1 |
| PIK3CA | mutations in the hot-spot regions | 17 |
| PD-L1 | expression | 1 |
| DDX23, GOLGA5, SEL1L | referee genes, required for the analysis of the expression of selected genes | 3 |
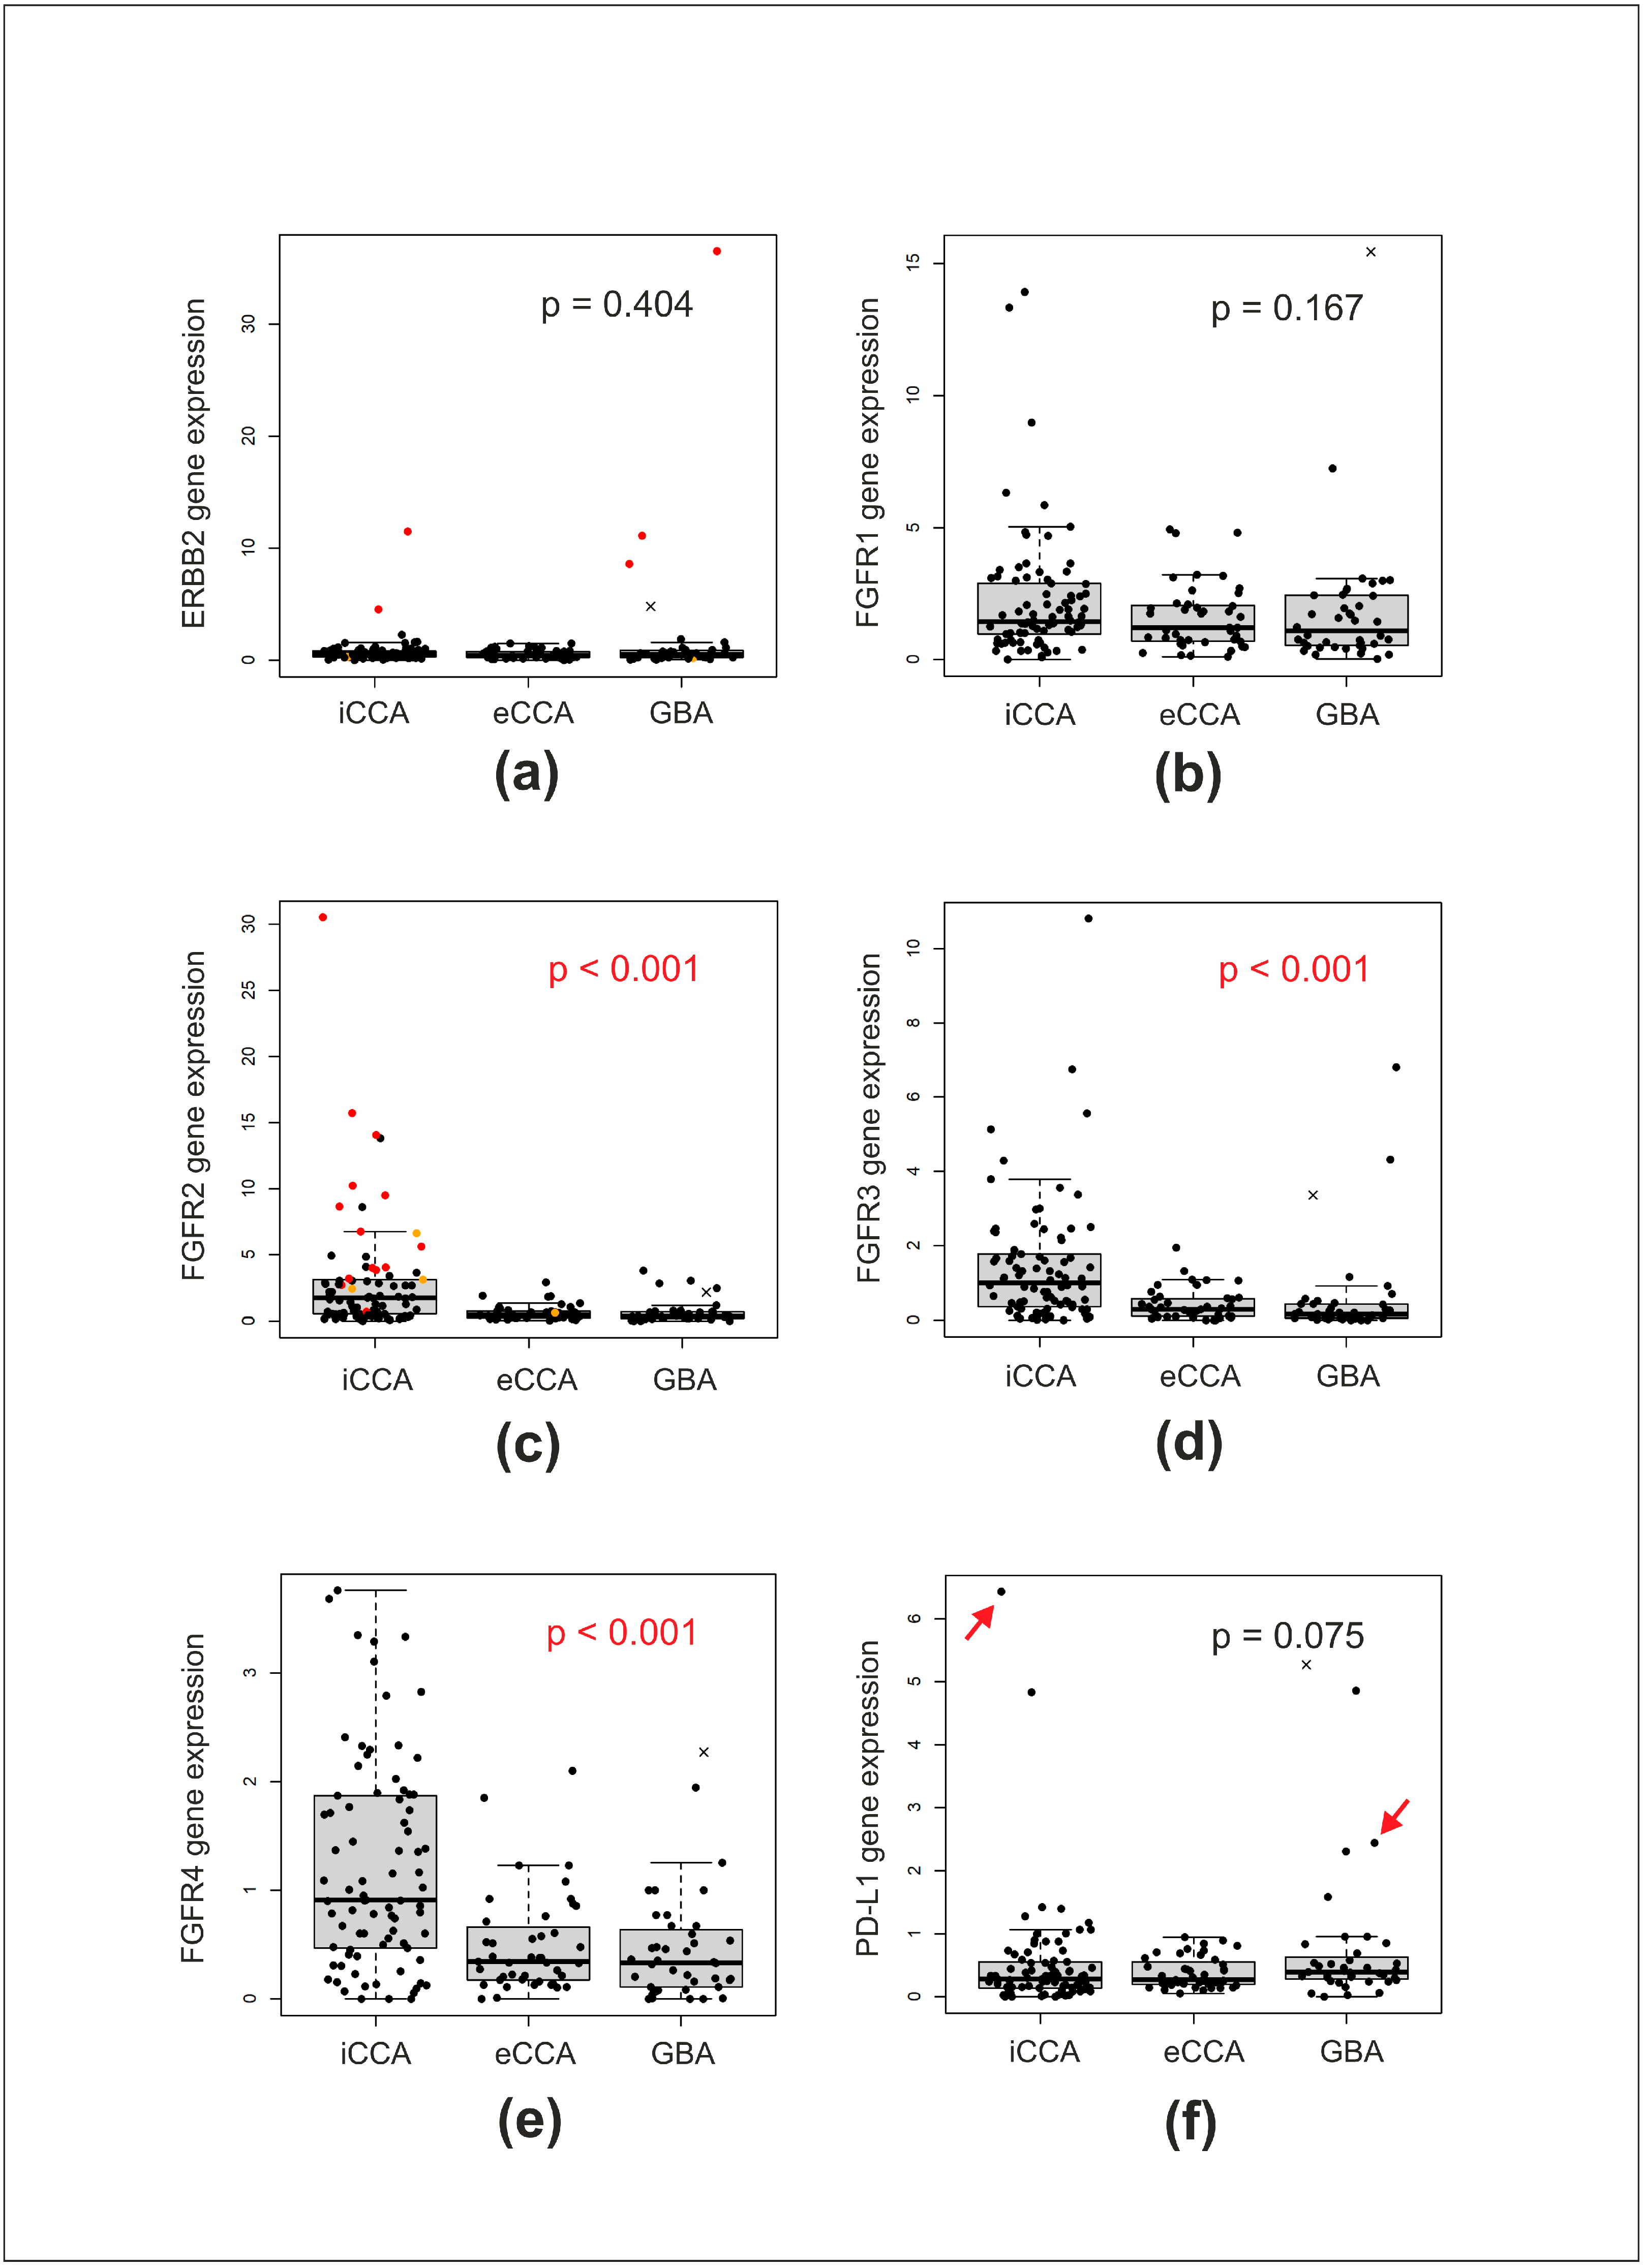
| iCCA (n = 83) | eCCA (n = 44) | GBA (n = 41) | p-Value | |
|---|---|---|---|---|
| Age | ||||
| median (range) | 61 (18–83) | 63 (24–75) | 66 (42–91) | 0.007 1 |
| Gender | ||||
| % female | 60.2 | 63.6 | 73.2 | 0.366 2 |
| MSI status | ||||
| MSI+ | 2 (2.6%) | 0 (0%) | 1 (2.6%) | 0.616 3 |
| MSI− | 76 (97.1%) | 41 (100%) | 38 (97.4%) | |
| nd | 4 | 3 | 2 | |
| ERBB2 amplification | ||||
| present | 2 (2.6%) | 0 (0%) | 3 (7.3%) | 0.118 3 |
| absent | 74 (97.4%) | 44 (100%) | 38 (92.7%) | |
| nd | 7 | 0 | 0 | |
| FGFR2 gene status | ||||
| fusion or mutation | 17 (20.7%) | 1 (2.3%) | 0 (0%) | <0.001 3 |
| wild type | 65 (79.3%) | 42 (97.7%) | 40 (100%) | |
| nd | 1 | 1 | 1 | |
| IDH1/2 mutations | ||||
| present | 23 (28%) | 0 (0%) | 0 (0%) | <0.001 3 |
| absent | 59 (72%) | 43 (100%) | 40 (100%) | |
| nd | 1 | 1 | 1 | |
| KRAS mutation | ||||
| present | 11 (13.4%) | 16 (37.2%) | 4 (10%) | 0.003 3 |
| absent | 71 (86.6%) | 27 (62.8%) | 36 (90%) | |
| nd | 1 | 1 | 1 | |
| NRAS mutation | ||||
| present | 3 (3.7%) | 0 (0%) | 1 (2.5%) | 0.680 3 |
| absent | 79 (96.3%) | 43 (100%) | 39 (97.5%) | |
| nd | 1 | 1 | 1 | |
| BRAF mutation | ||||
| present | 2 (2.4%) | 0 (0%) | 1 (2.5%) | 0.614 3 |
| absent | 80 (97.6%) | 43 (100%) | 39 (97.5%) | |
| nd | 1 | 1 | 1 | |
| ERBB2 mutation | ||||
| present | 1 (1.2%) | 0 (0%) | 1 (2.5%) | 0.494 3 |
| absent | 81 (98.8%) | 43 (100%) | 39 (97.5%) | |
| nd | 1 | 1 | 1 | |
| PIK3CA mutation | ||||
| present | 9 (11%) | 6 (14%) | 3 (7.5%) | 0.722 3 |
| absent | 73 (89%) | 37 (86%) | 37 (92.5%) | |
| nd | 1 | 1 | 1 | |
Disclaimer/Publisher’s Note: The statements, opinions and data contained in all publications are solely those of the individual author(s) and contributor(s) and not of MDPI and/or the editor(s). MDPI and/or the editor(s) disclaim responsibility for any injury to people or property resulting from any ideas, methods, instructions or products referred to in the content. |
© 2023 by the authors. Licensee MDPI, Basel, Switzerland. This article is an open access article distributed under the terms and conditions of the Creative Commons Attribution (CC BY) license (https://creativecommons.org/licenses/by/4.0/).
Share and Cite
Mitiushkina, N.V.; Tiurin, V.I.; Anuskina, A.A.; Bordovskaya, N.A.; Shestakova, A.D.; Martianov, A.S.; Bubnov, M.G.; Shishkina, A.S.; Semina, M.V.; Romanko, A.A.; et al. Molecular Analysis of Biliary Tract Cancers with the Custom 3′ RACE-Based NGS Panel. Diagnostics 2023, 13, 3168. https://doi.org/10.3390/diagnostics13203168
Mitiushkina NV, Tiurin VI, Anuskina AA, Bordovskaya NA, Shestakova AD, Martianov AS, Bubnov MG, Shishkina AS, Semina MV, Romanko AA, et al. Molecular Analysis of Biliary Tract Cancers with the Custom 3′ RACE-Based NGS Panel. Diagnostics. 2023; 13(20):3168. https://doi.org/10.3390/diagnostics13203168
Chicago/Turabian StyleMitiushkina, Natalia V., Vladislav I. Tiurin, Aleksandra A. Anuskina, Natalia A. Bordovskaya, Anna D. Shestakova, Aleksandr S. Martianov, Mikhail G. Bubnov, Anna S. Shishkina, Maria V. Semina, Aleksandr A. Romanko, and et al. 2023. "Molecular Analysis of Biliary Tract Cancers with the Custom 3′ RACE-Based NGS Panel" Diagnostics 13, no. 20: 3168. https://doi.org/10.3390/diagnostics13203168
APA StyleMitiushkina, N. V., Tiurin, V. I., Anuskina, A. A., Bordovskaya, N. A., Shestakova, A. D., Martianov, A. S., Bubnov, M. G., Shishkina, A. S., Semina, M. V., Romanko, A. A., Kuligina, E. S., & Imyanitov, E. N. (2023). Molecular Analysis of Biliary Tract Cancers with the Custom 3′ RACE-Based NGS Panel. Diagnostics, 13(20), 3168. https://doi.org/10.3390/diagnostics13203168