
Clinical Significance of Adropin and Afamin in Evaluating Renal Function and Cardiovascular Health in the Presence of CKD-MBD Biomarkers in Chronic Kidney Disease

 ,
,
Abstract
:1. Introduction
2. Material and Methods
2.1. Study Design and Patients
2.2. Measurements of Clinical Variables/Biomarkers
2.3. Statistical Analysis
3. Results
3.1. Demographic and Biochemical Profile of the Study Participants
3.2. Correlation Analysis
4. Discussion
Limitations
5. Conclusions
6. Future Directions
Author Contributions
Funding
Institutional Review Board Statement
Informed Consent Statement
Data Availability Statement
Acknowledgments
Conflicts of Interest
References
- Kidney Disease Outcomes Quality Initiative (K/DOQI) Group. K/DOQI clinical practice guidelines for management of dyslipidemias in patients with kidney disease. Am. J. Kidney Dis. 2003, 41 (Suppl. 3), S1–S91. [Google Scholar]
- Stopic, B.; Medic-Brkic, B.; Savic-Vujovic, K.; Davidovic, Z.; Todorovic, J.; Dimkovic, N. Biomarkers and Predictors of Adverse Cardiovascular Events in Different Stages of Chronic Kidney Disease. Dose-Response 2022, 20, 15593258221127568. [Google Scholar] [CrossRef] [PubMed]
- Poznyak, A.V.; Sadykhov, N.K.; Kartuesov, A.G.; Borisov, E.E.; Sukhorukov, V.N.; Orekhov, A.N. Atherosclerosis specific features in chronic kidney disease (CKD). Biomedicines 2022, 10, 2094. [Google Scholar] [CrossRef] [PubMed]
- Dube, P.; DeRiso, A.; Patel, M.; Battepati, D.; Khatib-Shahidi, B.; Sharma, H.; Kennedy, D. Vascular calcification in chronic kidney disease: Diversity in the vessel wall. Biomedicines 2021, 9, 404. [Google Scholar] [CrossRef] [PubMed]
- Waziri, B.; Duarte, R.; Naicker, S. Chronic kidney disease–mineral and bone disorder (CKD-MBD): Current perspectives. Int. J. Nephrol. Renov. Dis. 2019, 12, 263. [Google Scholar] [CrossRef]
- Voelkl, J.; Lang, F.; Eckardt, K.U.; Amann, K.; Kuro-o, M.; Pasch, A.; Pieske, B.; Alesutan, I. Signaling pathways involved in vascular smooth muscle cell calcification during hyperphosphatemia. Cell. Mol. Life Sci. 2019, 76, 2077–2091. [Google Scholar] [CrossRef]
- Yuan, C.; Ni, L.; Zhang, C.; Hu, X.; Wu, X. Vascular calcification: New insights into endothelial cells. Microvasc. Res. 2021, 134, 104105. [Google Scholar] [CrossRef]
- Weldegiorgis, M.; Woodward, M. Elevated triglycerides and reduced high-density lipoprotein cholesterol are independently associated with the onset of advanced chronic kidney disease: A cohort study of 911,360 individuals from the United Kingdom. BMC Nephrol. 2022, 23, 312. [Google Scholar]
- D’Arrigo, G.; Mallamaci, F.; Pizzini, P.; Leonardis, D.; Tripepi, G.; Zoccali, C. CKD-MBD biomarkers and CKD progression: An analysis by the joint model. Nephrol. Dial. Transplant. 2023, 38, 932–938. [Google Scholar] [CrossRef]
- Mushala, B.A.; Scott, I. Adropin: A hepatokine modulator of vascular function and cardiac fuel metabolism. Am. J. Physiol.-Heart Circ. Physiol. 2021, 320, H238–H244. [Google Scholar] [CrossRef]
- Jasaszwili, M.; Billert, M.; Strowski, M.Z.; Nowak, K.W.; Skrzypski, M. Adropin as a fat-burning hormone with multiple functions—Review of a decade of research. Molecules 2020, 25, 549. [Google Scholar] [CrossRef] [PubMed]
- Ghoshal, S.; Stevens, J.R.; Billon, C.; Girardet, C.; Sitaula, S.; Leon, A.S.; Rao, D.C.; Skinner, J.S.; Rankinen, T.; Bouchard, C.; et al. Adropin: An endocrine link between the biological clock and cholesterol homeostasis. Mol. Metab. 2018, 8, 51–64. [Google Scholar] [CrossRef] [PubMed]
- Yosaee, S.; Khodadost, M.; Esteghamati, A.; Speakman, J.R.; Shidfar, F.; Nazari, M.N.; Bitarafan, V.; Djafarian, K. Metabolic syndrome patients have lower levels of adropin when compared with healthy overweight/obese and lean subjects. Am. J. Men’s Health 2017, 11, 426–434. [Google Scholar] [CrossRef]
- Maciorkowska, M.; Musiałowska, D.; Małyszko, J. Adropin and irisin in arterial hypertension, diabetes mellitus and chronic kidney disease. Adv. Clin. Exp. Med. Off. Organ Wroc. Med. Univ. 2019, 28, 1571–1575. [Google Scholar] [CrossRef] [PubMed]
- Zang, H.; Jiang, F.; Cheng, X.; Xu, H.; Hu, X. Serum adropin levels are decreased in Chinese type 2 diabetic patients and negatively correlated with body mass index. Endocr. J. 2018, 65, 685–691. [Google Scholar] [CrossRef]
- Kurdiova, T.; Balaz, M.; Kovanicova, Z.; Zemkova, E.; Kuzma, M.; Belan, V.; Payer, J.; Gasperikova, D.; Dieplinger, H.; Ukropcova, B.; et al. Serum afamin a novel marker of increased hepatic lipid content. Front. Endocrinol. 2021, 12, 670425. [Google Scholar] [CrossRef]
- Pang, L.; Duan, N.; Xu, D.; Jiao, L.; Huang, C.; Du, J.; Guo, Q.; Li, H. Urine afamin and afamin–creatinine ratio as biomarkers for kidney injury. Biomark. Med. 2018, 12, 1241–1249. [Google Scholar] [CrossRef]
- Ramesh, T.R.; Lilhore, U.K.; Poongodi, M.; Simaiya, S.; Kaur, A.; Hamdi, M. Predictive analysis of heart diseases with machine learning approaches. Malays. J. Comput. Sci. 2022, 132–148. [Google Scholar] [CrossRef]
- Gheorghe, G.; Toth, P.P.; Bungau, S.; Behl, T.; Ilie, M.; Pantea Stoian, A.; Bratu, O.G.; Bacalbasa, N.; Rus, M.; Diaconu, C.C. Cardiovascular risk and statin therapy considerations in women. Diagnostics 2020, 10, 483. [Google Scholar] [CrossRef]
- Sprague, S.M.; Martin, K.J.; Coyne, D.W. Phosphate Balance and CKD–Mineral Bone Disease. Kidney Int. Rep. 2021, 6, 2049–2058. [Google Scholar] [CrossRef]
- Zhou, C.; Shi, Z.; Ouyang, N.; Ruan, X. Hyperphosphatemia and cardiovascular disease. Front. Cell Dev. Biol. 2021, 9, 644363. [Google Scholar] [CrossRef] [PubMed]
- Hou, Y.C.; Lu, C.L.; Zheng, C.M.; Chen, R.M.; Lin, Y.F.; Liu, W.C.; Yen, T.H.; Chen, R.; Lu, K.C. Emerging role of vitamins D and K in modulating uremic vascular calcification: The aspect of passive calcification. Nutrients 2019, 11, 152. [Google Scholar] [CrossRef] [PubMed]
- Mikolasevic, I.; Žutelija, M.; Mavrinac, V.; Orlic, L. Dyslipidemia in patients with chronic kidney disease: Etiology and management. Int. J. Nephrol. Renov. Dis. 2017, 10, 35–45. [Google Scholar] [CrossRef] [PubMed]
- Rosenstein, K.; Tannock, L.R. Dyslipidemia in Chronic Kidney Disease; Endotext: South Dartmouth, MA, USA, 2022. [Google Scholar]
- Brnić, D.; Martinovic, D.; Zivkovic, P.M.; Tokic, D.; Tadin Hadjina, I.; Rusic, D.; Vilovic, M.; Supe-Domic, D.; Tonkic, A.; Bozic, J. Serum adropin levels are reduced in patients with inflammatory bowel diseases. Sci. Rep. 2020, 10, 9264. [Google Scholar] [CrossRef]
- Ali, I.I.; D’Souza, C.; Singh, J.; Adeghate, E. Adropin’s role in energy homeostasis and metabolic disorders. Int. J. Mol. Sci. 2022, 23, 8318. [Google Scholar] [CrossRef]
- Juhász, I.; Ujfalusi, S.; Seres, I.; Lőrincz, H.; Varga, V.E.; Paragh, G.; Somodi, S.; Harangi, M.; Paragh, G. Afamin levels and their correlation with oxidative and lipid parameters in non-diabetic, obese patients. Biomolecules 2022, 12, 116. [Google Scholar] [CrossRef]
- Akcılar, R.; Koçak, F.E.; Şimşek, H.; Akcılar, A.; Bayat, Z.; Ece, E.; Kökdaşgil, H. The effect of adropin on lipid and glucose metabolism in rats with hyperlipidemia. Iran. J. Basic Med. Sci. 2016, 19, 245. [Google Scholar]
- Ganesh-Kumar, K.; Zhang, J.; Gao, S.; Rossi, J.; McGuinness, O.P.; Halem, H.H.; Culler, M.D.; Mynatt, R.L.; Butler, A.A. Adropin deficiency is associated with increased adiposity and insulin resistance. Obesity 2012, 20, 1394–1402. [Google Scholar] [CrossRef]
- Akcılar, R.; Koçak, F.A.; Şimşek, H.; Akcılar, A.; Bayat, Z.; Ece, E.; Kökdaşgil, H. Antidiabetic and hypolipidemic effects of adropinin streoptozotocin-induced type 2 diabetic rats. Bratisl. Med. J.-Bratisl. Lek. Listy 2016, 117, 100–105. [Google Scholar] [CrossRef]
- Li, N.; Xie, G.; Zhou, B.; Qu, A.; Meng, H.; Liu, J.; Wang, G. Serum Adropin as a Potential Biomarker for Predicting the Development of Type 2 Diabetes Mellitus in Individuals with Metabolic Dysfunction-Associated Fatty Liver Disease. Front. Physiol. 2021, 12, 696163. [Google Scholar] [CrossRef]
- Wang, B.; Xue, Y.; Shang, F.; Ni, S.; Liu, X.; Fan, B.; Wang, H. Association of serum adropin with the presence of atrial fibrillation and atrial remodeling. J. Clin. Lab. Anal. 2019, 33, e22672. [Google Scholar] [CrossRef] [PubMed]
- Köninger, A.; Mathan, A.; Mach, P.; Frank, M.; Schmidt, B.; Schleussner, E.; Kimmig, R.; Gellhaus, A.; Dieplinger, H. Is afamin a novel biomarker for gestational diabetes mellitus? A pilot study. Reprod. Biol. Endocrinol. 2018, 16, 30. [Google Scholar] [CrossRef] [PubMed]
- Zhang, S.; Chen, Q.; Lin, X.; Chen, M.; Liu, Q. A review of adropin as the medium of dialogue between energy regulation and immune regulation. Oxidative Med. Cell. Longev. 2020, 2020, 3947806. [Google Scholar] [CrossRef] [PubMed]
- Berezina, T.A.; Obradovic, Z.; Boxhammer, E.; Berezin, A.A.; Lichtenauer, M.; Berezin, A.E. Adropin Predicts Chronic Kidney Disease in Type 2 Diabetes Mellitus Patients with Chronic Heart Failure. J. Clin. Med. 2023, 12, 2231. [Google Scholar] [CrossRef]
- Jasaszwili, M.; Wojciechowicz, T.; Billert, M.; Strowski, M.Z.; Nowak, K.W.; Skrzypski, M. Effects of adropin on proliferation and differentiation of 3T3-L1 cells and rat primary preadipocytes. Mol. Cell. Endocrinol. 2019, 496, 110532. [Google Scholar] [CrossRef]
- Yang, C.; DeMars, K.M.; Candelario-Jalil, E. Age-dependent decrease in adropin is associated with reduced levels of endothelial nitric oxide synthase and increased oxidative stress in the rat brain. Aging Dis. 2018, 9, 322–330. [Google Scholar] [CrossRef]
- Berezin, A.E.; Berezin, A.A.; Lichtenauer, M. Myokines and heart failure: Challenging role in adverse cardiac remodeling, myopathy, and clinical outcomes. Dis. Markers 2021, 2021, 6644631. [Google Scholar] [CrossRef]
- Kaburagi, Y.; Takahashi, E.; Kajio, H.; Yamashita, S.; Yamamoto-Honda, R.; Shiga, T.; Unoki-Kubota, H. Urinary afamin levels are associated with the progression of diabetic nephropathy. Diabetes Res. Clin. Pract. 2019, 147, 37–46. [Google Scholar] [CrossRef]


| Clinical Variables | Group I (Healthy Control) (n = 50) | Group II (CKD Stages 1–2 Patients) (n = 50) | Group III (CKD Stages 3–4 Patients) (n = 50) | Group IV (CKD Stages 5 Patients) (n = 50) |
|---|---|---|---|---|
| Age (years) | 40.12 ± 0.26 | 40.23 ± 1.39 | 46.46 ± 1.98 | 48.18 ± 1.45 |
| Gender (F/M) | 28/22 | 19/31 | 25/25 *# | 26/24 *# |
| SBP (mmHg) | 120.9 ± 6.47 | 149.4 ± 3.08 * | 154.8 ± 3.24 * | 159.2 ± 3.36 * |
| DBP (mmHg) | 81 ± 3.41 | 90.2 ± 1.57 * | 93.8 ± 1.63 * | 96.2 ± 1.84 * |
| Creatinine (mg/dL) | 0.88 ± 0.01 | 1.86 ± 0.03 * | 4.84 ± 0.18 *# | 10.50 ± 0.19 *#† |
| Urea (mg/dL) | 24.3 ± 3.2 | 91.12 ± 1.82 * | 121.7 ± 3.44 *# | 198.04 ± 1.69 *#† |
| Calcium (mg/dL) | 6.48 ± 1.21 | 6.94 ± 0.11 | 7.52 ± 0.16 * | 8.98 ± 0.24 *#† |
| Phosphorous (mg/dL) | 4.11 ± 0.23 | 4.34 ± 0.16 | 5.59 ± 0.09 *# | 6.44 ± 0.10 *#† |
| Vitamin D (ng/mL) | 25.97 ± 1.99 | 20.58 ± 1.33 * | 15.98 ± 0.80 * | 12.54 ± 0.69 *# |
| Total cholesterol (mg/dL) | 160.3 ± 4.56 | 181.46 ± 8.02 | 224.4 ± 7.81 *# | 228.4 ± 4.66 *# |
| HDL (mg/dL) | 56.7 ± 0.39 | 54.42 ± 0.56 *# | 45.94 ± 0.31 *# | 42.08 ± 0.81 *#† |
| LDL (mg/dL) | 90.34 ± 4.18 | 114.34 ± 4.82 * | 150.5 ± 4.25 *# | 160.16 ± 4.50 *# |
| TG (mg/dL) | 181.5 ± 14.12 | 192.93 ± 10.78 | 282.08 ± 11.06 * | 293.54 ± 10.41 *# |
| Adropin (pg/mL) | 706.542 ± 11.32 | 413.208 ± 12.32 * | 284.682 ± 9.89 *# | 200.342 ± 8.37 *#† |
| Afamin (mg/L) | 14.476 ± 0.5 | 28.948 ± 0.72 | 64.233 ± 0.99 | 83.243 ± 1.46 *# |
| Adropin (pg/mL) | Group IV | Group III | Group II | |||
|---|---|---|---|---|---|---|
| r | p-Value | r | p-Value | r | p-Value | |
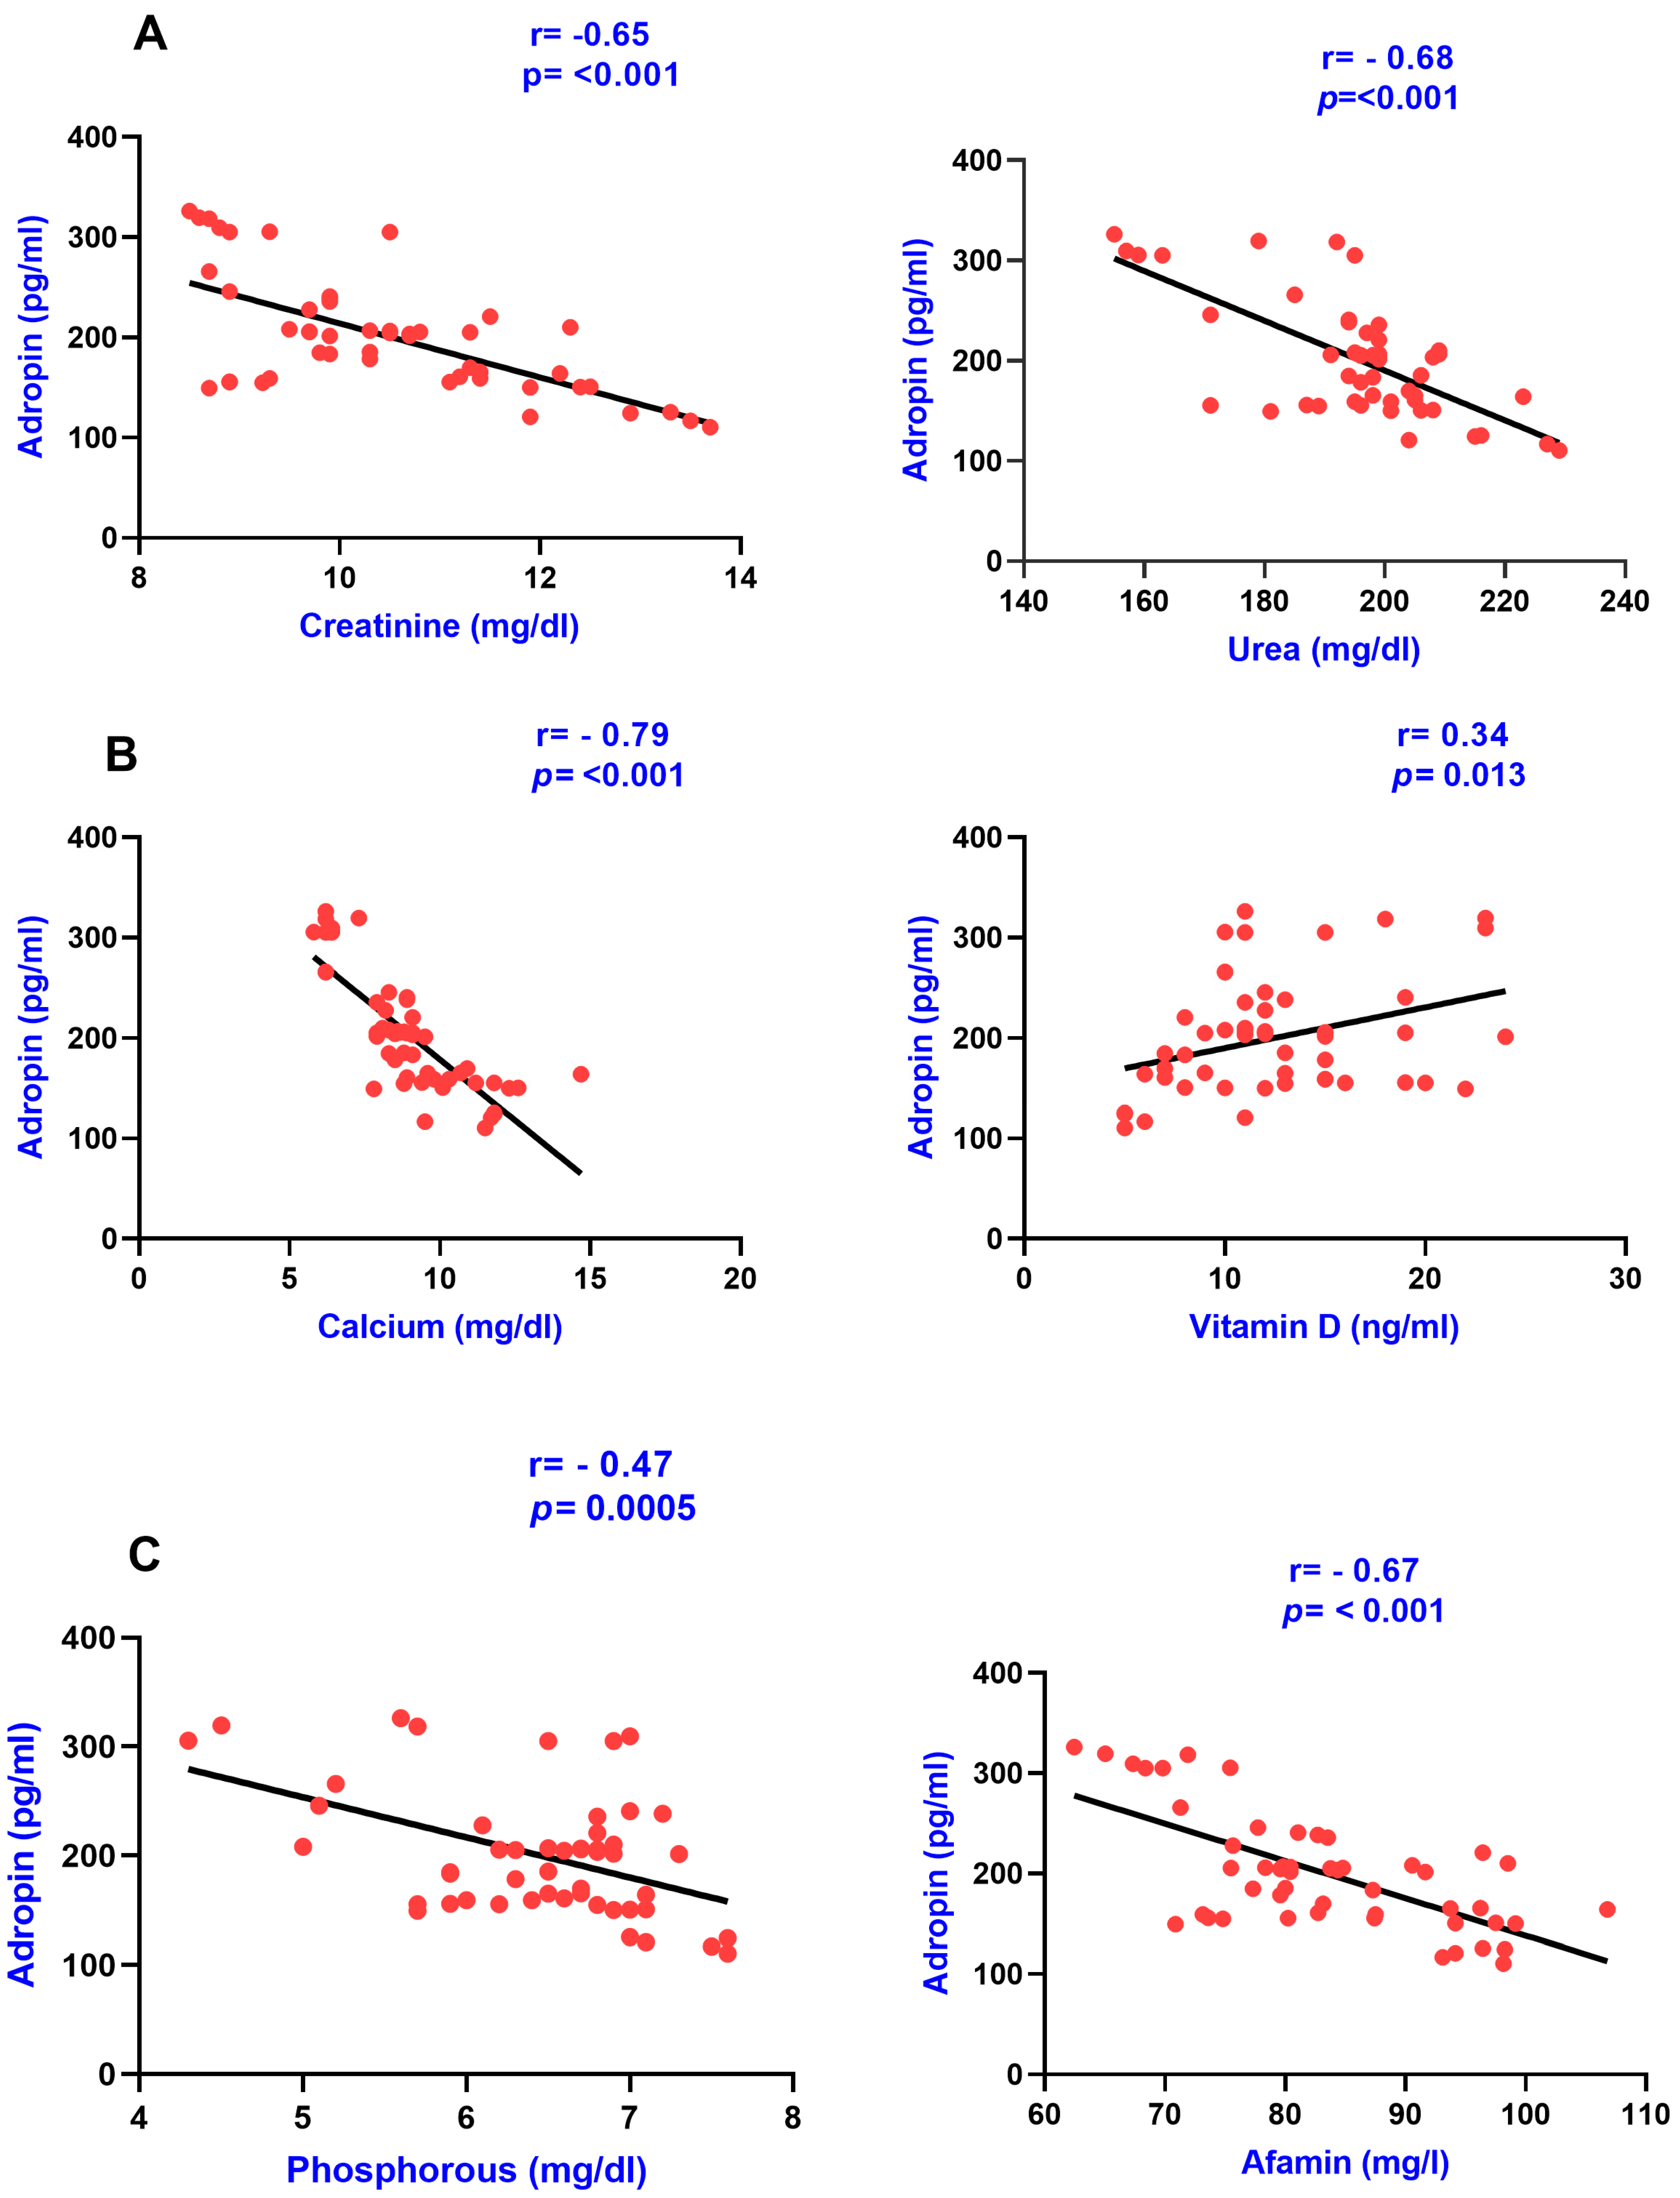
| Afamin (mg/L) | −0.6702 | <0.001 | −0.751 | <0.001 | −0.505 | <0.0002 |
| Creatinine (mg/dL) | −0.6556 | <0.001 | −0.807 | <0.001 | −0.838 | <0.001 |
| Urea (mg/dL) | −0.6886 | <0.001 | −0.787 | 0.0008 | −0.811 | <0.001 |
| Calcium (mg/dL) | −0.7964 | <0.001 | −0.7408 | <0.001 | −0.694 | 0.001 |
| Phosphorous (mg/dL) | −0.4737 | 0.0005 | −0.4598 | 0.0008 | −0.469 | 0.0006 |
| Vitamin D (ng/mL) | 0.3464 | 0.0137 | 0.704 | <0.001 | 0.558 | <0.001 |
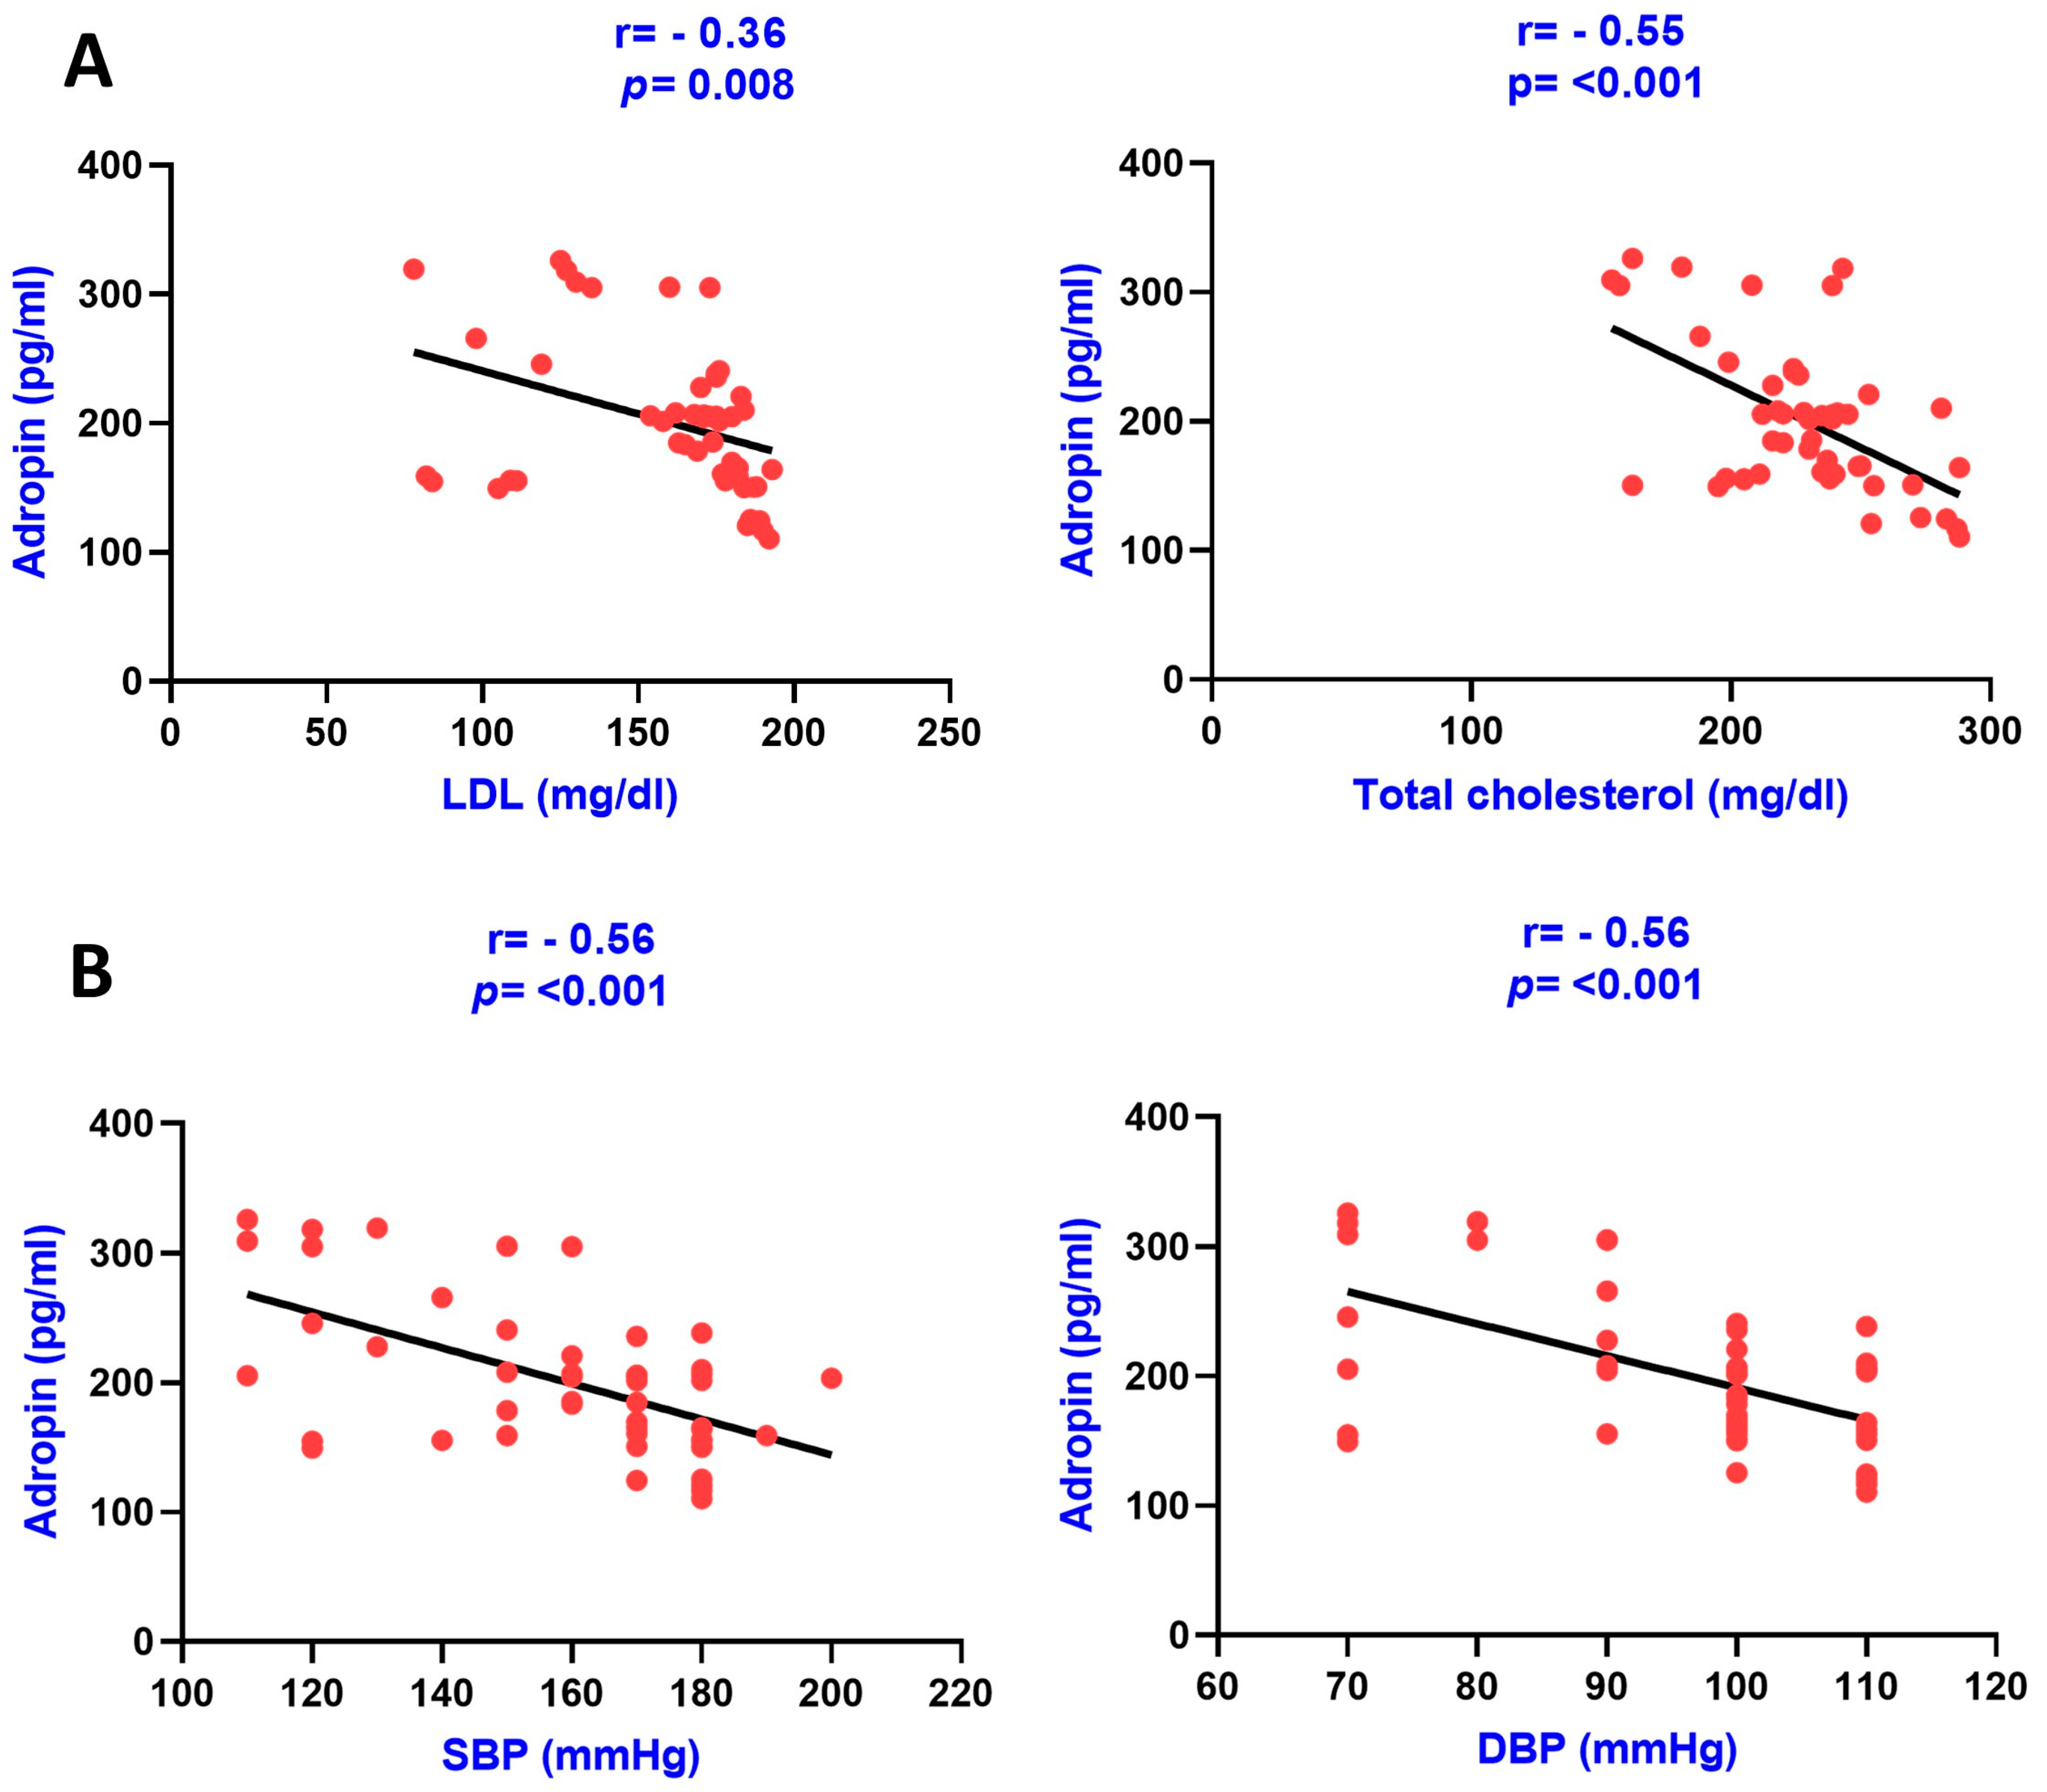
| LDL (mg/dL) | −0.3679 | 0.0086 | −0.826 | <0.001 | −0.606 | <0.001 |
| TG (mg/dL) | −0.7087 | <0.001 | −0.733 | <0.001 | −0.750 | <0.001 |
| Total cholesterol (mg/dL) | −0.5512 | <0.001 | −0.753 | <0.001 | −0.538 | <0.001 |
| HDL (mg/dL) | 0.0316 | 0.8274 | −0.0728 | <0.001 | −0.04 | 0.762 |
| SBP (mmHg) | −0.5693 | <0.001 | −0.665 | <0.001 | −0.4357 | 0.002 |
| DBP (mmHg) | −0.5615 | <0.001 | −0.751 | <0.001 | −0.3847 | 0.005 |
| Afamin (mg/L) | Group IV | Group III | Group II | |||
|---|---|---|---|---|---|---|
| r | p | r | p | r | p | |
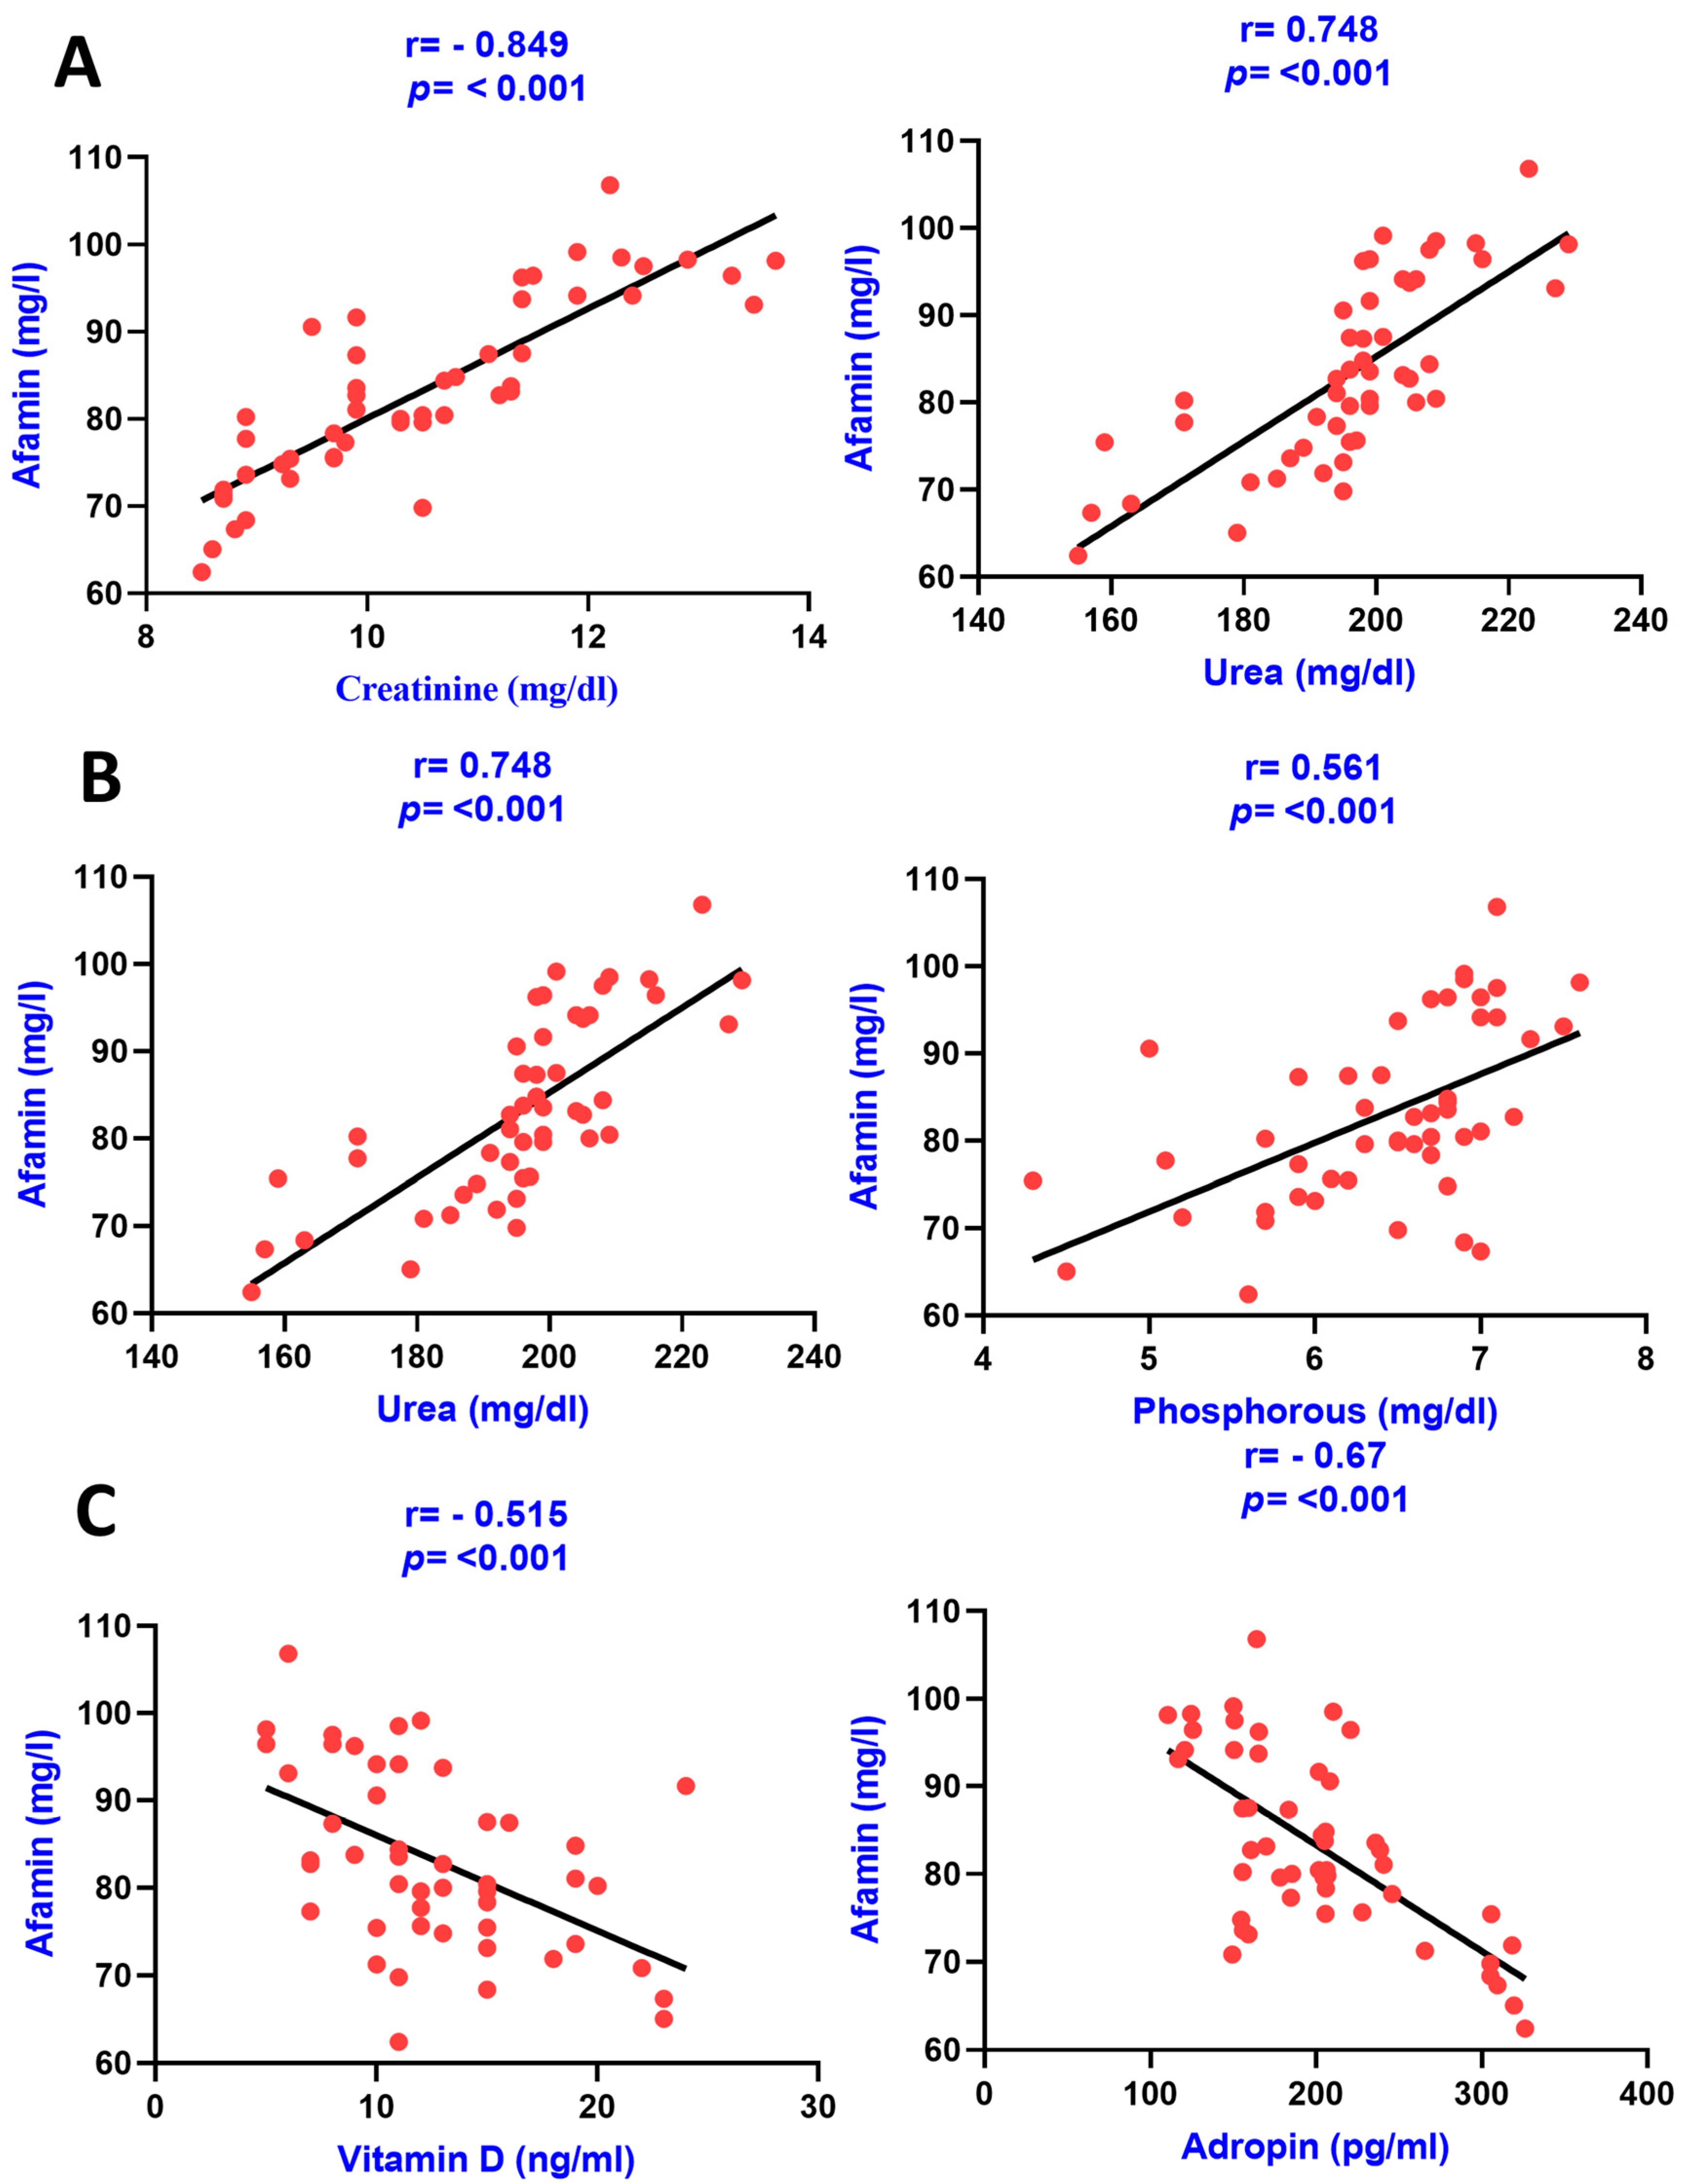
| Adropin (pg/mL) | −0.670 | <0.001 | −0.7643 | <0.001 | −0.505 | <0.002 |
| Creatinine (mg/dL) | 0.849 | <0.001 | 0.916 | <0.001 | 0.664 | <0.001 |
| Urea (mg/dL) | 0.748 | <0.001 | 0.8873 | <0.001 | 0.545 | <0.001 |
| Calcium (mg/dL) | 0.777 | <0.001 | 0.5511 | <0.001 | 0.1838 | 0.2012 |
| Phosphorous (mg/dL) | 0.561 | <0.001 | 0.2186 | 0.12 | 0.329 | 0.020 |
| Vitamin D (ng/mL) | −0.515 | <0.001 | −0.663 | <0.001 | −0.395 | 0.005 |
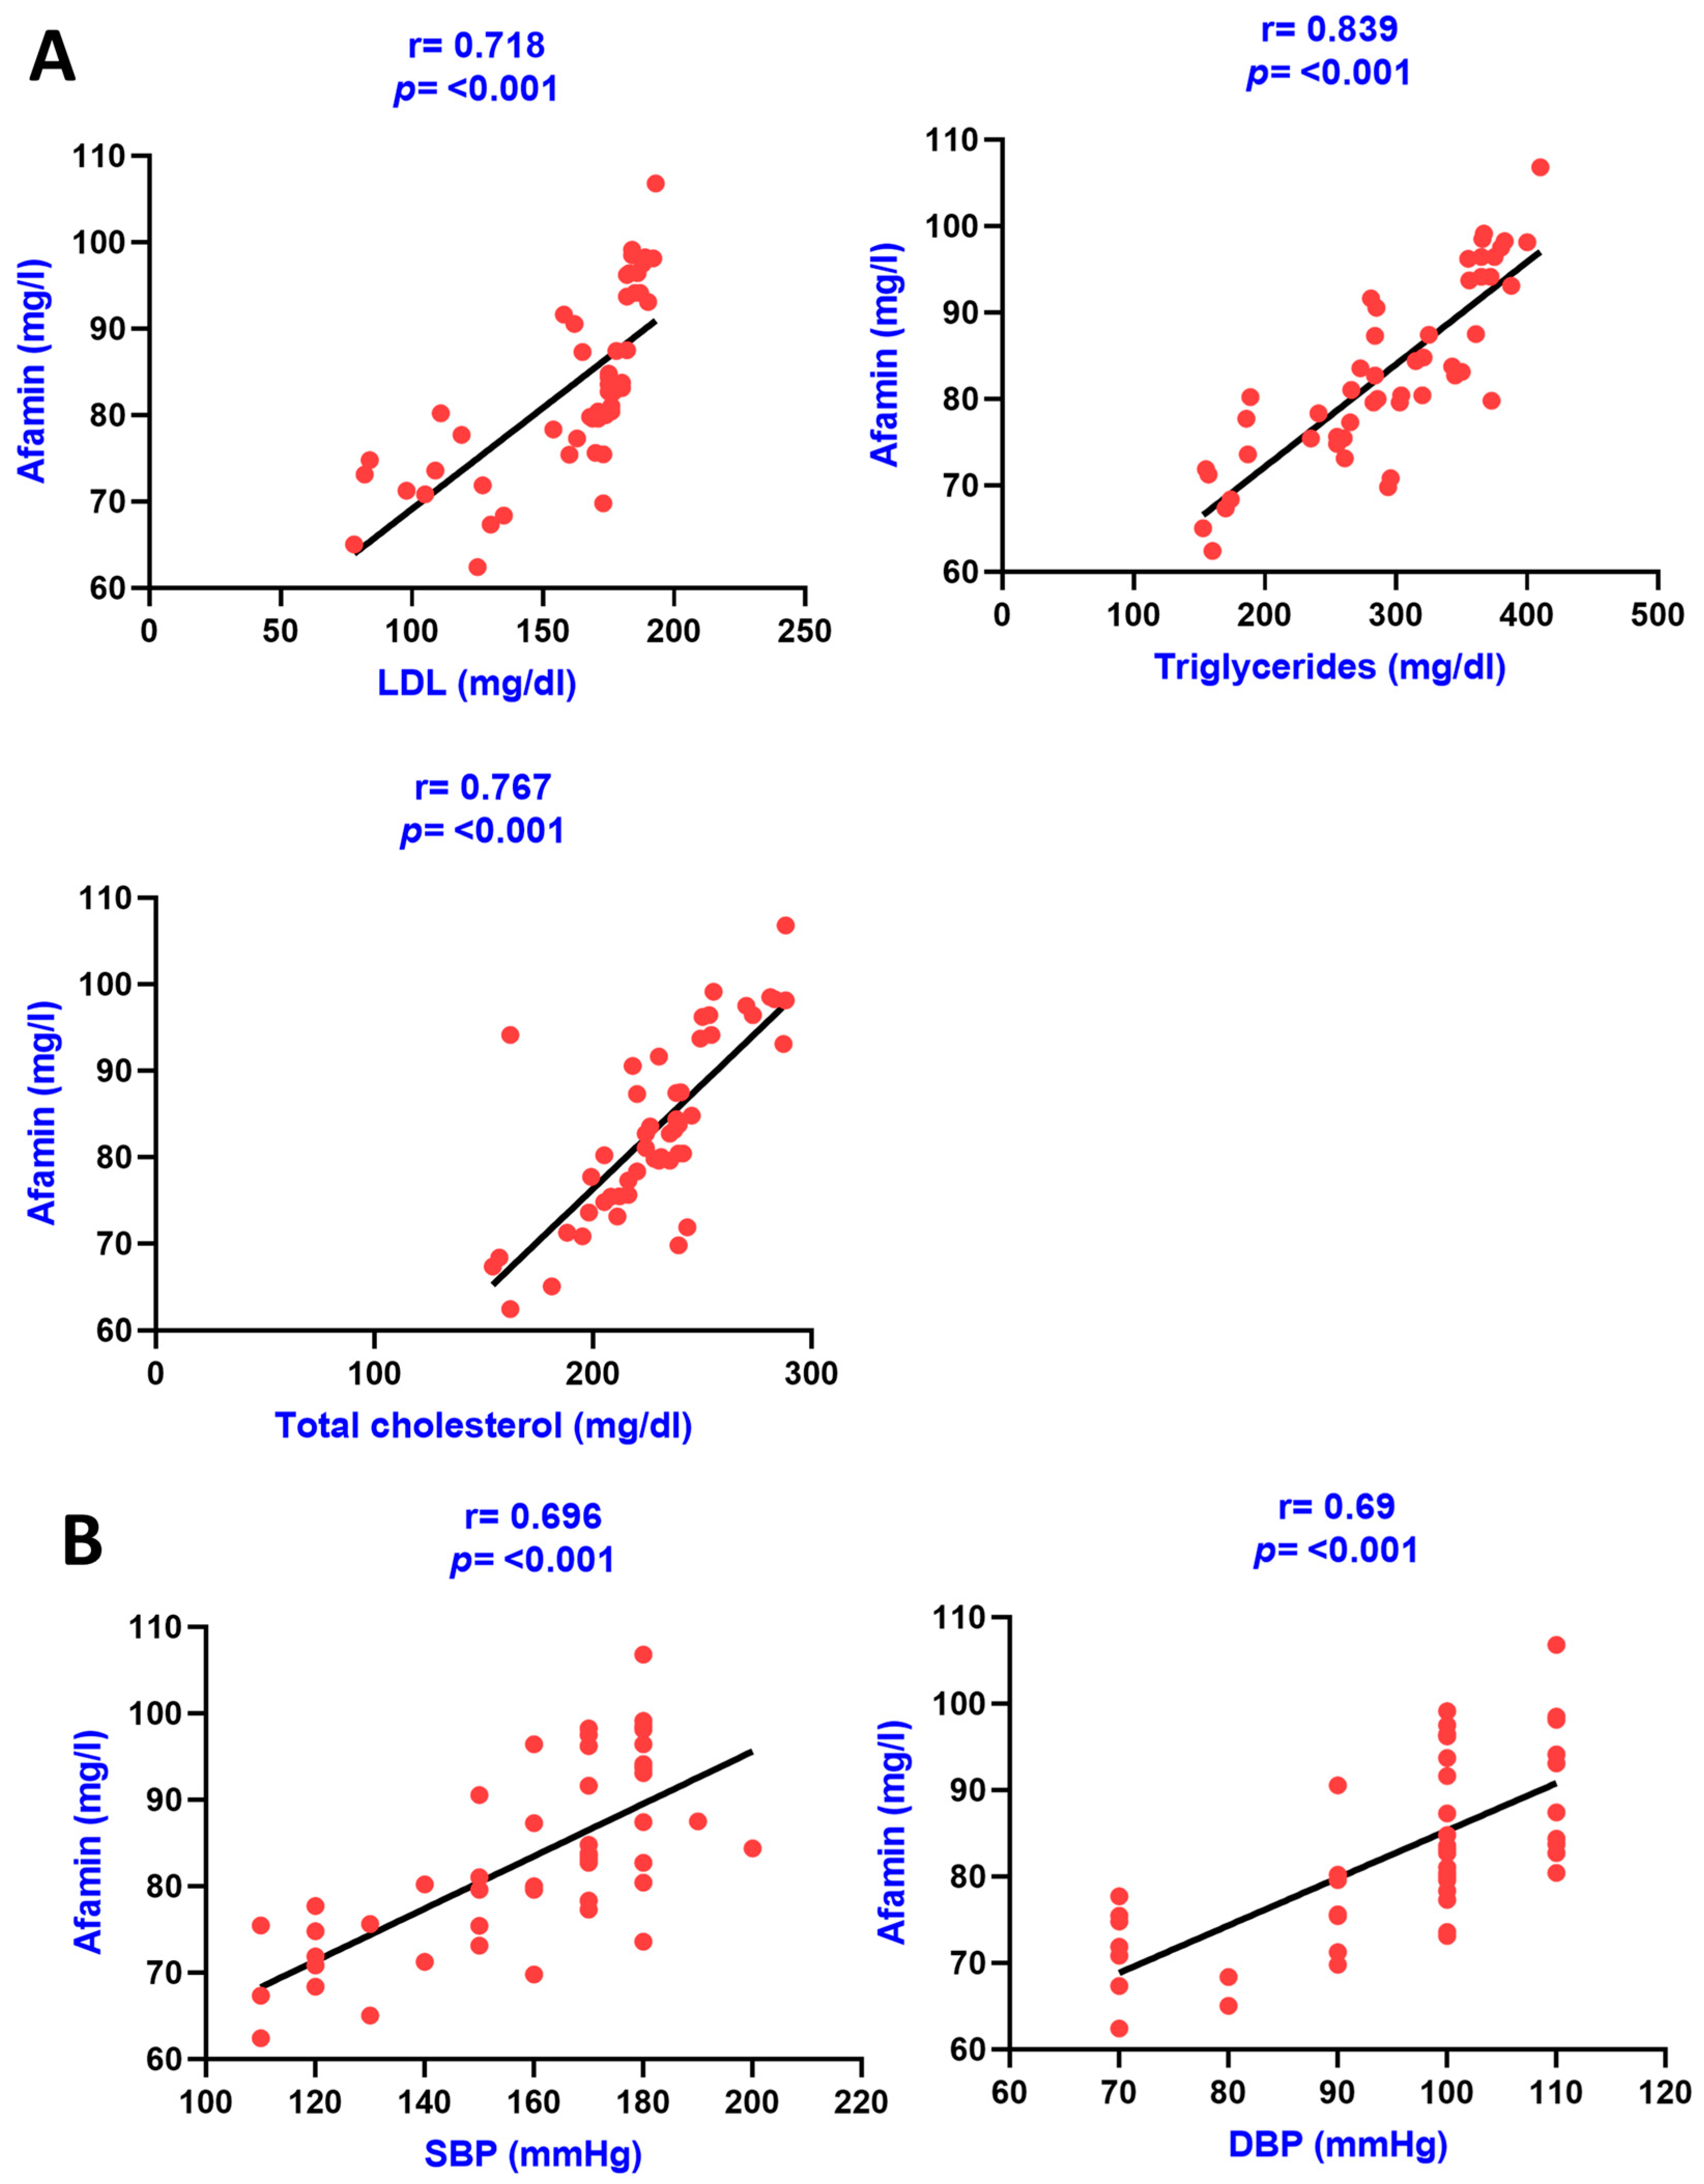
| LDL (mg/dL) | 0.718 | <0.001 | 0.842 | <0.001 | 0.556 | <0.001 |
| TG (mg/dL) | 0.839 | <0.001 | 0.790 | <0.001 | 0.641 | <0.001 |
| Total cholesterol (mg/dL) | 0.767 | <0.001 | 0.857 | <0.001 | 0.662 | <0.001 |
| SBP | 0.694 | <0.001 | 0.833 | <0.001 | 0.3149 | 0.259 |
| DBP | 0.690 | <0.001 | 0.767 | <0.001 | 0.2045 | 0.154 |
| Afamin (mg/L) | Group IV | Group III | Group II | |||
|---|---|---|---|---|---|---|
| R2 | p Value | R2 | p Value | R2 | p Value | |
| Adropin (pg/mL) | 0.74 | 0.05 | -------- | ------- | ||
| Calcium (mg/dL) | 0.71 | 0.0003 | -------- | ------- | ||
| Phosphorous (mg/dL) | ------- | -------- | ------- | |||
| Vitamin D (ng/mL) | ------- | 0.71 | 0.05 | |||
| LDL (mg/dL) | 0.75 | 0.36 | 0.94 | 0.05 | ||
| TG (mg/dL) | ------- | -------- | ------- | |||
| TC (mg/dL) | ------- | 0.52 | 0.01 | |||
| SBP (mmHg) | ------- | -------- | ------- | |||
| DBP (mmHg) | ------- | -------- | ------- | |||
| Creatinine (mg/dL) | 0.88 | 0.04 | 0.95 | 0.0002 | 0.88 | 0.02 |
| Adropin (pg/mL) | Group IV | Group III | Group II | |||
|---|---|---|---|---|---|---|
| R2 | p Value | R2 | p Value | R2 | p Value | |
| Afamin (mg/L) | 0.74 | 0.05 | ||||
| Calcium (mg/dL) | 0.66 | <0.0001 | 0.52 | 0.02 | 0.36 | 0.0001 |
| Phosphorous (mg/dL) | ------- | -------- | ------- | |||
| Vitamin D (ng/mL) | 0.49 | 0.76 | 0.62 | 0.05 | 0.61 | 0.05 |
| LDL (mg/dL) | 0.72 | 0.04 | -------- | ------- | ||
| TG (mg/dL) | 0.85 | 0.001 | -------- | ------- | ||
| TC (mg/dL) | ------- | -------- | ------- | |||
| SBP (mmHg) | ------- | -------- | ------- | |||
| DBP (mmHg) | ------- | -------- | ------- | |||
| Creatinine (mg/dL) | 0.88 | 0.5 | 0.91 | 0.0005 | 0.86 | 0.0001 |
Disclaimer/Publisher’s Note: The statements, opinions and data contained in all publications are solely those of the individual author(s) and contributor(s) and not of MDPI and/or the editor(s). MDPI and/or the editor(s) disclaim responsibility for any injury to people or property resulting from any ideas, methods, instructions or products referred to in the content. |
© 2023 by the authors. Licensee MDPI, Basel, Switzerland. This article is an open access article distributed under the terms and conditions of the Creative Commons Attribution (CC BY) license (https://creativecommons.org/licenses/by/4.0/).
Share and Cite
Kaur, R.; Krishan, P.; Kumari, P.; Singh, T.; Singh, V.; Singh, R.; Ahmad, S.F. Clinical Significance of Adropin and Afamin in Evaluating Renal Function and Cardiovascular Health in the Presence of CKD-MBD Biomarkers in Chronic Kidney Disease. Diagnostics 2023, 13, 3158. https://doi.org/10.3390/diagnostics13193158
Kaur R, Krishan P, Kumari P, Singh T, Singh V, Singh R, Ahmad SF. Clinical Significance of Adropin and Afamin in Evaluating Renal Function and Cardiovascular Health in the Presence of CKD-MBD Biomarkers in Chronic Kidney Disease. Diagnostics. 2023; 13(19):3158. https://doi.org/10.3390/diagnostics13193158
Chicago/Turabian StyleKaur, Rupinder, Pawan Krishan, Pratima Kumari, Tanveer Singh, Varinder Singh, Ravinder Singh, and Sheikh F. Ahmad. 2023. "Clinical Significance of Adropin and Afamin in Evaluating Renal Function and Cardiovascular Health in the Presence of CKD-MBD Biomarkers in Chronic Kidney Disease" Diagnostics 13, no. 19: 3158. https://doi.org/10.3390/diagnostics13193158
APA StyleKaur, R., Krishan, P., Kumari, P., Singh, T., Singh, V., Singh, R., & Ahmad, S. F. (2023). Clinical Significance of Adropin and Afamin in Evaluating Renal Function and Cardiovascular Health in the Presence of CKD-MBD Biomarkers in Chronic Kidney Disease. Diagnostics, 13(19), 3158. https://doi.org/10.3390/diagnostics13193158