
Estimation of Obesity Levels through the Proposed Predictive Approach Based on Physical Activity and Nutritional Habits

 ,
,  , ,
, ,  ,
,  ,
,  ,
,  and
and 
Abstract
:1. Introduction
2. Materials and Methods
2.1. Study Design, Ethical Approval, and Data Features
- Gender: categorical variable that shows the biological sex of the individual (male or female).
- Age: numerical variable that shows the individual’s age in years.
- Height: numerical variable that shows the individuals’ height in meters.
- Weight: numerical variable that shows the individuals’ weight in kilograms.
- Family history of overweight: categorical variable that shows if the individual has a family member who is overweight or obese (yes or no).
- Frequently consumed high-calorie food (FAVC): categorical variable that shows if the individual often eats high-calorie food (yes or no).
- Frequency of consumption of vegetables (FCVC): ordinal variable that shows how often the individual eats vegetables (1 = never, 2 = sometimes, 3 = always).
- Number of main meals (NCP): ordinal variable that shows how many main meals the individual has daily (1 = between 1 and 2, 2 = three, 3 = more than three, 4 = no answer).
- Consumption of food between meals (CAEC): ordinal variable that shows how often the individual eats food between meals (1 = no, 2 = sometimes, 3 = frequently, 4 = always).
- SMOKE: categorical variable that shows whether the individual smokes or not (yes or no).
- Consumption of water daily (CH2O): ordinal variable that shows how much water the individual drinks daily (1 = less than a liter, 2 = between 1 and 2 L, 3 = more than 2 L).
- Monitor calorie intake (SCC): categorical variable that shows if the individual keeps track of their caloric intake (yes or no).
- Frequency of physical activity (FAF): ordinal variable that shows how often the individual does physical activity (1 = never, 2 = once or twice a week, 3 = two or three times a week, 4 = four or five times a week).
- Time using electronic devices (TUE): ordinal variable that shows how long the individual uses electronic devices (0 = none, 1 = less than an hour, 2 = between one and three hours, 3 = more than three hours).
- Consumption of alcohol (CALC): ordinal variable that shows how often the individual drinks alcohol (1 = no, 2 = sometimes, 3 = frequently, 4 = always).
- Type of transportation used (MTRANS): categorical variable that shows what kind of transportation the individual uses (automobile, motorbike, bike, public transportation, walking).
- Level of obesity according to body mass index (NObesity): ordinal variable that shows the obesity level of the individual according to their BMI (insufficient weight normal weight, overweight level I, overweight level II, obesity type I, obesity type II, obesity type III). The related attribute was the primary outcome [22].
2.2. Data Preprocessing
2.3. Data-Generated Training, Testing, and Validation Procedures
2.4. Model Development
2.5. Hyperparameter Optimization
2.6. Performance Evaluation Metrics
2.7. Biostatistical Data and Power Analyses
3. Results
3.1. Biostatistical Results
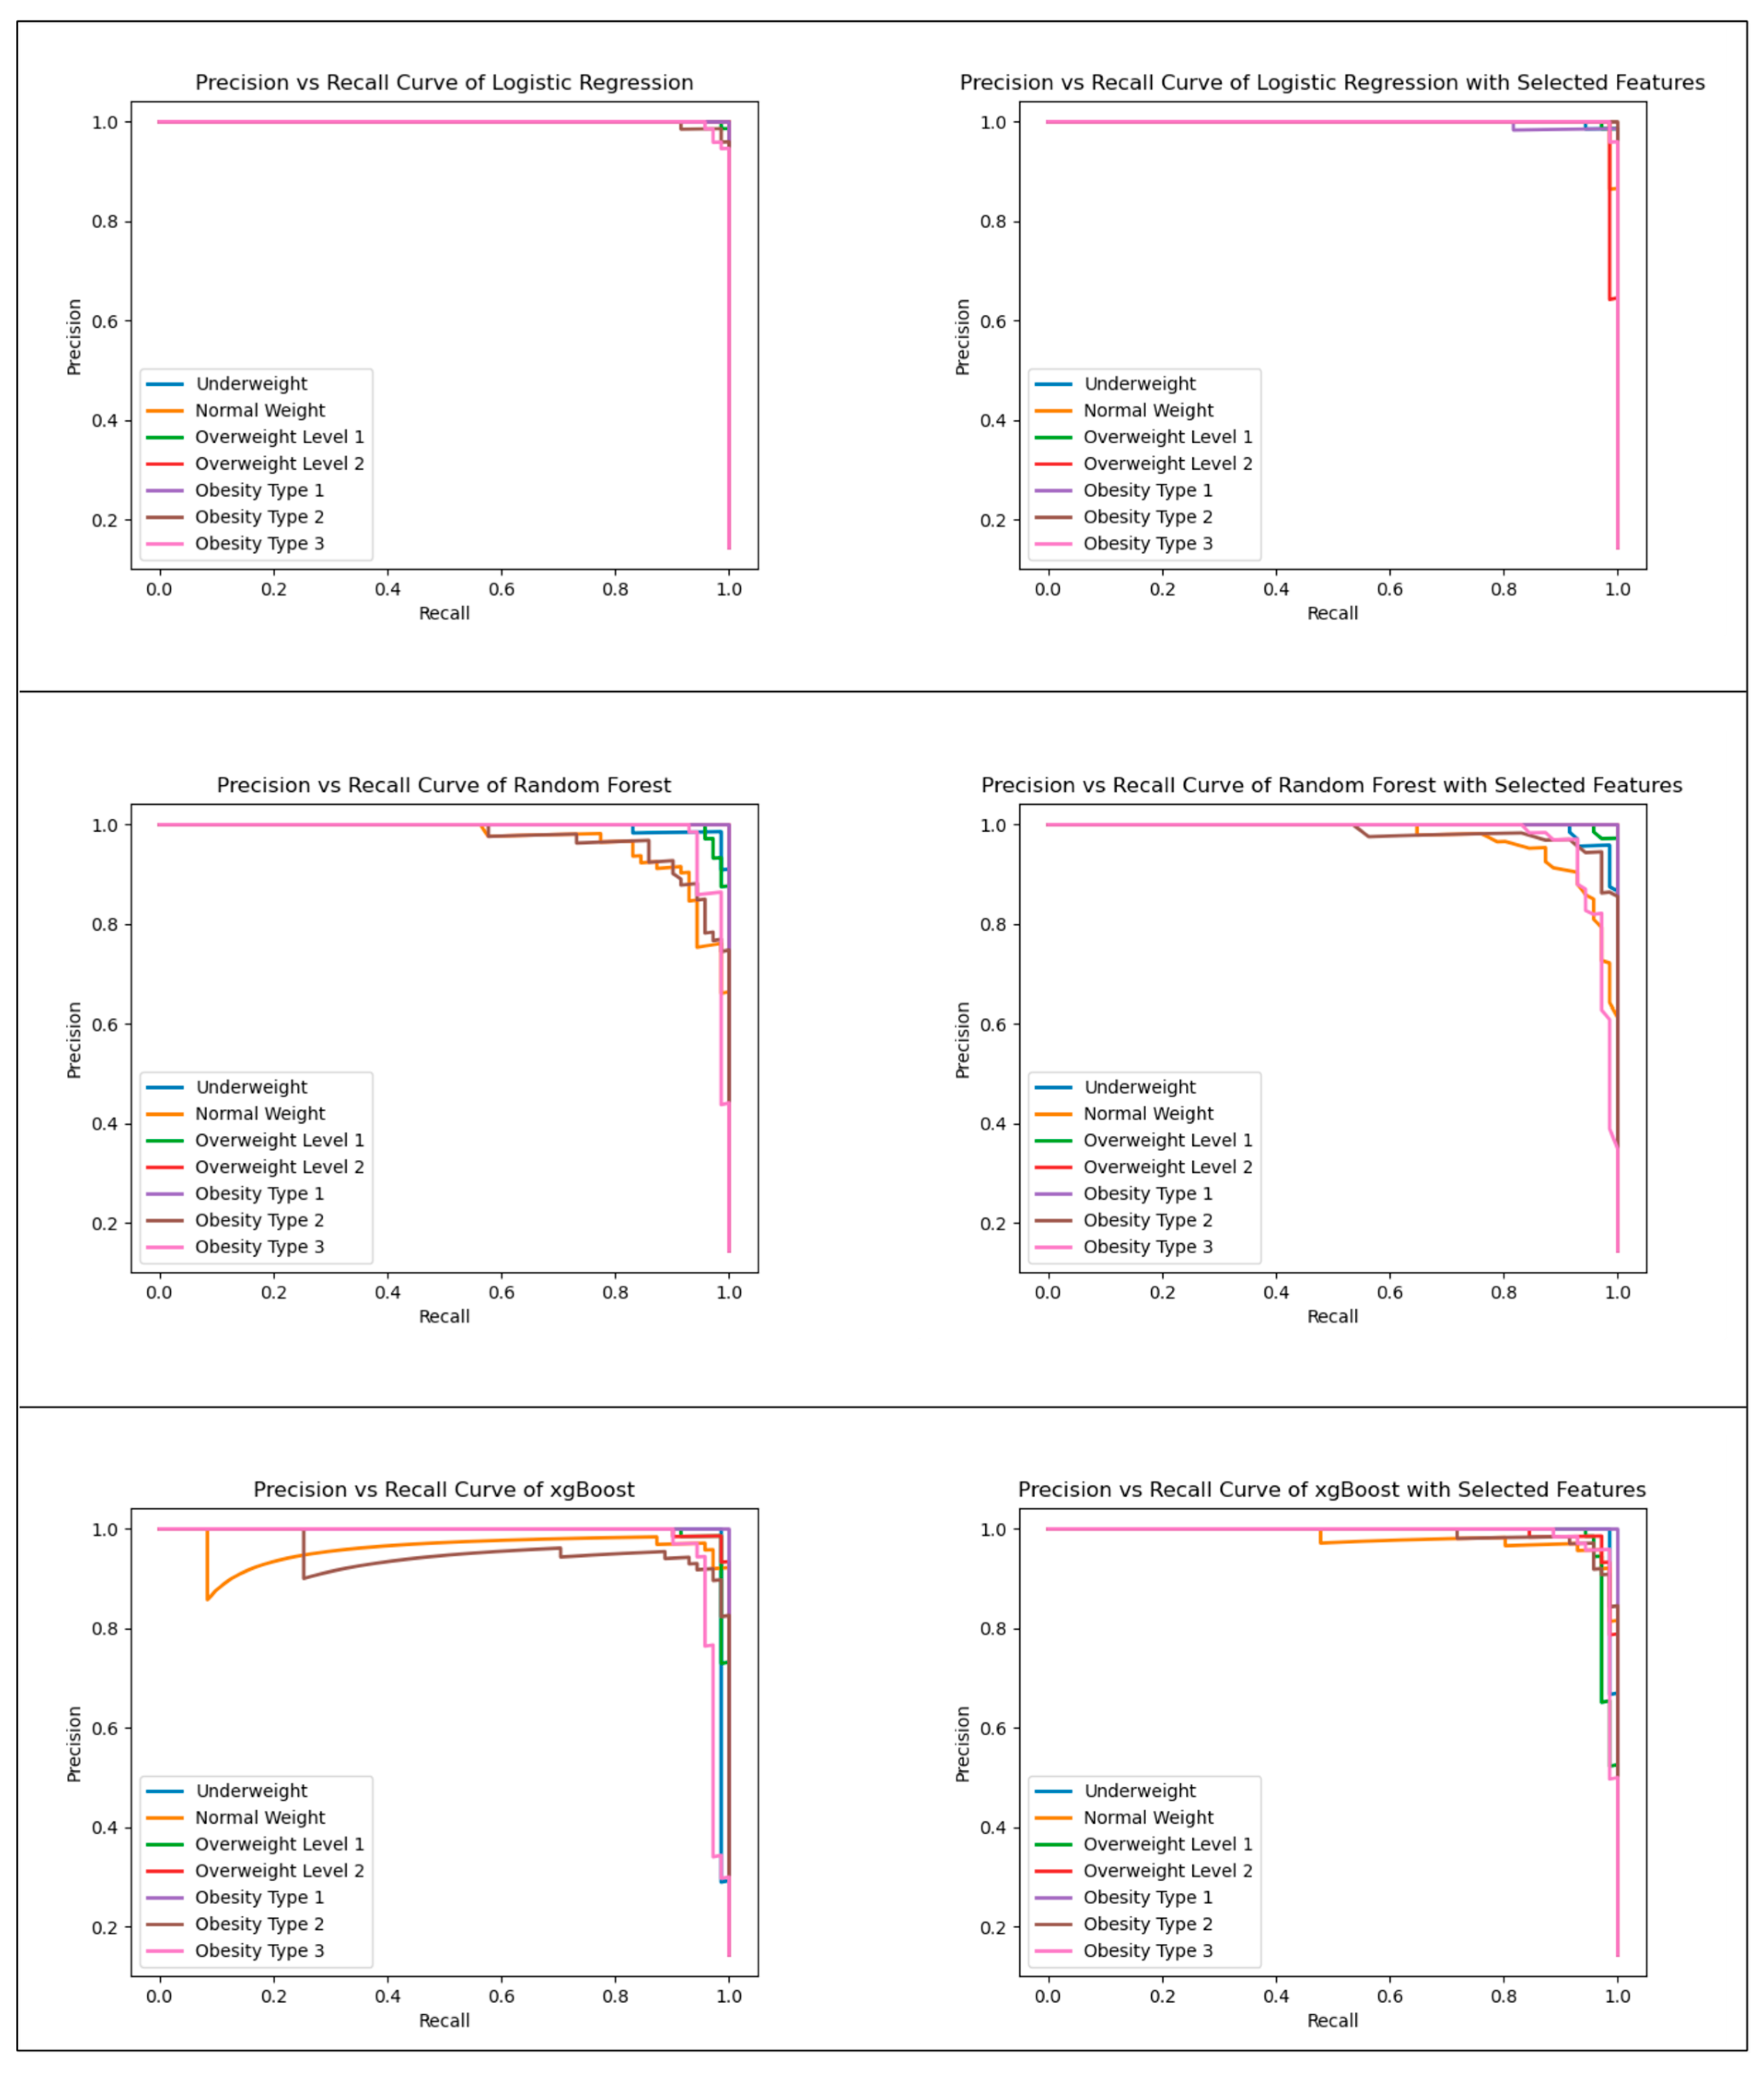
3.2. Modeling Results Using All Features for Obesity Level Estimation
3.3. Modeling Results with the Biomarker Candidate Selected Features for Obesity Level Estimation
4. Discussion
5. Conclusions
Author Contributions
Funding
Institutional Review Board Statement
Informed Consent Statement
Data Availability Statement
Acknowledgments
Conflicts of Interest
References
- Withrow, D.; Alter, D.A. The economic burden of obesity worldwide: A systematic review of the direct costs of obesity. Obes. Rev. 2011, 12, 131–141. [Google Scholar] [CrossRef]
- Apovian, C.M. Obesity: Definition, comorbidities, causes, and burden. Am. J. Manag. Care 2016, 22, S176–S185. [Google Scholar]
- Kelly, A.S.; Barlow, S.E.; Rao, G.; Inge, T.H.; Hayman, L.L.; Steinberger, J.; Urbina, E.M.; Ewing, L.J.; Daniels, S.R. Severe obesity in children and adolescents: Identification, associated health risks, and treatment approaches: A scientific statement from the American Heart Association. Circulation 2013, 128, 1689–1712. [Google Scholar] [CrossRef]
- Collaborators, G.O. Health effects of overweight and obesity in 195 countries over 25 years. N. Engl. J. Med. 2017, 377, 13–27. [Google Scholar] [CrossRef] [PubMed]
- Yagin, F.H.; Gülü, M.; Gormez, Y.; Castañeda-Babarro, A.; Colak, C.; Greco, G.; Fischetti, F.; Cataldi, S. Estimation of Obesity Levels with a Trained Neural Network Approach optimized by the Bayesian Technique. Appl. Sci. 2023, 13, 3875. [Google Scholar] [CrossRef]
- Okunogbe, A.; Nugent, R.; Spencer, G.; Ralston, J.; Wilding, J. Economic impacts of overweight and obesity: Current and future estimates for eight countries. BMJ Glob. Health 2021, 6, e006351. [Google Scholar] [CrossRef] [PubMed]
- Clemmensen, C.; Petersen, M.B.; Sørensen, T.I. Will the COVID-19 pandemic worsen the obesity epidemic? Nat. Rev. Endocrinol. 2020, 16, 469–470. [Google Scholar] [CrossRef]
- Haththotuwa, R.N.; Wijeyaratne, C.N.; Senarath, U. Worldwide epidemic of obesity. In Obesity and Obstetrics; Elsevier: Amsterdam, The Netherlands, 2020; pp. 3–8. [Google Scholar]
- Navidad, L.; Padial-Ruz, R.; González, M.C. Nutrition, Physical activity, and new technology programs on obesity prevention in primary education: A systematic review. Int. J. Environ. Res. Public Health 2021, 18, 10187. [Google Scholar] [CrossRef]
- Calañas-Continente, A. Alimentación saludable basada en la evidencia. Endocrinol. Nutr. 2005, 52, 8–24. [Google Scholar] [CrossRef]
- Rush, E.; Yan, M. Evolution not revolution: Nutrition and obesity. Nutrients 2017, 9, 519. [Google Scholar] [CrossRef]
- Savarino, G.; Corsello, A.; Corsello, G. Macronutrient balance and micronutrient amounts through growth and development. Ital. J. Pediatr. 2021, 47, 109. [Google Scholar] [CrossRef] [PubMed]
- Poli, V.F.S.; Sanches, R.B.; dos Santos Moraes, A.; Fidalgo, J.P.N.; Nascimento, M.A.; Bresciani, P.; Andrade-Silva, S.G.; Cipullo, M.A.T.; Clemente, J.C.; Caranti, D.A. The excessive caloric intake and micronutrient deficiencies related to obesity after a long-term interdisciplinary therapy. Nutrition 2017, 38, 113–119. [Google Scholar] [CrossRef] [PubMed]
- Camacho, S.; Ruppel, A. Is the calorie concept a real solution to the obesity epidemic? Glob. Health Action 2017, 10, 1289650. [Google Scholar] [CrossRef]
- Guo, X.; Xia, X.; Tang, R.; Zhou, J.; Zhao, H.; Wang, K. Development of a real-time PCR method for Firmicutes and Bacteroidetes in faeces and its application to quantify intestinal population of obese and lean pigs. Lett. Appl. Microbiol. 2008, 47, 367–373. [Google Scholar] [CrossRef] [PubMed]
- Favé, G.; Beckmann, M.; Draper, J.; Mathers, J.C. Measurement of dietary exposure: A challenging problem which may be overcome thanks to metabolomics? Genes Nutr. 2009, 4, 135–141. [Google Scholar] [CrossRef]
- Chin, S.H.; Kahathuduwa, C.; Binks, M. Physical activity and obesity: What we know and what we need to know. Obes. Rev. 2016, 17, 1226–1244. [Google Scholar] [CrossRef]
- Hills, A.P.; Andersen, L.B.; Byrne, N.M. Physical activity and obesity in children. Br. J. Sports Med. 2011, 45, 866–870. [Google Scholar] [CrossRef]
- Söderlund, A.; Fischer, A.; Johansson, T. Physical activity, diet and behaviour modification in the treatment of overweight and obese adults: A systematic review. Perspect. Public Health 2009, 129, 132–142. [Google Scholar] [CrossRef] [PubMed]
- Taylor, D. Physical activity is medicine for older adults. Postgrad. Med. J. 2014, 90, 26–32. [Google Scholar] [CrossRef]
- Méndez-Hernández, L.D.; Ramírez-Moreno, E.; Barrera-Gálvez, R.; Cabrera-Morales, M.d.C.; Reynoso-Vázquez, J.; Flores-Chávez, O.R.; Morales-Castillejos, L.; Cruz-Cansino, N.d.S.; Jiménez-Sánchez, R.C.; Arias-Rico, J. Effects of Strength Training on Body Fat in Children and Adolescents with Overweight and Obesity: A Systematic Review with Meta-Analysis. Children 2022, 9, 995. [Google Scholar] [CrossRef]
- Palechor, F.M.; de la Hoz Manotas, A. Dataset for estimation of obesity levels based on eating habits and physical condition in individuals from Colombia, Peru and Mexico. Data Brief 2019, 25, 104344. [Google Scholar] [CrossRef] [PubMed]
- Ratih, I.D.; Retnaningsih, S.M.; Islahulhaq, I.; Dewi, V.M. Synthetic minority over-sampling technique nominal continous logistic regression for imbalanced data. AIP Conf. Proc. 2022, 2668, 070021. [Google Scholar]
- Chen, X.-w.; Jeong, J.C. Enhanced Recursive Feature Elimination. In Proceedings of the Sixth International Conference on Machine Learning and Applications (ICMLA 2007), Cincinnati, OH, USA, 13–15 December 2007; pp. 429–435. [Google Scholar]
- Lamba, R.; Gulati, T.; Jain, A. A hybrid feature selection approach for parkinson’s detection based on mutual information gain and recursive feature elimination. Arab. J. Sci. Eng. 2022, 47, 10263–10276. [Google Scholar] [CrossRef]
- Li, L.; Ching, W.-K.; Liu, Z.-P. Robust biomarker screening from gene expression data by stable machine learning-recursive feature elimination methods. Comput. Biol. Chem. 2022, 100, 107747. [Google Scholar] [CrossRef]
- DeMaris, A. A tutorial in logistic regression. J. Marriage Fam. 1995, 57, 956–968. [Google Scholar] [CrossRef]
- Raza, A.; Al Nasar, M.R.; Hanandeh, E.S.; Zitar, R.A.; Nasereddin, A.Y.; Abualigah, L. A Novel Methodology for Human Kinematics Motion Detection Based on Smartphones Sensor Data Using Artificial Intelligence. Technologies 2023, 11, 55. [Google Scholar] [CrossRef]
- Raza, A.; Rustam, F.; Siddiqui, H.U.R.; Diez, I.d.l.T.; Ashraf, I. Predicting microbe organisms using data of living micro forms of life and hybrid microbes classifier. PLoS ONE 2023, 18, e0284522. [Google Scholar] [CrossRef]
- Rigatti, S.J. Random forest. J. Insur. Med. 2017, 47, 31–39. [Google Scholar] [CrossRef]
- Ester, M.; Kriegel, H.; Xu, X. XGBoost: A scalable tree boosting system. In Proceedings of the 22nd ACM SIGKDD International Conference on Knowledge Discovery and Data Mining, San Francisco, CA, USA, 13–17 August 2016; p. 785. [Google Scholar]
- Wu, J.; Chen, X.-Y.; Zhang, H.; Xiong, L.-D.; Lei, H.; Deng, S.-H. Hyperparameter optimization for machine learning models based on Bayesian optimization. J. Electron. Sci. Technol. 2019, 17, 26–40. [Google Scholar]
- Jones, D.R. A taxonomy of global optimization methods based on response surfaces. J. Glob. Optim. 2001, 21, 345–383. [Google Scholar] [CrossRef]
- Head, T.; Kumar, M.; Nahrstaedt, H.; Louppe, G.; Shcherbatyi, I. Scikit-Optimize/Scikit-Optimize; Zenodo: Genova, Switzerland, 2021. [Google Scholar]
- Bisong, E.; Bisong, E. More supervised machine learning techniques with scikit-learn. In Building Machine Learning and Deep Learning Models on Google Cloud Platform: A Comprehensive Guide for Beginners; Springer: Berlin/Heidelberg, Germany, 2019; pp. 287–308. [Google Scholar]
- Yin, M.; Wortman Vaughan, J.; Wallach, H. Understanding the effect of accuracy on trust in machine learning models. In Proceedings of the 2019 Chi Conference on Human Factors in Computing Systems, Glasgow, Scotland, 4–9 May 2019; pp. 1–12. [Google Scholar]
- Davis, J.; Goadrich, M. The relationship between Precision-Recall and ROC curves. In Proceedings of the 23rd International Conference on Machine Learning, Pittsburgh, PA, USA, 25–29 June 2006; pp. 233–240. [Google Scholar]
- Chicco, D.; Jurman, G. The advantages of the Matthews correlation coefficient (MCC) over F1 score and accuracy in binary classification evaluation. BMC Genom. 2020, 21, 6. [Google Scholar] [CrossRef]
- Yasar, S.; Yagin, F.H.; Arslan, A.K.; Colak, C.; Yologlu, S. Interactive web-based software for evaluating diagnostic tests and roc curve analyses in health sciences. Ann. Med. Res. 2021, 28, 2012–2018. [Google Scholar] [CrossRef]
- Yagin, F.H.; Alkhateeb, A.; Colak, C.; Azzeh, M.; Yagin, B.; Rueda, L. A Fecal-Microbial-Extracellular-Vesicles-Based Metabolomics Machine Learning Framework and Biomarker Discovery for Predicting Colorectal Cancer Patients. Metabolites 2023, 13, 589. [Google Scholar] [CrossRef]
- Raza, A.; Siddiqui, H.U.R.; Munir, K.; Almutairi, M.; Rustam, F.; Ashraf, I. Ensemble learning-based feature engineering to analyze maternal health during pregnancy and health risk prediction. PLoS ONE 2022, 17, e0276525. [Google Scholar] [CrossRef] [PubMed]
- Miao, J.; Zhu, W. Precision–recall curve (PRC) classification trees. Evol. Intell. 2022, 15, 1545–1569. [Google Scholar] [CrossRef]
- Jayasinghe, S.; Holloway, T.P.; Soward, R.; Patterson, K.A.; Ahuja, K.D.; Dalton, L.; Murray, S.; Hughes, R.; Byrne, N.M.; Hills, A.P. “An Ounce of Prevention is Worth a Pound of Cure”: Proposal for a Social Prescribing Strategy for Obesity Prevention and Improvement in Health and Well-being. JMIR Res. Protoc. 2023, 12, e41280. [Google Scholar] [CrossRef] [PubMed]
- Solomon, D.D.; Khan, S.; Garg, S.; Gupta, G.; Almjally, A.; Alabduallah, B.I.; Alsagri, H.S.; Ibrahim, M.M.; Abdallah, A.M.A. Hybrid Majority Voting: Prediction and Classification Model for Obesity. Diagnostics 2023, 13, 2610. [Google Scholar] [CrossRef]
- Mondal, P.K.; Foysal, K.H.; Norman, B.A.; Gittner, L.S. Predicting Childhood Obesity Based on Single and Multiple Well-Child Visit Data Using Machine Learning Classifiers. Sensors 2023, 23, 759. [Google Scholar] [CrossRef] [PubMed]
- Roy, M.; Das, S.; Protity, A.T. OBESEYE: Interpretable Diet Recommender for Obesity Management using Machine Learning and Explainable AI. arXiv 2023, arXiv:2308.02796. [Google Scholar]
- Safaei, M.; Sundararajan, E.A.; Driss, M.; Boulila, W.; Shapi’i, A. A systematic literature review on obesity: Understanding the causes & consequences of obesity and reviewing various machine learning approaches used to predict obesity. Comput. Biol. Med. 2021, 136, 104754. [Google Scholar]

| Obesity Levels | n | % |
|---|---|---|
| Underweight | 34 | 6.8 |
| Normal Weight | 287 | 57.6 |
| Overweight Level I | 47 | 9.4 |
| Overweight Level II | 11 | 2.2 |
| Obesity Type I | 3 | 0.6 |
| Obesity Type II | 58 | 11.6 |
| Obesity Type III | 58 | 11.6 |
| Total | 498 | 100 |
| Variable | Category | Obesity Levels | p-Value | ||||||
|---|---|---|---|---|---|---|---|---|---|
| Underweight | Normal Weight | Overweight Level I | Overweight Level II | Obesity Type I | Obesity Type II | Obesity Type III | |||
| n = 287 | n = 287 | n = 287 | n = 287 | n = 287 | n = 287 | n = 287 | |||
| n (%) | n (%) | n (%) | n (%) | n (%) | n (%) | n (%) | |||
| Gender | Female | 142 a (16.70) | 141 a (16.50) | 119 a,d (14.00) | 32 b (3.80) | 195 c (22.90) | 131 a (15.40) | 92 d (10.80) | <0.001 |
| Male | 145 a (12.50) | 146 a (12.60) | 168 a,d (14.50) | 255 b (22.00) | 92 c (8.00) | 156 a (13.50) | 195 d (16.90) | ||
| Family history of overweight | Yes | 167 a (31.60) | 132 a,c (25.00) | 29 b (5.50) | 13 b (2.50) | 0 (0.00) | 113 c (21.40) | 75 d (14.20) | <0.001 |
| No | 120 a (8.10) | 155 a,c (10.50) | 258 b (17.40) | 274 b (18.50) | 2871 (19.40) | 174 c (11.80) | 212 d (14.30) | ||
| FAVC | Yes | 106 a,c (16.40) | 79 a (12.20) | 47 b (7.30) | 114 c (17.70) | 100 a,c (15.50) | 91 a,c (14.10) | 108 a,c (16.70) | <0.001 |
| No | 181 a.c (13.30) | 208 a (15.20) | 240 b (17.60) | 173 c (12.70) | 187 a,c (13.70) | 196 a,c (14.40) | 179 a,c (13.10) | ||
| FCVC | Newer | 30 a,d,e,f (20.80) | 18 a,b (12.50) | 17 a,c (11.80) | 49 d (34.00) | 0 1 (0.00) | 16 b,c,e (11.10) | 14 b,c,f (9.70) | <0.001 |
| Sometimes | 105 a (11.60) | 155 b (17.20) | 191 c (21.20) | 89 a (9.90) | 0 1(0.00) | 177 b,c (19.60) | 185 b,c (20.50) | ||
| Always | 152 a (15.80) | 114 b,d,e (11.80) | 79 c (8.20) | 149 a,b (15.50) | 287 1 (29.80) | 94 c,d (9.80) | 88 c,e (9.10) | ||
| NCP | Between 1 and 2 | 42 a (10.60) | 52 a,b (13.10) | 77 b,c (19.40) | 58 a,b,c (14.60) | 0 1 (0.00) | 88 c (22.20) | 79 b,c,d (19.90) | <0.001 |
| Three | 169 a (11.40) | 206 b,c (13.90) | 210 b,c (14.20) | 220 b (14.90) | 287 1 (19.40) | 186 a,c (12.60) | 201 a,b (13.60) | ||
| More than three | 76 a (56.70) | 29 b (21.60) | 0 1 (0.00) | 9 c (6.70) | 0 1 (0.00) | 13 b,c (9.70) | 7 c (5.20) | ||
| CAEC | No | 8 a (4.90) | 35 b,c,d (21.50) | 50 b (30.70) | 35 b,c,d (21.50) | 0 1 (0.00) | 16 a,c (9.80) | 19 a,d (11.70) | <0.001 |
| Sometimes | 133 a (28.30) | 83 b (17.70) | 25 c (5.30) | 25 c (5.30) | 96 b (20.40) | 38 c (8.10) | 70 b (14.90) | ||
| Frequently | 124 a (9.80) | 159 a,c,d (12.60) | 204 b (16.10) | 181 b,c (14.30) | 191 b,d (15.10) | 210 b (16.60) | 195 b (15.40) | ||
| Always | 22 a (19.60) | 10 a,c (8.90) | 8 a,c (7.10) | 46 b (41.10) | 0 1 (0.00) | 23 a (20.50) | 3 c (2.70) | ||
| SMOKE | Yes | 274 a (15.70) | 274 a (15.70) | 264 a (15.20) | 195 b (11.20) | 184 b (10.60) | 280 a (16.10) | 270 a (15.50) | <0.001 |
| No | 13 a (4.90) | 13 a (4.90) | 23 a (8.60) | 92 b (34.30) | 103 b (38.40) | 7 a (2.60) | 17 a (6.30) | ||
| CH2O | Less than A L | 98 a (18.20) | 83 a,b,c (15.40) | 80 a,b,c (14.80) | 65 b,c (12.10) | 92 a,b (17.10) | 55 c (10.20) | 66 a,b,c (12.20) | <0.001 |
| Between L and 2 L | 138 a,c,e,f (13.80) | 164 a,b (16.40) | 127 c,d (12.70) | 138 a,c,e,f (13.80) | 97 d (9.70) | 172 b,e (17.20) | 164 b,f (16.40) | ||
| More than 2 L | 51 a,b (10.90) | 40 a (8.50) | 80 b,c,e,f (17.00) | 84 c,e,f (17.90) | 98 c,d (20.90) | 60 a,e (12.80) | 57 a,f (12.10) | ||
| SCC | Yes | 227 a (12.60) | 257 b (14.30) | 276 c (15.30) | 230 a (12.80) | 287 1(16.00) | 246 a,b (13.70) | 276 c (15.30) | <0.001 |
| No | 60 a (28.60) | 30 b (14.30) | 11 c (5.20) | 57 a (27.10) | 0 1 (0.00) | 41 a,b (19.50) | 11 c (5.20) | ||
| FAF | I Do Not Have | 83 a (9.60) | 80 a (9.20) | 137 b (15.80) | 161 b,c (18.50) | 183 c (21.10) | 92 a (10.60) | 132 b (15.20) | <0.001 |
| 1 or 2 days | 44 a (10.40) | 97 b,d,e (22.80) | 70 a,b,e (16.50) | 10 c (2.40) | 0 1 (0.00) | 130 d (30.60) | 74 e (17.40) | ||
| 2 or 4 days | 137 a (24.80) | 69 b (12.50) | 48 b,c (8.70) | 116 a (21.00) | 104 a (18.80) | 39 c (7.10) | 39 c,d (7.10) | ||
| 4 or 5 days | 23 a (14.00) | 41 a (25.00) | 32 a (19.50) | 0 1 (0.00) | 0 1 (0.00) | 26 a (15.90) | 42 a (25.60) | ||
| TUE | 0–2 h | 123 a,e (11.90) | 129 a,b,e (12.50) | 165 b,c,f (16.00) | 173 c,f (16.80) | 98 a (9.50) | 193 c,d (18.70) | 150 e,f (14.50) | <0.001 |
| 3–5 h | 111 a,c,f (15.90) | 122 a (17.50) | 72 b (10.30) | 81 b,c (11.60) | 189 d (27.10) | 40 e (5.70) | 83 b,f (11.90) | ||
| More than 5 h | 53 a (18.90) | 36 a (12.90) | 50 a (17.90) | 33 a (11.80) | 0 1 (0.00) | 54 a (19.30) | 54 a (19.30) | ||
| CALC | No | 0 1 (0.00) | 1 a (100.00) | 0 1 (0.00) | 0 1 (0.00) | 0 1 (0.00) | 0 1 (0.00) | 0 1 (0.00) | <0.001 |
| Sometimes | 6 a (3.00) | 18 a,b,d (9.10) | 37 b,c,d (18.80) | 58c (29.40) | 0 1 (0.00) | 28 d,e (14.20) | 50 c,e (25.40) | ||
| Frequently | 171 a,b (14.80) | 161 a,b (13.90) | 150 a,d (12.90) | 166 a,b (14.30) | 192 b (16.60) | 195 b,c (16.80) | 124 d (10.70) | ||
| Always | 110 a (16.90) | 107 a (16.40) | 100 a (15.30) | 63 b (9.70) | 95 a,b (14.60) | 64 b (9.80) | 113 a (17.30) | ||
| MTRANS | Automobile | 33 a (6.30) | 45 a,c (8.50) | 95 b,d (18.00) | 89 b,d (16.90) | 91 b,d (17.20) | 69 b,c (13.10) | 106 d (20.10) | <0.001 |
| Motorbike | 0 1 (0.00) | 4 a (14.80) | 0 1 (0.00) | 14 b (51.90) | 0 1 (0.00) | 9 a,b (33.30) | 0 1 (0.00) | ||
| Bike | 0 1 (0.00) | 6 a (28.60) | 9 a (42.90) | 0 1 (0.00) | 0 1 (0.00) | 2 a (9.50) | 4 a (19.00) | ||
| Public transportation | 212 a (17.00) | 200 a (16.10) | 179 a,c (14.40) | 126 b (10.10) | 196 a (15.70) | 181 a,c (14.50) | 151 b,c (12.10) | ||
| Walking | 42 a,d,e,f (22.30) | 32 a,b (17.00) | 4 c (2.10) | 58 d (30.90) | 0 1 (0.00) | 26 b,e (13.80) | 26 b,f (13.80) | ||
| Model Name | Validation Accuracy | Hyperparameter Name | Hyperparameter Space Type | Hyperparameter Spaces | Optimal Value |
|---|---|---|---|---|---|
| LR | 95.01% | C | Categorical | 2−15, 2−14, 2−13, …, 213, 214, 215 | 27 |
| Maximum Iterations | Integer | Low = 50, High = 1000 | 286 | ||
| RF | 93.35% | Number of Estimators | Integer | Low = 50, High = 1000 | 527 |
| Maximum Depth | Integer | Low = 50, High = 1000 | 992 | ||
| XGBoost | 98.67% | Number of Estimators | Integer | Low = 50, High = 1000 | 998 |
| Maximum Depth | Integer | Low = 50, High = 1000 | 80 | ||
| Boosters | Categorical | ‘gbtree’, ‘dart’, ‘gblinear’ | gbtree | ||
| Learning Rate | Real | Low = 10−9, High = 10−1 | 0.1 |
| Model | Accuracy | Precision | F1-Score | AUC | Recall |
|---|---|---|---|---|---|
| LR | 98.79% | 99.95% | 98.78% | 99.99% | 98.81% |
| RF | 95.57% | 98.86% | 95.62% | 99.77% | 95.58% |
| XGBoost | 95.77% | 98.25% | 95.76% | 99.63% | 95.80% |
| Model Name | Validation Accuracy | Selected Features | Hyperparameter Name | Hyperparameter Space Type | Hyperparameter Spaces | Optimal Value |
|---|---|---|---|---|---|---|
| LR | 99.33% | Gender, Height, Weight, History, FCVC, FAF | C | Categorical | 2−15, 2−14, 2−13, ….., 213, 214, 215 | 211 |
| Maximum Iterations | Integer | Low = 50, High = 1000 | 280 | |||
| Number of Features | Integer | Low = 1, High = 12 | 6 | |||
| RF | 94.01% | Gender, Height, Weight, MTRANS | Number of Estimators | Integer | Low = 50, High = 1000 | 388 |
| Maximum Depth | Integer | Low = 50, High = 1000 | 53 | |||
| Number of Features | Integer | Low = 1, High = 12 | 4 | |||
| XGBoost | 94.35% | Gender, Height, Weight, History, FAF, SCC, MTRANS | Number of Estimators | Integer | Low = 50, High = 1000 | 980 |
| Maximum Depth | Integer | Low = 50, High = 1000 | 969 | |||
| Boosters | Categorical | ‘gbtree’, ‘dart’, ‘gblinear’ | ‘gbtree’ | |||
| Learning Rate | Real | Low = 10−9, High = 10−1 | 0.002665 | |||
| Number of Features | Integer | Low = 1, High = 12 | 7 |
| Model | Accuracy | Precision | F1-Score | AUC | Recall |
|---|---|---|---|---|---|
| LR | 98.99% | 99.83% | 98.99% | 99.96% | 99.01% |
| RF | 96.17% | 98.94% | 96.18% | 99.76% | 96.19% |
| XGBoost | 95.77% | 99.16% | 95.75% | 99.82% | 95.80% |
Disclaimer/Publisher’s Note: The statements, opinions and data contained in all publications are solely those of the individual author(s) and contributor(s) and not of MDPI and/or the editor(s). MDPI and/or the editor(s) disclaim responsibility for any injury to people or property resulting from any ideas, methods, instructions or products referred to in the content. |
© 2023 by the authors. Licensee MDPI, Basel, Switzerland. This article is an open access article distributed under the terms and conditions of the Creative Commons Attribution (CC BY) license (https://creativecommons.org/licenses/by/4.0/).
Share and Cite
Gozukara Bag, H.G.; Yagin, F.H.; Gormez, Y.; González, P.P.; Colak, C.; Gülü, M.; Badicu, G.; Ardigò, L.P. Estimation of Obesity Levels through the Proposed Predictive Approach Based on Physical Activity and Nutritional Habits. Diagnostics 2023, 13, 2949. https://doi.org/10.3390/diagnostics13182949
Gozukara Bag HG, Yagin FH, Gormez Y, González PP, Colak C, Gülü M, Badicu G, Ardigò LP. Estimation of Obesity Levels through the Proposed Predictive Approach Based on Physical Activity and Nutritional Habits. Diagnostics. 2023; 13(18):2949. https://doi.org/10.3390/diagnostics13182949
Chicago/Turabian StyleGozukara Bag, Harika Gozde, Fatma Hilal Yagin, Yasin Gormez, Pablo Prieto González, Cemil Colak, Mehmet Gülü, Georgian Badicu, and Luca Paolo Ardigò. 2023. "Estimation of Obesity Levels through the Proposed Predictive Approach Based on Physical Activity and Nutritional Habits" Diagnostics 13, no. 18: 2949. https://doi.org/10.3390/diagnostics13182949
APA StyleGozukara Bag, H. G., Yagin, F. H., Gormez, Y., González, P. P., Colak, C., Gülü, M., Badicu, G., & Ardigò, L. P. (2023). Estimation of Obesity Levels through the Proposed Predictive Approach Based on Physical Activity and Nutritional Habits. Diagnostics, 13(18), 2949. https://doi.org/10.3390/diagnostics13182949