Joint Diagnostic Method of Tumor Tissue Based on Hyperspectral Spectral-Spatial Transfer Features
Abstract
1. Introduction
2. Materials and Methods
2.1. Experimental Framework
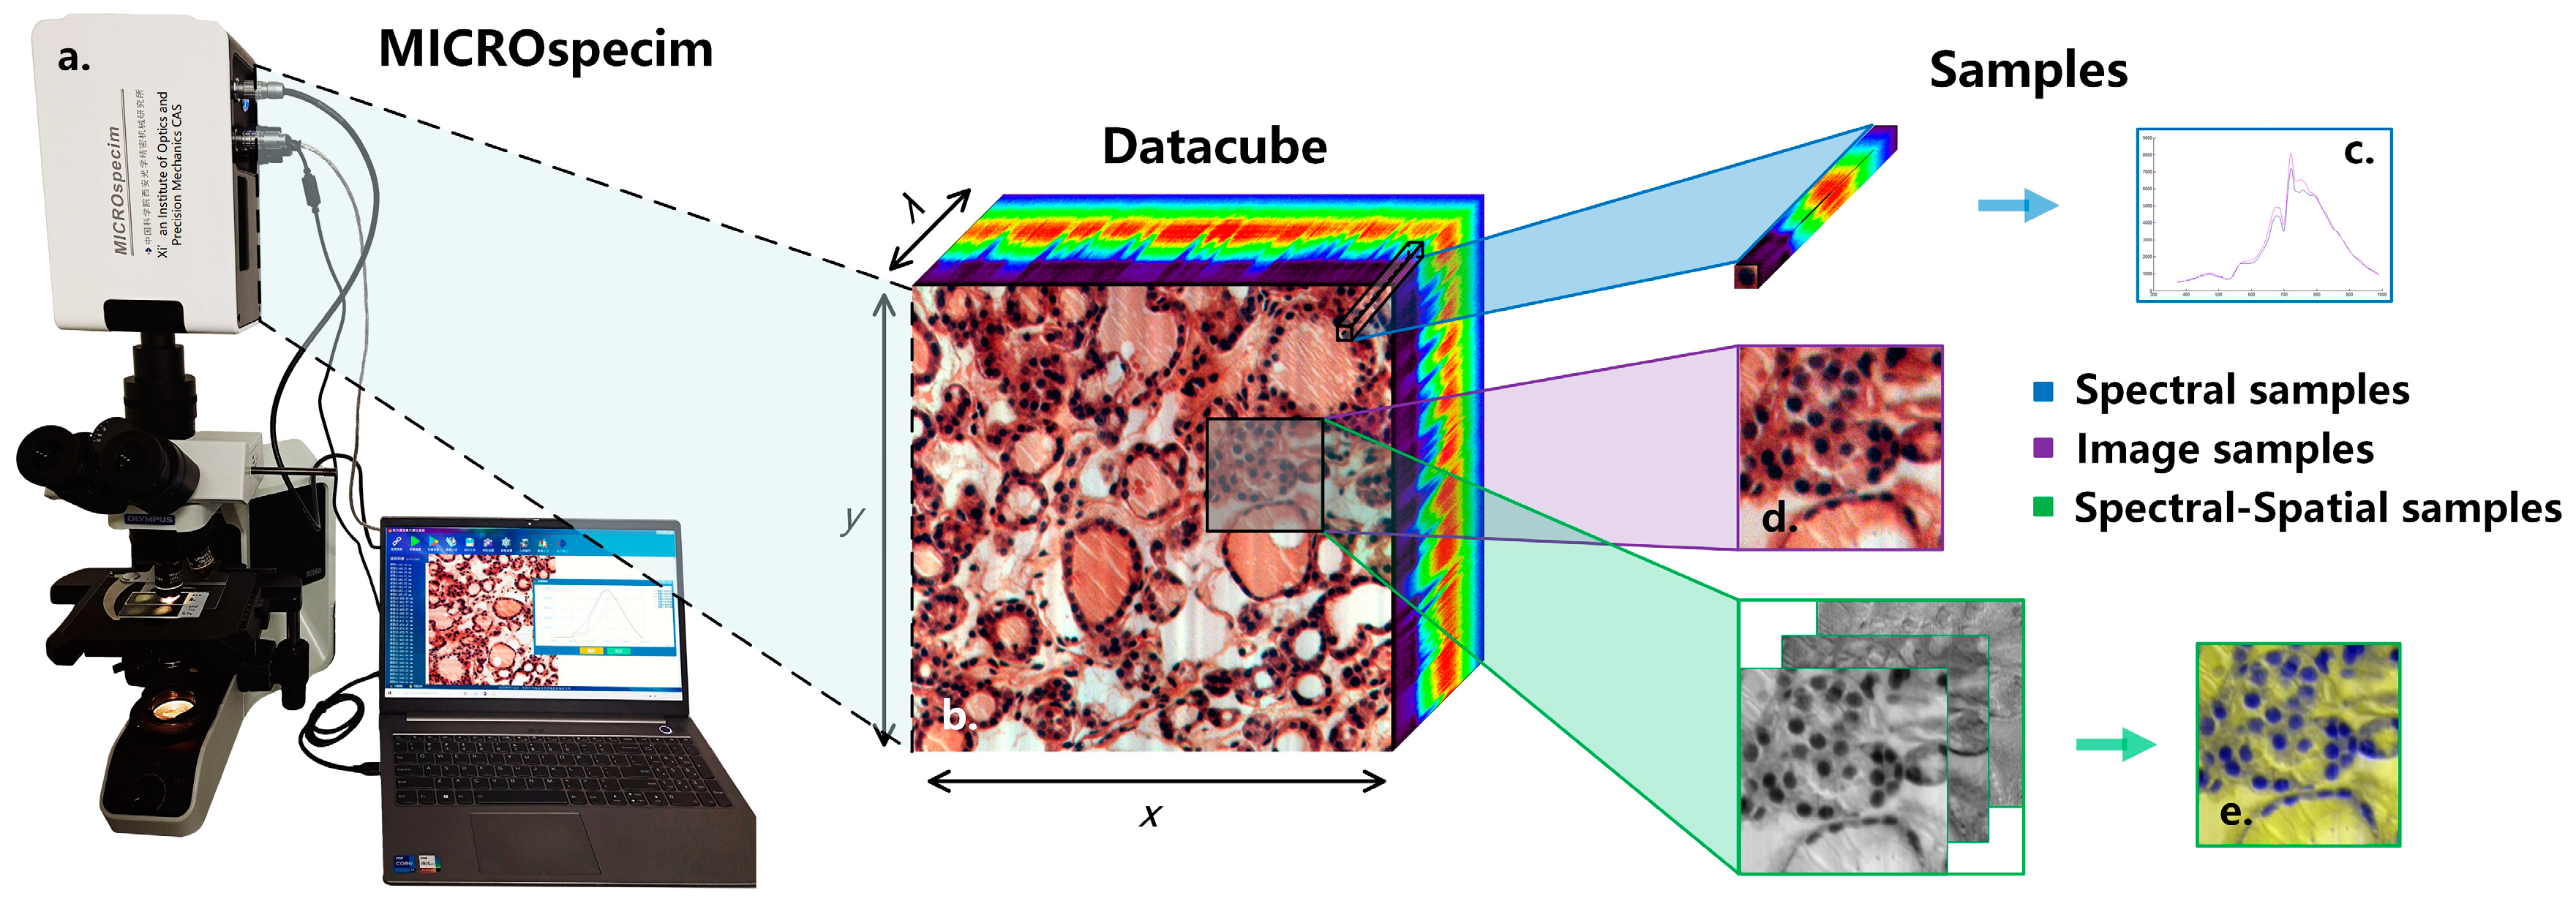
2.2. Micro-Hyperspectral Imaging System
2.3. Experimental Dataset
2.4. Hyperspectral Data Preprocessing
2.4.1. Data Standardization
- 1.
- Whiteboard correction: Firstly, the hardware system of the micro-hyperspectral imaging equipment is corrected by using a white board as the reference target to obtain the . Correction parameters are built into the acquisition software system and used to eliminate hardware differences, including the focal plane.
- 2.
- Flat-field calibration: For the uneven brightness of the same sample caused by uneven smear or different coloring degrees of colorant, real-time calibration is performed during the acquisition process to obtain the . For each column during column scanning, real-time averaging is performed, and then the average is divided by each pixel value in this scanning column. As shown in Equation (1), and are the spectral curves of before and after flat-field calibration at position , respectively. To avoid the influence of outliers, the maximum and minimum 150 spectral values in each column are excluded. Moreover, is the remaining number of pixels.
- 3.
- Transmission spectrum standardization: Due to the slight differences in slice thickness and light source intensity among different samples, the overall image brightness may vary. As shown in Equation (2), the standardized transmission spectrum is obtained by dividing by , and the average spectrum of the part without medium coating or background region is selected as the reference.
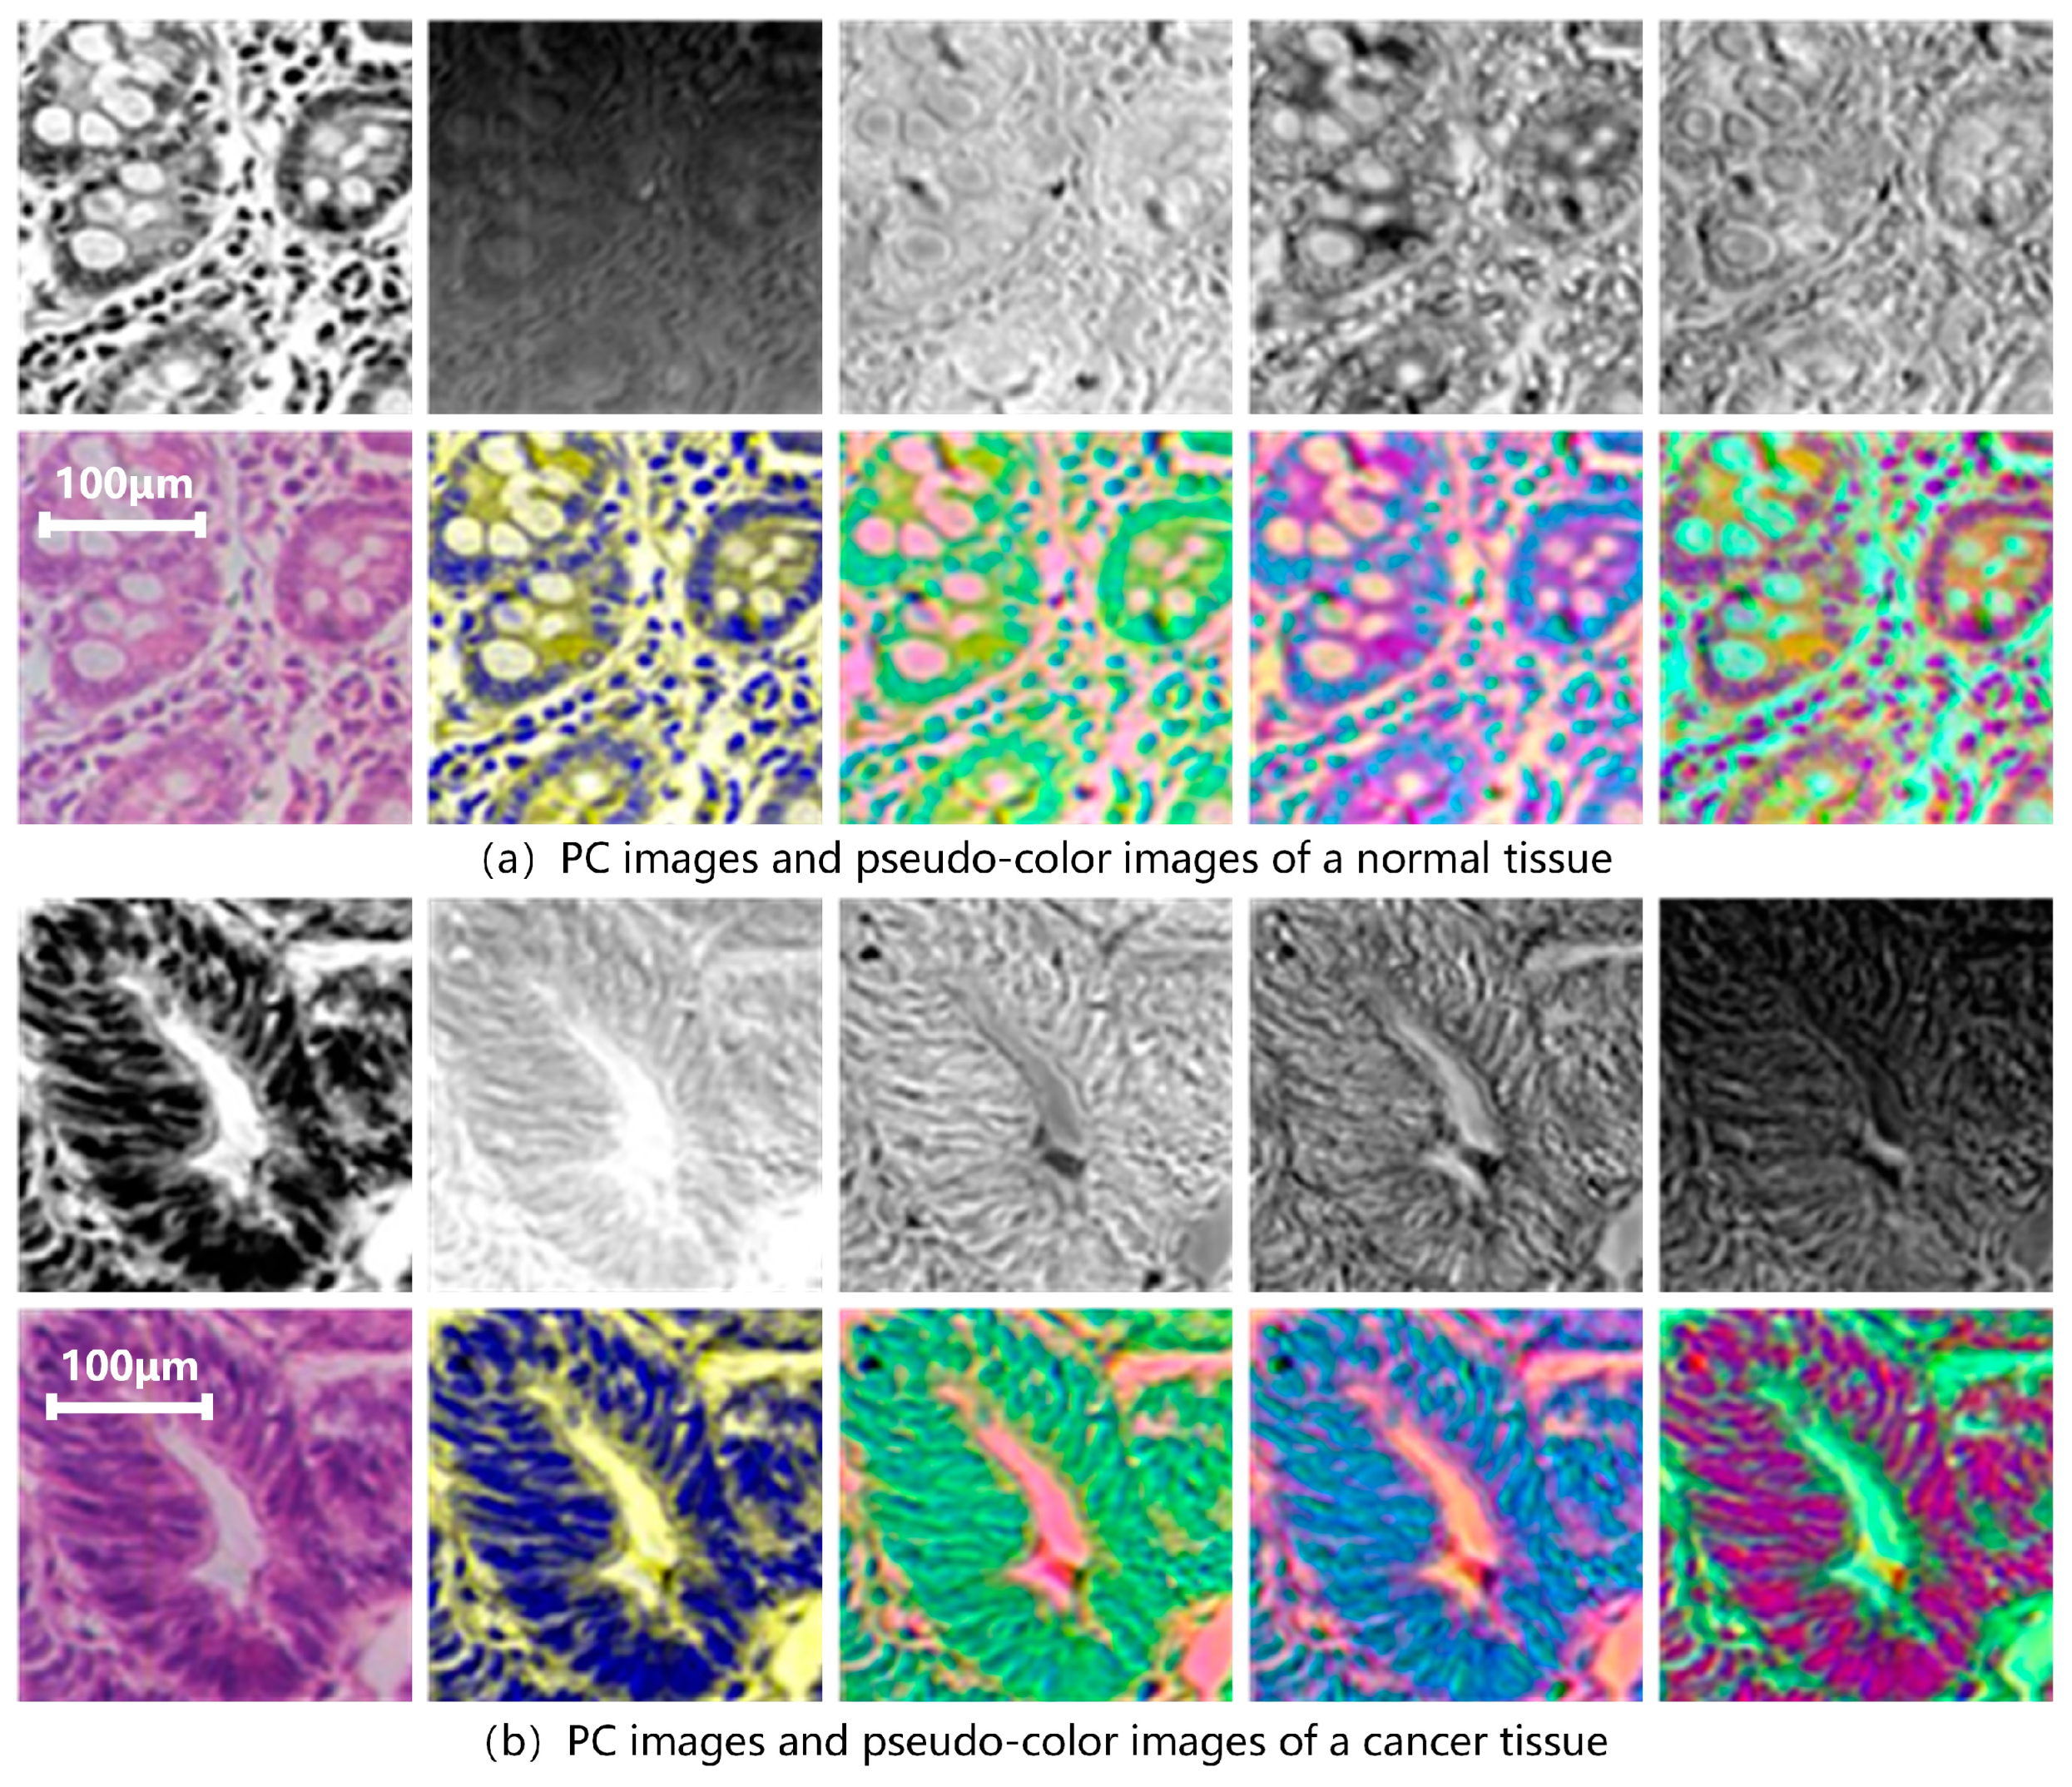
2.4.2. Principal Components Analysis
- 1.
- Subtract the mean value of each feature (data need to be standardized).
- 2.
- Calculate the covariance matrix of samples and .
- 3.
- Calculate the eigenvalues and eigenvectors of the covariance matrix. If the covariance is positive, and are positively correlated. If it is negative, and are negatively correlated, and if it is 0, and are independent. If , then λ is the eigenvalue of and is the corresponding eigenvector.
- 4.
- Sort the eigenvalues in descending order, select the top eigenvectors, and transform the original data into a new space constructed by eigenvectors.
2.4.3. Data Promotion
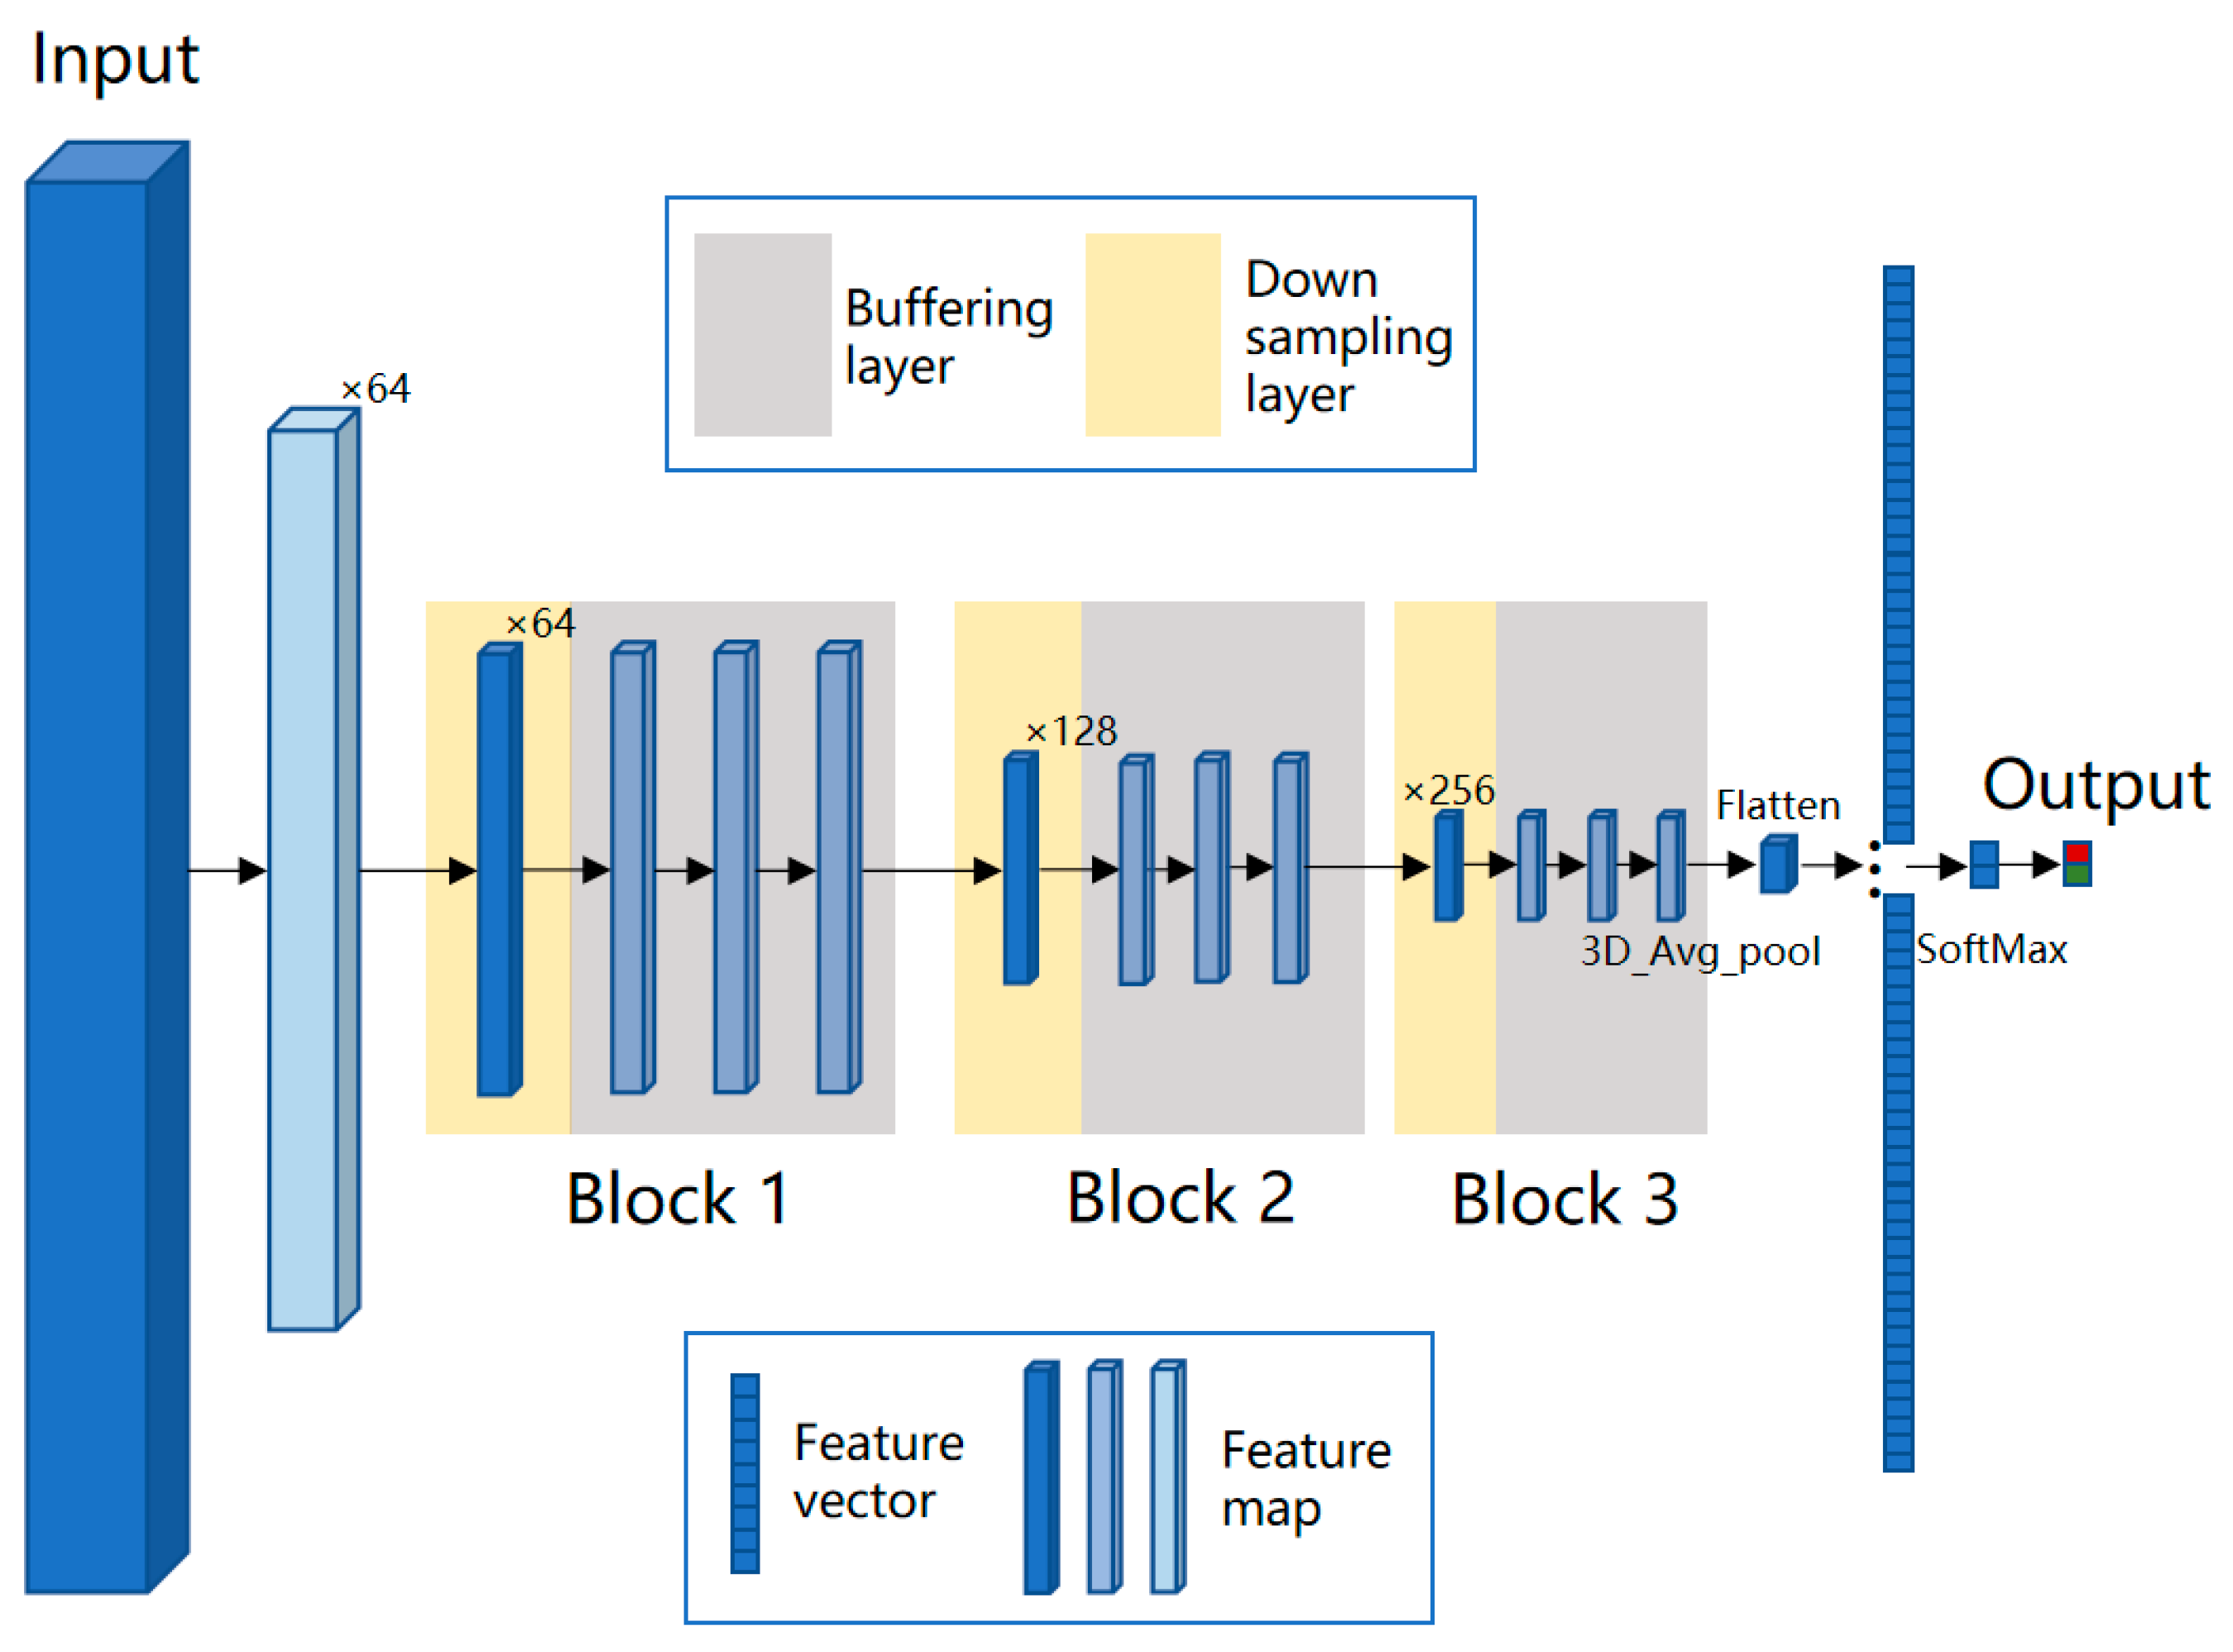
2.5. BufferNet Model
2.6. VGG-16 Model
3. Results
3.1. Classification Results of Typical Spectral Features
3.2. Results of Spectral-Spatial Transfer Features
3.2.1. Transfer of Conventional Pathology
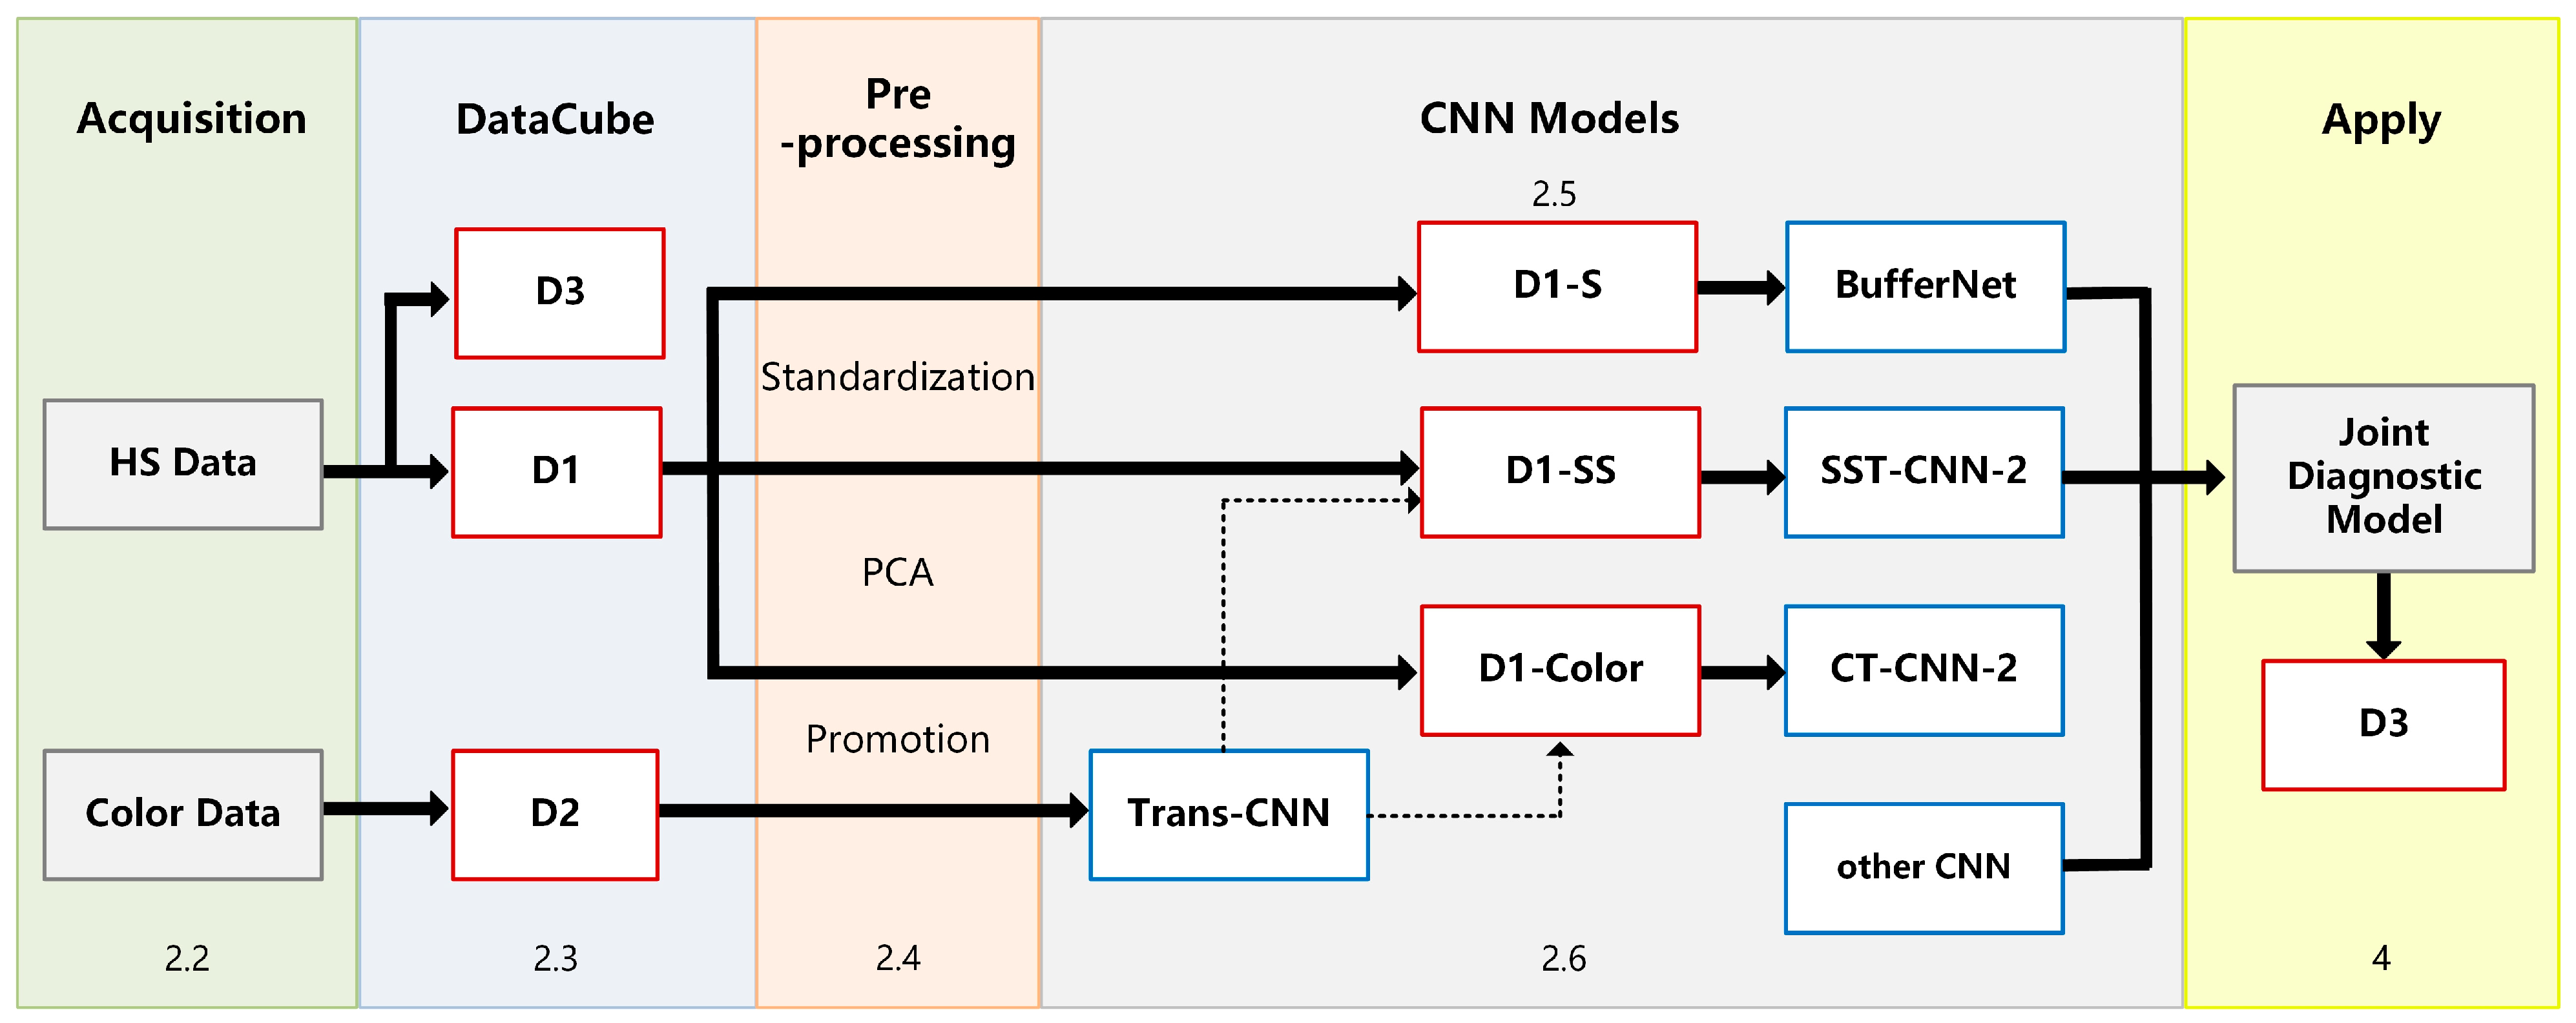
- Build the VGG-16 model and load its weights. Use the training and testing data of D2 as input to run the VGG-16 model. Then build a fully connected network to train the classification model Trans-CNN.
- Based on the Trans-CNN model, use the weights of each layer as initialized parameters, and use the hyperspectral gastric cancer dataset D1-C as the model input to extract spatial transfer features. Train a completely new classification model, CT-CNN-1, with a low learning rate. Figure 7a shows the training curve of CT-CNN-1, and the accuracy reaches 91.53% after 50 iterations.
- Fine-tuning is performed on the basis of CT-CNN-1 to further improve the model’s performance. Freeze all convolutional layers (Blocks 1–4, shown in Figure 5) before the last convolutional block, and only train the remaining layers (Block 5 and FC) to obtain the classification model CT-CNN-2. The SGD optimization method is used for training, with a learning rate of 0.0008, batch size of 50, and epoch of 17. The training curve is shown in Figure 7b.
3.2.2. Transfer of Spectral-Spatial Data
3.3. Results of Joint Classification Diagnosis
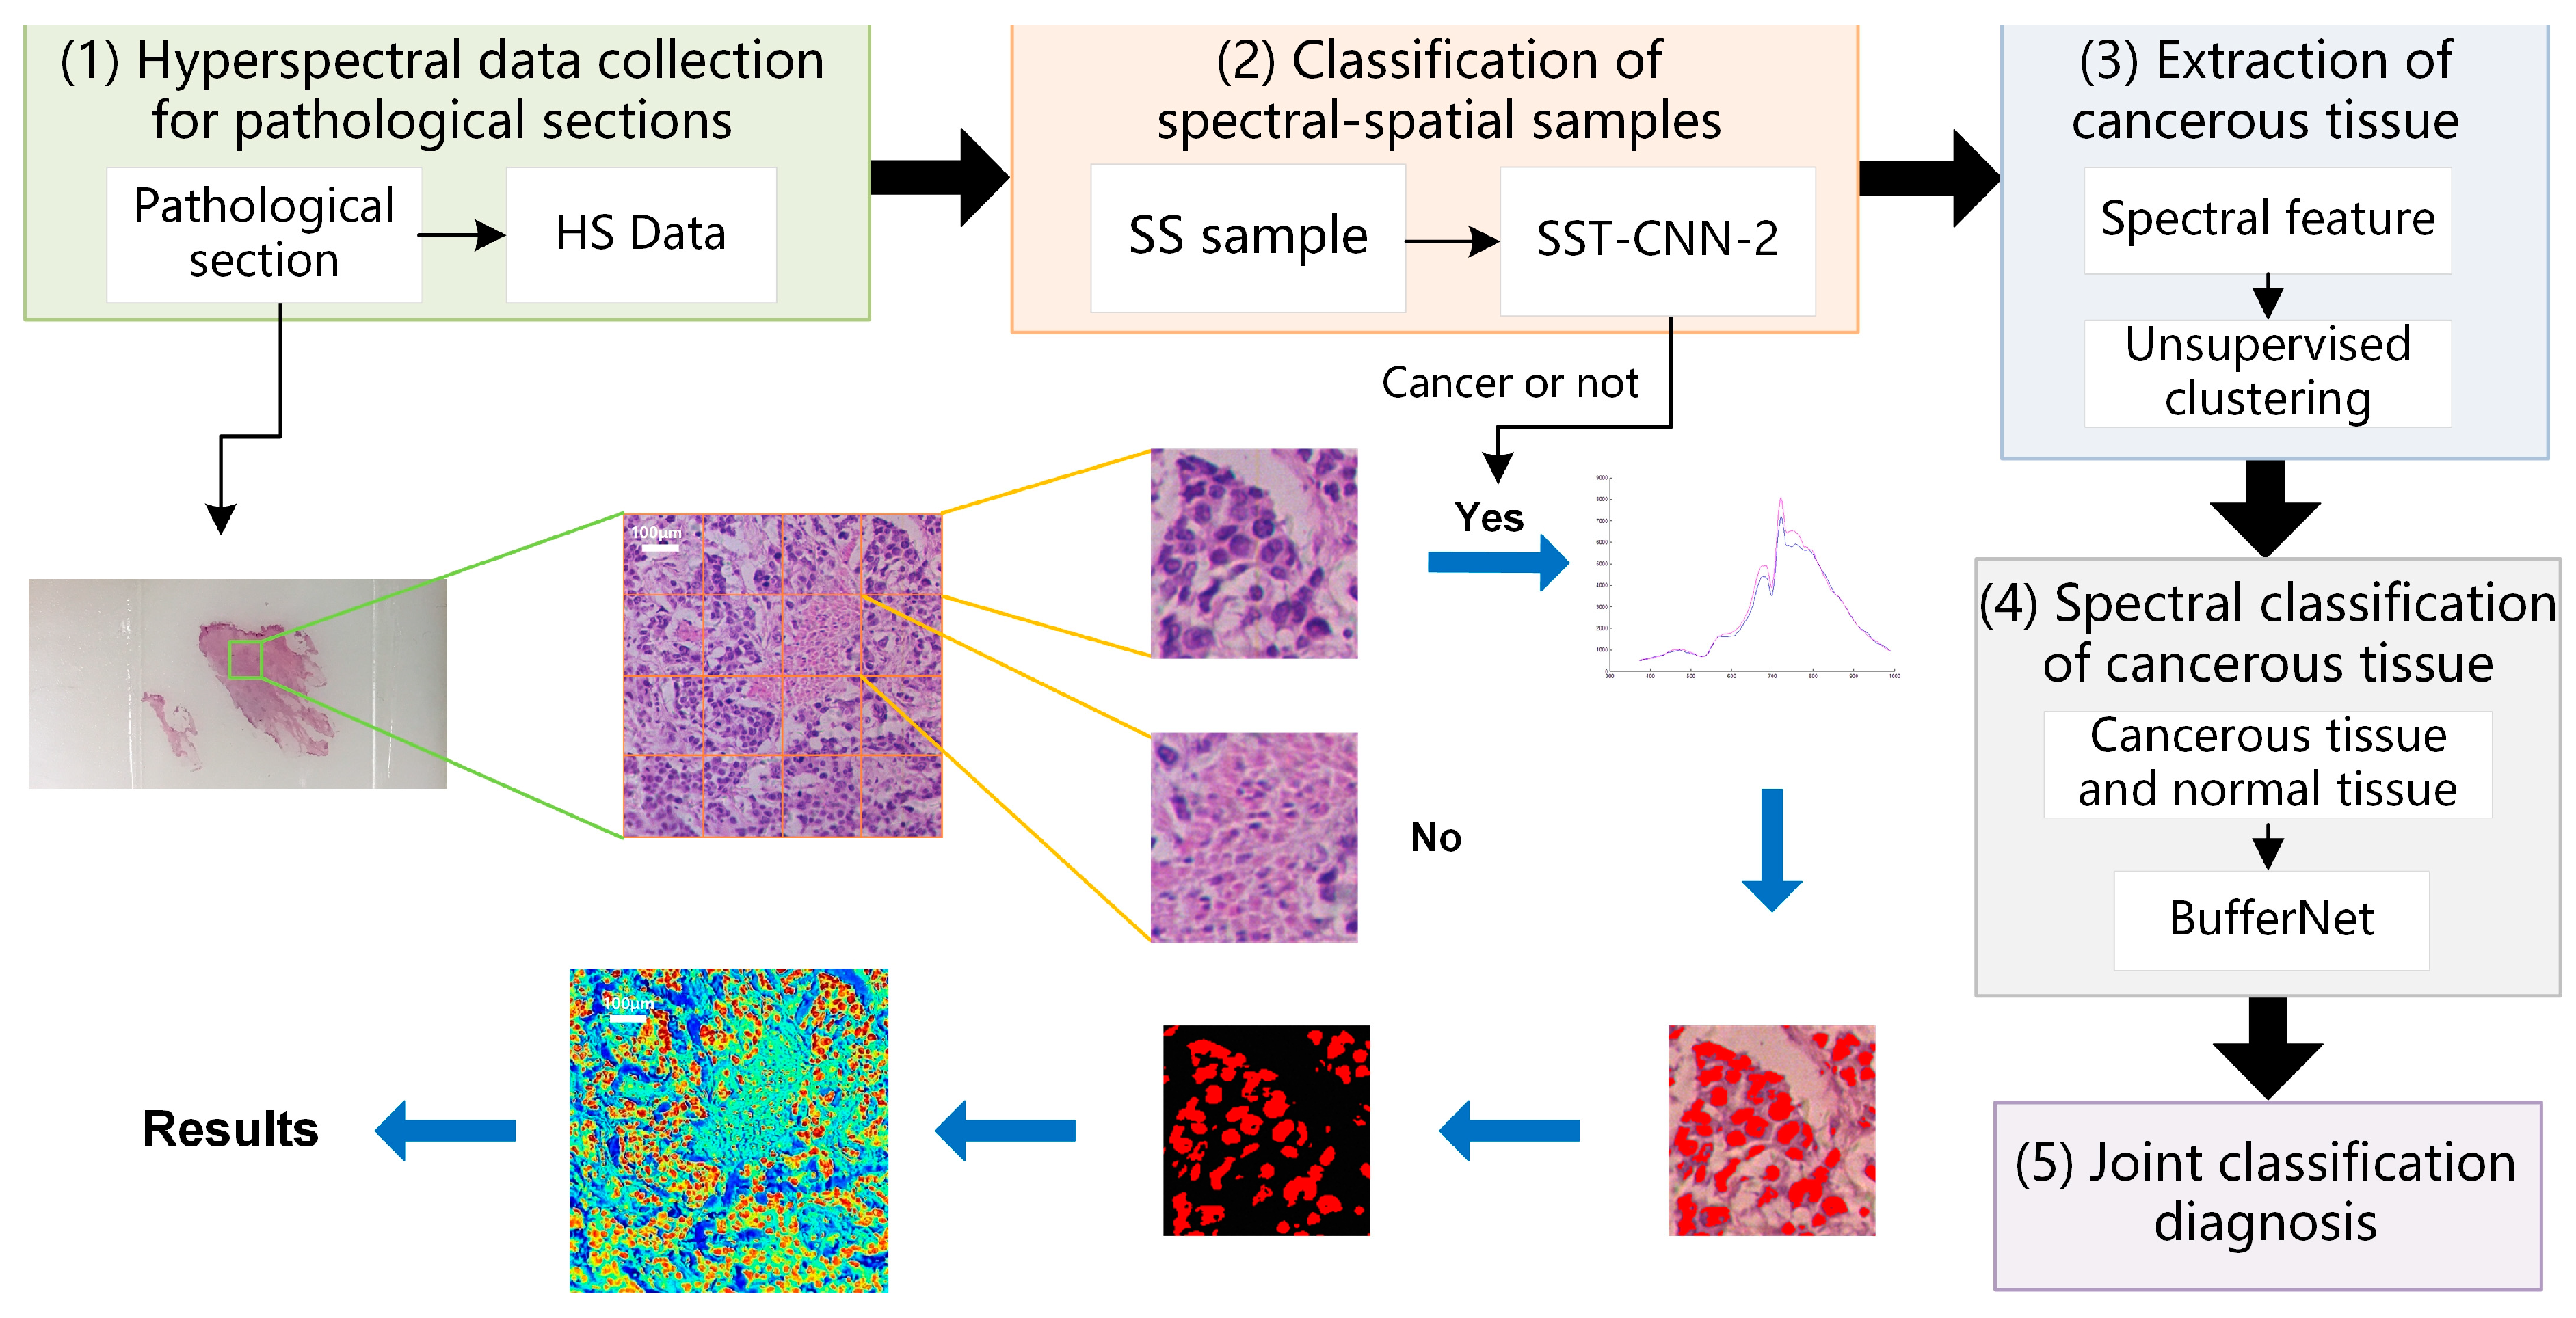
- Hyperspectral data acquisition of pathological sections: Following the method described in Section 2.2, hyperspectral images of 20× sections are acquired. According to the imaging size of equipment and sample radius, in order to cover all sample tissues on the section, an average of 6–8 images per section need to be collected.
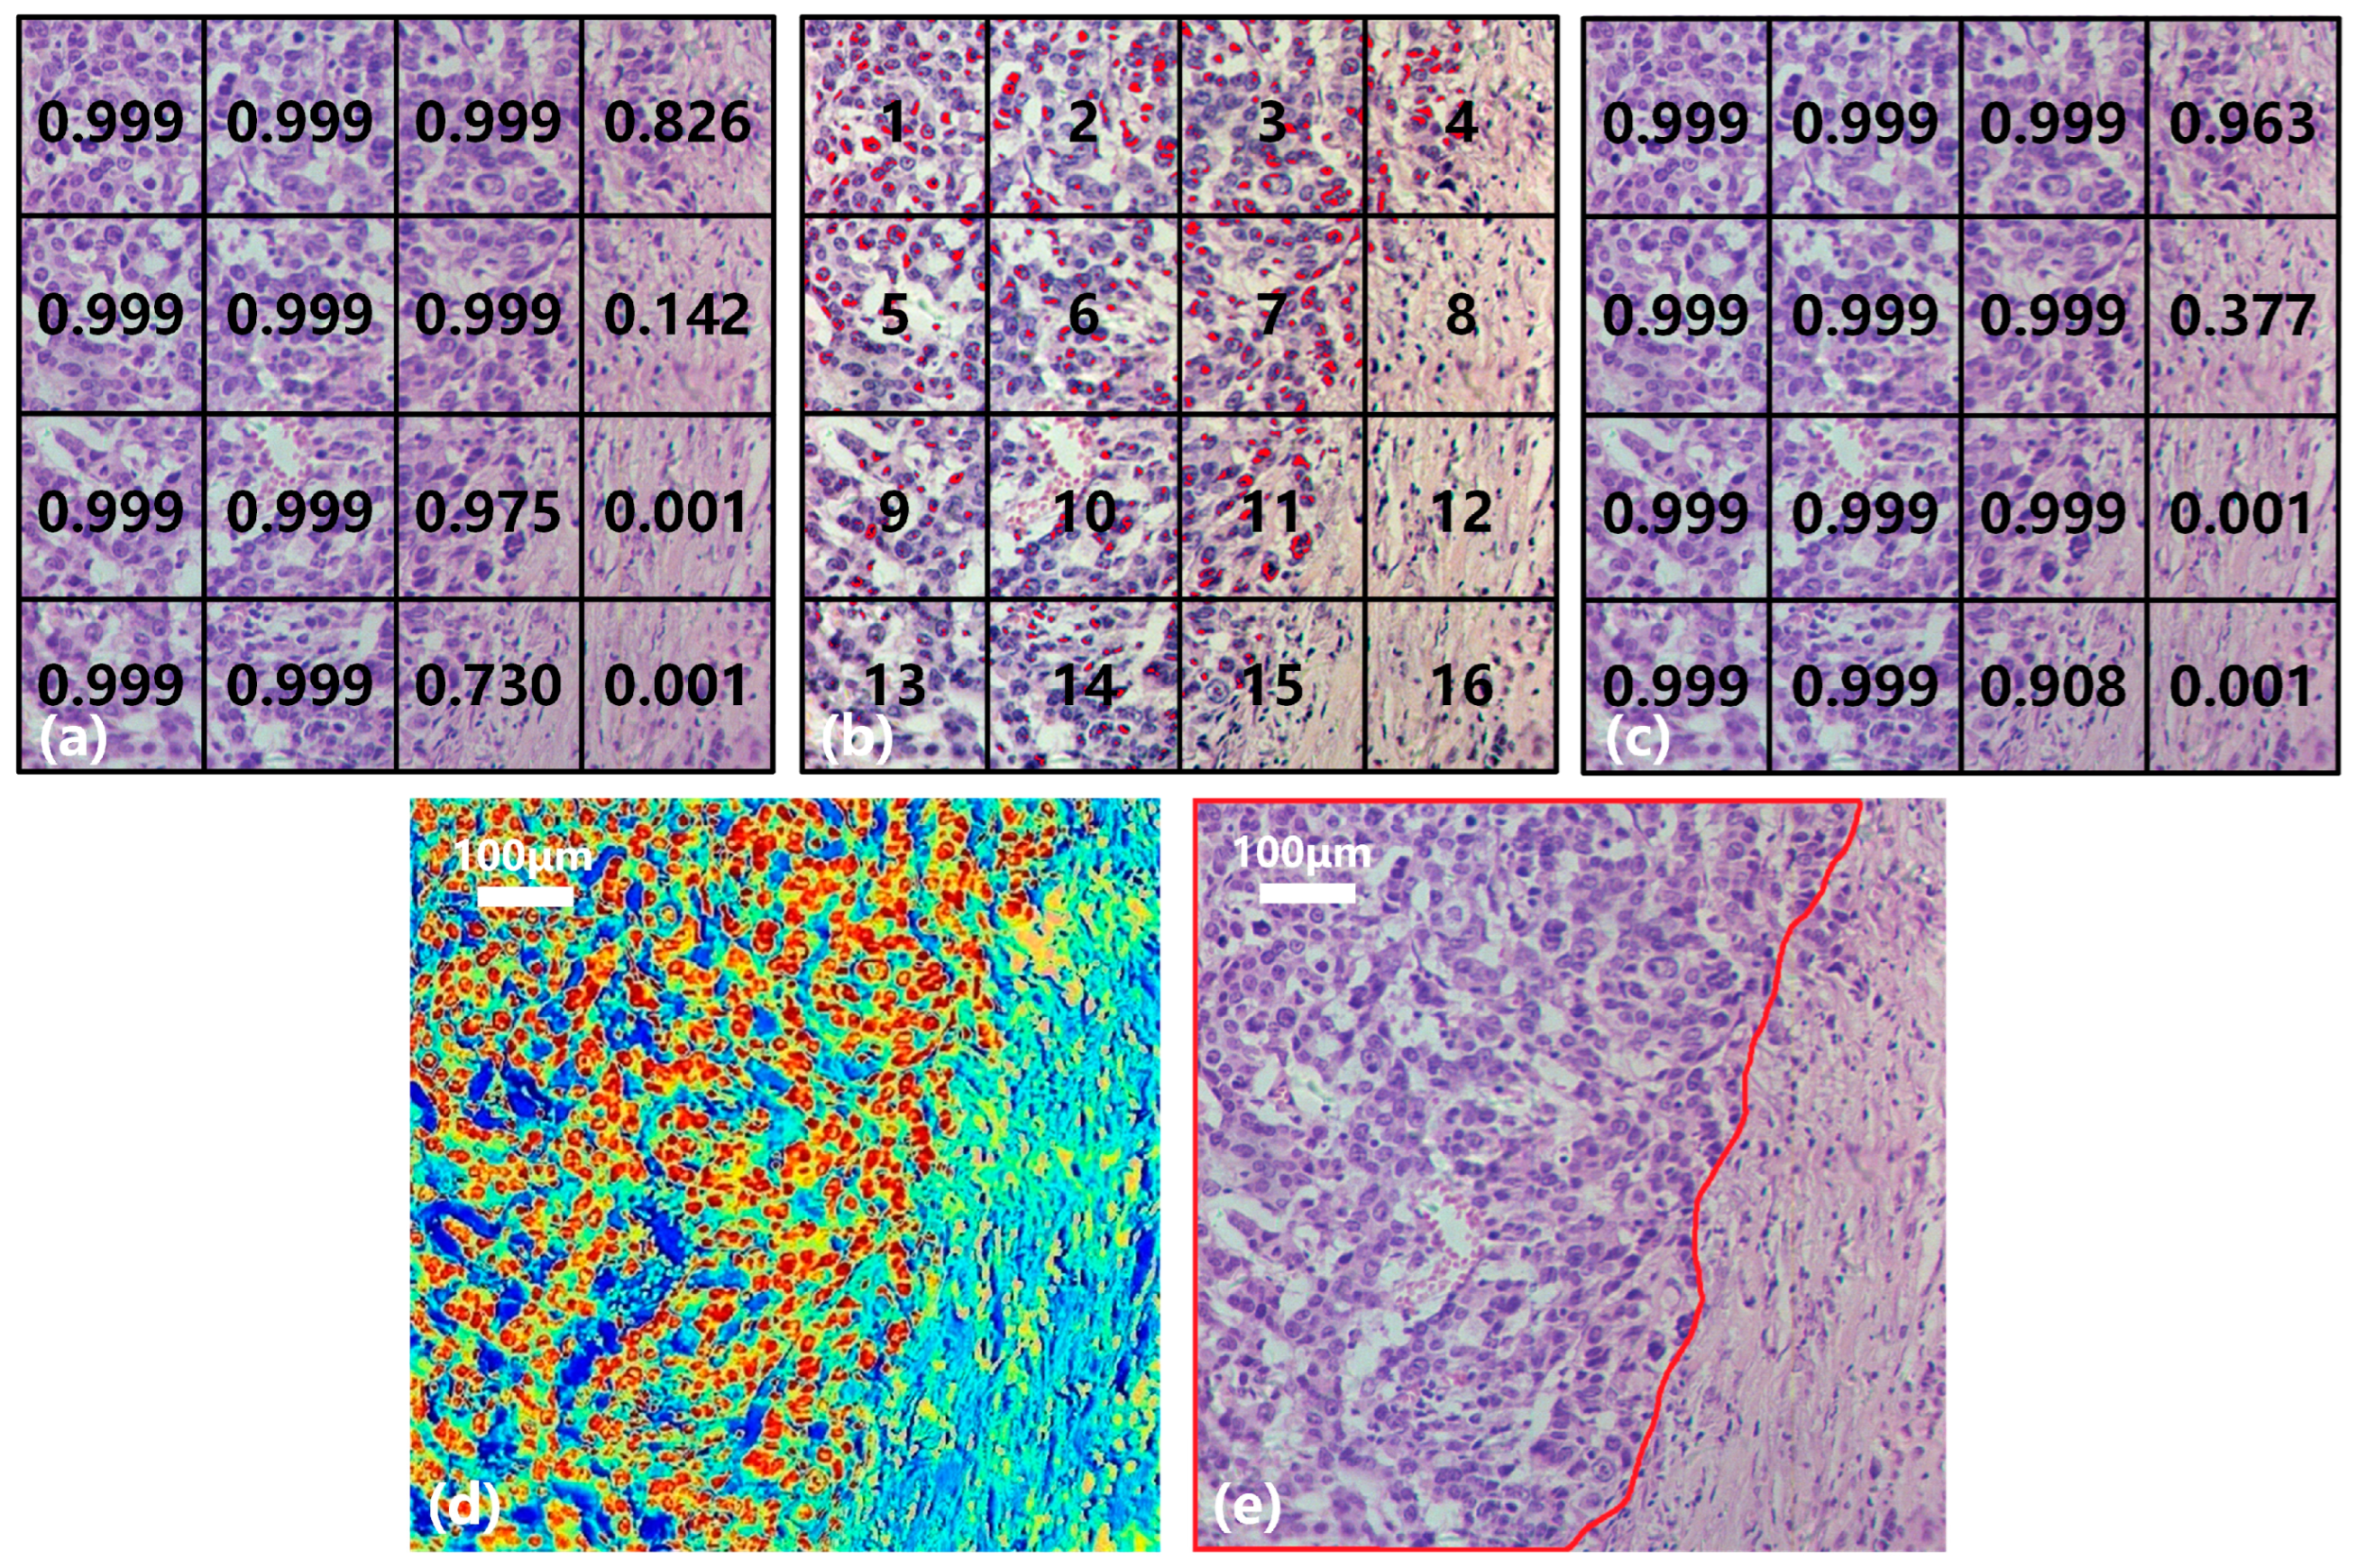
- Classification of spectral-spatial samples: The size of each original hyperspectral image is 256 × 1000 × 1000. The SS samples are extracted and preprocessed following the method in Section 2.3 and Section 2.4. Each hyperspectral image can generate 16 small SS samples, which are then classified based on the spectral-spatial information separately. The trained model SST-CNN-2 is applied. The numbers for the small samples diagnosed as normal tissue are recorded. For the samples diagnosed as cancerous tissue, further processing is carried out.
- Spectral information extraction of cancerous tissue: For samples diagnosed as cancerous tissue by SST-CNN-2, spectral angle matching and unsupervised clustering methods are used to remove red blood cells, lymphocytes, cytoplasm, and interstitium from the sample data, leaving only gastric cells and cancer cells as classification samples for the next step.
- Spectral classification of cancerous tissue: The trained model BufferNet is applied to classify cancerous tissue and normal tissue.
- According to the spectral classification results from Step 4 and the spectral-spatial classification results from Step 2, the joint classification probabilities of each small sample belonging to the cancerous sample are assigned to determine the final category of the original hyperspectral data.
4. Discussion
5. Conclusions
Author Contributions
Funding
Institutional Review Board Statement
Informed Consent Statement
Data Availability Statement
Conflicts of Interest
References
- Rakha, E.A.; Tse, G.M.; Quinn, C.M. An update on the pathological classification of breast cancer. Histopathology 2023, 82, 5–16. [Google Scholar] [CrossRef] [PubMed]
- AlZubaidi, A.K.; Sideseq, F.B.; Faeq, A.; Basil, M. Computer aided diagnosis in digital pathology application: Review and perspective approach in lung cancer classification. In Proceedings of the 2017 Annual Conference on New Trends in Information & Communications Technology Applications (NTICT), Baghdad, Iraq, 7–9 March 2017; pp. 219–224. [Google Scholar]
- Nguyen, D.T.; Lee, M.B.; Pham, T.D.; Batchuluun, G.; Arsalan, M.; Park, K.R. Enhanced image-based endoscopic pathological site classification using an ensemble of deep learning models. Sensors 2020, 20, 5982. [Google Scholar] [CrossRef]
- Dong, Y.; Wan, J.; Wang, X.; Xue, J.-H.; Zou, J.; He, H.; Li, P.; Hou, A.; Ma, H. A polarization-imaging-based machine learning framework for quantitative pathological diagnosis of cervical precancerous lesions. IEEE Trans. Med. Imaging 2021, 40, 3728–3738. [Google Scholar] [CrossRef] [PubMed]
- Ito, Y.; Miyoshi, A.; Ueda, Y.; Tanaka, Y.; Nakae, R.; Morimoto, A.; Shiomi, M.; Enomoto, T.; Sekine, M.; Sasagawa, T. An artificial intelligence-assisted diagnostic system improves the accuracy of image diagnosis of uterine cervical lesions. Mol. Clin. Oncol. 2022, 16, 27. [Google Scholar] [CrossRef]
- Bengtsson, E.; Danielsen, H.; Treanor, D.; Gurcan, M.N.; MacAulay, C.; Molnár, B. Computer-aided diagnostics in digital pathology. Cytometry 2017, 91, 551–554. [Google Scholar] [CrossRef] [PubMed]
- Bobroff, V.; Chen, H.H.; Delugin, M.; Javerzat, S.; Petibois, C. Quantitative IR microscopy and spectromics open the way to 3D digital pathology. J. Biophotonics 2017, 10, 598–606. [Google Scholar] [CrossRef]
- Somanchi, S.; Neill, D.B.; Parwani, A.V. Discovering anomalous patterns in large digital pathology images. Stat. Med. 2018, 37, 3599–3615. [Google Scholar] [CrossRef] [PubMed]
- Pan, X.; Lu, Y.; Lan, R.; Liu, Z.; Qin, Z.; Wang, H.; Liu, Z. Mitosis detection techniques in H&E stained breast cancer pathological images: A comprehensive review. Comput. Electr. Eng. 2021, 91, 107038. [Google Scholar]
- Banghuan, H.; Minli, Y.; Rong, W. Spatial-spectral semi-supervised local discriminant analysis for hyperspectral Image Classification. Acta Opt. Sin. 2017, 37, 0728002. [Google Scholar] [CrossRef]
- Dong, A.; Li, J.; Zhang, B.; Liang, M. Hyperspectral image classification algorithm based on spectral clustering and sparse representation. Acta Opt. Sin. 2017, 37, 0828005. [Google Scholar] [CrossRef]
- Zheng, D.; Lu, L.; Li, Y.; Kelly, K.F.; Baldelli, S. Compressive broad-band hyperspectral sum frequency generation microscopy to study functionalized surfaces. J. Phys. Chem. Lett. 2016, 7, 1781–1787. [Google Scholar] [CrossRef] [PubMed]
- Liu, S.; Wang, Q.; Zhang, G.; Du, J.; Hu, B.; Zhang, Z. Using hyperspectral imaging automatic classification of gastric cancer grading with a shallow residual network. Anal. Methods 2020, 12, 3844–3853. [Google Scholar] [CrossRef] [PubMed]
- Gowen, A.A.; Feng, Y.; Gaston, E.; Valdramidis, V. Recent applications of hyperspectral imaging in microbiology. Talanta 2015, 137, 43–54. [Google Scholar] [CrossRef] [PubMed]
- Du, J.; Hu, B.; Zhang, Z. Gastric carcinoma classification based on convolutional neural network and micro-hyperspectral imaging. Acta Opt. Sin. 2018, 38, 0617001. [Google Scholar]
- Cho, H.; Kim, M.S.; Kim, S.; Lee, H.; Oh, M.; Chung, S.H. Hyperspectral determination of fluorescence wavebands for multispectral imaging detection of multiple animal fecal species contaminations on romaine lettuce. Food Bioprocess Technol. 2018, 11, 774–784. [Google Scholar] [CrossRef]
- Li, Q.; Chang, L.; Liu, H.; Zhou, M.; Wang, Y.; Guo, F. Skin cells segmentation algorithm based on spectral angle and distance score. Opt. Laser Technol. 2015, 74, 79–86. [Google Scholar] [CrossRef]
- Akbari, H.; Halig, L.V.; Zhang, H.; Wang, D.; Chen, Z.G.; Fei, B. Detection of cancer metastasis using a novel macroscopic hyperspectral method. In Proceedings of the Medical Imaging 2012: Biomedical Applications in Molecular, Structural, and Functional Imaging, San Diego, CA, USA, 5–7 February 2012; pp. 299–305. [Google Scholar]
- Jong, L.-J.S.; de Kruif, N.; Geldof, F.; Veluponnar, D.; Sanders, J.; Peeters, M.-J.T.V.; van Duijnhoven, F.; Sterenborg, H.J.; Dashtbozorg, B.; Ruers, T.J. Discriminating healthy from tumor tissue in breast lumpectomy specimens using deep learning-based hyperspectral imaging. Biomed. Opt. Express 2022, 13, 2581–2604. [Google Scholar] [CrossRef]
- Hu, B.; Du, J.; Zhang, Z.; Wang, Q. Tumor tissue classification based on micro-hyperspectral technology and deep learning. Biomed. Opt. Express 2019, 10, 6370–6389. [Google Scholar] [CrossRef]
- Halicek, M.; Little, J.V.; Wang, X.; Patel, M.; Griffith, C.C.; Chen, A.Y.; Fei, B. Tumor margin classification of head and neck cancer using hyperspectral imaging and convolutional neural networks. In Proceedings of the Medical Imaging 2018: Image-Guided Procedures, Robotic Interventions, and Modeling, Houston, TX, USA, 10–15 February 2018; pp. 17–27. [Google Scholar]
- Wang, J.; Li, Q. Quantitative analysis of liver tumors at different stages using microscopic hyperspectral imaging technology. J. Biomed. Opt. 2018, 23, 106002. [Google Scholar] [CrossRef]
- Akimoto, K.; Ike, R.; Maeda, K.; Hosokawa, N.; Takamatsu, T.; Soga, K.; Yokota, H.; Sato, D.; Kuwata, T.; Ikematsu, H. Wavelength Bands Reduction Method in Near-Infrared Hyperspectral Image based on Deep Neural Network for Tumor Lesion Classification. Adv. Image Video Process. 2021, 9, 273–281. [Google Scholar] [CrossRef]
- Yang, J.; Zhang, D.; Frangi, A.F.; Yang, J.-y. Two-dimensional PCA: A new approach to appearance-based face representation and recognition. IEEE Trans. Pattern Anal. Mach. Intell. 2004, 26, 131–137. [Google Scholar] [CrossRef] [PubMed]
- Xue, F.; Tan, F.; Ye, Z.; Chen, J.; Wei, Y. Spectral-spatial classification of hyperspectral image using improved functional principal component analysis. IEEE Geosci. Remote Sens. Lett. 2021, 19, 5507105. [Google Scholar] [CrossRef]
- Krizhevsky, A.; Sutskever, I.; Hinton, G.E. Imagenet classification with deep convolutional neural networks. Commun. ACM 2017, 60, 84–90. [Google Scholar] [CrossRef]
- Tian, S.; Wang, S.; Xu, H. Early detection of freezing damage in oranges by online Vis/NIR transmission coupled with diameter correction method and deep 1D-CNN. Comput. Electron. Agric. 2022, 193, 106638. [Google Scholar] [CrossRef]
- Hsieh, T.-H.; Kiang, J.-F. Comparison of CNN algorithms on hyperspectral image classification in agricultural lands. Sensors 2020, 20, 1734. [Google Scholar] [CrossRef] [PubMed]
- Ji, S.; Xu, W.; Yang, M.; Yu, K. 3D convolutional neural networks for human action recognition. IEEE Trans. Pattern Anal. Mach. Intell. 2012, 35, 221–231. [Google Scholar] [CrossRef]
- Tamaazousti, Y.; Le Borgne, H.; Hudelot, C.; Tamaazousti, M. Learning more universal representations for transfer-learning. IEEE Trans. Pattern Anal. Mach. Intell. 2019, 42, 2212–2224. [Google Scholar] [CrossRef]
- Dar, S.U.H.; Özbey, M.; Çatlı, A.B.; Çukur, T. A transfer-learning approach for accelerated MRI using deep neural networks. Magn. Reson. Med. 2020, 84, 663–685. [Google Scholar] [CrossRef]
- Mishra, P.; Passos, D. Realizing transfer learning for updating deep learning models of spectral data to be used in new scenarios. Chemom. Intell. Lab. Syst. 2021, 212, 104283. [Google Scholar] [CrossRef]
- Martínez, E.; Castro, S.; Bacca, J.; Arguello, H. Transfer Learning for Spectral Image Reconstruction from RGB Images. In Proceedings of the Applications of Computational Intelligence: Third IEEE Colombian Conference, ColCACI 2020, Cali, Colombia, 7–8 August 2020; Revised Selected Papers 3, 2021. pp. 160–173. [Google Scholar]
- Simonyan, K.; Zisserman, A. Very deep convolutional networks for large-scale image recognition. arXiv 2014, arXiv:1409.1556. [Google Scholar]
- Sermanet, P.; Eigen, D.; Zhang, X.; Mathieu, M.; Fergus, R.; LeCun, Y. Overfeat: Integrated recognition, localization and detection using convolutional networks. arXiv 2013, arXiv:1312.6229. [Google Scholar]
- Kermany, D.S.; Goldbaum, M.; Cai, W.; Valentim, C.C.; Liang, H.; Baxter, S.L.; McKeown, A.; Yang, G.; Wu, X.; Yan, F. Identifying medical diagnoses and treatable diseases by image-based deep learning. Cell 2018, 172, 1122–1131.e9. [Google Scholar] [CrossRef] [PubMed]
- He, K.; Zhang, X.; Ren, S.; Sun, J. Deep residual learning for image recognition. In Proceedings of the IEEE Conference on Computer Vision and Pattern Recognition, Las Vegas, NV, USA, 27–30 June 2016; pp. 770–778. [Google Scholar]
- Sun, L.; Zhou, M.Q.; Hu, M.; Wen, Y.; Zhang, J.; Chu, J. Diagnosis of cholangiocarcinoma from microscopic hyperspectral pathological dataset by deep convolution neural networks. Methods 2022, 202, 22–30. [Google Scholar] [CrossRef] [PubMed]
- Liu, L.; Qi, M.; Li, Y.; Liu, Y.; Liu, X.; Zhang, Z.; Qu, J. Staging of skin cancer based on hyperspectral microscopic imaging and machine learning. Biosensors 2022, 12, 790. [Google Scholar] [CrossRef] [PubMed]
- Martinez-Vega, B.; Tkachenko, M.; Matkabi, M.; Ortega, S.; Fabelo, H.; Balea-Fernandez, F.; La Salvia, M.; Torti, E.; Leporati, F.; Callico, G.M.; et al. Evaluation of preprocessing methods on independent medical hyperspectral databases to improve analysis. Sensors 2022, 22, 8917. [Google Scholar] [CrossRef]
- Schröder, A.; Maktabi, M.; Thieme, R.; Jansen–Winkeln, B.; Gockel, I.; Chalopin, C. Evaluation of artificial neural networks for the detection of esophagus tumor cells in microscopic hyperspectral images. In Proceedings of the 2022 25th Euromicro Conference on Digital System Design (DSD), Canaria, Spain, 31 August–2 September 2022; pp. 827–834. [Google Scholar]
- Zhang, Y.; Wang, Y.; Zhang, B.; Li, Q. A hyperspectral dataset of precancerous lesions in gastric cancer and benchmarks for pathological diagnosis. J. Biophotonics 2022, 15, e202200163. [Google Scholar] [CrossRef]
- Fan, T.; Long, Y.; Zhang, X.; Peng, Z.; Li, Q. Identification of skin melanoma based on microscopic hyperspectral imaging technology. In Proceedings of the 12th International Conference on Signal Processing Systems, Zagreb, Croatia, 13–15 September 2021; pp. 56–64. [Google Scholar]






| Dataset | Type | Image/SS Sample | Spectral Sample | ||
|---|---|---|---|---|---|
| Cancer | Normal | Cancer | Normal | ||
| D1 | Hyper Gastric | 1270 | 2839 | 11,365 | 14,928 |
| D2 | Mixed Pathology | 9024 | 22,754 | - | - |
| D3 | Hyper Thyroid | 1884 | 3186 | 8562 | 7763 |
| Model | Total Parameters /Million | Training Time/s | Testing Time/s | Accuracy |
|---|---|---|---|---|
| SS-CNN-3 | 0.198 | 1197.16 s | 1.94 s | 95.20% |
| 3D-ResNet | 33.15 | 170,973.52 s | 232.80 s | 95.83% |
| BufferNet | 8.19 | 48,594.21 s | 57.59 s | 96.17% |
| Input | PCA123 | PCA134 | PCA145 | PCA514 | PC1 | PC2 | PC3 | PC4 | PC5 |
|---|---|---|---|---|---|---|---|---|---|
| Accuracy/% | 80.78 | 95.46 | 94.23 | 94.39 | 93.13 | 73.97 | 83.17 | 81.46 | 81.10 |
Disclaimer/Publisher’s Note: The statements, opinions and data contained in all publications are solely those of the individual author(s) and contributor(s) and not of MDPI and/or the editor(s). MDPI and/or the editor(s) disclaim responsibility for any injury to people or property resulting from any ideas, methods, instructions or products referred to in the content. |
© 2023 by the authors. Licensee MDPI, Basel, Switzerland. This article is an open access article distributed under the terms and conditions of the Creative Commons Attribution (CC BY) license (https://creativecommons.org/licenses/by/4.0/).
Share and Cite
Du, J.; Tao, C.; Xue, S.; Zhang, Z. Joint Diagnostic Method of Tumor Tissue Based on Hyperspectral Spectral-Spatial Transfer Features. Diagnostics 2023, 13, 2002. https://doi.org/10.3390/diagnostics13122002
Du J, Tao C, Xue S, Zhang Z. Joint Diagnostic Method of Tumor Tissue Based on Hyperspectral Spectral-Spatial Transfer Features. Diagnostics. 2023; 13(12):2002. https://doi.org/10.3390/diagnostics13122002
Chicago/Turabian StyleDu, Jian, Chenglong Tao, Shuang Xue, and Zhoufeng Zhang. 2023. "Joint Diagnostic Method of Tumor Tissue Based on Hyperspectral Spectral-Spatial Transfer Features" Diagnostics 13, no. 12: 2002. https://doi.org/10.3390/diagnostics13122002
APA StyleDu, J., Tao, C., Xue, S., & Zhang, Z. (2023). Joint Diagnostic Method of Tumor Tissue Based on Hyperspectral Spectral-Spatial Transfer Features. Diagnostics, 13(12), 2002. https://doi.org/10.3390/diagnostics13122002


