
Application of A U-Net for Map-like Segmentation and Classification of Discontinuous Fibrosis Distribution in Gd-EOB-DTPA-Enhanced Liver MRI

 , , , and
Abstract
:Highlights
- -
- First application of a U-net for the segmentation and classification of discontinuous liver fibrosis distribution.
- -
- Fully automated, scalable pipeline for data pre-processing, segmentation, and classification.
- -
- The present research could serve as a cornerstone of further applications for non-invasive determination of liver tissue properties, for instance, in planned parenchymal resection.
Abstract
1. Introduction
2. Materials and Methods
2.1. Patients
2.2. MR Imaging Protocol
2.3. Histopathological Examination
2.4. Dataset Preparation
2.5. Network Training
2.6. Statistical Analysis
3. Results
3.1. Liver Segmentation
3.2. Fibrosis Classification
4. Discussion
4.1. Liver Segmentation
4.2. Fibrosis Classification
5. Conclusions
Author Contributions
Funding
Institutional Review Board Statement
Informed Consent Statement
Data Availability Statement
Conflicts of Interest
Abbreviations
| AUC-ROC | Area Under the Receiver Operating Characteristic Curve |
| DICE | Dice Similarity Coefficient |
| Gd-EOB-DTPA | Gadolinium Ethoxybenzyl-Diethylenetriaminepentaacetic Acid |
| HBP | Hepatobiliary Phase |
| HD95 | 95% Hausdorff Distance |
| MRI | Magnetic Resonance Imaging |
| SD | Standard Deviation |
| SI | Signal Intensity |
| VIBE | Volume-Interpolated Breath-Hold Examination |
References
- Ribero, D.; Amisano, M.; Bertuzzo, F.; Langella, S.; Lo Tesoriere, R.; Ferrero, A.; Regge, D.; Capussotti, L. Measured versus estimated total liver volume to preoperatively assess the adequacy of the future liver remnant: Which method should we use? Ann. Surg. 2013, 258, 801–806. [Google Scholar] [CrossRef] [PubMed]
- Yigitler, C.; Farges, O.; Kianmanesh, R.; Regimbeau, J.-M.; Abdalla, E.K.; Belghiti, J. The small remnant liver after major liver resection: How common and how relevant? Liver Transpl. 2003, 9, S18–S25. [Google Scholar] [CrossRef] [PubMed]
- Germani, G.; Hytiroglou, P.; Fotiadu, A.; Burroughs, A.K.; Dhillon, A.P. Assessment of fibrosis and cirrhosis in liver biopsies: An update. Semin. Liver Dis. 2011, 31, 82–90. [Google Scholar] [CrossRef] [PubMed]
- Regev, A.; Berho, M.; Jeffers, L.J.; Milikowski, C.; Molina, E.G.; Pyrsopoulos, N.T.; Feng, Z.-Z.; Reddy, K.R.; Schiff, E.R. Sampling error and intraobserver variation in liver biopsy in patients with chronic HCV infection. Am. J. Gastroenterol. 2002, 97, 2614–2618. [Google Scholar] [CrossRef] [PubMed]
- Imaeda, T.; Kanematsu, M.; Asada, S.; Seki, M.; Doi, H.; Saji, S. Utility of Tc-99m GSA SPECT imaging in estimation of functional volume of liver segments in health and liver diseases. Clin. Nucl. Med. 1995, 20, 322–328. [Google Scholar] [CrossRef]
- Nilsson, H.; Karlgren, S.; Blomqvist, L.; Jonas, E. The inhomogeneous distribution of liver function: Possible impact on the prediction of postoperative remnant liver function. HPB (Oxf.) 2015, 17, 272–277. [Google Scholar] [CrossRef] [Green Version]
- Bluemke, D.A.; Sahani, D.; Amendola, M.; Balzer, T.; Breuer, J.; Brown, J.J.; Casalino, D.D.; Davis, P.L.; Francis, I.R.; Krinsky, G.; et al. Efficacy and safety of MR imaging with liver-specific contrast agent: U.S. multicenter phase III study. Radiology 2005, 237, 89–98. [Google Scholar] [CrossRef]
- Kobayashi, S.; Matsui, O.; Gabata, T.; Koda, W.; Minami, T.; Ryu, Y.; Kozaka, K.; Kitao, A. Relationship between signal intensity on hepatobiliary phase of gadolinium ethoxybenzyl diethylenetriaminepentaacetic acid (Gd-EOB-DTPA)-enhanced MR imaging and prognosis of borderline lesions of hepatocellular carcinoma. Eur. J. Radiol. 2012, 81, 3002–3009. [Google Scholar] [CrossRef]
- Weinmann, H.J.; Schuhmann-Giampieri, G.; Schmitt-Willich, H.; Vogler, H.; Frenzel, T.; Gries, H. A new lipophilic gadolinium chelate as a tissue-specific contrast medium for MRI. Magn. Reson. Med. 1991, 22, 233–237. [Google Scholar] [CrossRef]
- van Beers, B.E.; Pastor, C.M.; Hussain, H.K. Primovist, Eovist: What to expect? J. Hepatol. 2012, 57, 421–429. [Google Scholar] [CrossRef]
- Tamada, T.; Ito, K.; Sone, T.; Yamamoto, A.; Yoshida, K.; Kakuba, K.; Tanimoto, D.; Higashi, H.; Yamashita, T. Dynamic contrast-enhanced magnetic resonance imaging of abdominal solid organ and major vessel: Comparison of enhancement effect between Gd-EOB-DTPA and Gd-DTPA. J. Magn. Reson. Imaging 2009, 29, 636–640. [Google Scholar] [CrossRef] [PubMed]
- Reimer, P.; Rummeny, E.J.; Daldrup, H.E.; Hesse, T.; Balzer, T.; Tombach, B.; Peters, P.E. Enhancement characteristics of liver metastases, hepatocellular carcinomas, and hemangiomas with Gd-EOB-DTPA: Preliminary results with dynamic MR imaging. Eur. Radiol. 1997, 7, 275–280. [Google Scholar] [CrossRef] [PubMed]
- Tamada, T.; Ito, K.; Higaki, A.; Yoshida, K.; Kanki, A.; Sato, T.; Higashi, H.; Sone, T. Gd-EOB-DTPA-enhanced MR imaging: Evaluation of hepatic enhancement effects in normal and cirrhotic livers. Eur. J. Radiol. 2011, 80, e311–e316. [Google Scholar] [CrossRef] [PubMed]
- Tajima, T.; Takao, H.; Akai, H.; Kiryu, S.; Imamura, H.; Watanabe, Y.; Shibahara, J.; Kokudo, N.; Akahane, M.; Ohtomo, K. Relationship between liver function and liver signal intensity in hepatobiliary phase of gadolinium ethoxybenzyl diethylenetriamine pentaacetic acid-enhanced magnetic resonance imaging. J. Comput. Assist. Tomogr. 2010, 34, 362–366. [Google Scholar] [CrossRef] [PubMed]
- Fuhrmann, I.; Brünn, K.; Probst, U.; Verloh, N.; Stroszczynski, C.; Jung, E.M.; Wiggermann, P.; Haimerl, M. Proof of principle: Estimation of liver function using color coded Doppler sonography of the portal vein. Clin. Hemorheol. Microcirc. 2018, 70, 585–594. [Google Scholar] [CrossRef] [PubMed]
- Hagiwara, M.; Rusinek, H.; Lee, V.S.; Losada, M.; Bannan, M.A.; Krinsky, G.A.; Taouli, B. Advanced liver fibrosis: Diagnosis with 3D whole-liver perfusion MR imaging—Initial experience. Radiology 2008, 246, 926–934. [Google Scholar] [CrossRef]
- Heimann, T.; van Ginneken, B.; Styner, M.A.; Arzhaeva, Y.; Aurich, V.; Bauer, C.; Beck, A.; Becker, C.; Beichel, R.; Bekes, G.; et al. Comparison and evaluation of methods for liver segmentation from CT datasets. IEEE Trans. Med. Imaging 2009, 28, 1251–1265. [Google Scholar] [CrossRef]
- Yogananda, C.G.B.; Shah, B.R.; Nalawade, S.S.; Murugesan, G.K.; Yu, F.F.; Pinho, M.C.; Wagner, B.C.; Mickey, B.; Patel, T.R.; Fei, B.; et al. MRI-Based Deep-Learning Method for Determining Glioma MGMT Promoter Methylation Status. AJNR Am. J. Neuroradiol. 2021, 42, 845–852. [Google Scholar] [CrossRef]
- Mongan, J.; Moy, L.; Kahn, C.E. Checklist for Artificial Intelligence in Medical Imaging (CLAIM): A Guide for Authors and Reviewers. Radiol. Artif. Intell. 2020, 2, e200029. [Google Scholar] [CrossRef] [Green Version]
- Verloh, N.; Fuhrmann, I.; Fellner, C.; Nickel, D.; Zeman, F.; Kandulski, A.; Hornung, M.; Stroszczynski, C.; Wiggermann, P.; Haimerl, M. Quantitative analysis of liver function: 3D variable-flip-angle versus Look-Locker T1 relaxometry in hepatocyte-specific contrast-enhanced liver MRI. Quant. Imaging Med. Surg. 2022, 12, 2509–2522. [Google Scholar] [CrossRef]
- Haimerl, M.; Utpatel, K.; Verloh, N.; Zeman, F.; Fellner, C.; Nickel, D.; Teufel, A.; Fichtner-Feigl, S.; Evert, M.; Stroszczynski, C.; et al. Gd-EOB-DTPA-enhanced MR relaxometry for the detection and staging of liver fibrosis. Sci. Rep. 2017, 7, 41429. [Google Scholar] [CrossRef]
- Verloh, N.; Utpatel, K.; Haimerl, M.; Zeman, F.; Beyer, L.; Fellner, C.; Brennfleck, F.; Dahlke, M.H.; Stroszczynski, C.; Evert, M.; et al. Detecting liver fibrosis with Gd-EOB-DTPA-enhanced MRI: A confirmatory study. Sci. Rep. 2018, 8, 6207. [Google Scholar] [CrossRef]
- Li, X.; Morgan, P.S.; Ashburner, J.; Smith, J.; Rorden, C. The first step for neuroimaging data analysis: DICOM to NIfTI conversion. J. Neurosci. Methods 2016, 264, 47–56. [Google Scholar] [CrossRef] [PubMed]
- Ishak, K.; Baptista, A.; Bianchi, L.; Callea, F.; de Groote, J.; Gudat, F.; Denk, H.; Desmet, V.; Korb, G.; MacSween, R.N.; et al. Histological grading and staging of chronic hepatitis. J. Hepatol. 1995, 22, 696–699. [Google Scholar] [CrossRef]
- Winther, H.; Hundt, C.; Ringe, K.I.; Wacker, F.K.; Schmidt, B.; Jürgens, J.; Haimerl, M.; Beyer, L.P.; Stroszczynski, C.; Wiggermann, P.; et al. Verwendung eines 3D-neuronalen Netzwerkes zur Lebervolumenbestimmung in der kontrastmittelverstärkten 3T-MRT. Rofo 2021, 193, 305–314. [Google Scholar] [CrossRef] [PubMed]
- Yushkevich, P.A.; Piven, J.; Hazlett, H.C.; Smith, R.G.; Ho, S.; Gee, J.C.; Gerig, G. User-guided 3D active contour segmentation of anatomical structures: Significantly improved efficiency and reliability. Neuroimage 2006, 31, 1116–1128. [Google Scholar] [CrossRef] [Green Version]
- Avants, B.B.; Epstein, C.L.; Grossman, M.; Gee, J.C. Symmetric diffeomorphic image registration with cross-correlation: Evaluating automated labeling of elderly and neurodegenerative brain. Med. Image Anal. 2008, 12, 26–41. [Google Scholar] [CrossRef] [Green Version]
- Gorgolewski, K.J.; Esteban, O.; Burns, C.; Ziegler, E.; Pinsard, B.; Madison, C.; Waskom, M.; Ellis, D.G.; Clark, D.; Dayan, M.; et al. Nipype: A Flexible, Lightweight and Extensible Neuroimaging Data Processing Framework in Python. 0.12.0-Rc1; Zenodo. 2016. Available online: https://nipype.readthedocs.io/en/0.12.0/about.html (accessed on 1 July 2017).
- Jenkinson, M.; Beckmann, C.F.; Behrens, T.E.J.; Woolrich, M.W.; Smith, S.M. FSL. Neuroimage 2012, 62, 782–790. [Google Scholar] [CrossRef] [Green Version]
- Isensee, F.; Jaeger, P.F.; Kohl, S.A.A.; Petersen, J.; Maier-Hein, K.H. nnU-Net: A self-configuring method for deep learning-based biomedical image segmentation. Nat. Methods 2021, 18, 203–211. [Google Scholar] [CrossRef]
- Virtanen, P.; Gommers, R.; Oliphant, T.E.; Haberland, M.; Reddy, T.; Cournapeau, D.; Burovski, E.; Peterson, P.; Weckesser, W.; Bright, J.; et al. SciPy 1.0: Fundamental algorithms for scientific computing in Python. Nat. Methods 2020, 17, 261–272. [Google Scholar] [CrossRef] [Green Version]
- Jungo, A.; Scheidegger, O.; Reyes, M.; Balsiger, F. pymia: A Python package for data handling and evaluation in deep learning-based medical image analysis. Comput. Methods Programs Biomed. 2021, 198, 105796. [Google Scholar] [CrossRef] [PubMed]
- Pedregosa, F.; Varoquaux, G.; Gramfort, A.; Michel, V.; Thirion, B.; Grisel, O.; Blondel, M.; Prettenhofer, P.; Weiss, R.; Dubourg, V.; et al. Scikit-learn: Machine Learning in Python. J. Mach. Learn. Res. 2011, 12, 2825–2830. [Google Scholar]
- Bohte, A.E.; de Niet, A.; Jansen, L.; Bipat, S.; Nederveen, A.J.; Verheij, J.; Terpstra, V.; Sinkus, R.; van Nieuwkerk, K.M.J.; de Knegt, R.J.; et al. Non-invasive evaluation of liver fibrosis: A comparison of ultrasound-based transient elastography and MR elastography in patients with viral hepatitis B and C. Eur. Radiol. 2014, 24, 638–648. [Google Scholar] [CrossRef] [PubMed]
- Bota, S.; Sporea, I.; Sirli, R.; Popescu, A.; Danila, M.; Jurchis, A.; Gradinaru-Tascau, O. Factors associated with the impossibility to obtain reliable liver stiffness measurements by means of Acoustic Radiation Force Impulse (ARFI) elastography—Analysis of a cohort of 1031 subjects. Eur. J. Radiol. 2014, 83, 268–272. [Google Scholar] [CrossRef]
- Huwart, L.; Sempoux, C.; Vicaut, E.; Salameh, N.; Annet, L.; Danse, E.; Peeters, F.; ter Beek, L.C.; Rahier, J.; Sinkus, R.; et al. Magnetic resonance elastography for the non-invasive staging of liver fibrosis. Gastroenterology 2008, 135, 32–40. [Google Scholar] [CrossRef]
- Fischer, M.A.; Donati, O.F.; Reiner, C.S.; Hunziker, R.; Nanz, D.; Boss, A. Feasibility of semiquantitative liver perfusion assessment by ferucarbotran bolus injection in double-contrast hepatic MRI. J. Magn. Reson. Imaging 2012, 36, 168–176. [Google Scholar] [CrossRef]
- Nishie, A.; Asayama, Y.; Ishigami, K.; Tajima, T.; Kakihara, D.; Nakayama, T.; Takayama, Y.; Okamoto, D.; Taketomi, A.; Shirabe, K.; et al. MR prediction of liver fibrosis using a liver-specific contrast agent: Superparamagnetic iron oxide versus Gd-EOB-DTPA. J. Magn. Reson. Imaging 2012, 36, 664–671. [Google Scholar] [CrossRef]
- Verloh, N.; Haimerl, M.; Zeman, F.; Schlabeck, M.; Barreiros, A.; Loss, M.; Schreyer, A.G.; Stroszczynski, C.; Fellner, C.; Wiggermann, P. Assessing liver function by liver enhancement during the hepatobiliary phase with Gd-EOB-DTPA-enhanced MRI at 3 Tesla. Eur. Radiol. 2014, 24, 1013–1019. [Google Scholar] [CrossRef]
- Verloh, N.; Utpatel, K.; Haimerl, M.; Zeman, F.; Fellner, C.; Fichtner-Feigl, S.; Teufel, A.; Stroszczynski, C.; Evert, M.; Wiggermann, P. Liver fibrosis and Gd-EOB-DTPA-enhanced MRI: A histopathologic correlation. Sci. Rep. 2015, 5, 15408. [Google Scholar] [CrossRef] [Green Version]
- Bravo, A.A.; Sheth, S.G.; Chopra, S. Liver biopsy. N. Engl. J. Med. 2001, 344, 495–500. [Google Scholar] [CrossRef]
- Maharaj, B.; Leary, W.P.; Naran, A.D.; Maharaj, R.J.; Cooppan, R.M.; Pirie, D.; Pudifin, D.J. Sampling variability and its influence on the diagnostic yield of percutaneous needle biopsy of the liver. Lancet 1986, 327, 523–525. [Google Scholar] [CrossRef]
- Ratziu, V.; Charlotte, F.; Heurtier, A.; Gombert, S.; Giral, P.; Bruckert, E.; Grimaldi, A.; Capron, F.; Poynard, T. Sampling variability of liver biopsy in nonalcoholic fatty liver disease. Gastroenterology 2005, 128, 1898–1906. [Google Scholar] [CrossRef] [PubMed]
- Kromrey, M.-L.; Le Bihan, D.; Ichikawa, S.; Motosugi, U. Diffusion-weighted MRI-based Virtual Elastography for the Assessment of Liver Fibrosis. Radiology 2020, 295, 127–135. [Google Scholar] [CrossRef] [PubMed]


| Ishak 0 | Ishak 1 | Ishak 2 | Ishak 3 | Ishak 4 | Ishak 5 | Ishak 6 | |
|---|---|---|---|---|---|---|---|
| DICE | 0.951 | 0.935 | 0.962 | 0.957 | 0.951 | 0.948 | 0.890 |
| HD95 | 4.225 | 5.837 | 3.015 | 4.444 | 4.152 | 10.004 | 9.856 |
| n | Compared to | AUC (95% CI) | |
|---|---|---|---|
| Magnetic Resonance Elastography | |||
| Bohte et al., 2014 [34] | n = 85; F0 (n = 3); F1 (n = 53); F2 (n = 15); F3 (n = 8); F4 (n = 6) | METAVIR | F ≥ 2, 0.909 (0.840, 0.977); F ≥ 3, 0.928 (0.874, 0.982) |
| Huwart et al., 2008 [36] | n = 96; F0 (n = 22); F1 (n = 22); F2 (n = 19); F3 (n = 15); F4 (n = 18) | METAVIR | F ≥ 1, 0.962 (0.929, 0.995); F ≥ 2, 0.994 (0.985, 1.0); F ≥ 3, 0.985 (0.968, 1.0); F = 4, 0.985 (0.993, 1.0) |
| Ultrasound-based Transient Elastography | |||
| Bohte et al., 2014 [34] | n = 85; F0 (n = 3); F1 (n = 53); F2 (n = 15); F3 (n = 8); F4 (n = 6) | METAVIR | F ≥ 2, 0.914 (0.857, 0.972); F ≥ 3, 0.895 (0.816, 0.974) |
| Huwart et al., 2008 [36] | n = 96; F0 (n = 22); F1 (n = 22); F2 (n = 19); F3 (n = 15); F4 (n = 18) | METAVIR | F ≥ 1, 0.803 (0.701, 0.904); F ≥ 2, 0.837 (0.756, 0.918); F ≥ 3, 0.906 (0.838, 0.975); F = 4, 0.930 (0.877, 0.982) |
| Uptake of Gd-EOB-DTPA in the HBP | |||
| Verloh et al., 2015 [40] | n = 98; 0 (n = 17); 1 (n = 20); 2 (n = 19); 3 (n = 5); 4 (n = 8); 5 (n = 9); 6 (n = 20) | Ishak | Ishak ≥ 1, 0.94 (0.90, 1.00); Ishak ≥ 2, 0.93 (0.87, 0.98); Ishak ≥ 4, 0.98 (0.94, 1.00); Ishak = 6, 0.96 (0.92, 0.99) |
| Haimerl et al., 2017 [21] | n = 65; F0 (n = 10); F1 (n = 14); F2 (n = 15); F3 (n = 12); F4 (n = 14) | METAVIR | F ≥ 1, 1.00 (1.00, 1.00); F ≥ 2, 0.93 (0.89, 0.99); F ≥ 3, 0.98 (0.95, 1.00); F = 4, 0.96 (0.91, 1.00) |
| 2D U-Net | |||
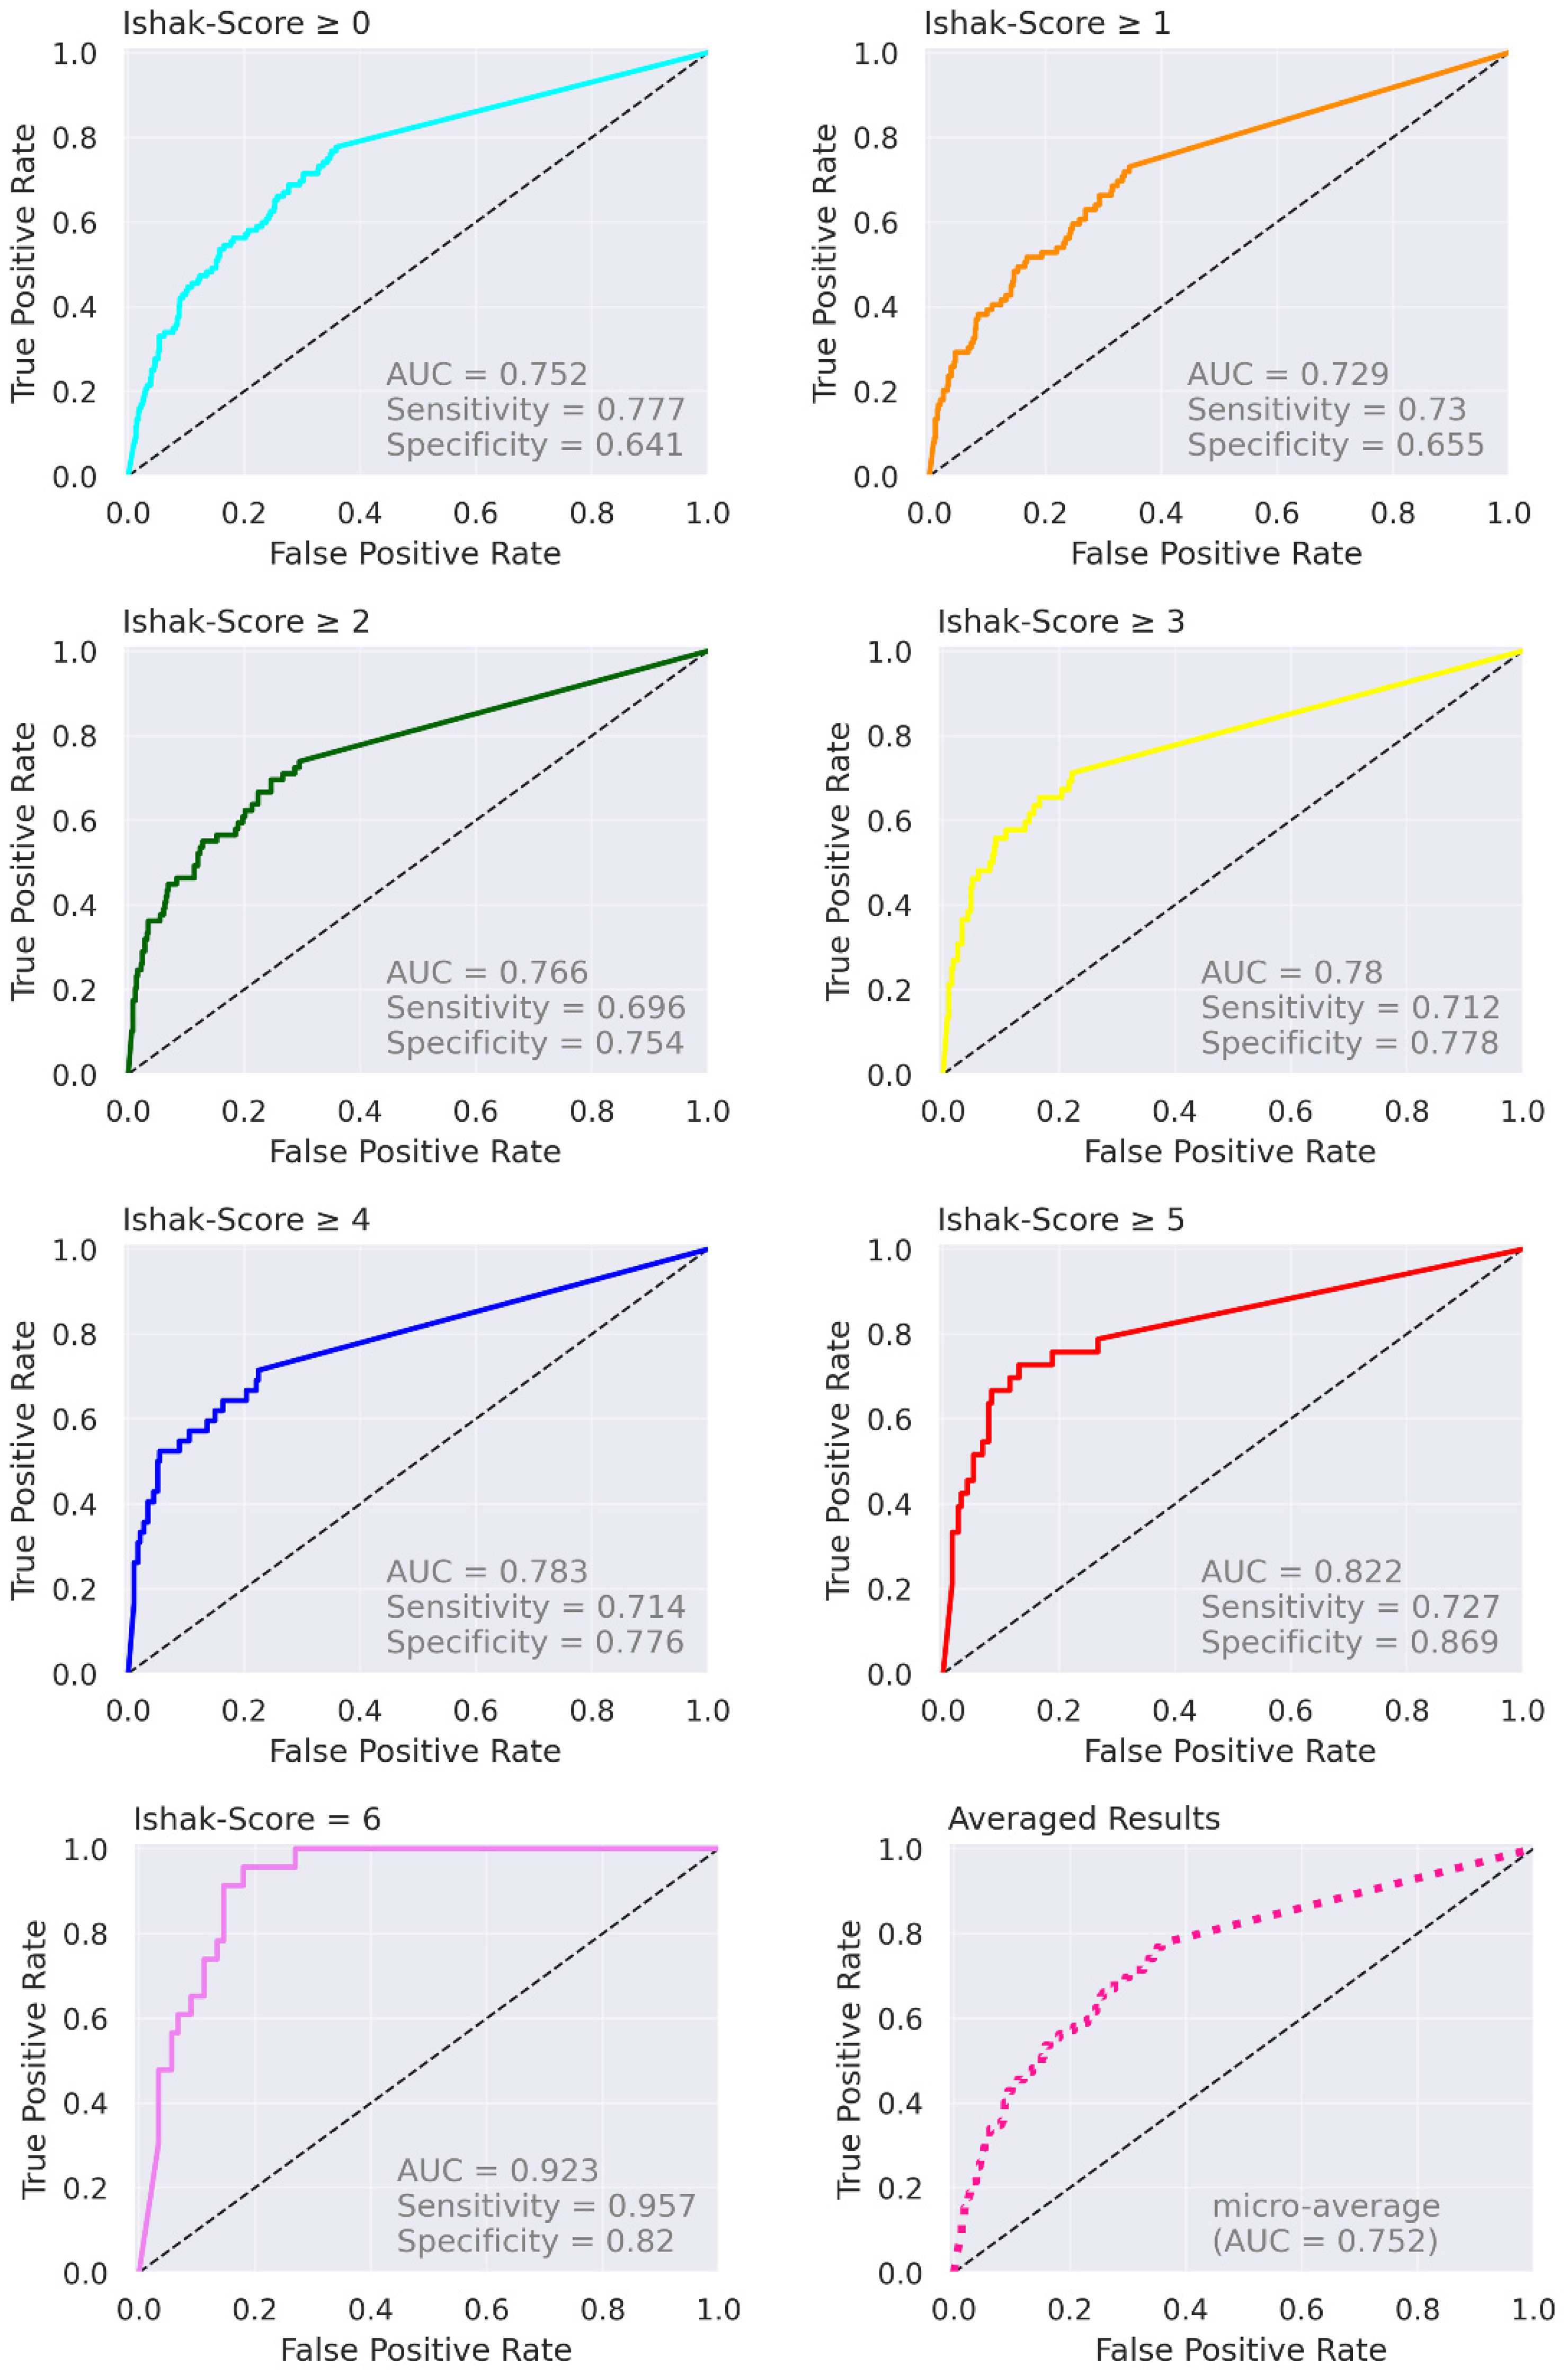
| Proposed (test data) | n = 112; 0 (n = 23); 1 (n = 20); 2 (n = 17); 3 (n = 10), 4 (n = 9), 5 (n = 10); 6 (n = 23) | Ishak | Ishak ≥ 1, 0.729 (0.59, 0.86); Ishak ≥ 2, 0.766 (0.63, 0.90); Ishak ≥ 4, 0.783 (0.60, 0.97); Ishak = 6, 0.923 (0.85, 1.00) |
Publisher’s Note: MDPI stays neutral with regard to jurisdictional claims in published maps and institutional affiliations. |
© 2022 by the authors. Licensee MDPI, Basel, Switzerland. This article is an open access article distributed under the terms and conditions of the Creative Commons Attribution (CC BY) license (https://creativecommons.org/licenses/by/4.0/).
Share and Cite
Strotzer, Q.D.; Winther, H.; Utpatel, K.; Scheiter, A.; Fellner, C.; Doppler, M.C.; Ringe, K.I.; Raab, F.; Haimerl, M.; Uller, W.; et al. Application of A U-Net for Map-like Segmentation and Classification of Discontinuous Fibrosis Distribution in Gd-EOB-DTPA-Enhanced Liver MRI. Diagnostics 2022, 12, 1938. https://doi.org/10.3390/diagnostics12081938
Strotzer QD, Winther H, Utpatel K, Scheiter A, Fellner C, Doppler MC, Ringe KI, Raab F, Haimerl M, Uller W, et al. Application of A U-Net for Map-like Segmentation and Classification of Discontinuous Fibrosis Distribution in Gd-EOB-DTPA-Enhanced Liver MRI. Diagnostics. 2022; 12(8):1938. https://doi.org/10.3390/diagnostics12081938
Chicago/Turabian StyleStrotzer, Quirin David, Hinrich Winther, Kirsten Utpatel, Alexander Scheiter, Claudia Fellner, Michael Christian Doppler, Kristina Imeen Ringe, Florian Raab, Michael Haimerl, Wibke Uller, and et al. 2022. "Application of A U-Net for Map-like Segmentation and Classification of Discontinuous Fibrosis Distribution in Gd-EOB-DTPA-Enhanced Liver MRI" Diagnostics 12, no. 8: 1938. https://doi.org/10.3390/diagnostics12081938
APA StyleStrotzer, Q. D., Winther, H., Utpatel, K., Scheiter, A., Fellner, C., Doppler, M. C., Ringe, K. I., Raab, F., Haimerl, M., Uller, W., Stroszczynski, C., Luerken, L., & Verloh, N. (2022). Application of A U-Net for Map-like Segmentation and Classification of Discontinuous Fibrosis Distribution in Gd-EOB-DTPA-Enhanced Liver MRI. Diagnostics, 12(8), 1938. https://doi.org/10.3390/diagnostics12081938