
Systematic Review and Meta-Analysis of the Susceptibility of ABO Blood Groups to Venous Thromboembolism in Individuals with Factor V Leiden

Abstract
:1. Introduction
2. Materials and Methods
2.1. Protocol Registration and PRISMA Statement
2.2. Search Strategy for Literature and Data Sources
2.3. Eligibility Criteria (Inclusion/Exclusion)
2.4. Study Screening and Data Extraction
2.5. Quality Assessment
2.6. Data Synthesis and Statistical Analysis
3. Results
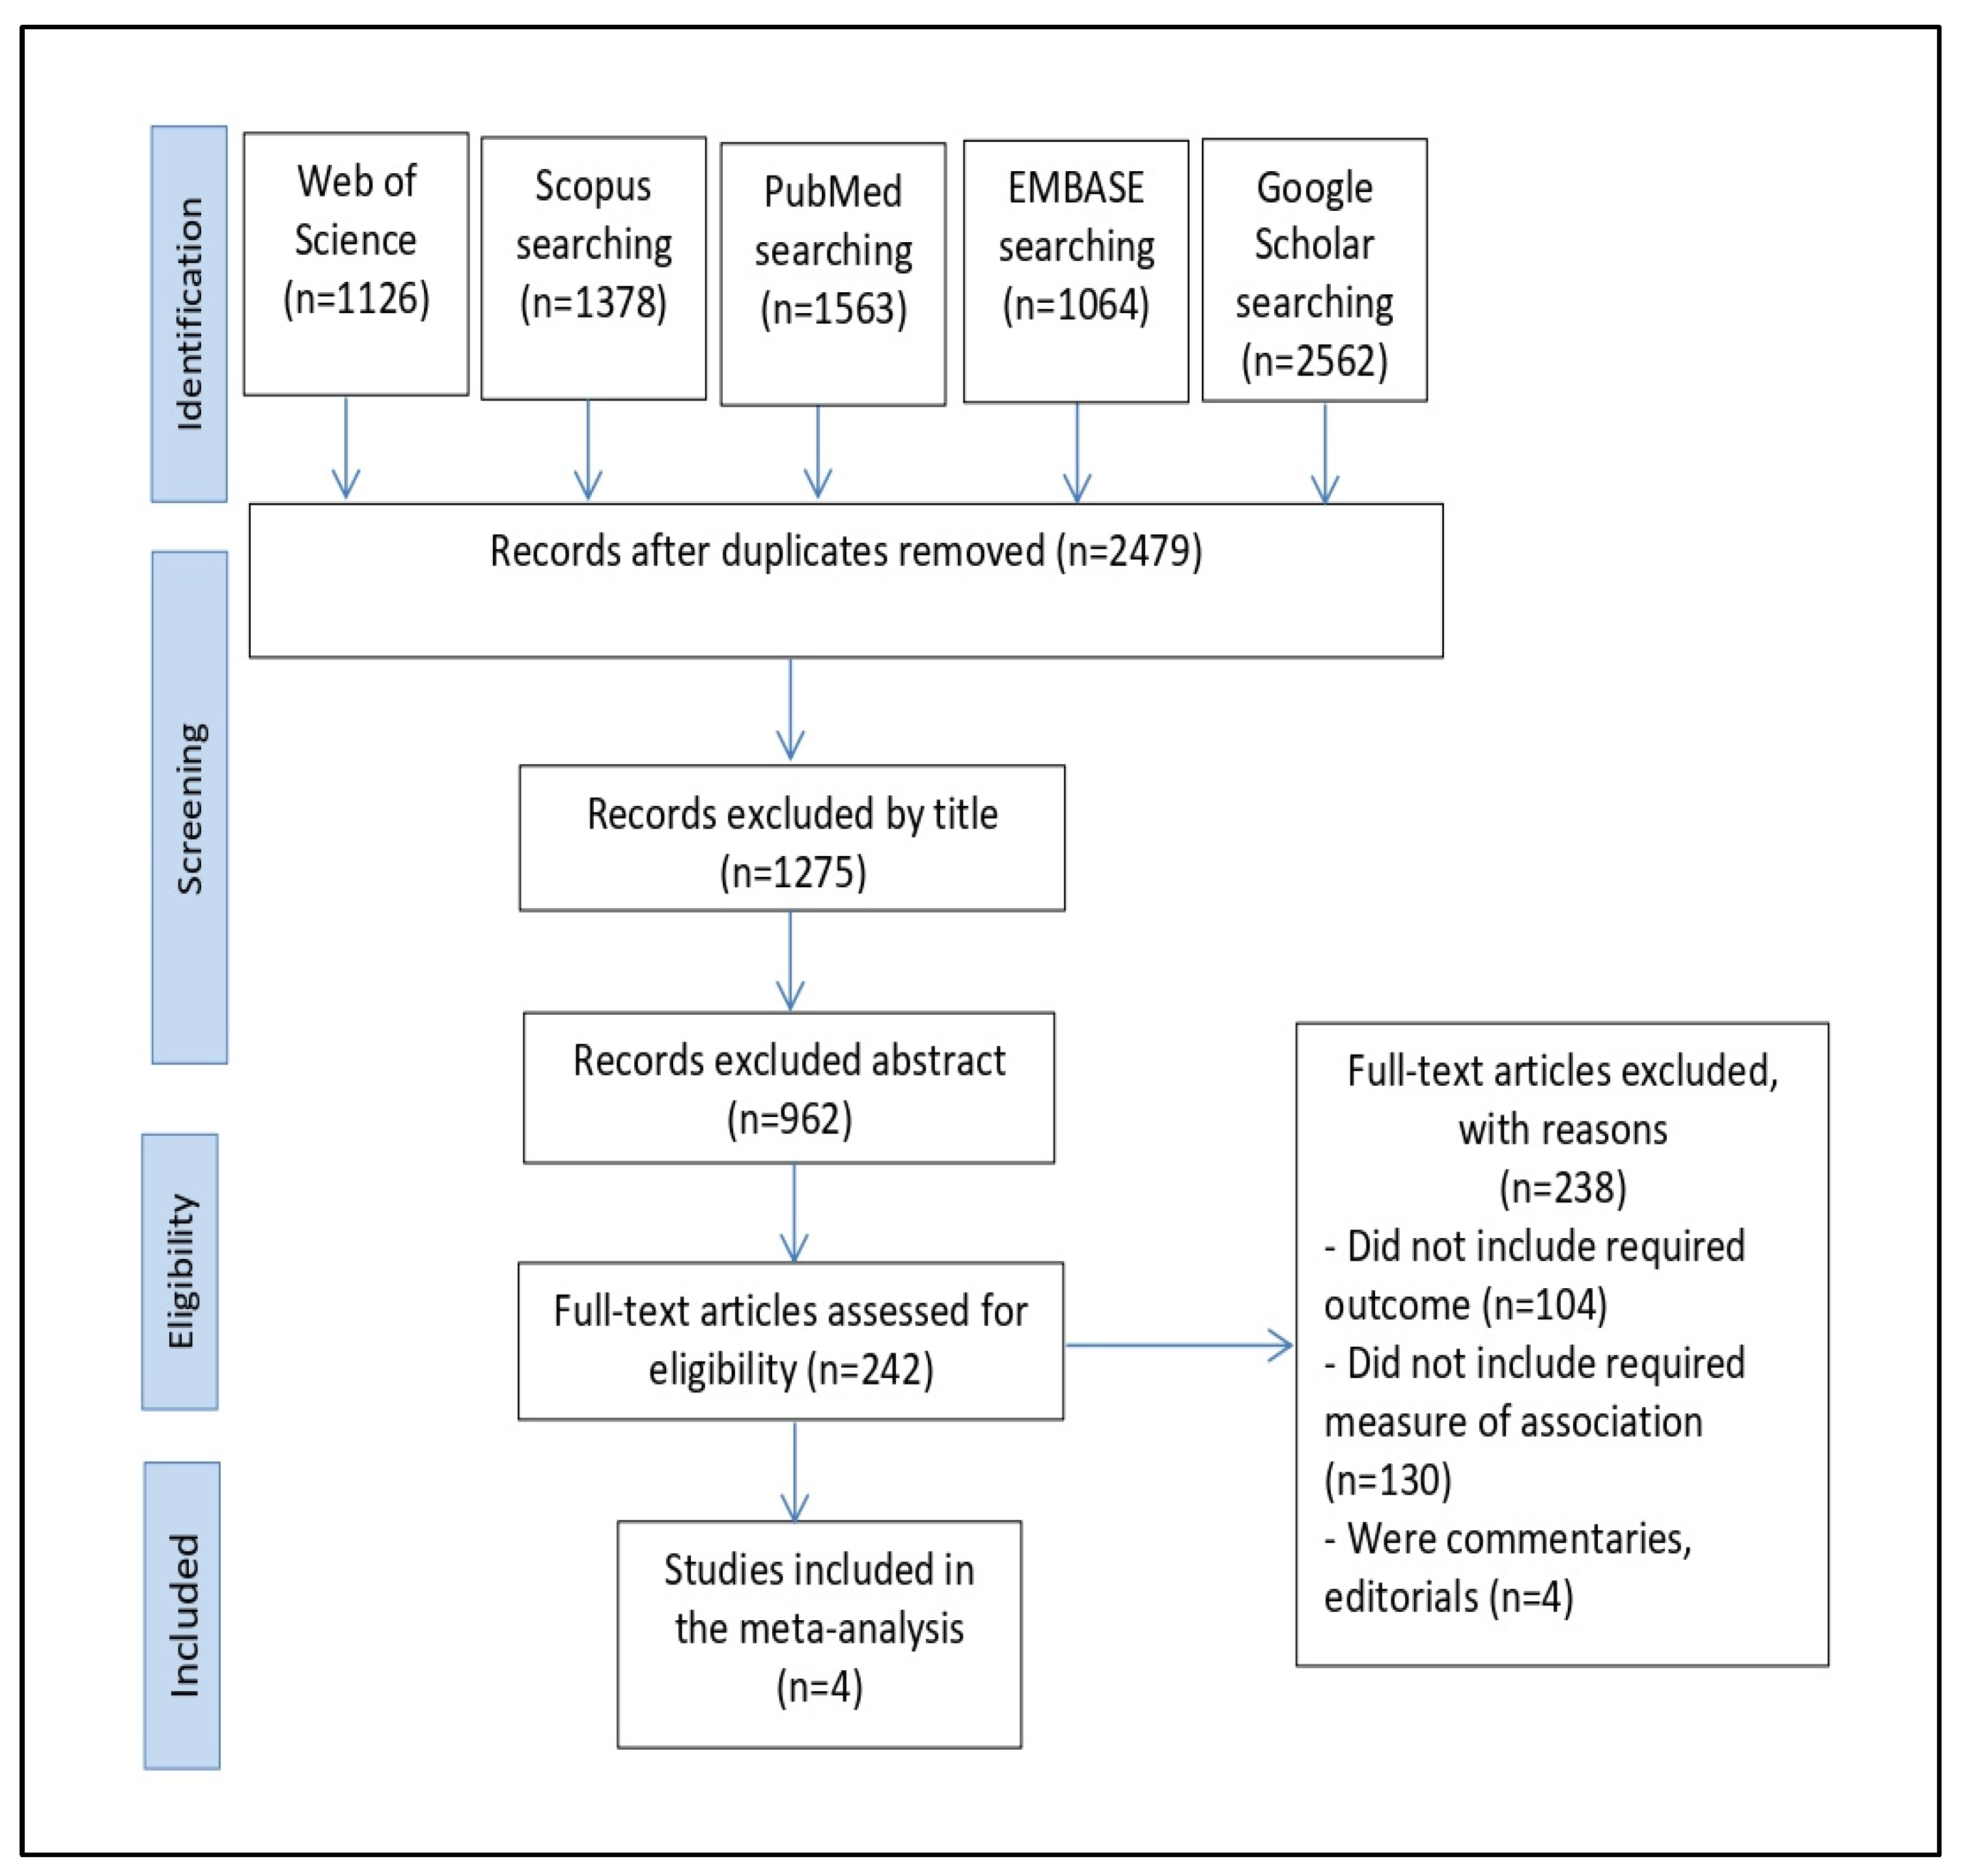
3.1. Search Results
3.2. Characteristics of the Included Studies
3.3. Integrated Outcomes
3.4. Orwin’s and Classic Fail-Safe N Findings
3.5. ABO Blood Group Susceptibility to Venous Thromboembolism in Individuals with Factor V Leiden
3.6. Rank Correlation
3.7. Publication Bias
4. Discussion
5. Conclusions
Supplementary Materials
Funding
Institutional Review Board Statement
Informed Consent Statement
Data Availability Statement
Acknowledgments
Conflicts of Interest
References
- Galanaud, J.-P.; Genty, C.; Sevestre, M.-A.; Brisot, D.; Lausecker, M.; Gillet, J.-L.; Rolland, C.; Righini, M.; Leftheriotis, G.; Bosson, J.-L. Predictive factors for concurrent deep-vein thrombosis and symptomatic venous thromboembolic recurrence in case of superficial venous thrombosis. Thromb. Haemost. 2011, 105, 31–39. [Google Scholar]
- Smalberg, J.H.; Kruip, M.J.; Janssen, H.L.; Rijken, D.C.; Leebeek, F.W.; de Maat, M.P. Hypercoagulability and hypofibrinolysis and risk of deep vein thrombosis and splanchnic vein thrombosis: Similarities and differences. Arterioscler. Thromb. Vasc. Biol. 2011, 31, 485–493. [Google Scholar] [CrossRef] [Green Version]
- Rosendorff, A.; Dorfman, D.M. Activated protein C resistance and factor V Leiden: A review. Arch. Pathol. Lab. Med. 2007, 131, 866–871. [Google Scholar] [CrossRef] [PubMed]
- Bertina, R.M.; Koeleman, B.P.; Koster, T.; Rosendaal, F.R.; Dirven, R.J.; de Ronde, H.; van der Velden, P.A.; Reitsma, P.H. Mutation in blood coagulation factor V associated with resistance to activated protein C. Nature 1994, 369, 64–67. [Google Scholar] [CrossRef] [PubMed]
- Mammen, E.F. Current development in antithrombotic therapy. Semin. Thromb. Hemost. 2004, 30, 605–607. [Google Scholar] [CrossRef] [PubMed]
- Benincasa, G.; Costa, D.; Infante, T.; Lucchese, R.; Donatelli, F.; Napoli, C. Interplay between genetics and epigenetics in modulating the risk of venous thromboembolism: A new challenge for personalized therapy. Thromb. Res. 2019, 177, 145–153. [Google Scholar] [CrossRef]
- Varga, E.; Kujovich, J. Management of inherited thrombophilia: Guide for genetics professionals. Clin. Genet. 2012, 81, 7–17. [Google Scholar] [CrossRef]
- Bucciarelli, P.; Rosendaal, F.R.; Tripodi, A.; Mannucci, P.M.; de Stefano, V.; Palareti, G.; Finazzi, G.; Baudo, F.; Quintavalla, R. Risk of venous thromboembolism and clinical manifestations in carriers of antithrombin, protein C, protein S deficiency, or activated protein C resistance: A multicenter collaborative family study. Arterioscler. Thromb. Vasc. Biol. 1999, 19, 1026–1033. [Google Scholar] [CrossRef] [Green Version]
- Ridker, P.M.; Hennekens, C.H.; Lindpaintner, K.; Stampfer, M.J.; Eisenberg, P.R.; Miletich, J.P. Mutation in the gene coding for coagulation factor V and the risk of myocardial infarction, stroke, and venous thrombosis in apparently healthy men. N. Engl. J. Med. 1995, 332, 912–917. [Google Scholar] [CrossRef]
- Koster, T.; Vandenbroucke, J.; Rosendaal, F.; de Ronde, H.; Briët, E.; Bertina, R.M. Venous thrombosis due to poor anticoagulant response to activated protein C: Leiden Thrombophilia Study. Lancet 1993, 342, 1503–1506. [Google Scholar] [CrossRef]
- Folsom, A.R.; Cushman, M.; Tsai, M.Y.; Aleksic, N.; Heckbert, S.R.; Boland, L.L.; Tsai, A.W.; Yanez, N.D.; Rosamond, W.D. A prospective study of venous thromboembolism in relation to factor V Leiden and related factors. Blood 2002, 99, 2720–2725. [Google Scholar] [CrossRef] [PubMed] [Green Version]
- Heit, J.A.; O’Fallon, W.M.; Petterson, T.M.; Lohse, C.M.; Silverstein, M.D.; Mohr, D.N.; Melton, L.J. Relative impact of risk factors for deep vein thrombosis and pulmonary embolism: A population-based study. Arch. Intern. Med. 2002, 162, 1245–1248. [Google Scholar] [CrossRef] [PubMed] [Green Version]
- Middeldorp, S.; Henkens, C.M.; Koopman, M.M.; van Pampus, E.C.; Hamulyak, K.; van der Meer, J.; Prins, M.H.; Buller, H.R. The incidence of venous thromboembolism in family members of patients with factor V Leiden mutation and venous thrombosis. Ann. Intern. Med. 1998, 128, 15–20. [Google Scholar] [CrossRef] [Green Version]
- Simioni, P.; Prandoni, P.; Girolami, A. Low rate of venous thromboembolism in asymptomatic relatives of probands with factor V Leiden mutation. Ann. Intern. Med. 1999, 130, 538. [Google Scholar] [CrossRef] [PubMed]
- Simioni, P.; Sanson, B.-J.; Prandoni, P.; Tormene, D.; Friederich, P.W.; Girolami, B.; Gavasso, S.; Huisman, M.V.; Büller, H.R.; ten Cate, J.W. Incidence of venous thromboembolism in families with inherited thrombophilia. Thromb. Haemost. 1999, 81, 198–202. [Google Scholar] [CrossRef] [PubMed] [Green Version]
- Ye, Z.; Liu, E.H.; Higgins, J.P.; Keavney, B.D.; Lowe, G.D.; Collins, R.; Danesh, J. Seven haemostatic gene polymorphisms in coronary disease: Meta-analysis of 66 155 cases and 91 307 controls. Lancet 2006, 367, 651–658. [Google Scholar] [CrossRef]
- Jick, H.; Westerholm, B.; Vessey, M.; Lewis, G.; Slone, D.; Inman, W.W.; Shapiro, S.; Worcester, J. Venous thromboembolic disease and ABO blood type: A cooperative study. Lancet 1969, 293, 539–542. [Google Scholar] [CrossRef]
- Ohira, T.; Cushman, M.; Tsai, M.; Zhang, Y.; Heckbert, S.; Zakai, N.; Rosamond, W.; Folsom, A.R. ABO blood group, other risk factors and incidence of venous thromboembolism: The Longitudinal Investigation of Thromboembolism Etiology (LITE). J. Thromb. Haemost. 2007, 5, 1455–1461. [Google Scholar] [CrossRef]
- Tirado, I.; Mateo, J.; Soria, J.M.; Oliver, A.; Martínez-Sánchez, E.; Vallvé, C.; Borrell, M.; Urrutia, T.; Fontcuberta, J. The ABO blood group genotype and factor VIII levels as independent risk factors for venous thromboembolism. Thromb. Haemost. 2005, 93, 468–474. [Google Scholar] [CrossRef]
- Streiff, M.B.; Segal, J.; Grossman, S.A.; Kickler, T.S.; Weir, E.G. ABO blood group is a potent risk factor for venous thromboembolism in patients with malignant gliomas. Cancer 2004, 100, 1717–1723. [Google Scholar] [CrossRef]
- Larsen, T.B.; Johnsen, S.P.; Gislum, M.; Møller, C.; Larsen, H.; Sørensen, H.T. ABO blood groups and risk of venous thromboembolism during pregnancy and the puerperium. A population-based, nested case-control study. J. Thromb. Haemost. 2005, 3, 300–304. [Google Scholar] [CrossRef] [PubMed]
- Muellner, S.K.; Haut, E.R.; Streiff, M.B.; Holcomb, J.B.; Cotton, B.A. ABO blood group as a potential risk factor for venous thromboembolism in acutely injured patients. Thromb. Haemost. 2011, 105, 5–13. [Google Scholar] [CrossRef]
- Biswas, J.; Islam, M.; Rudra, S.; Haque, M.; Bhuiyan, Z.; Husain, M.; Mamun, A. Relationship between blood groups and coronary artery disease. Mymensingh Med. J. 2008, 17, S22–S27. [Google Scholar]
- Carpeggiani, C.; Coceani, M.; Landi, P.; Michelassi, C.; L’Abbate, A. ABO blood group alleles: A risk factor for coronary artery disease. An angiographic study. Atherosclerosis 2010, 211, 461–466. [Google Scholar] [CrossRef] [PubMed]
- De Paula Sabino, A.; Ribeiro, D.D.; Domingheti, C.P.; Rios, D.R.A.; Dusse, L.M.S.; das Graças Carvalho, M.; Fernandes, A.P. ABO blood group polymorphisms and risk for ischemic stroke and peripheral arterial disease. Mol. Biol. Rep. 2014, 41, 1771–1777. [Google Scholar] [CrossRef] [PubMed]
- Franchini, M.; Favaloro, E.J.; Targher, G.; Lippi, G. ABO blood group, hypercoagulability, and cardiovascular and cancer risk. Crit. Rev. Clin. Lab. Sci. 2012, 49, 137–149. [Google Scholar] [CrossRef]
- Clark, P.; Wu, O. ABO blood groups and thrombosis: A causal association, but is there value in screening? Future Cardiol. 2011, 7, 191–201. [Google Scholar] [CrossRef]
- Rosendaal, F.; Reitsma, P. Genetics of venous thrombosis. J. Thromb. Haemost. 2009, 7, 301–304. [Google Scholar] [CrossRef]
- Zhang, H.; Mooney, C.J.; Reilly, M.P. ABO blood groups and cardiovascular diseases. Int. J. Vasc. Med. 2012, 2012, 641917. [Google Scholar] [CrossRef] [Green Version]
- Armijo-Olivo, S.; Stiles, C.R.; Hagen, N.A.; Biondo, P.D.; Cummings, G.G. Assessment of study quality for systematic reviews: A comparison of the Cochrane Collaboration Risk of Bias Tool and the Effective Public Health Practice Project Quality Assessment Tool: Methodological research. J. Eval. Clin. Pract. 2012, 18, 12–18. [Google Scholar] [CrossRef]
- Thomas, H.; Ciliska, D.; Dobbins, M. Quality Assessment Tool for Quantitative Studies; Effective Public Health Practice Project McMaster University: Toronto, ON, Canada, 2003. [Google Scholar]
- Higgins, J.P.; Thompson, S.G. Quantifying heterogeneity in a meta-analysis. Stat. Med. 2002, 21, 1539–1558. [Google Scholar] [CrossRef] [PubMed]
- DerSimonian, R.; Kacker, R. Random-effects model for meta-analysis of clinical trials: An update. Contemp. Clin. Trials 2007, 28, 105–114. [Google Scholar] [CrossRef] [PubMed]
- Ordœñez, A.G.; Rodriguez, J.M.; Martin, L.; Alvarez, V.; Coto, E. The O blood group protects against venous thromboembolism in individuals with the factor V Leiden but not the prothrombin (factor II G20210A) mutation. Blood Coagul. Fibrinolysis 1999, 10, 303–307. [Google Scholar]
- Miñano, A.; Ordóñez, A.; España, F.; González-Porras, J.R.; Lecumberri, R.; Fontcuberta, J.; Llamas, P.; Marín, F.; Estellés, A.; Alberca, I. AB0 blood group and risk of venous or arterial thrombosis in carriers of factor V Leiden or prothrombin G20210A polymorphisms. Haematologica 2008, 93, 729–734. [Google Scholar] [CrossRef] [PubMed] [Green Version]
- Lima, M.B.; Oliveira-Filho, A.B.d.; Campos, J.F.; Melo, F.C.; Neves, W.B.d.; Melo, R.A.M.; Lemos, J.A.R. Increased risk of venous thrombosis by AB alleles of the ABO blood group and Factor V Leiden in a Brazilian population. Genet. Mol. Biol. 2009, 32, 264–267. [Google Scholar] [CrossRef] [Green Version]
- Morelli, V.; de Visser, M.; Vos, H.; Bertina, R.; Rosendaal, F. ABO blood group genotypes and the risk of venous thrombosis: Effect of factor V Leiden. J. Thromb. Haemost. 2005, 3, 183–185. [Google Scholar] [CrossRef] [Green Version]
- Smith, G.D.; Egger, M. Meta-analysis of randomised controlled trials. Lancet 1997, 350, 1182. [Google Scholar] [CrossRef]
- Hedges, L.V.; Vevea, J.L. Fixed-and random-effects models in meta-analysis. Psychol. Methods 1998, 3, 486. [Google Scholar] [CrossRef]
- Ried, K. Interpreting and understanding meta-analysis graphs: A practical guide. Aust. Fam. Physician 2006, 35, 635–638. [Google Scholar]
- Zintzaras, E.; Lau, J. Synthesis of genetic association studies for pertinent gene–disease associations requires appropriate methodological and statistical approaches. J. Clin. Epidemiol. 2008, 61, 634–645. [Google Scholar] [CrossRef]
- Lau, J.; Ioannidis, J.P.; Terrin, N.; Schmid, C.H.; Olkin, I. The case of the misleading funnel plot. BMJ 2006, 333, 597–600. [Google Scholar] [CrossRef] [PubMed] [Green Version]
- Munafo, M.R.; Flint, J. Meta-analysis of genetic association studies. Trends Genet. 2004, 20, 439–444. [Google Scholar] [CrossRef] [PubMed]
- Borenstein, M.; Higgins, J.P.; Hedges, L.V.; Rothstein, H.R. Basics of meta-analysis: I2 is not an absolute measure of heterogeneity. Res. Synth. Methods 2017, 8, 5–18. [Google Scholar] [CrossRef] [PubMed] [Green Version]
- Rothstein, H.R.; Sutton, A.J.; Borenstein, M. Publication bias in meta-analysis. In Publication Bias in Meta-Analysis: Prevention, Assessment and Adjustments; Wiley: Hoboken, NJ, USA, 2005; pp. 1–7. [Google Scholar]
- Weischer, M.; Juul, K.; Zacho, J.; Jensen, G.B.; Steffensen, R.; Schroeder, T.V.; Tybjærg-Hansen, A.; Nordestgaard, B.G. Prothrombin and risk of venous thromboembolism, ischemic heart disease and ischemic cerebrovascular disease in the general population. Atherosclerosis 2010, 208, 480–483. [Google Scholar] [CrossRef]
- Sode, B.F.; Allin, K.H.; Dahl, M.; Gyntelberg, F.; Nordestgaard, B.G. Risk of venous thromboembolism and myocardial infarction associated with factor V Leiden and prothrombin mutations and blood type. Can. Med Assoc. J. 2013, 185, E229–E237. [Google Scholar] [CrossRef] [Green Version]
- Ridker, P.M.; Hennekens, C.H.; Miletich, J.P. G20210A mutation in prothrombin gene and risk of myocardial infarction, stroke, and venous thrombosis in a large cohort of US men. Circulation 1999, 99, 999–1004. [Google Scholar] [CrossRef] [Green Version]
- Lane, D.A.; Grant, P.J. Role of hemostatic gene polymorphisms in venous and arterial thrombotic disease. Blood 2000, 95, 1517–1532. [Google Scholar] [CrossRef]
- Garratty, G. Blood groups and disease: A historical perspective. Transfus. Med. Rev. 2000, 14, 291–301. [Google Scholar] [CrossRef]
- Greenwell, P. Blood group antigens: Molecules seeking a function? Glycoconj. J. 1997, 14, 159–173. [Google Scholar] [CrossRef]
- Shima, M.; Fujimura, Y.; Nishiyama, T.; Tsujiuchi, T.; Narita, N.; Matsui, T.; Titani, K.; Katayama, M.; Yamamoto, F.i.; Yoshioka, A. ABO blood group genotype and plasma von Willebrand factor in normal individuals. Vox Sang. 1995, 68, 236–240. [Google Scholar] [CrossRef]
- Oriol, R.; Mollicone, R.; Coullin, P.; Dalix, A.-M.; Candelier, J.-J. Genetic regulation of the expression of ABH and Lewis antigens in tissues. APMIS. Suppl. 1992, 27, 28–38. [Google Scholar] [PubMed]
- O’Donnell, J.; Boulton, F.E.; Manning, R.A.; Laffan, M.A. Amount of H antigen expressed on circulating von Willebrand factor is modified by ABO blood group genotype and is a major determinant of plasma von Willebrand factor antigen levels. Arterioscler. Thromb. Vasc. Biol. 2002, 22, 335–341. [Google Scholar] [CrossRef] [PubMed]
- Orstavik, K.; Magnus, P.; Reisner, H.; Berg, K.; Graham, J.; Nance, W. Factor VIII and factor IX in a twin population. Evidence for a major effect of ABO locus on factor VIII level. Am. J. Hum. Genet. 1985, 37, 89–101. [Google Scholar]
- Wu, O.; Bayoumi, N.; Vickers, M.; Clark, P. ABO (H) blood groups and vascular disease: A systematic review and meta-analysis. J. Thromb. Haemost. 2008, 6, 62–69. [Google Scholar] [CrossRef]
- Franco, R.; Trip, M.; Ten Cate, H.; van den Ende, A.; Prins, M.; Kastelein, J.; Reitsma, P. The 20210 G→ A mutation in the 3′-untranslated region of the prothrombin gene and the risk for arterial thrombotic disease. Br. J. Haematol. 1999, 104, 50–54. [Google Scholar] [CrossRef] [PubMed]
- Bauer, K.A. Role of thrombophilia in deciding on the duration of anticoagulation. Semin. Thromb. Hemost. 2004, 30, 633–637. [Google Scholar] [CrossRef] [PubMed]
- Lochhead, P.; Miedzybrodzka, Z. The essential role of genetic counseling in inherited thrombophilia. Semin. Hematol. 2007, 44, 126–129. [Google Scholar] [CrossRef]
- Moher, D.; Liberati, A.; Tetzlaff, J.; Altman, D.G.; The PRISMA Group. Preferred Reporting Items for Systematic Reviews and Meta-Analyses: The PRISMA Statement. PLoS Med. 2009, 6, e1000097. [Google Scholar] [CrossRef] [Green Version]


| The First Author (Year) | Country | Study Population | Study Design | Gender (M/F) | Mean Age | Sample n | O n (%) | A n (%) | B n (%) | AB n (%) | Prevalence |
|---|---|---|---|---|---|---|---|---|---|---|---|
| González Ordœñez et al. (1999) | Spain | Individuals with the factor V Leiden | Cross-sectional study | 92/86 | 54 | 178 | 42 (23.6) | 103 (57.9) | 23 (12.9) | 10 (5.6) | A > O > B > AB |
| Morelli VM et al. (2005) | Netherlands | Patients with venous thrombosis | Case-control study | NM | NM | 471 | 137 (29.1) | 259 (55.0) | 52 (11.0) | 23 (4.9) | A > O > B > AB |
| Antonia Miñano et al. (2008) | Spain | Carriers of factor V Leiden or prothrombin 20210A polymorphisms | Case-control study | 53/25 | 56 | 78 | 27 (34.6) | 39 (50.0) | 7 (9.0) | 5 (6.4) | A > O > B > AB |
| Magaly Lima et al. (2009) | Brazil | Patients had a history of DVT | Case-control study | 18.47 | 34 | 65 | 18 (27.7) | 0 (0.0) | 0 (0.0) | 47 (72.3) | AB > O > A = B |
| Model | Effect Size and 95% Confidence Interval | Test of Null (2-Tail | Heterogeneity | Tau-Squared | ||||||||||
|---|---|---|---|---|---|---|---|---|---|---|---|---|---|---|
| Model | Number of Subgroups | Point of Estimate | Lower Limit | Upper Limit | Z-Value | p-Value | Q-Value | df (Q) | p-Value | I-Squared | Tau Squared | Standard Error | Variance | Tau |
| Fixed | 16 | 0.416 | 0.397 | 0.435 | −8.370 | 0.001 | 432.187 | 15 | 0.001 | 96.529 | 0.786 | 0.408 | 0.167 | 0.887 |
| Random | 16 | 0.392 | 0.288 | 0.507 | −1.841 | 0.066 | ||||||||
| Orwin’s Fail-Safe N Method | Classic Fail-Safe N Method | ||
|---|---|---|---|
| The event rate is observed in studies | 0.416 | Z-value for observed studies | −8.506 |
| The criterion for a “trivial” event rate | 0.500 | The p-value for observed studies | 0.001 |
| Mean event rate in missing studies | 0.500 | Alpha | 0.050 |
| Tails | 2.000 | ||
| Z for alphas | 1.959 | ||
| Number of observed subgroups in the studies | 16.000 | ||
| Number of missing studies that would bring the p-value to > alpha (N value) | 286.000 | ||
| Kendall’s S Statistic (P-Q) | 2.000 |
|---|---|
| Kendall’s tau without continuity correction | |
| Tau | 0.017 |
| z-value for tau | 0.090 |
| p-value (1-tailed) | 0.464 |
| p-value (2-tailed) | 0.928 |
| Kendall’s tau with continuity correction | |
| Tau | 0.008 |
| z-value for tau | 0.045 |
| p-value (1-tailed) | 0.482 |
| p-value (2-tailed) | 0.964 |
| Egger’s regression intercept | |
| Intercept | −1.259 |
| Standard error | 2.807 |
| 95% low limit (2-tailed) | −7.280 |
| 95% upper limit (2-tailed) | 4.762 |
| t-value | 0.448 |
| df | 14.000 |
| p-value (1-tailed) | 0.330 |
| p-value (2-tailed) | 0.661 |
Publisher’s Note: MDPI stays neutral with regard to jurisdictional claims in published maps and institutional affiliations. |
© 2022 by the author. Licensee MDPI, Basel, Switzerland. This article is an open access article distributed under the terms and conditions of the Creative Commons Attribution (CC BY) license (https://creativecommons.org/licenses/by/4.0/).
Share and Cite
Bawazir, W.M. Systematic Review and Meta-Analysis of the Susceptibility of ABO Blood Groups to Venous Thromboembolism in Individuals with Factor V Leiden. Diagnostics 2022, 12, 1936. https://doi.org/10.3390/diagnostics12081936
Bawazir WM. Systematic Review and Meta-Analysis of the Susceptibility of ABO Blood Groups to Venous Thromboembolism in Individuals with Factor V Leiden. Diagnostics. 2022; 12(8):1936. https://doi.org/10.3390/diagnostics12081936
Chicago/Turabian StyleBawazir, Waleed M. 2022. "Systematic Review and Meta-Analysis of the Susceptibility of ABO Blood Groups to Venous Thromboembolism in Individuals with Factor V Leiden" Diagnostics 12, no. 8: 1936. https://doi.org/10.3390/diagnostics12081936
APA StyleBawazir, W. M. (2022). Systematic Review and Meta-Analysis of the Susceptibility of ABO Blood Groups to Venous Thromboembolism in Individuals with Factor V Leiden. Diagnostics, 12(8), 1936. https://doi.org/10.3390/diagnostics12081936