
A Fair Performance Comparison between Complex-Valued and Real-Valued Neural Networks for Disease Detection


Abstract
:1. Introduction
Review of the State of the Art of the Technique
2. Materials
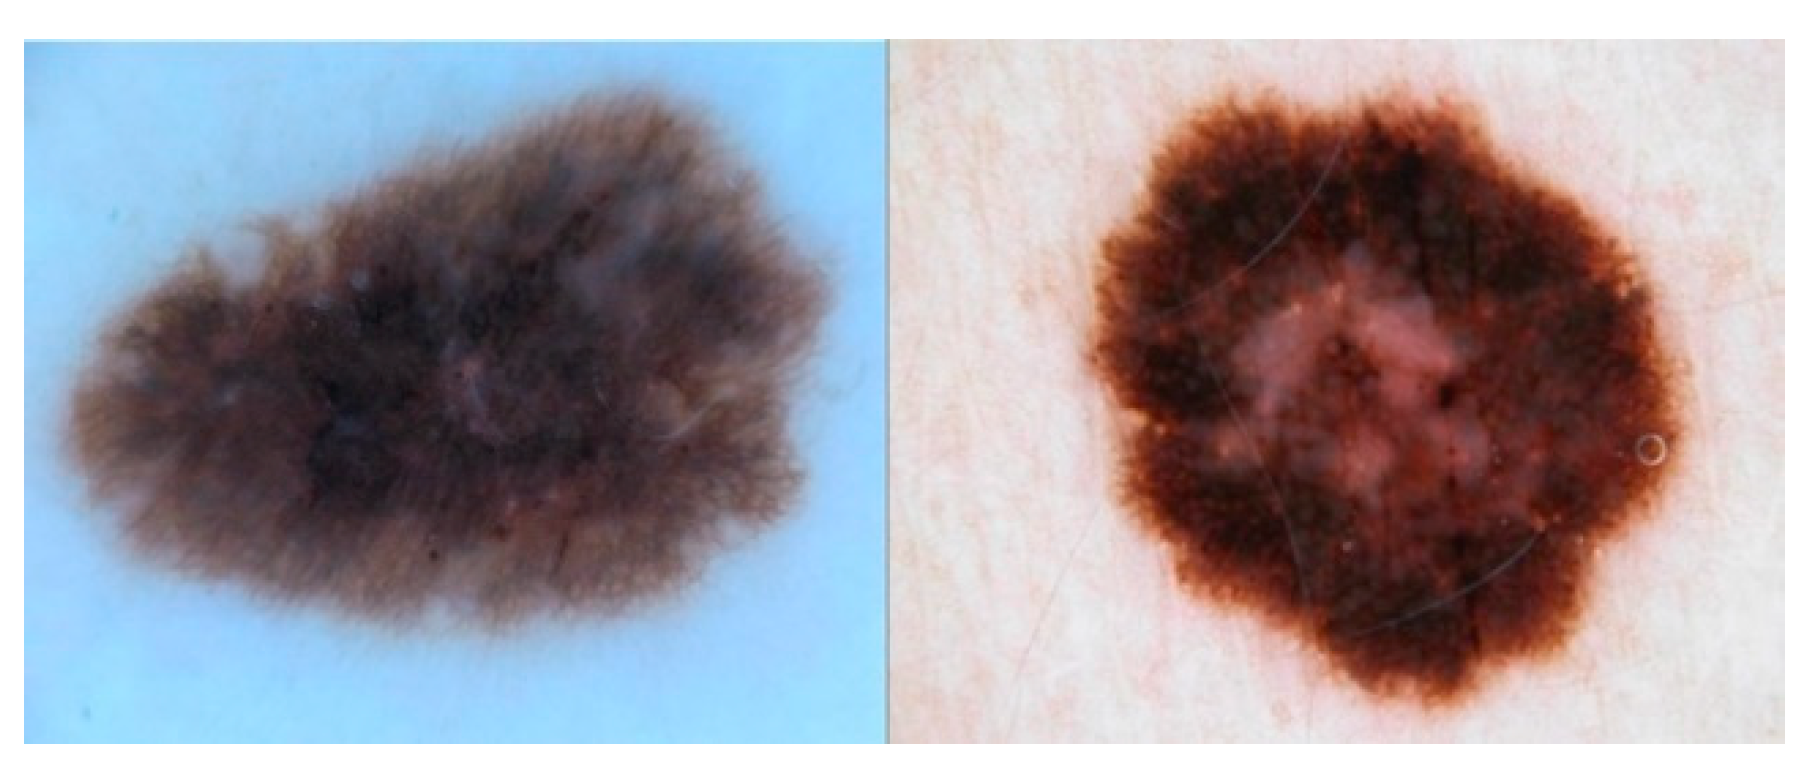
2.1. ISIC2017
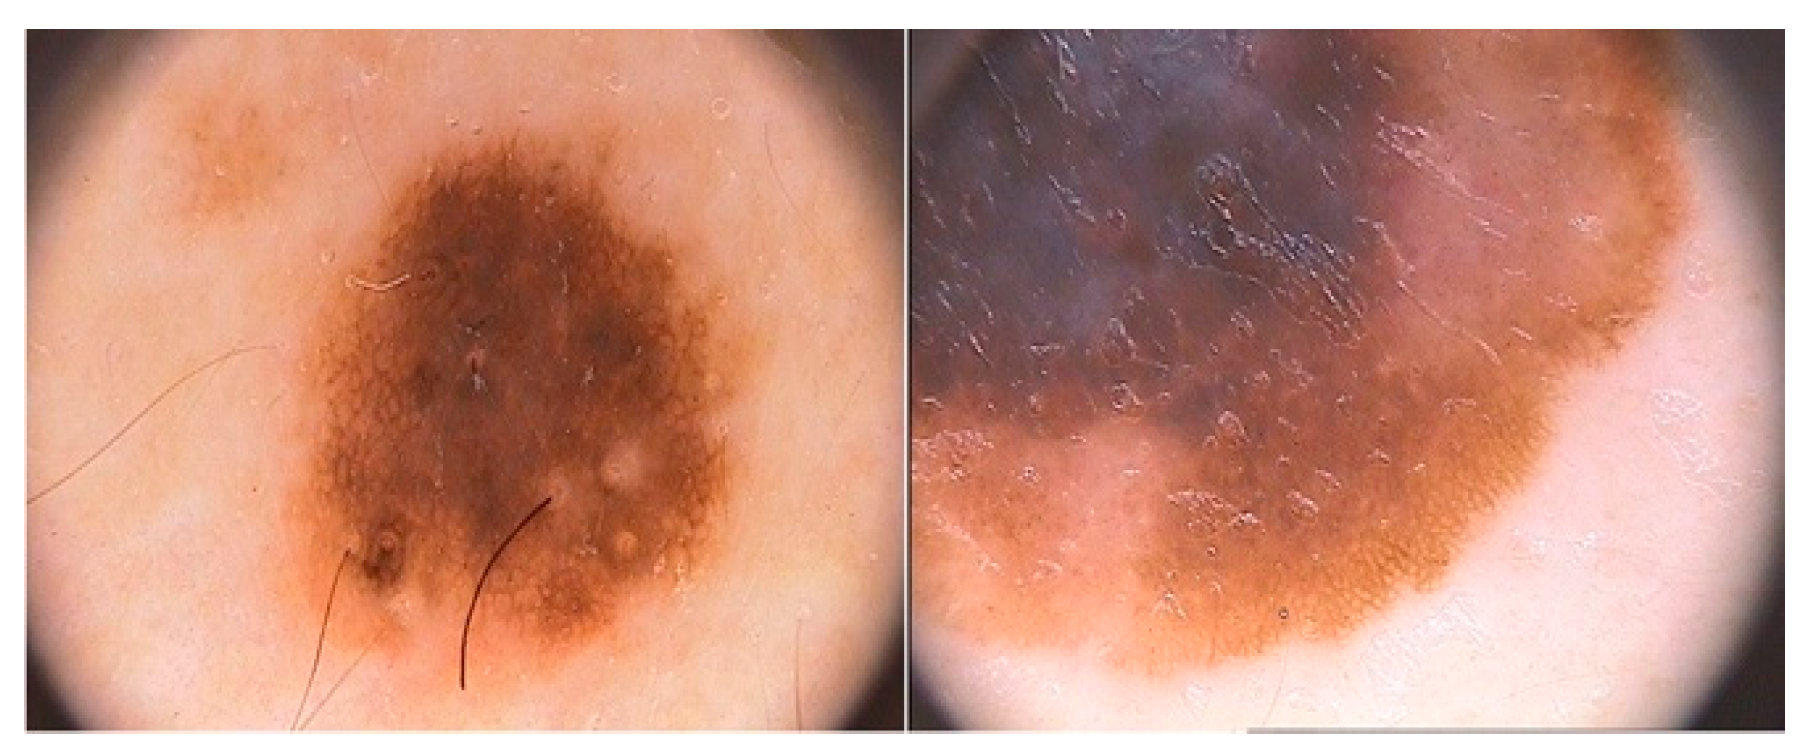
2.2. PH2
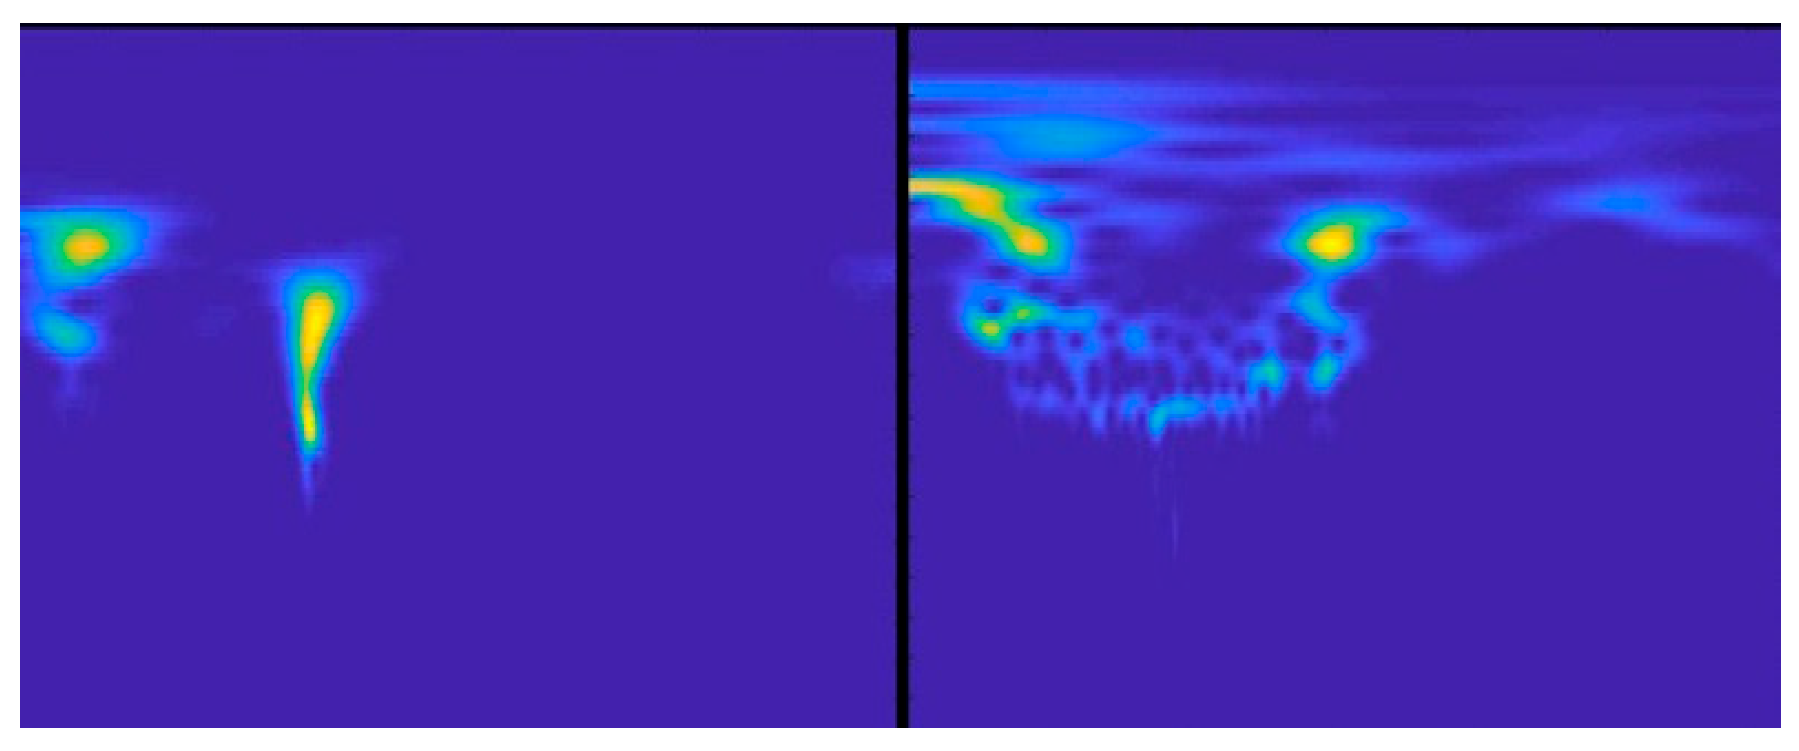
2.3. PASCAL
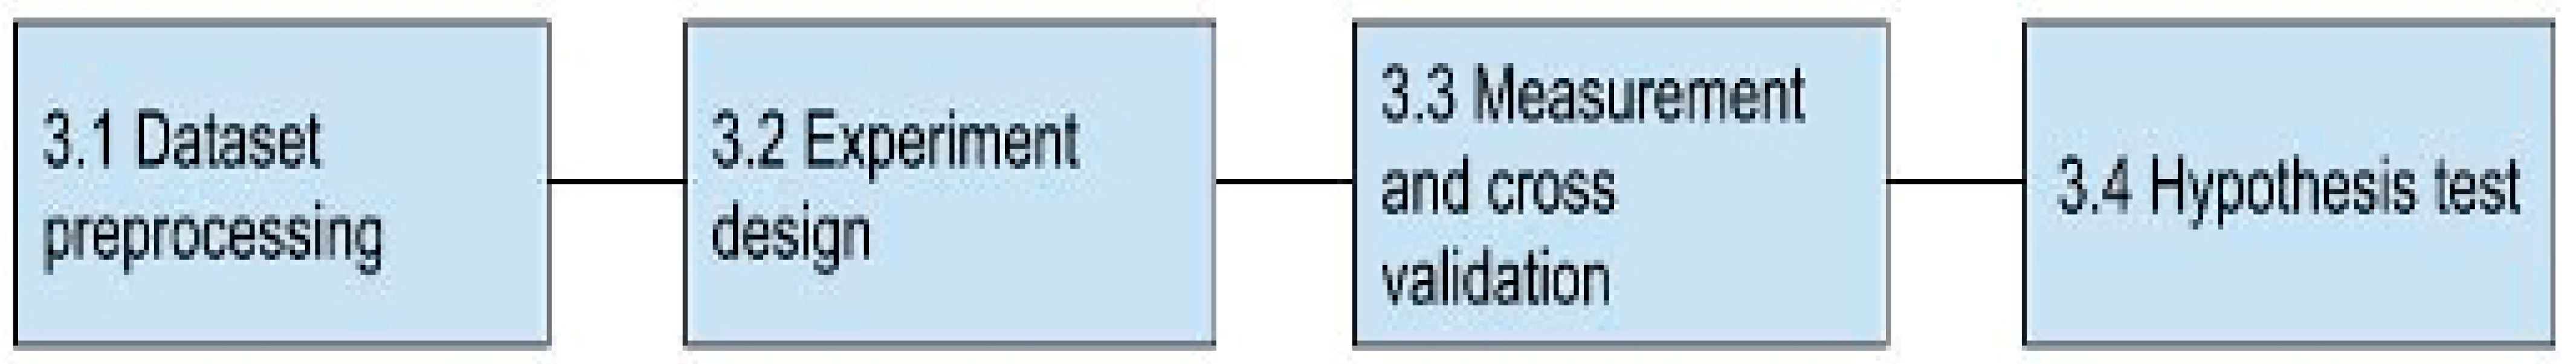
3. Methods
3.1. Dataset Preprocessing
3.2. Experiment Design
3.2.1. Structure Factor
3.2.2. Complex-Valued Structure
3.3. Measurement and Cross-Validation
3.4. Hypothesis Test
4. Results and Discussion
5. Conclusions
Author Contributions
Funding
Institutional Review Board Statement
Informed Consent Statement
Data Availability Statement
Acknowledgments
Conflicts of Interest
References
- Thamm, S.; Huebser, L.; Adam, T.; Hellebrandt, T.; Heine, I.; Barbalho, S.; Velho, S.K.; Becker, M.; Bagnato, V.S.; Schmitt, R.H. Concept for an augmented intelligence-based quality assurance of assembly tasks in global value networks. Procedia CIRP 2021, 97, 423–428. [Google Scholar] [CrossRef]
- Andreescu, T.; Andrica, D. (Eds.) (Dorin) Andrica, and D. (Dorin) Andrica. In Complex Numbers from A to–Z; Birkhäuser: Richardson, TX, USA, 2004; p. 321. [Google Scholar]
- Bassey, J.; Li, X.; Qian, L. A Survey of Complex-Valued Neural Networks. arXiv 2021, arXiv:2101.12249. [Google Scholar]
- Scarnati, T.; Lewis, B. Complex-Valued Neural Networks for Synthetic Aperture Radar Image Classification. In Proceedings of the 2021 IEEE Radar Conference (RadarConf21), Atlanta, GA, USA, 7–14 May 2021; Available online: https://ieeexplore.ieee.org/abstract/document/9455316/?casa_token=F63cfl1NzCgAAAAA:18YkTBEiAKDmNNPDf4NIH0eSZOjrXkID2fAgkl5oEv4QnoLMEAQ225RvKl1dX-p7Qg27ZqVJZ3Y (accessed on 11 May 2022).
- Li, H.; Zhang, B.; Chang, H.; Liang, X.; Gu, X. CVLNet: A Complex-Valued Lightweight Network for CSI Feedback. IEEE Wirel. Commun. Lett. 2022, 11, 1092–1096. Available online: https://ieeexplore.ieee.org/abstract/document/9729774/?casa_token=ApG_QdE1zwMAAAAA:vR2O8tqcbJ8FwzVQ1P_mVgAzjUNwT-59JrCRBtZ1m5Nz9GL2vk8juy2C2F9hiVNF3SWldhxPKEE (accessed on 11 May 2022). [CrossRef]
- Yang, X. Complex-Valued Neural Networks for Radar-Based Human-Motion Classification. Master’s Thesis, Delft University of Technology, Delft, The Netherlands, October 2021. Available online: https://repository.tudelft.nl/islandora/object/uuid:5cfd6c16-4db6-45c7-88d6-34acf44f8848 (accessed on 11 May 2022).
- Rawat, S.; Rana, K.P.S.; Kumar, V. A Novel Complex-Valued Convolutional Neural Network for Medical Image Denoising. Biomed. Signal Processing Control 2021, 69, 102859. Available online: https://www.sciencedirect.com/science/article/pii/S1746809421004560?casa_token=LWEcgE032bEAAAAA:1RBdXvE5BBl6_cz5K4sY-v_Ze9tiW3JWElHb8vUWXlYzStCBFlrftgSseS3hWD36QeNnbMSu2Q (accessed on 11 May 2022). [CrossRef]
- Qiu, Y.; Lin, Q.H.; Kuang, L.D.; Zhao, W.D.; Gong, X.F.; Cong, F.; Calhoun, V.D. Classification of Schizophrenia Patients and Healthy Controls Using ICA of Complex-Valued fMRI Data and Convolutional Neural Networks. In International Symposium on Neural Networks; Springer: Cham, Switzerland, 2019; Volume 11555 LNCS, pp. 540–547. [Google Scholar] [CrossRef]
- Yang, Z. Accurate computations of eigenvalues of quasi-Cauchy-Vandermonde matrices. Linear Algebra Its Appl. 2021, 622, 268–293. [Google Scholar] [CrossRef]
- Sultana, F.; Sufian, A.; Dutta, P. Advancements in image classification using convolutional neural network. In Proceedings of the 2018 4th IEEE International Conference on Research in Computational Intelligence and Communication Networks, Kolkata, India, 22–23 November 2018; pp. 122–129. [Google Scholar] [CrossRef] [Green Version]
- Majorkowska-Mech, D.; Cariow, A. Some FFT Algorithms for Small-Length Real-Valued Sequences. Appl. Sci. 2022, 12, 4700. [Google Scholar] [CrossRef]
- Jojoa Acosta, M.F.; Caballero Tovar, L.Y.; Garcia-Zapirain, M.B.; Percybrooks, W.S. Melanoma diagnosis using deep learning techniques on dermatoscopic images. BMC Med. Imaging 2021, 21, 6. [Google Scholar] [CrossRef] [PubMed]
- Hu, S.; Nagae, S.; Hirose, A. Millimeter-Wave Adaptive Glucose Concentration Estimation with Complex-Valued Neural Networks. IEEE Trans. Biomed. Eng. 2019, 66, 2065–2071. Available online: https://ieeexplore.ieee.org/abstract/document/8543624/?casa_token=hM_-c7RE0WMAAAAA:rbTsA3P2inS8Ll6OmDj5i2cPDm95EKoahOwTRT-m_SXQ7MNdumSGiIYJnwOFr5oXBh-wH4GYa1g (accessed on 11 May 2022). [CrossRef]
- Konishi, B.; Hirose, A.; Natsuaki, R. Complex-Valued Reservoir Computing for Interferometric sar Applications with Low Computational Cost and High Resolution. IEEE J. Sel. Top. Appl. Earth Obs. Remote Sens. 2021, 14, 7981–7993. Available online: https://ieeexplore.ieee.org/abstract/document/9508158/ (accessed on 11 May 2022). [CrossRef]
- Xiao, L.; Liu, Y.; Yi, Z.; Zhao, Y.; Xie, L.; Cao, P.; Leong, A.T.L.; Wu, E.X. Partial Fourier reconstruction of complex MR images using complex-valued convolutional neural networks. Wiley Online Libr. 2022, 87, 999–1014. [Google Scholar] [CrossRef]
- Duan, C.; Xiong, Y.; Cheng, K.; Xiao, S.; Lyu, J.; Wang, C.; Bian, X.; Zhang, J.; Zhang, D.; Chen, L.; et al. Accelerating susceptibility-weighted imaging with deep learning by complex-valued convolutional neural network (ComplexNet): Validation in clinical brain imaging. Eur. Radiol. 2022, 32, 5679–5687. [Google Scholar] [CrossRef] [PubMed]
- Vasudeva, B.; Deora, P.; Bhattacharya, S.; Pradhan, P.M. Compressed Sensing MRI Reconstruction with Co-VeGAN: Complex-Valued Generative Adversarial Network. Available online: https://github.com/estija/Co-VeGAN (accessed on 10 May 2022).
- Lin, Q.-H.; Niu, Y.-W.; Sui, J.; Zhao, W.-D.; Zhuo, C.; Calhoun, V.D. SSPNet: An interpretable 3D-CNN for classification of schizophrenia using phase maps of resting-state complex-valued fMRI data. Med. Image Anal. 2022, 79, 102430. [Google Scholar] [CrossRef]
- Cassidy, B.; Kendrick, C.; Brodzicki, A.; Jaworek-Korjakowska, J.; Yap, M.H. Analysis of the ISIC image datasets: Usage, benchmarks and recommendations. Med. Image Anal. 2022, 75, 102305. [Google Scholar] [CrossRef] [PubMed]
- Janiesch, C.; Zschech, P.; Heinrich, K. Machine learning and deep learning. Electron. Mark. 2021, 31, 685–695. [Google Scholar] [CrossRef]
- Yilmaz, A.; Samoylenko, Y. Benchmarking of Lightweight Deep Learning Architectures for Skin Cancer Classification using ISIC 2017 Dataset 4 rd Mehmet Erhan Guvenilir 5 th Huseyin Uvet. arXiv 2021, arXiv:2110.12270. [Google Scholar]
- Duarte, A.F.; Sousa-Pinto, B.; Azevedo, L.F.; Barros, A.M.; Puig, S.; Malvehy, J.; Haneke, E.; Correia, O. Clinical ABCDE rule for early melanoma detection. Eur. J. Dermatol. 2021, 31, 771–778. [Google Scholar] [CrossRef] [PubMed]
- Javed, R.; Rahim, M.S.M.; Saba, T.; Rehman, A. A comparative study of features selection for skin lesion detection from dermoscopic images. Netw. Modeling Anal. Health Inform. Bioinform. 2020, 9, 1–13. [Google Scholar] [CrossRef]
- ADDI—Automatic Computer-Based Diagnosis System for Dermoscopy Images. Available online: https://www.fc.up.pt/addi/ph2%20database.html (accessed on 10 May 2022).
- Announcing the PASCAL Heart Sounds Challenge|Knowledge 4 All Foundation Ltd. Available online: https://www.k4all.org/2011/11/announcing-the-pascal-heart-sounds-challenge/ (accessed on 10 May 2022).
- Gelpud, J.; Castillo, S.; Jojoa, M.; Garcia-Zapirain, B.; Achicanoy, W.; Rodrigo, D. Deep Learning for Heart Sounds Classification Using Scalograms and Automatic Segmentation of PCG Signals. In Proceedings of the International Work-Conference on Artificial Neural Networks, Virtual, 16–18 June 2021; Springer: Berlin, Germany, 2021; Volume 12861 LNCS, pp. 583–596. [Google Scholar] [CrossRef]
- Panagakis, Y.; Kossaifi, J.; Chrysos, G.G.; Oldfield, J.; Nicolaou, M.A.; Anandkumar, A.; Zafeiriou, S. Tensor Methods in Computer Vision and Deep Learning. Proc. IEEE 2021, 109, 863–890. [Google Scholar] [CrossRef]
- Ghosh, P.; Samanta, T.K. Introduction of frame in tensor product of n-Hilbert spaces. Sahand Commun. Math. Anal. (SCMA) 2021, 18, 1–18. [Google Scholar] [CrossRef]
- Kumar, R.L.; Kakarla, J.; Isunuri, B.V.; Singh, M. Multi-class brain tumor classification using residual network and global average pooling. Multimed. Tools Appl. 2021, 80, 13429–13438. [Google Scholar] [CrossRef]
- Wieczorek, J.; Guerin, C.; McMahon, T. K-fold cross-validation for complex sample surveys. Stat 2022, 11, e454. [Google Scholar] [CrossRef]
- Alberto, R.; Turcios, S. T-Student. Usos y Abusos. Available online: http://www.medigraphic.com/revmexcardiolwww.medigraphic.org.mx (accessed on 10 May 2022).
- Royston, P. Approximating the Shapiro-Wilk W-test for non-normality. Stat. Comput. 1992, 2, 117–119. [Google Scholar] [CrossRef]
- Sarroff, A. Complex Neural Networks for Audio. Ph.D. Thesis, Dartmouth College, Hanover, NH, USA, May 2018. Available online: https://digitalcommons.dartmouth.edu/dissertations/55 (accessed on 10 May 2022).
- Liang, Y.; Li, S.; Yan, C.; Li, M.; Jiang, C. Explaining the black-box model: A survey of local interpretation methods for deep neural networks. Neurocomputing 2021, 419, 168–182. [Google Scholar] [CrossRef]
- Torrey, L.; Shavlik, J.; Walker, T.; Maclin, R. Transfer learning via advice taking. In Advances in Machine Learning I; Springer: Berlin, Heidelberg, Germany, 2010; pp. 147–170. [Google Scholar]
- Morid, M.A.; Borjali, A.; Del Fiol, G. A scoping review of transfer learning research on medical image analysis using ImageNet. Comput. Biol. Med. 2020, 128, 104115. [Google Scholar] [CrossRef] [PubMed]
- Hirose, A. Complex-Valued Neural Networks: Advances and Applications. 2013. Available online: https://books.google.es/books?hl=es&lr=&id=B2_bucoS5VAC&oi=fnd&pg=PT9&dq=%22complex+valued%22+neural+networks&ots=eEa59A3_wd&sig=DE3O32HHFTDFaX6cPQhOuOWpPso (accessed on 10 May 2022).
- Zhang, Z. Improved Adam Optimizer for Deep Neural Networks. In Proceedings of the 2018 IEEE/ACM 26th International Symposium on Quality of Service (IWQoS), Banff, AB, Canada, 4–6 June 2018; Available online: https://ieeexplore.ieee.org/abstract/document/8624183/?casa_token=SbIs-d5YkaYAAAAA:0Co3zjd612nfwW3cmtbKM7Tz-txYp0p_ZM8×20JfrVJ4BhMAZK1fAQy_PePCW4fbCQcWnPDiJSU (accessed on 10 May 2022).


| Authors | Dataset Used | Task | Methods | Results |
|---|---|---|---|---|
| Yue Qi, Qiu Hua Lin, Li Dan Kuang, Wen Da Zhao, Xiao Feng Gong, Fengyu Cong, Vince D. Calhoun [8] | Used 82 resting-state complex-valued fMRI datasets, including 42 SZs and 40 HCs | Classifying schizophrenia patients (SZs) and healthy controls (HCs) | This study proposes a novel framework combining independent component analysis (ICA) and complex-valued convolutional neural networks (CVDL). ICA is first used to obtain components of interest that have been previously implicated in schizophrenia. |
|
| Shizhen Hu, Seko Nagae, Akira Hirose [13] | They prepared 7 different concentration samples and measured 30 times for each sample | Glucose concentration estimation | In this paper, an adaptive glucose concentration estimation system is proposed. The system estimates glucose concentration values non-invasively by making full use of transmission magnitude and phase data. The 60–80 GHz frequency band millimeter wave is chosen, and a single output neuron complex-valued neural network (CVNN) is built for adaptive concentration estimation. |
|
| Joshua Bassey, Xiangfang Li, Lijun Qian [3] | Used 167 publications | Discuss the recent development of CVNNs | A detailed review of various CVNNs in terms of activation function, learning and optimization, input and output representations, and their applications in tasks such as signal processing and computer vision are provided, followed by a discussion on some pertinent challenges and future research directions. | Complex-valued neural networks, compared to their real-valued counterparts, are still considered an emerging field and require more attention and action from the deep learning and signal processing research community. |
| Yang Ximei [6] | A total of 5 radar data pre-processing approaches were implemented to generate dataset samples, including FFT and STFT | Human-motion classification based on monostatic radar | This thesis proposes three complex-valued convolutional neural networks (CNNs) for human-motion classification based on monostatic radar. The range-time, range-Doppler, range-spectrum-time, and time-frequency spectrograms of micro-Doppler signatures are adopted as the input to CVNNs with different plural-handled approaches. A series of experiments determine the optimal approach and data format that achieves the highest classification accuracy. |
|
| Shubhankar Rawat, K.P.S. Rana, Vineet Kumar [7] | A total of 5232 CXR images from 5856 patients aged 1 to 5 years from Guangzhou Women and Children’s Medical Center, Guangzhou, Guangdong province (China). For this work, out of the 5232 images, only 500 images were considered for MID experimentations, which were randomly selected | Investigate a novel complex-valued convolutional neural network-based model, termed CVMIDNet, for medical image denoising | The model uses residual learning, which learns noise from noisy images and then subtracts it from noisy images so as to obtain clean images. To assess the denoising performance of CVMIDNet, standard image quality metrics, namely, peak signal to noise ratio and the structural similarity index, have been used for 5 different additive white Gaussian noise levels in chest X-ray images. Chest X-ray denoising performance of CVMIDNet was compared with 4 recent state-of-the-art models, namely, BlockMatching and 3D (BM3D) filtering, DnCNN, and Feature-guided Denoising Convolutional Neural Network. (FDCNN), and deep CNN with residual learning. | CVMIDNet was found to be superior. For instance, for a Gaussian noise level of σ = 15, the peak signal-to-noise ratio and structural similarity index values achieved by the CVMIDNet are 37.2010 and 0.9227, respectively, against the 36.2292 and 0.9086, 36.3203 and 0.9139, 35.0995 and 0.9005, 36.1830 and 0.8968, 34.2436 and 0.8874 achieved by BM3D filtering, DnCNN, RVMIDNet, FDCNN, and deep CNN with residual learning, respectively. |
| Theresa Scarnati, Benjamin Lewis [4] | SAMPLE dataset includes 10 classes with equal numbers of measured and synthetic SARimages: 1366 measured and 1366 synthetic. Total: 2732 | They present a survey of several complex neural network techniques as applied to a SAR dataset consisting of military targets | Specifically, they evaluate a multi-channel approach with Deep Complex Networks and SurReal against (i) limited training data and (ii) when the training and testing data exhibit a domain mismatch. |
|
| Bungo Konishi, Akira Hirose, Ryo Natsuaki [14] | An interferogram around Mt. Fuji observed on 25 November 2010 and 12 April 2011. An interferogram around Shinmoe-dake observed on 14 April 2009 and 30 May 2009 | In this paper, they propose complex-valued reservoir computing (CVRC) to deal with complex-valued images in interferometric synthetic aperture radar (InSAR) | They classify InSAR image data by using CVRC successfully with a higher resolution and a lower computational cost, i.e., one hundredth learning time and one-fifth classification time than convolutional neural networks. | CVRC is found applicable to quantitative tasks dealing with continuous values as well as discrete classification tasks with higher accuracy. |
| Linfang Xiao, Yilong Liu, Zheyuan Yi, Yujiao Zhao, Linshan Xie, Peibei Cao, Alex T L Leong, Ed X Wu [15] | T1w GRE axial brain dataset: 57 and 10 subjects with 200 axial slices extracted from each subject were used for training and testing, respectively | To provide a complex-valued deep learning approach for partial Fourier (PF) reconstruction of complex MR images | They propose a complex-valued deep learning approach with an unrolled network architecture for PF reconstruction that iteratively reconstructs OF sampled data and enforces data consistency. They evaluate their approach for reconstructing both spin-echo and gradient-echo data. They compared the proposed deep learning PF (DL-PF) method to the conventional POCS-PF method. | The proposed method outperformed the iterative POCS PF reconstruction method. It produced better artifact suppression and recovery of both image magnitude and phase details in the presence of local phase changes. Moreover, the network trained on axial brain data could reconstruct sagittal and coronal brain and knee data. |
| Duan C, Xiong Y, Cheng K, Xiao S, Lyu J, Wang C, Bian X, Zhang J, Zhang D, Chen L, Zhou X, Lou X [16] | SWI data were acquired from 117 participants who underwent clinical brain MRI examinations between 2019 and 2021, including patients with tumor, stroke, hemorrhage, traumatic brain injury, etc. | Propose a deep learning model to accelerate susceptibility-weighted imaging (SWI) acquisition times and evaluate the clinical feasibility of this approach | A complex-valued convolutional neural network (ComplexNet) was developed to reconstruct high-quality SWI from highly accelerated k-space data. ComplexNet can leverage the inherently complex-valued nature of SWI data and learn richer representations by using complex-valued networks. | The average reconstruction time of ComplexNet was 19 ms per section (1.33 s per participant). ComplexNet achieved significantly improved quantitative image metrics compared to a conventional compressed sensing method and a real-valued network with acceleration rates of 5 and 8 (p < 0.001). ComplexNet showed comparable diagnostic performance to the fully sampled SWI for visualizing a wide range of pathology, including hemorrhage, cerebral microbleeds, and brain tumors. |
| Haozhen Li, Boyuan Zhang, Haoran Chang, Xin Liang, Xinyu Gu [5] | CSI dataset generated by COST2100 channel model is used. The training, validation, and testing sets contain 100,000, 30,000, and 20,000 samples, respectively | They present a complex-valued lightweight neural network for channel state information (CSI) feedback named CVLNet | The CVLNet adopts the complex-valued neural network components in a multi-scale feature augmentation encoder and a multi-resolution X-shaped reconstruction decoder with a series of lightweight details. | The experiment results show that the proposed CVLNet maintains the same-level parameters of the encoder with state-of-the-art (SOTA) lightweight networks while outperforming them with at most a 33.4% improvement in accuracy under severe compression rates. |
| Name of the Database | Normal Data | Abnormal Data | Data Type | Associated Illness |
|---|---|---|---|---|
| ISIC2017 | 1621 | 374 | Dermatoscopy image | Melanoma |
| PH2 | 160 | 40 | Dermatoscopy image | Melanoma |
| PASCAL | 320 | 141 | Sounds/Scalogram | Heart murmurs |
| Structure/Database | ISIC2017 | PH2 | PASCAL |
|---|---|---|---|
| Complex-valued structure | Accuracy, F1 Score, Precision, Recall, Sensitivity, Specificity | ibidem | Ibidem |
| Real-valued structure | ibidem | ibidem | Ibidem |
| Hyperparameter | Complex-Valued | Real-Valued |
|---|---|---|
| Activation function | Complex Relu | Relu |
| Learning Rate | 0.001 | 0.001 |
| Optimizer | ADAM with Complex Correction | ADAM |
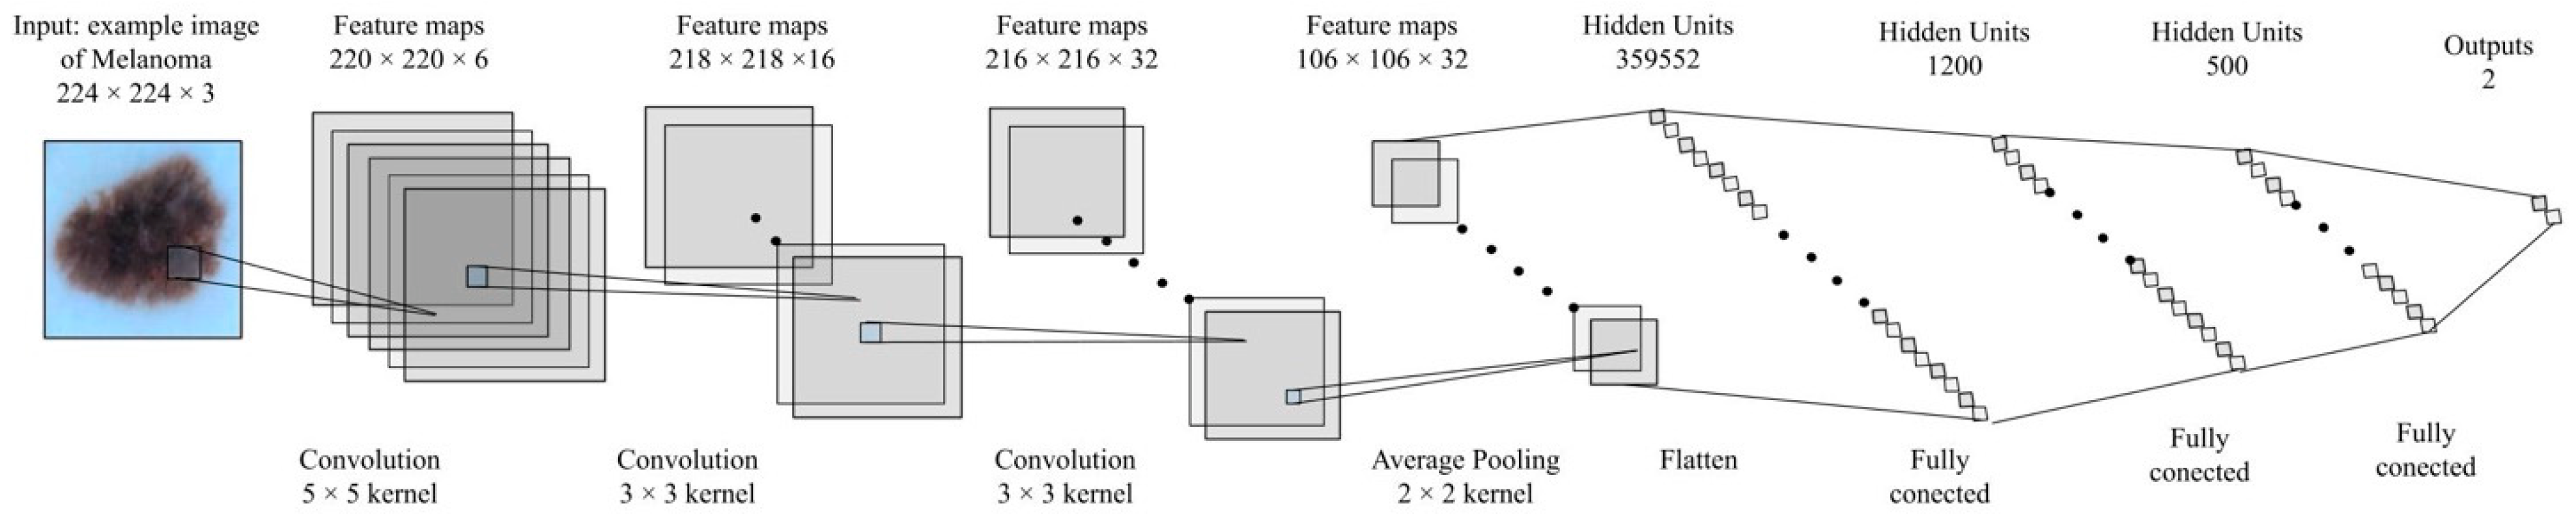
| Layer | Amount of Parameters Complex-Valued | Amount of Parameters Real-Valued |
|---|---|---|
| Conv1 | 71,940 | 290,400 |
| Conv2 | 186,608 | 285,144 |
| Conv3 | 725,760 | 1,492,992 |
| Fully Connected 1 | 169,600 | 359,552 |
| Fully Connected 2 | 1200 | 1200 |
| Fully Connected 3 | 500 | 500 |
| Output | 2 | 2 |
| Structure/Metric | Fold | F1 Score | Precision | Recall/Sensitivity | Accuracy | Specificity |
|---|---|---|---|---|---|---|
| Complex-Valued Convolution Neural Networks | 1 | 0.90410 | 0.89411 | 0.914328 | 0.77889 | 0.73888 |
| 2 | 0.91490 | 0.90734 | 0.922586 | 0.76382 | 0.74650 | |
| 3 | 0.93140 | 0.93938 | 0.923584 | 0.79899 | 0.75860 | |
| 4 | 0.91270 | 0.91895 | 0.906528 | 0.80402 | 0.73957 | |
| 5 | 0.92270 | 0.94316 | 0.903088 | 0.79397 | 0.78863 | |
| 6 | 0.93140 | 0.93279 | 0.930083 | 0.79397 | 0.74694 | |
| 7 | 0.89580 | 0.89813 | 0.893478 | 0.77387 | 0.75531 | |
| 8 | 0.90550 | 0.92049 | 0.890943 | 0.76884 | 0.75336 | |
| 9 | 0.91700 | 0.90336 | 0.931074 | 0.80402 | 0.74156 | |
| 10 | 0.93320 | 0.94119 | 0.925291 | 0.82412 | 0.76313 | |
| Max Complex | 0.93320 | 0.94316 | 0.931074 | 0.93107 | 0.78863 | |
| Min Complex | 0.89580 | 0.89411 | 0.890943 | 0.89094 | 0.73888 | |
| Mean Complex | 0.91690 | 0.91989 | 0.914098 | 0.91409 | 0.75325 | |
| Normality Test/p-value | 0.55702 | 0.28137 | 0.09199 | 0.70872 | 0.21898 | |
| Structure/Metric | Fold | F1 Score | Precision | Recall/Sensitivity | Accuracy | Specificity |
|---|---|---|---|---|---|---|
| Real-Valued Convolution Neural Networks | 1 | 0.86960 | 0.86078 | 0.87854 | 0.66834 | 0.66298 |
| 2 | 0.88730 | 0.90188 | 0.87316 | 0.69347 | 0.66127 | |
| 3 | 0.87180 | 0.86158 | 0.88229 | 0.67337 | 0.64810 | |
| 4 | 0.86750 | 0.86807 | 0.86694 | 0.73869 | 0.67762 | |
| 5 | 0.88280 | 0.90251 | 0.86399 | 0.68342 | 0.63900 | |
| 6 | 0.87890 | 0.87545 | 0.88247 | 0.68342 | 0.63624 | |
| 7 | 0.87910 | 0.87691 | 0.88128 | 0.66332 | 0.67711 | |
| 8 | 0.86120 | 0.87116 | 0.85153 | 0.69849 | 0.67995 | |
| 9 | 0.87420 | 0.88535 | 0.86323 | 0.66834 | 0.67312 | |
| 10 | 0.88780 | 0.88409 | 0.89156 | 0.65829 | 0.67185 | |
| Max | 0.88780 | 0.90251 | 0.89156 | 0.73869 | 0.67995 | |
| Min | 0.86120 | 0.86078 | 0.85153 | 0.65829 | 0.63624 | |
| Mean | 0.87600 | 0.87878 | 0.87350 | 0.68291 | 0.66272 | |
| Normality Test/p-value | 0.10060 | 0.32868 | 0.77467 | 0.07353 | 0.11563 | |
| Metric | Student’s t-Test Comparison of Means—p-Value |
|---|---|
| F1 Score | 0.00001 |
| Precision | 0.00004 |
| Recall | 0.00002 |
| Accuracy | 0.00001 |
| Specificity | 0.00001 |
| Structure/Metric | Fold | F1 Score | Precision | Recall/Sensitivity | Accuracy | Specificity |
|---|---|---|---|---|---|---|
| Complex-Valued Convolution Neural Networks | 1 | 0.90909 | 0.93750 | 0.88235 | 0.88235 | 0.66667 |
| 2 | 0.90909 | 0.93750 | 0.88235 | 0.88235 | 0.66667 | |
| 3 | 0.86667 | 0.92857 | 0.81250 | 0.81250 | 0.75000 | |
| 4 | 0.87500 | 0.93333 | 0.82353 | 0.82353 | 0.66667 | |
| 5 | 0.84615 | 0.91667 | 0.78571 | 0.78571 | 0.83333 | |
| 6 | 0.89655 | 0.92857 | 0.86667 | 0.86667 | 0.80000 | |
| 7 | 0.90323 | 0.93333 | 0.87500 | 0.87500 | 0.75000 | |
| 8 | 0.91429 | 0.94118 | 0.88889 | 0.88889 | 0.50000 | |
| 9 | 0.86667 | 0.92857 | 0.81250 | 0.81250 | 0.75000 | |
| 10 | 0.88889 | 0.92308 | 0.85714 | 0.85714 | 0.83333 | |
| Max Complex | 0.91429 | 0.94118 | 0.88889 | 0.85000 | 0.83333 | |
| Min Complex | 0.84615 | 0.91667 | 0.78571 | 0.80000 | 0.50000 | |
| Mean Complex | 0.88756 | 0.93083 | 0.84866 | 0.83000 | 0.72167 | |
| Normality Test/p-value | 0.71070 | 0.14828 | 0.36900 | 0.00017 | 0.14913 | |
| Structure/Metric | Fold | F1 Score | Precision | Recall/Sensitivity | Accuracy | Specificity |
|---|---|---|---|---|---|---|
| Real-Valued Convolution Neural Networks | 1 | 0.81818 | 0.90000 | 0.75000 | 0.80000 | 0.87500 |
| 2 | 0.82353 | 0.87500 | 0.77778 | 0.70000 | 0.00000 | |
| 3 | 0.81250 | 0.86667 | 0.76471 | 0.70000 | 0.33333 | |
| 4 | 0.81250 | 0.86667 | 0.76471 | 0.70000 | 0.33333 | |
| 5 | 0.76923 | 0.83333 | 0.71429 | 0.70000 | 0.66667 | |
| 6 | 0.81250 | 0.86667 | 0.76471 | 0.70000 | 0.33333 | |
| 7 | 0.81250 | 0.86667 | 0.76471 | 0.70000 | 0.33333 | |
| 8 | 0.80000 | 0.85714 | 0.75000 | 0.70000 | 0.50000 | |
| 9 | 0.78571 | 0.84615 | 0.73333 | 0.70000 | 0.60000 | |
| 10 | 0.81250 | 0.86667 | 0.76471 | 0.70000 | 0.33333 | |
| Max | 0.82353 | 0.90000 | 0.77778 | 0.80000 | 0.87500 | |
| Min | 0.76923 | 0.83333 | 0.71429 | 0.70000 | 0.00000 | |
| Mean | 0.80592 | 0.86450 | 0.75489 | 0.71000 | 0.43083 | |
| Normality Test/p-value | 0.21406 | 0.05052 | 0.15922 | 0.00001 | 0.31439 | |
| Metric | Student’s t-Test Comparison of Means—p-Value |
|---|---|
| F1 Score | 7.71763 × 10⁸ |
| Precision | 1.13570 × 10⁷ |
| Recall | 6.08852 × 10⁶ |
| Specificity | 4.11085 × 10³ |
| Structure/Metric | Fold | F1 Score | Precision | Recall/Sensitivity | Accuracy | Specificity |
|---|---|---|---|---|---|---|
| Complex-Valued Convolution Neural Networks | 1 | 0.82540 | 0.89655 | 0.76471 | 0.76596 | 0.76923 |
| 2 | 0.87273 | 0.92308 | 0.82759 | 0.84783 | 0.88235 | |
| 3 | 0.80702 | 0.88462 | 0.74194 | 0.76087 | 0.80000 | |
| 4 | 0.88889 | 0.92308 | 0.85714 | 0.86957 | 0.88889 | |
| 5 | 0.81967 | 0.89286 | 0.75758 | 0.76087 | 0.76923 | |
| 6 | 0.84211 | 0.88889 | 0.80000 | 0.80435 | 0.81250 | |
| 7 | 0.83582 | 0.90323 | 0.77778 | 0.76087 | 0.70000 | |
| 8 | 0.86792 | 0.92000 | 0.82143 | 0.84783 | 0.88889 | |
| 9 | 0.83077 | 0.90000 | 0.77143 | 0.76087 | 0.72727 | |
| 10 | 0.83582 | 0.90323 | 0.77778 | 0.76087 | 0.70000 | |
| Max Complex | 0.88889 | 0.92308 | 0.85714 | 0.86957 | 0.88889 | |
| Min Complex | 0.80702 | 0.88462 | 0.74194 | 0.76087 | 0.70000 | |
| Mean Complex | 0.84261 | 0.90355 | 0.78974 | 0.79399 | 0.79384 | |
| Normality Test/p-value | 0.22495 | 0.58013 | 0.48847 | 0.00280 | 0.18135 | |
| Structure/Metric | Fold | F1 Score | Precision | Recall/Sensitivity | Accuracy | Specificity |
|---|---|---|---|---|---|---|
| Real-Valued Convolution Neural Networks | 1 | 0.74510 | 0.82609 | 0.67857 | 0.72340 | 0.78947 |
| 2 | 0.76923 | 0.83333 | 0.71429 | 0.73913 | 0.77778 | |
| 3 | 0.76667 | 0.85185 | 0.69697 | 0.69565 | 0.69231 | |
| 4 | 0.78788 | 0.83871 | 0.74286 | 0.69565 | 0.54545 | |
| 5 | 0.75862 | 0.84615 | 0.68750 | 0.69565 | 0.71429 | |
| 6 | 0.75000 | 0.82759 | 0.68571 | 0.65217 | 0.54545 | |
| 7 | 0.80702 | 0.85185 | 0.76667 | 0.76087 | 0.75000 | |
| 8 | 0.76471 | 0.83871 | 0.70270 | 0.65217 | 0.44444 | |
| 9 | 0.77966 | 0.85185 | 0.71875 | 0.71739 | 0.71429 | |
| 10 | 0.80702 | 0.85185 | 0.76667 | 0.76087 | 0.75000 | |
| Max | 0.80702 | 0.85185 | 0.76667 | 0.76087 | 0.78947 | |
| Min | 0.74510 | 0.82609 | 0.67857 | 0.65217 | 0.44444 | |
| Mean | 0.77359 | 0.84180 | 0.71607 | 0.70930 | 0.67235 | |
| Normality Test/p-value | 0.06181 | 0.17432 | 0.41637 | 0.36105 | 0.05332 | |
| Metric | Student’s t-Test Mean Comparative |
|---|---|
| F1 Score | 4.0131 × 10⁹ |
| Precision | 1.4683 × 10⁴ |
| Recall | 5.0077 × 10⁶ |
| Specificity | 0.01450 |
| Metric | Dataset | Test Executed | p-Value |
|---|---|---|---|
| Accuracy | PH2 | U | 0.00134 |
| Accuracy | Pascal | U | 0.02377 |
Publisher’s Note: MDPI stays neutral with regard to jurisdictional claims in published maps and institutional affiliations. |
© 2022 by the authors. Licensee MDPI, Basel, Switzerland. This article is an open access article distributed under the terms and conditions of the Creative Commons Attribution (CC BY) license (https://creativecommons.org/licenses/by/4.0/).
Share and Cite
Jojoa, M.; Garcia-Zapirain, B.; Percybrooks, W. A Fair Performance Comparison between Complex-Valued and Real-Valued Neural Networks for Disease Detection. Diagnostics 2022, 12, 1893. https://doi.org/10.3390/diagnostics12081893
Jojoa M, Garcia-Zapirain B, Percybrooks W. A Fair Performance Comparison between Complex-Valued and Real-Valued Neural Networks for Disease Detection. Diagnostics. 2022; 12(8):1893. https://doi.org/10.3390/diagnostics12081893
Chicago/Turabian StyleJojoa, Mario, Begonya Garcia-Zapirain, and Winston Percybrooks. 2022. "A Fair Performance Comparison between Complex-Valued and Real-Valued Neural Networks for Disease Detection" Diagnostics 12, no. 8: 1893. https://doi.org/10.3390/diagnostics12081893
APA StyleJojoa, M., Garcia-Zapirain, B., & Percybrooks, W. (2022). A Fair Performance Comparison between Complex-Valued and Real-Valued Neural Networks for Disease Detection. Diagnostics, 12(8), 1893. https://doi.org/10.3390/diagnostics12081893