
Morphological Biomarkers in the Amygdala and Hippocampus of Children and Adults at High Familial Risk for Depression

 ,
,
Abstract
:1. Introduction
2. Materials and Methods
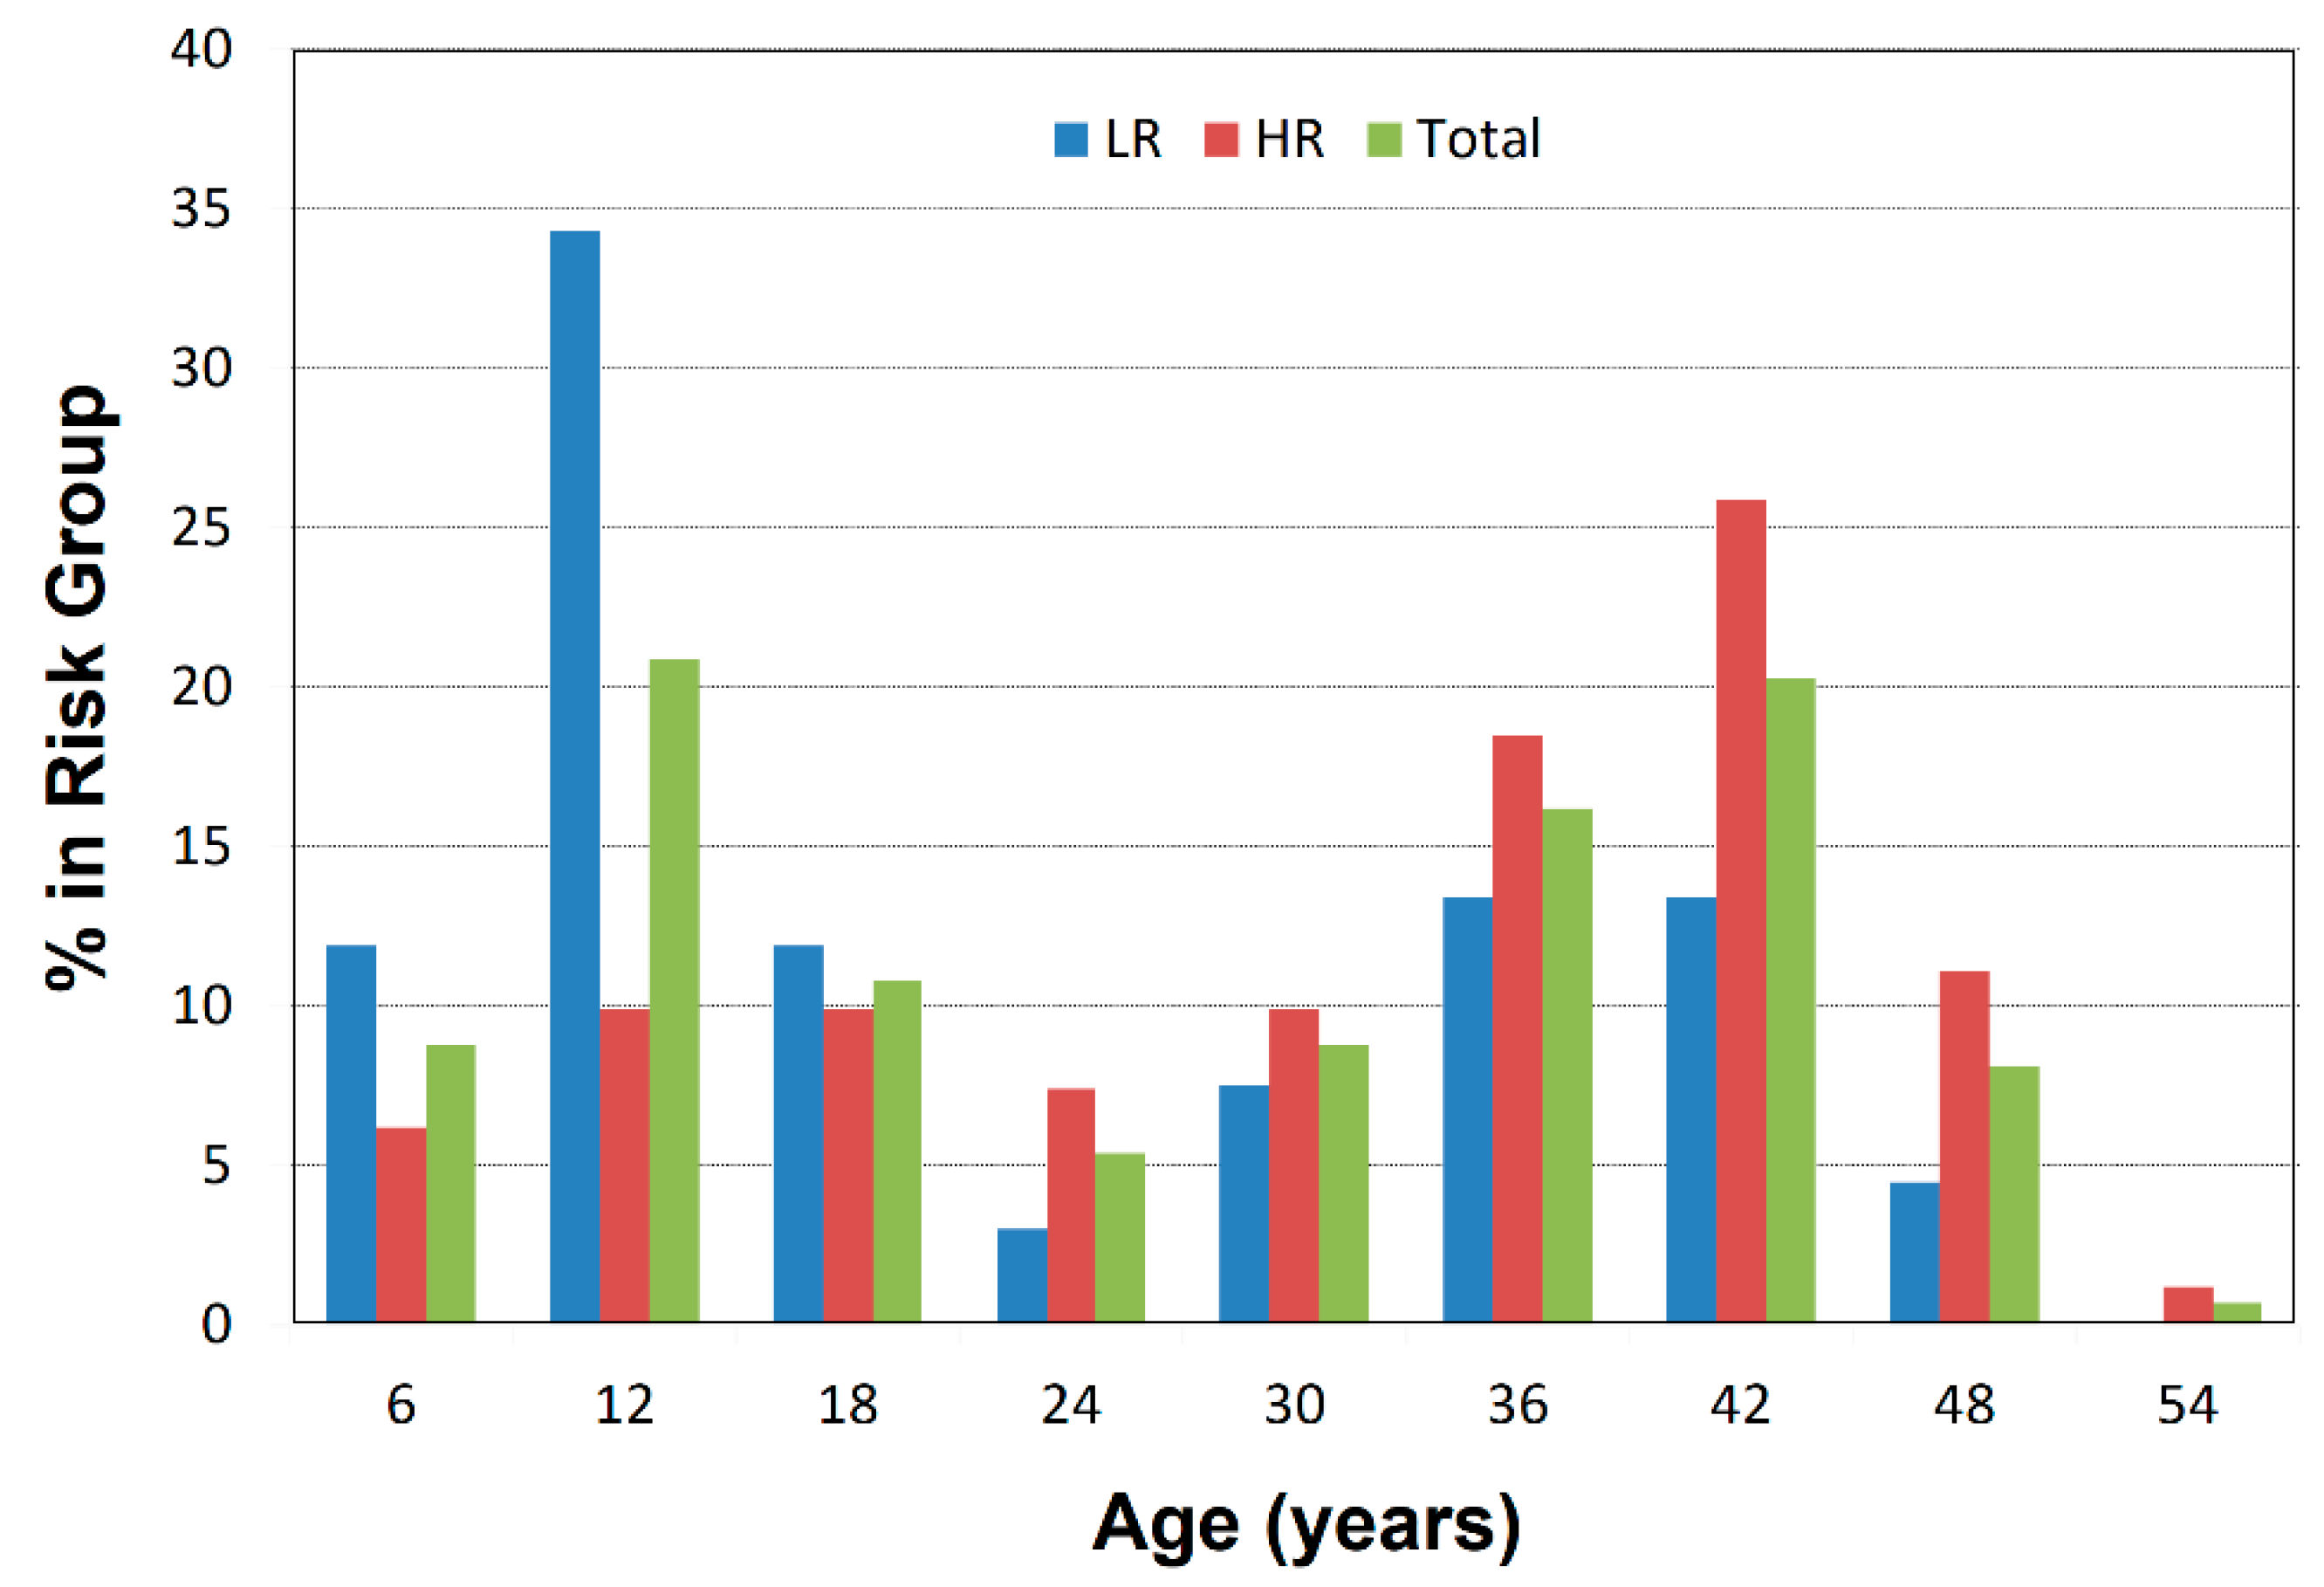
2.1. Participant Characterization
2.2. MRI Scanning
2.3. Image Processing
2.4. Deformation-Based Surface Analyses
2.4.1. The Template Brain
2.4.2. Index for Right-Hemisphere Cortical Thinning
2.5. Statistical Analyses
2.5.1. Conventional Volumes
2.5.2. Surface Morphometry
2.5.3. Correction for Multiple Comparisons
3. Results
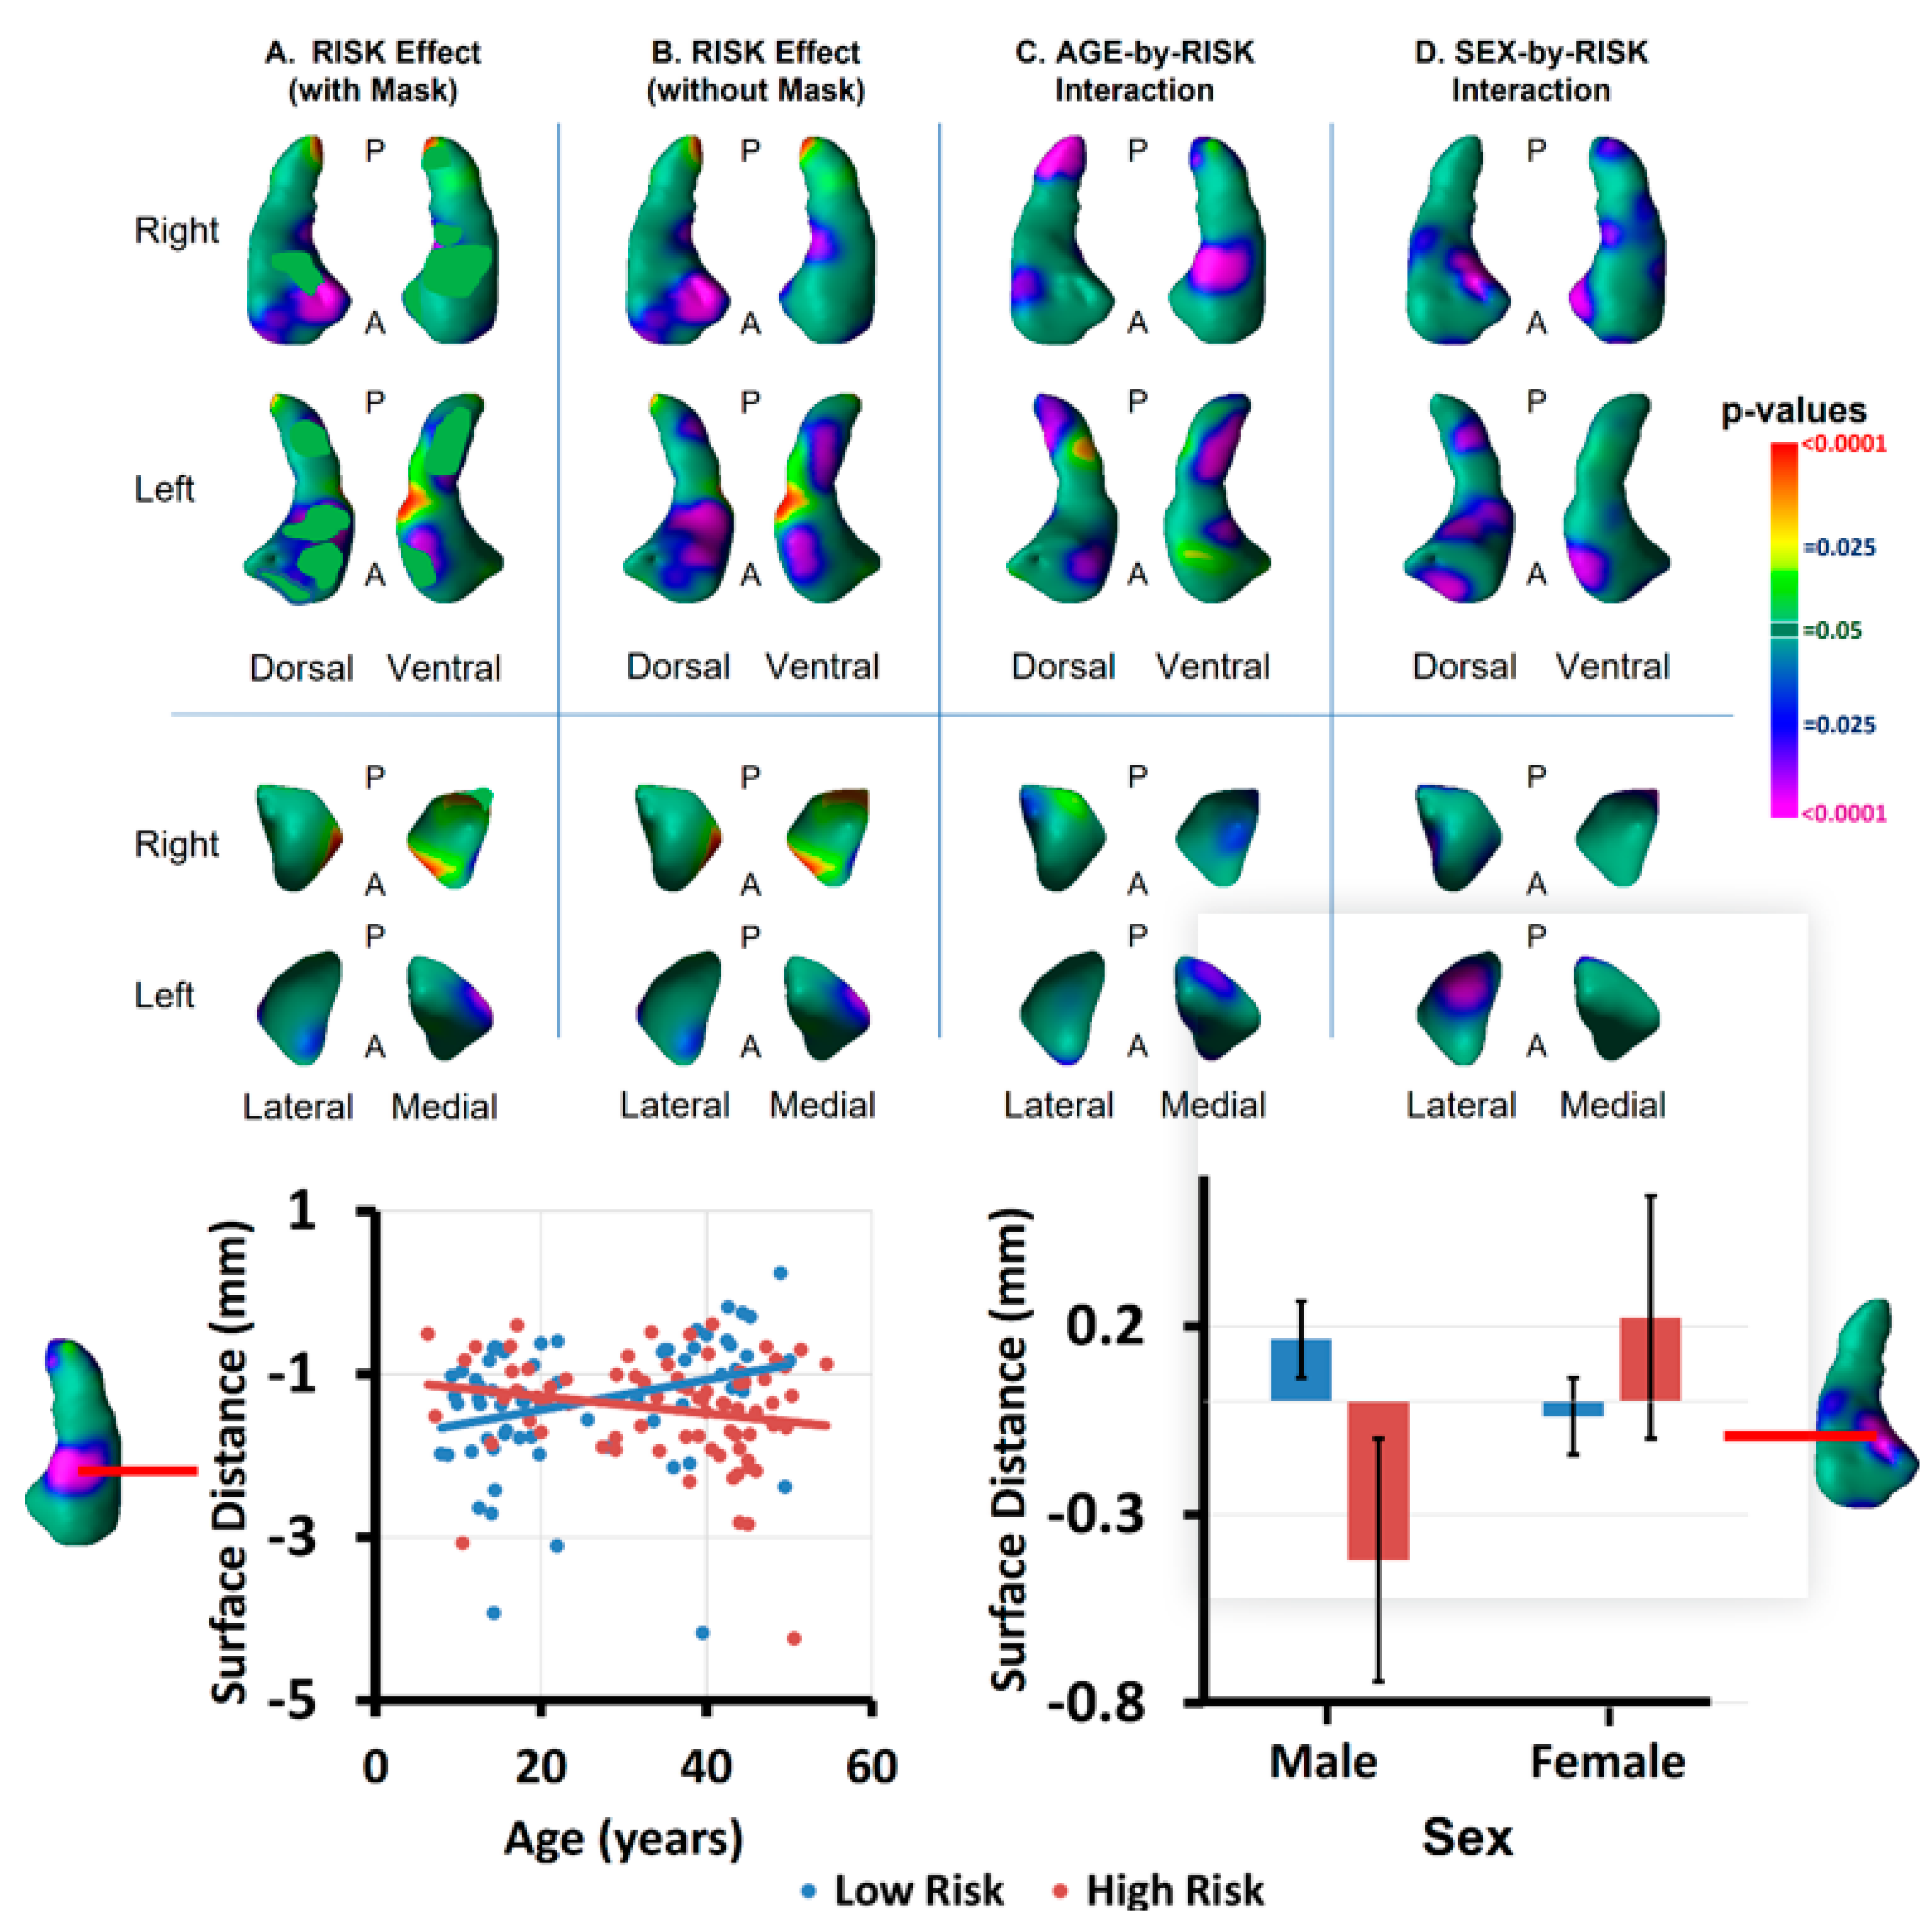
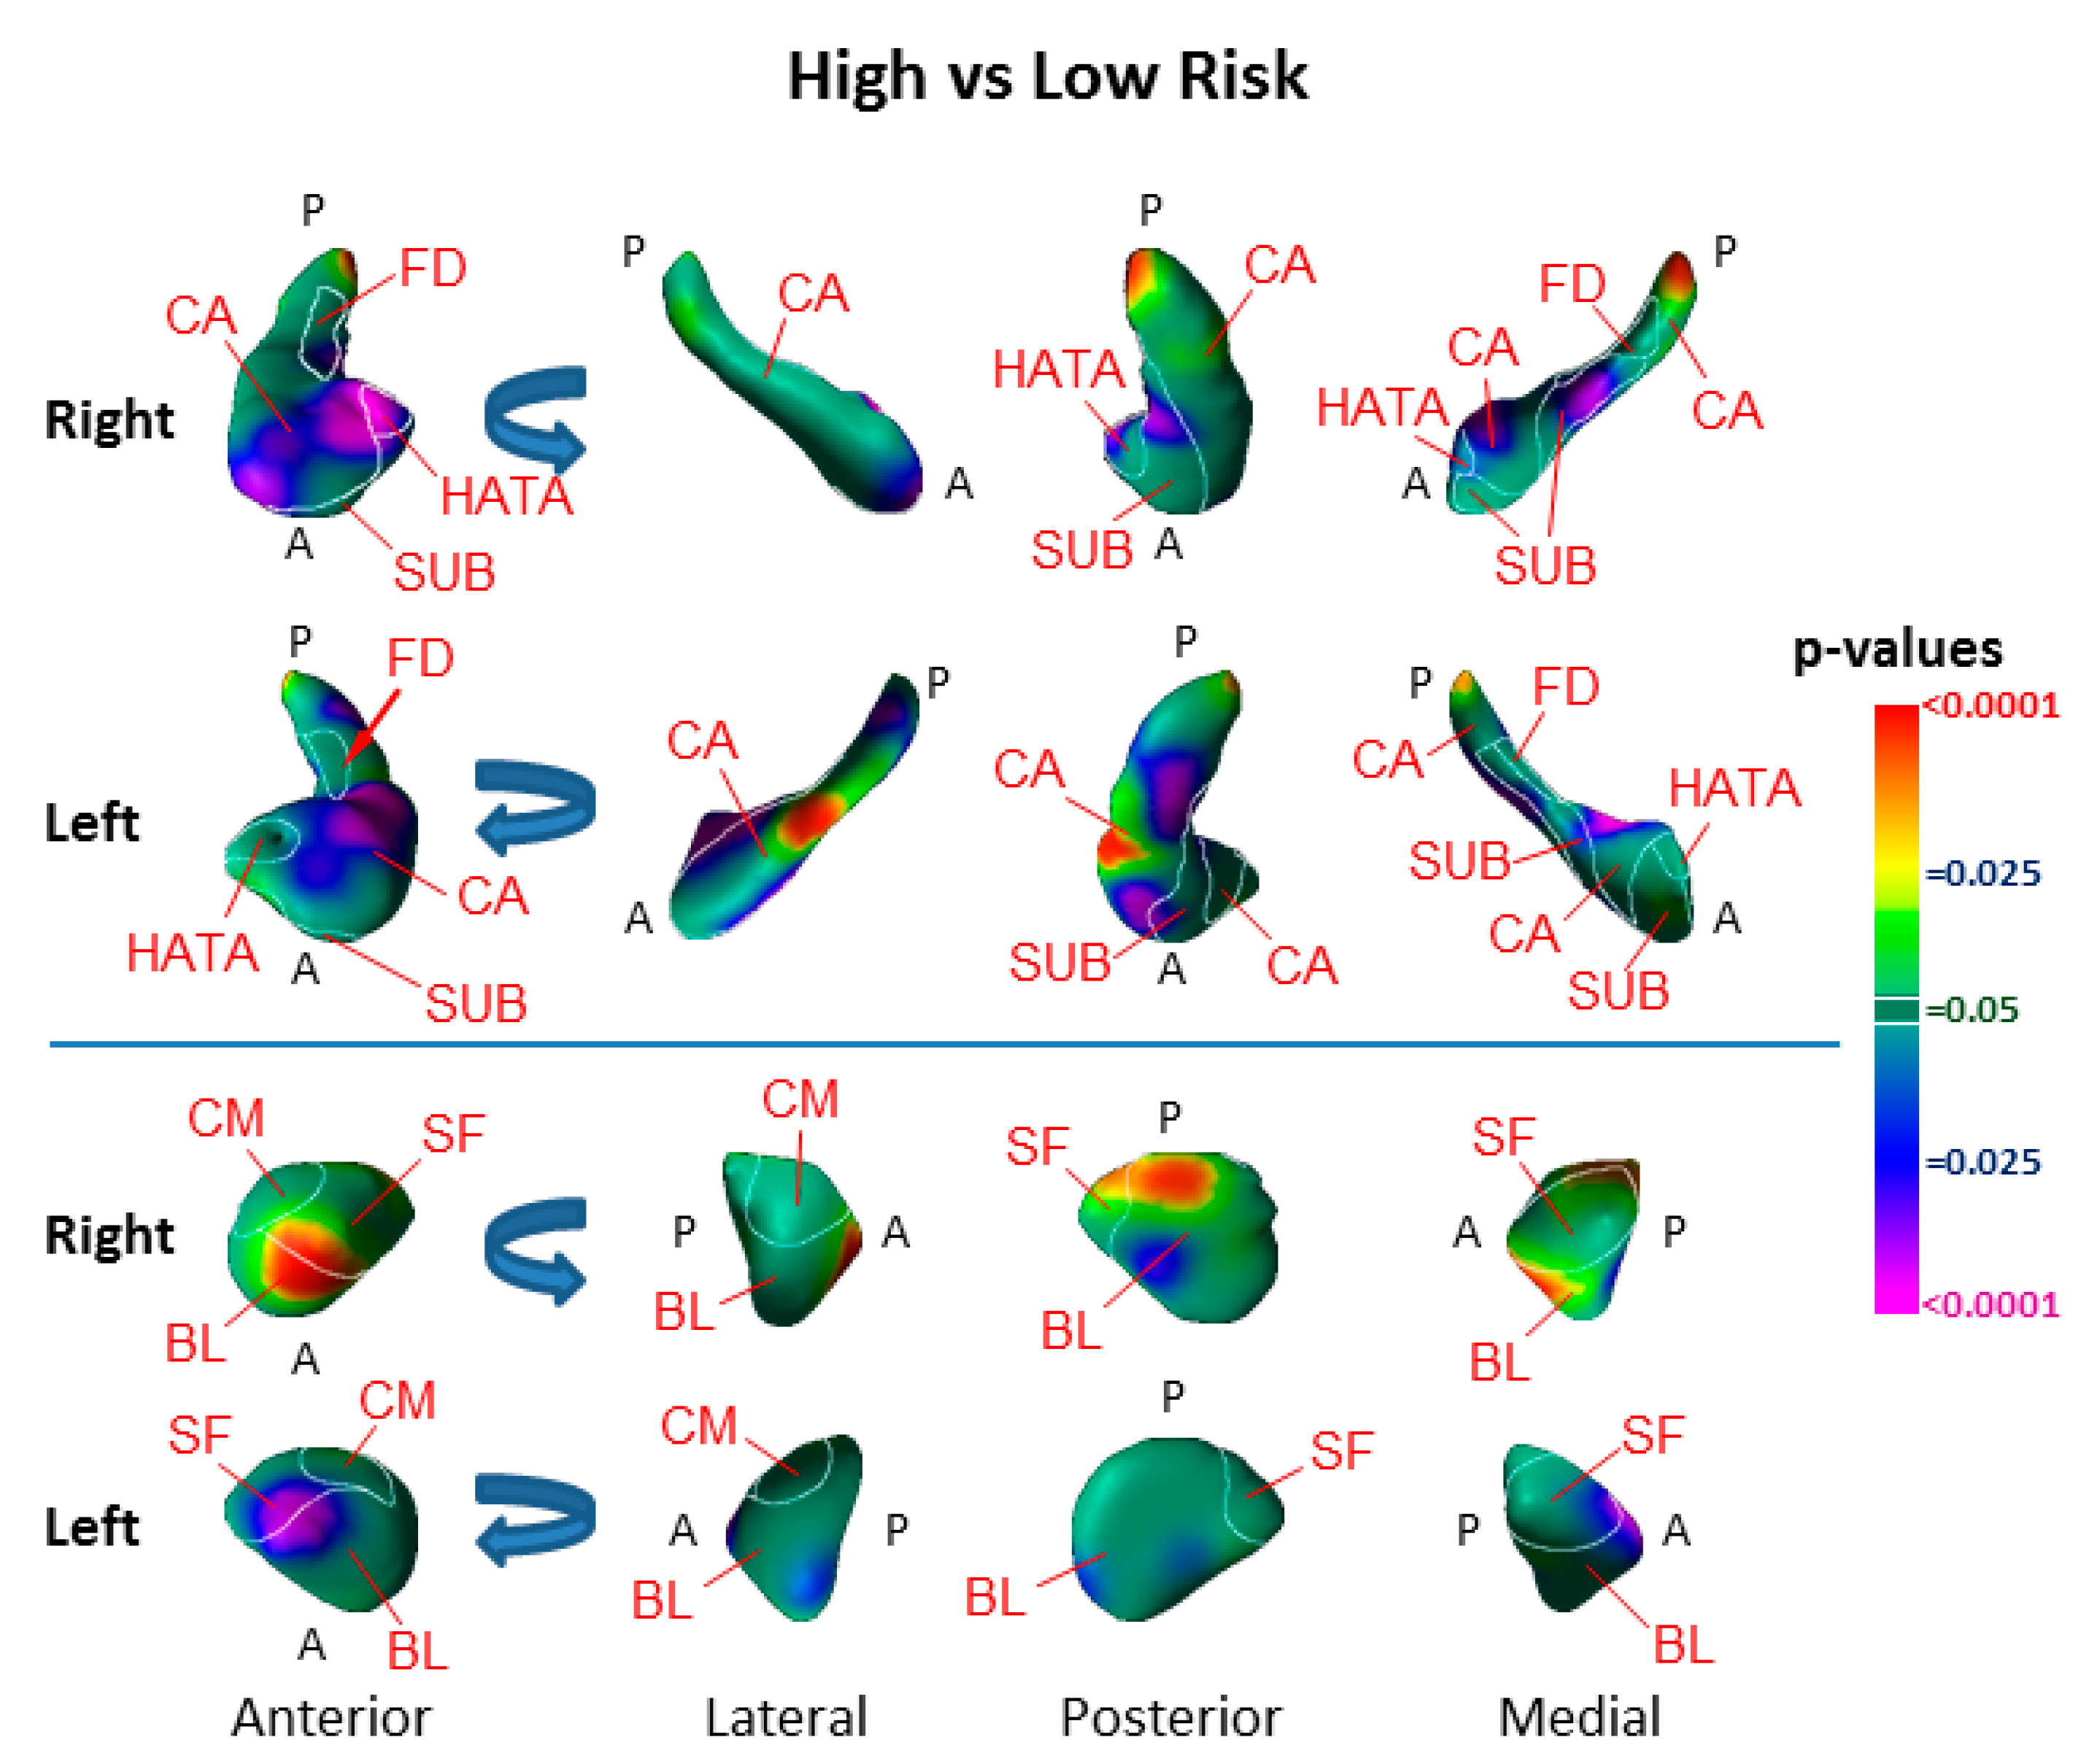
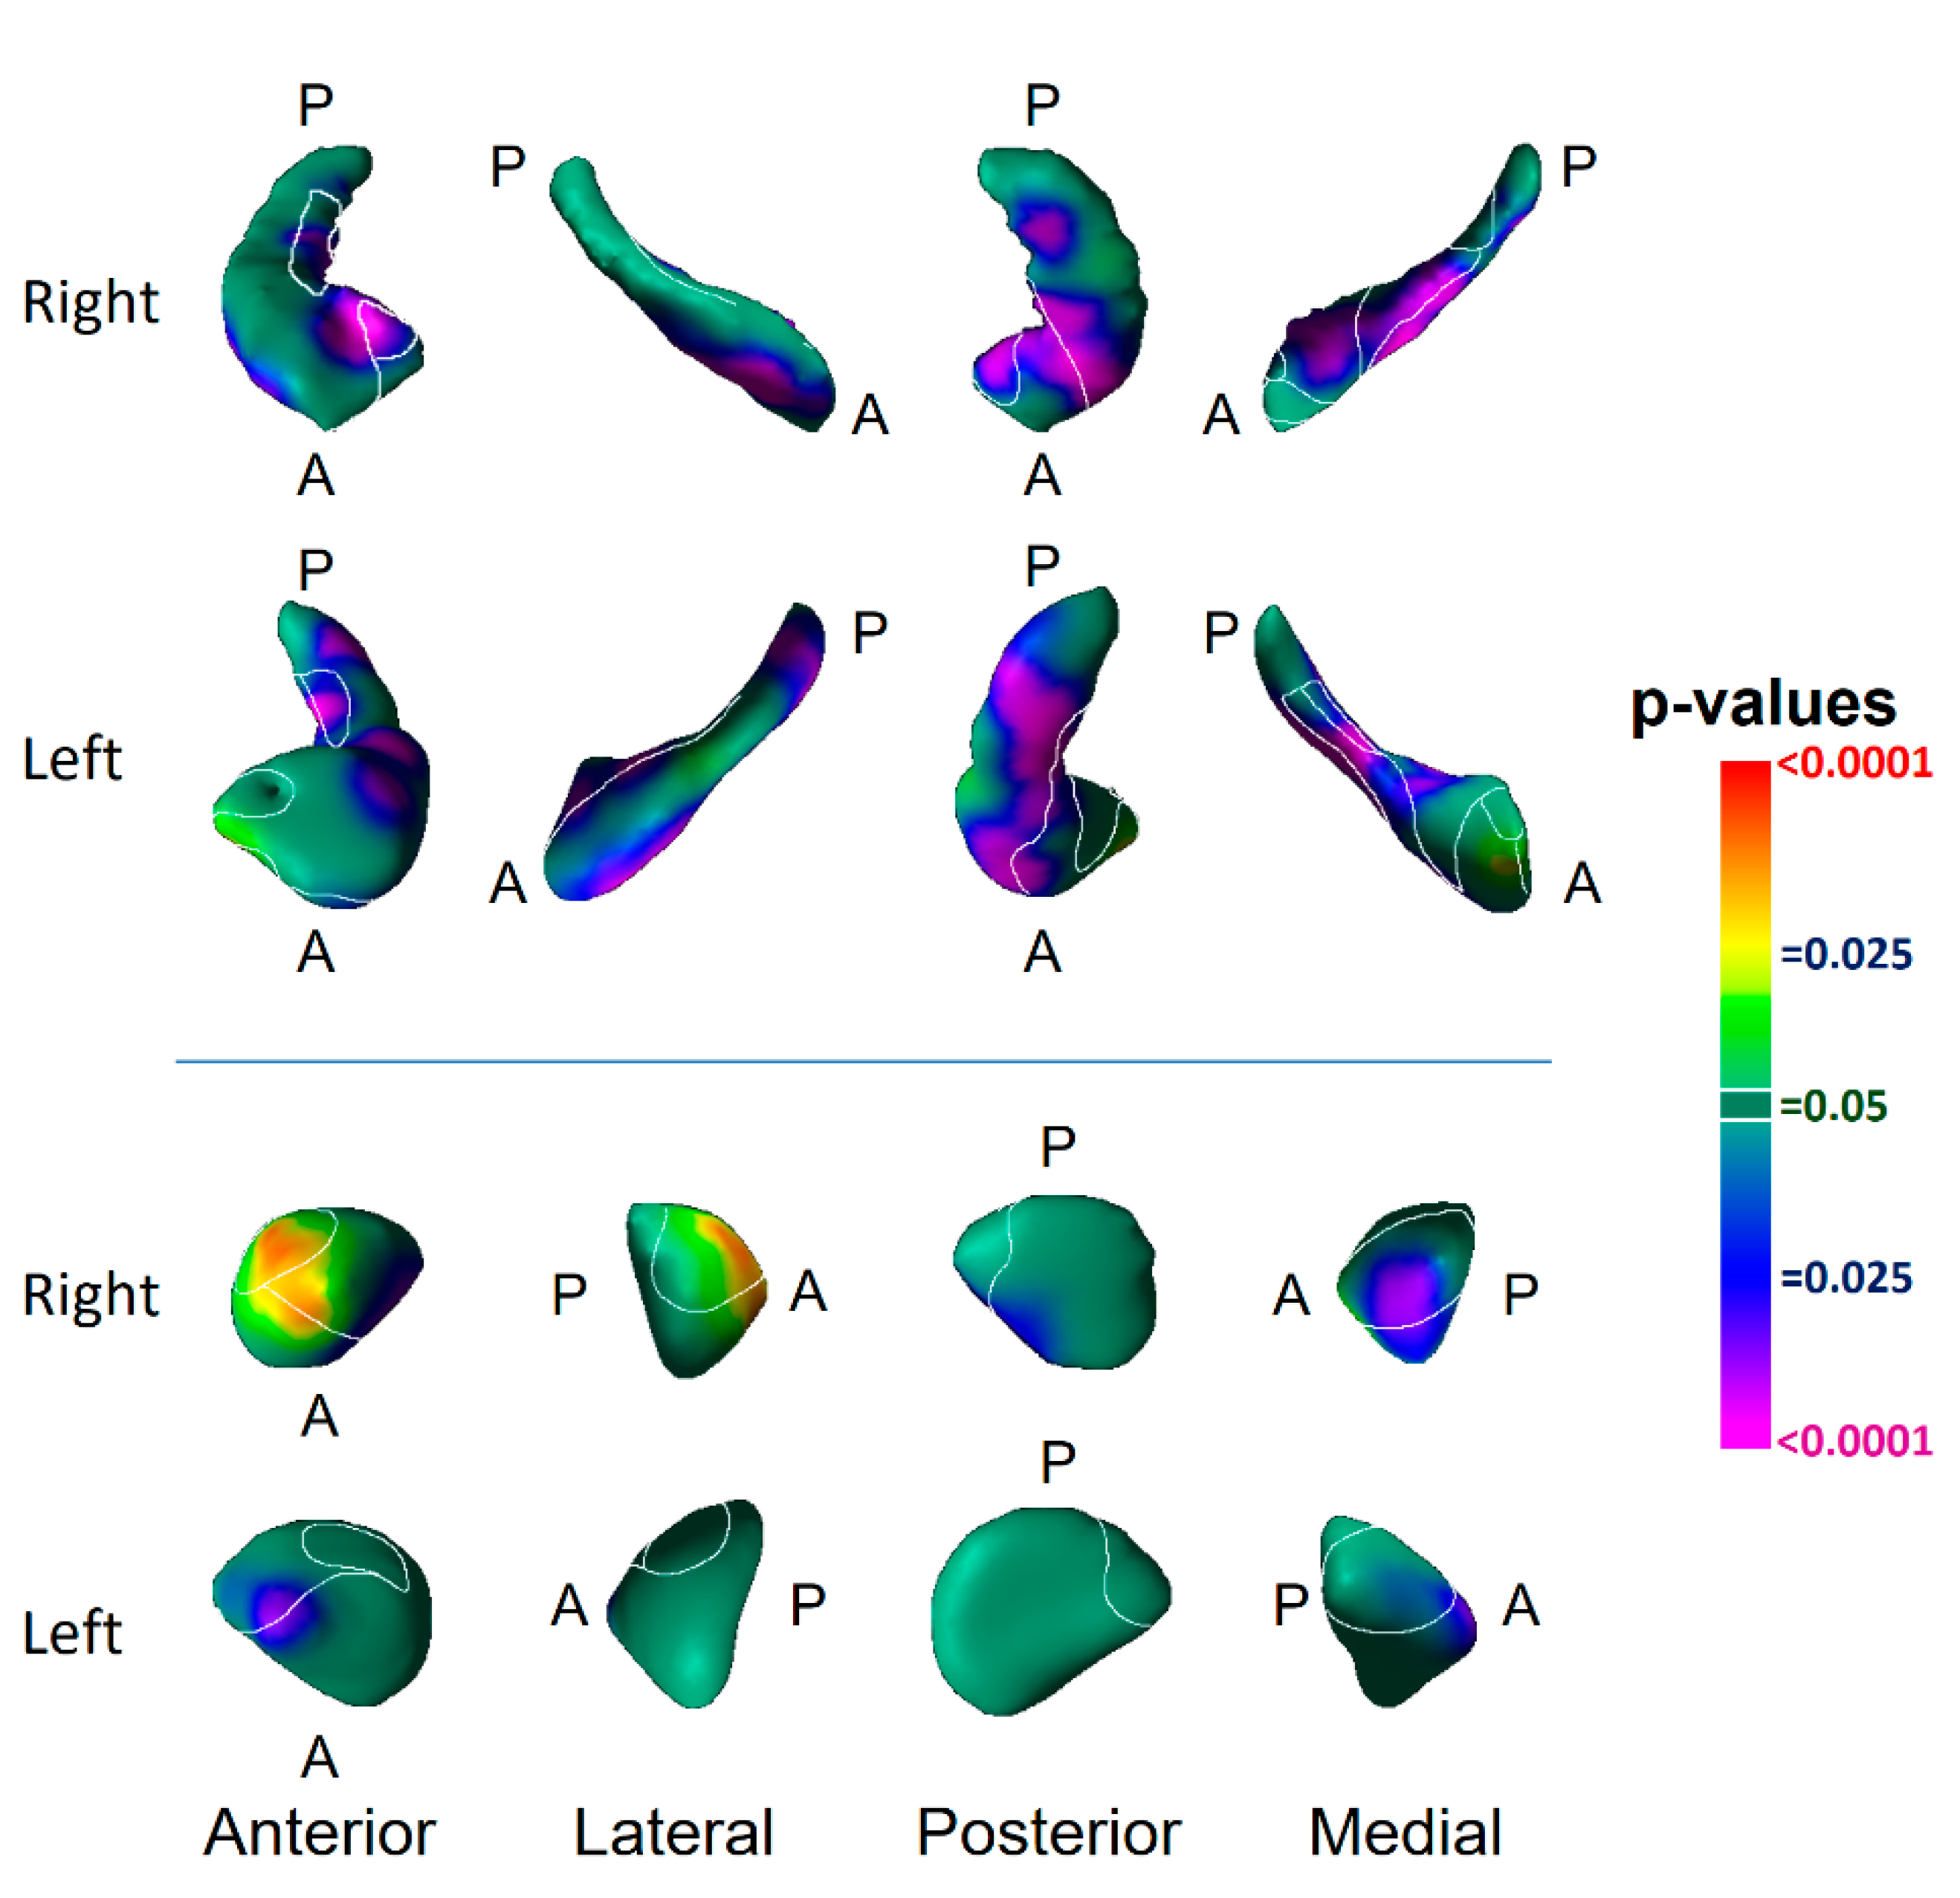
3.1. Risk Effects
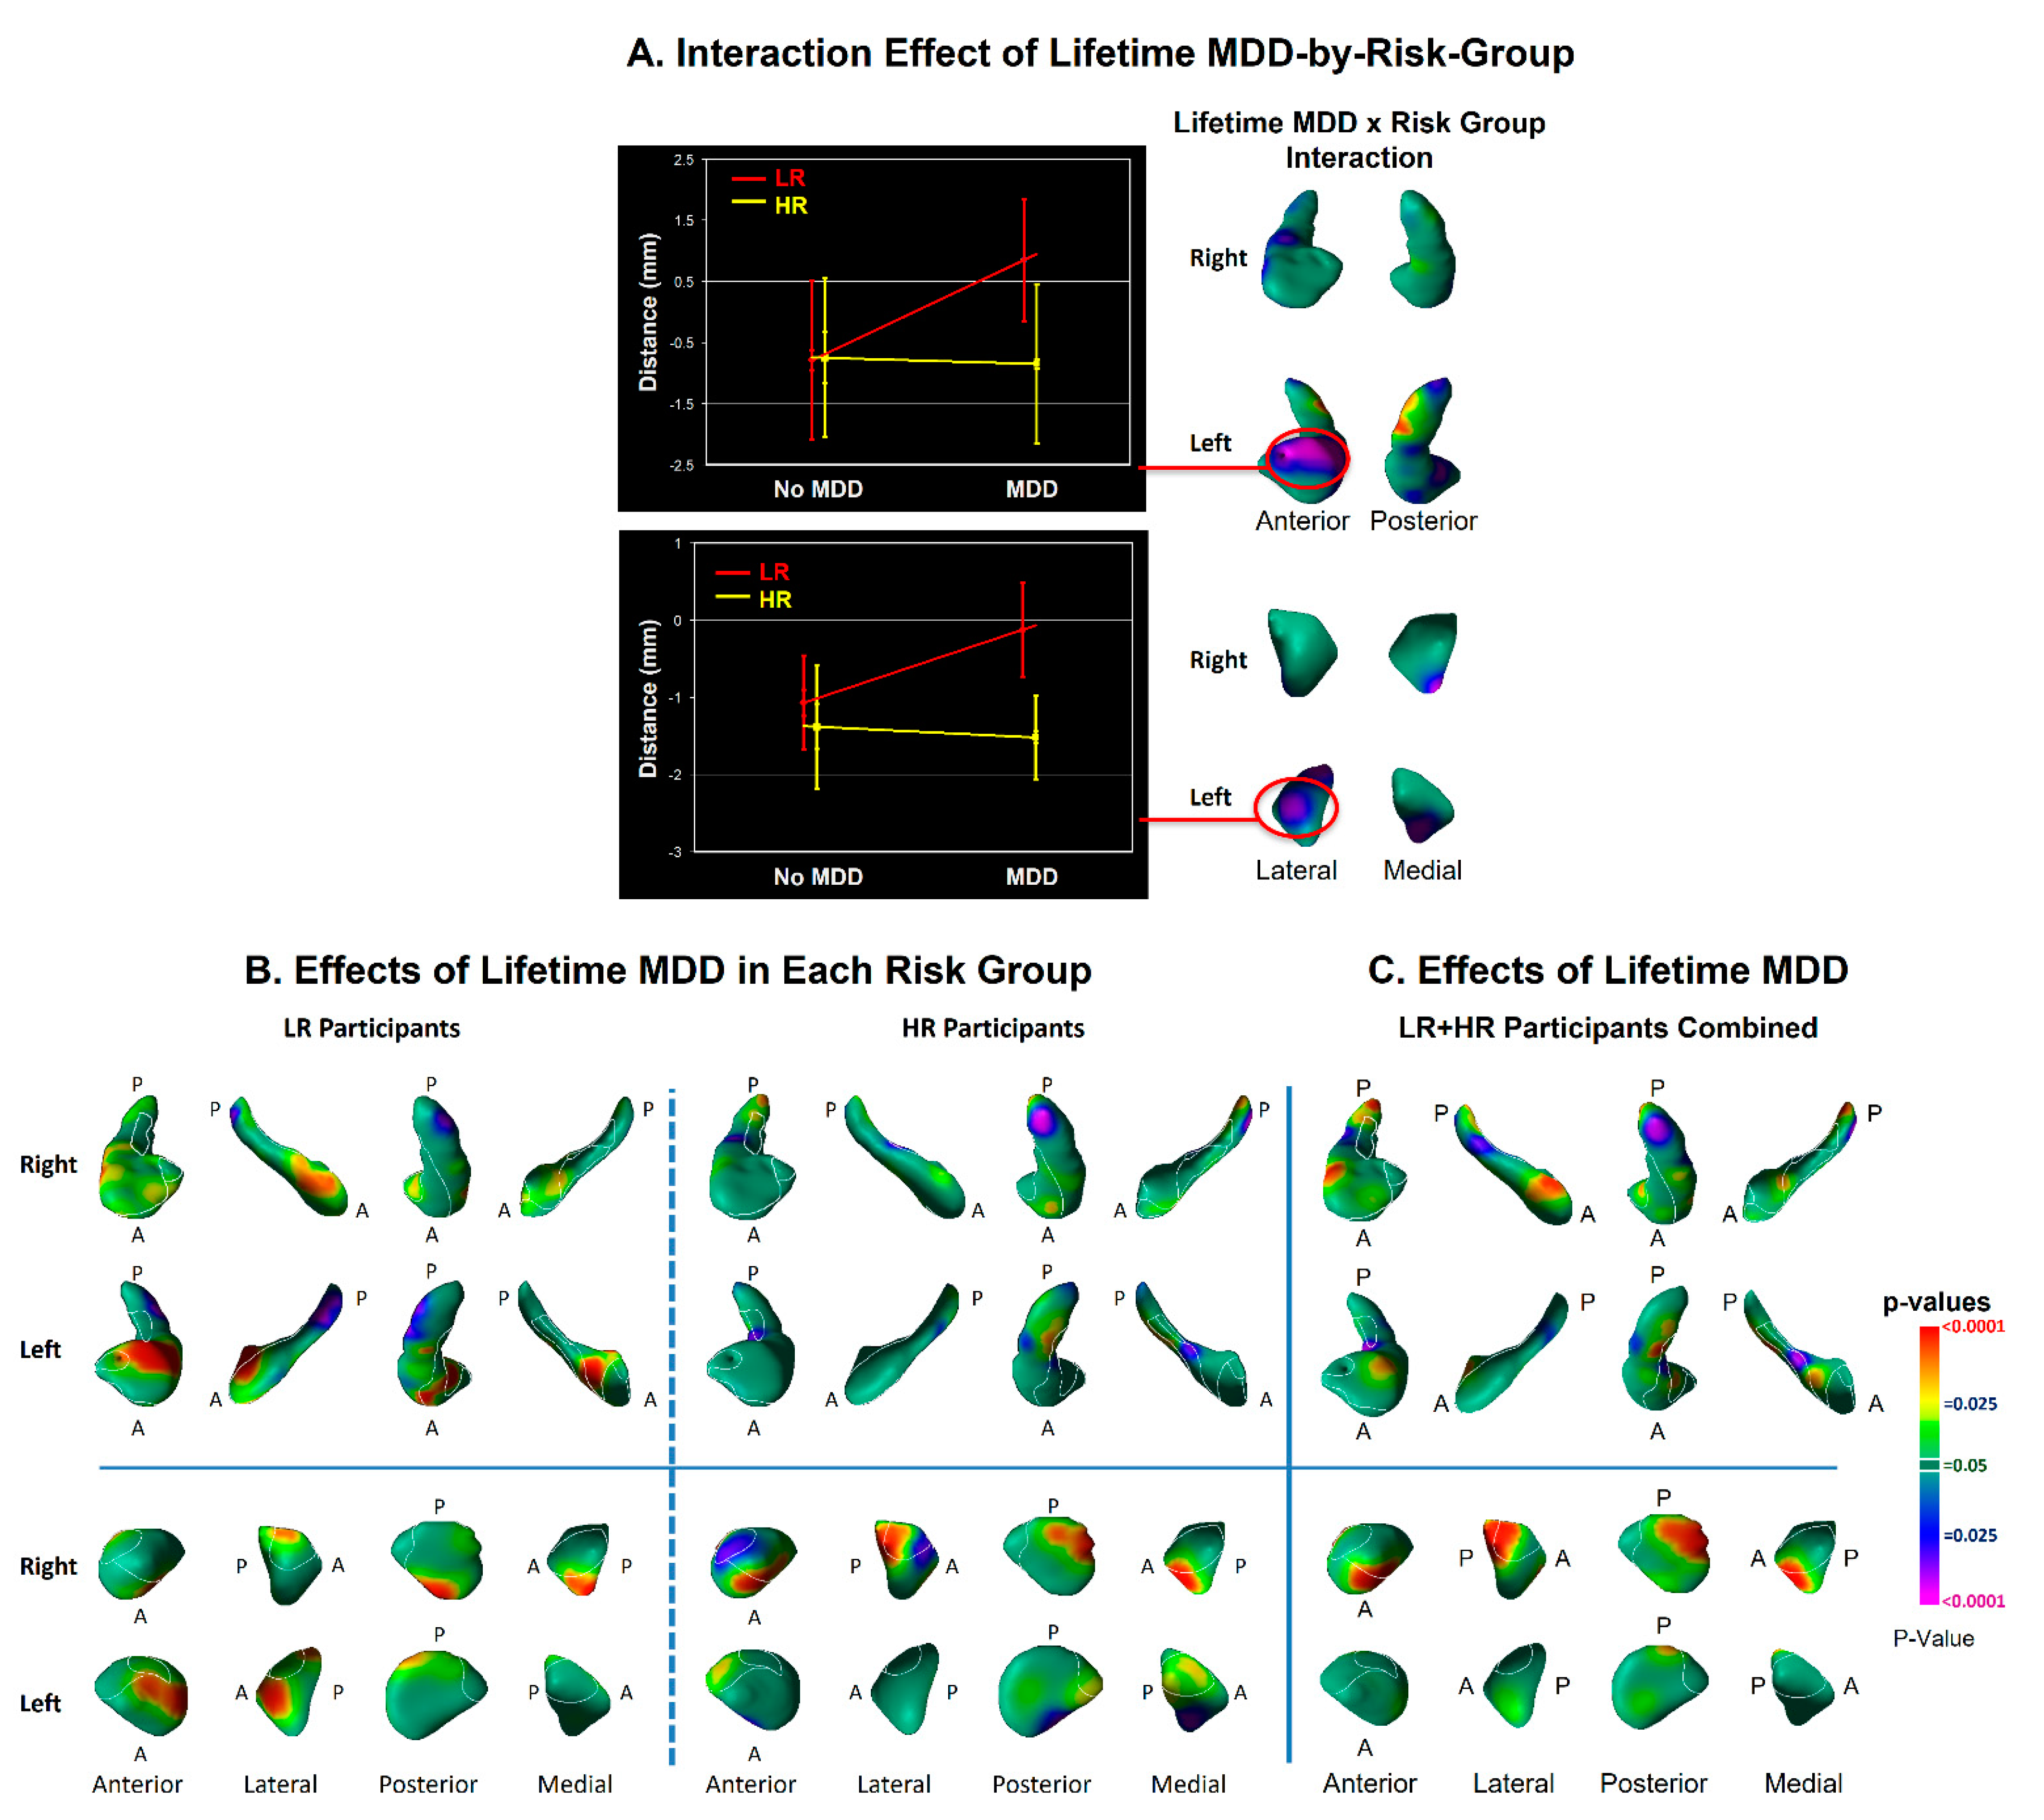
3.2. Modifier Effects
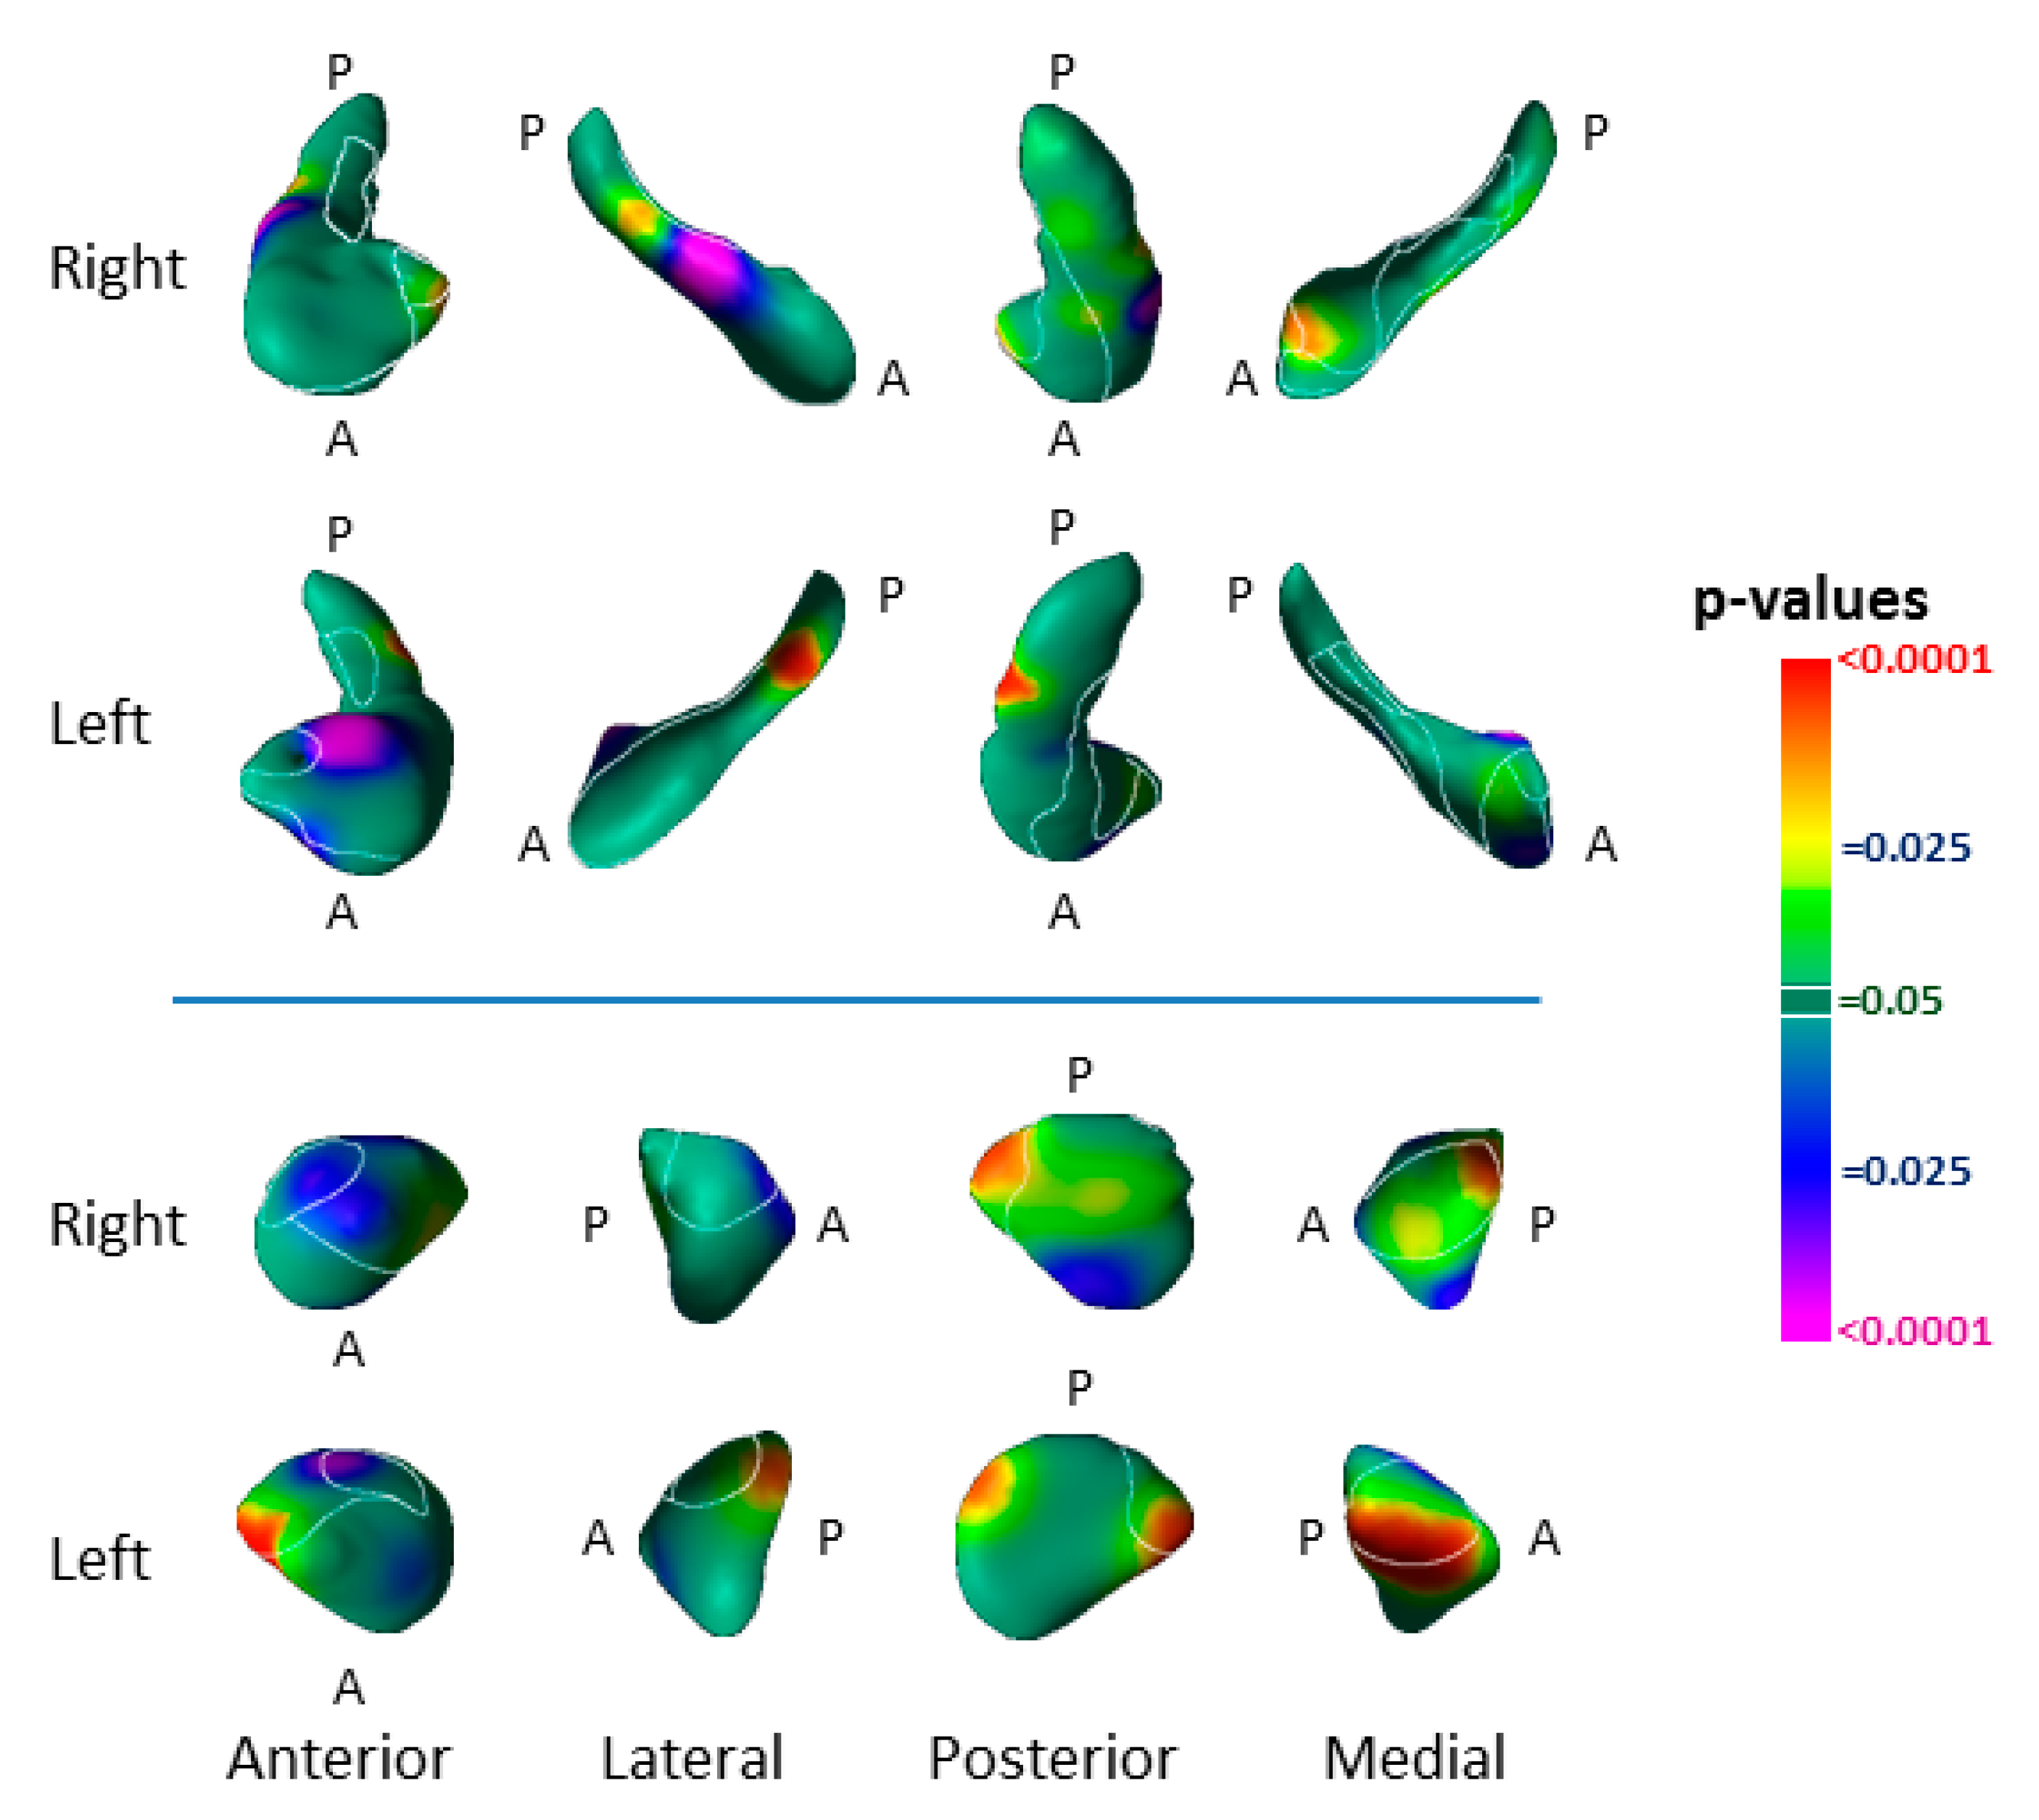
3.3. Associations with Symptom Severity
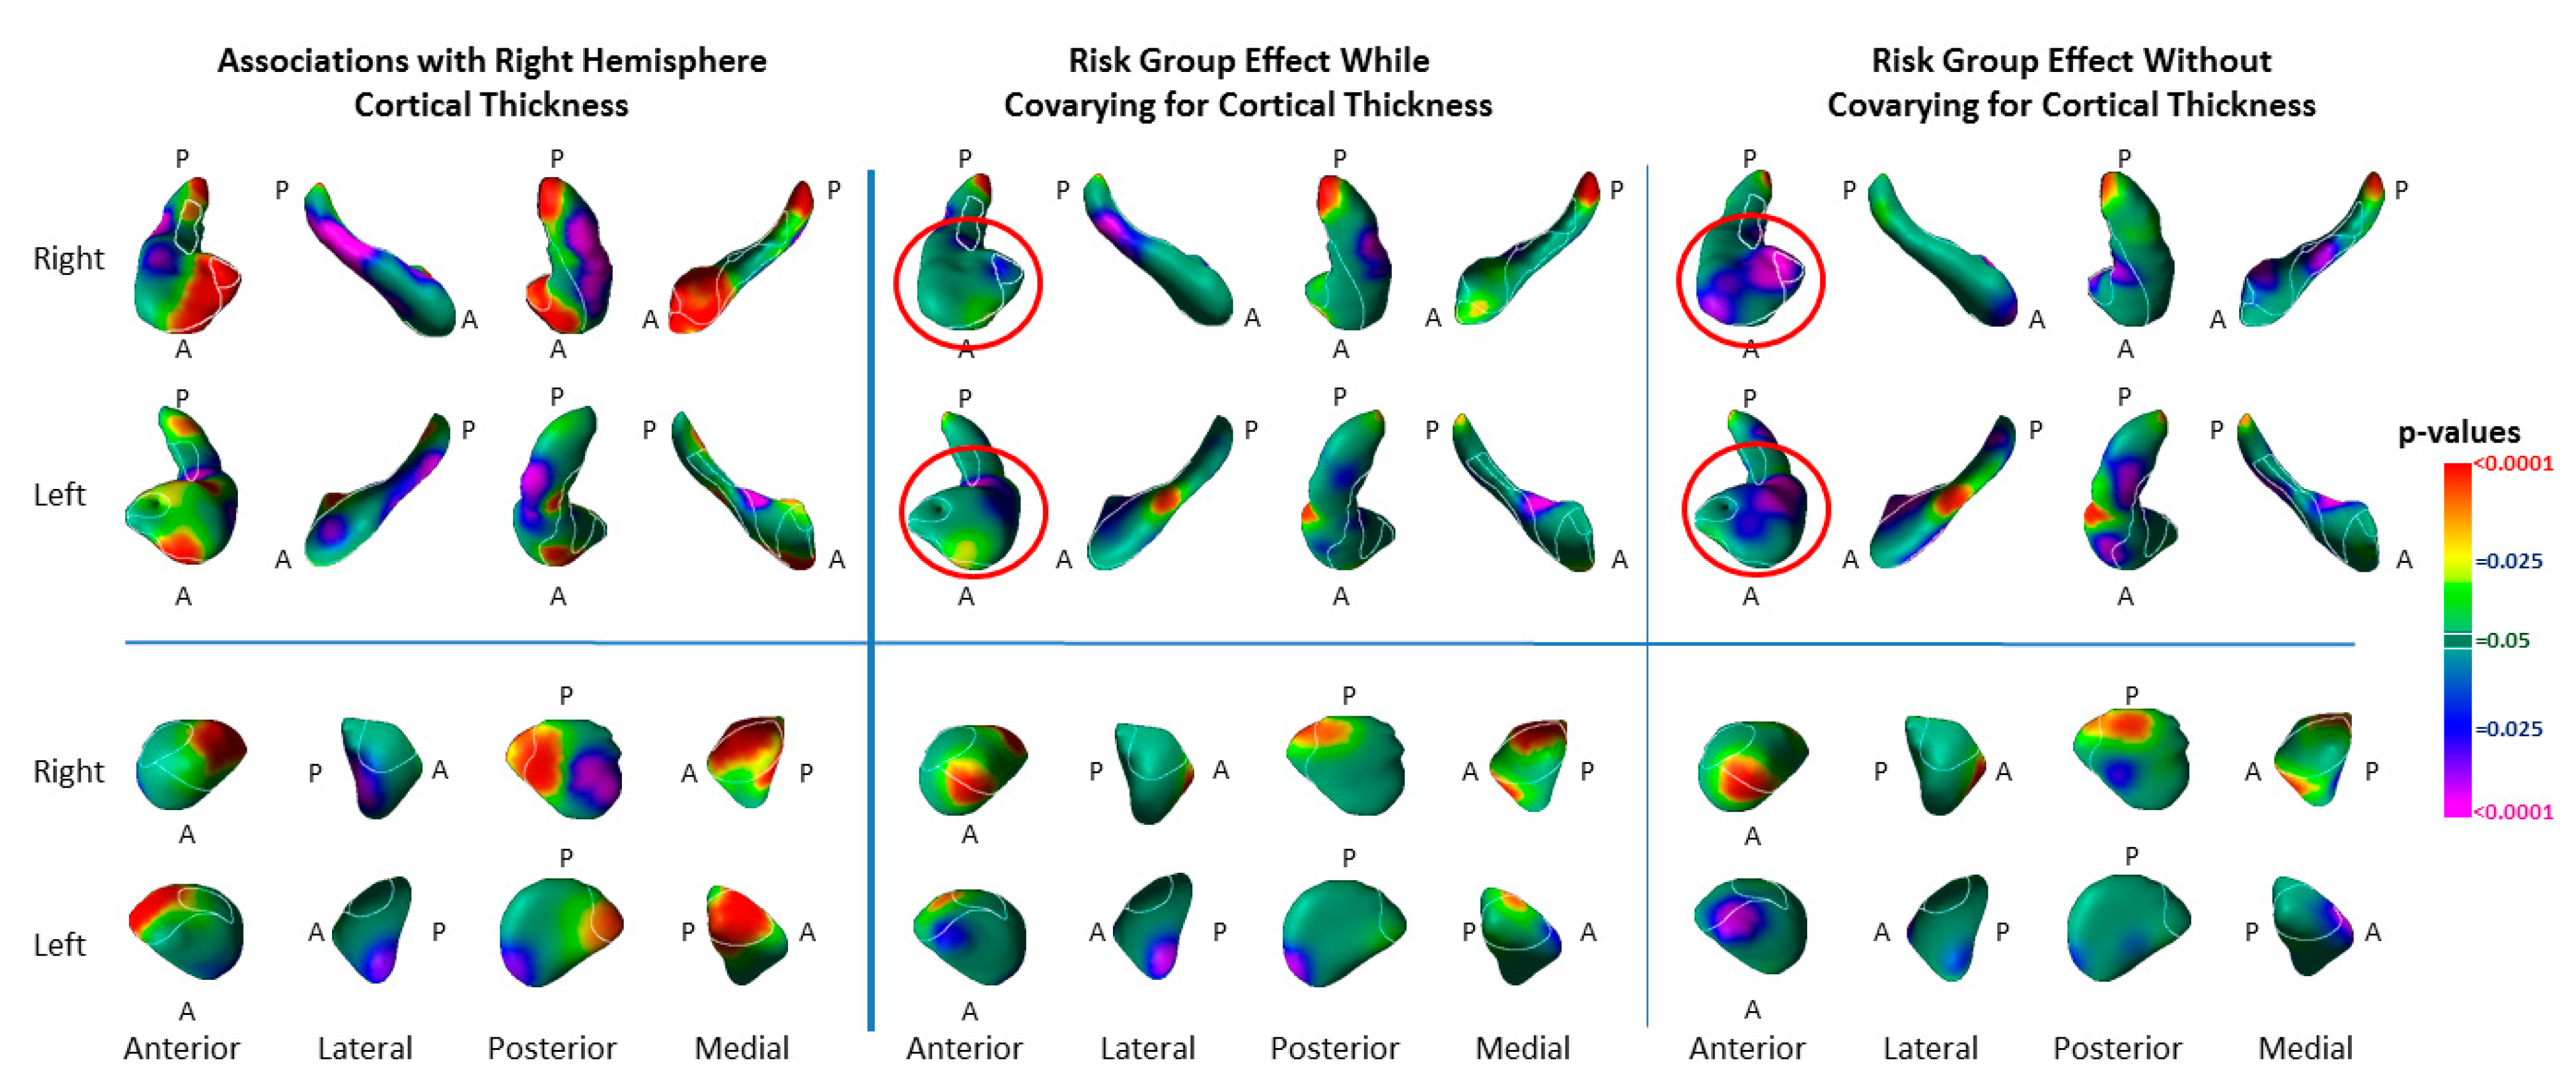
3.4. Associations with Right-Hemisphere Cortical Thinning
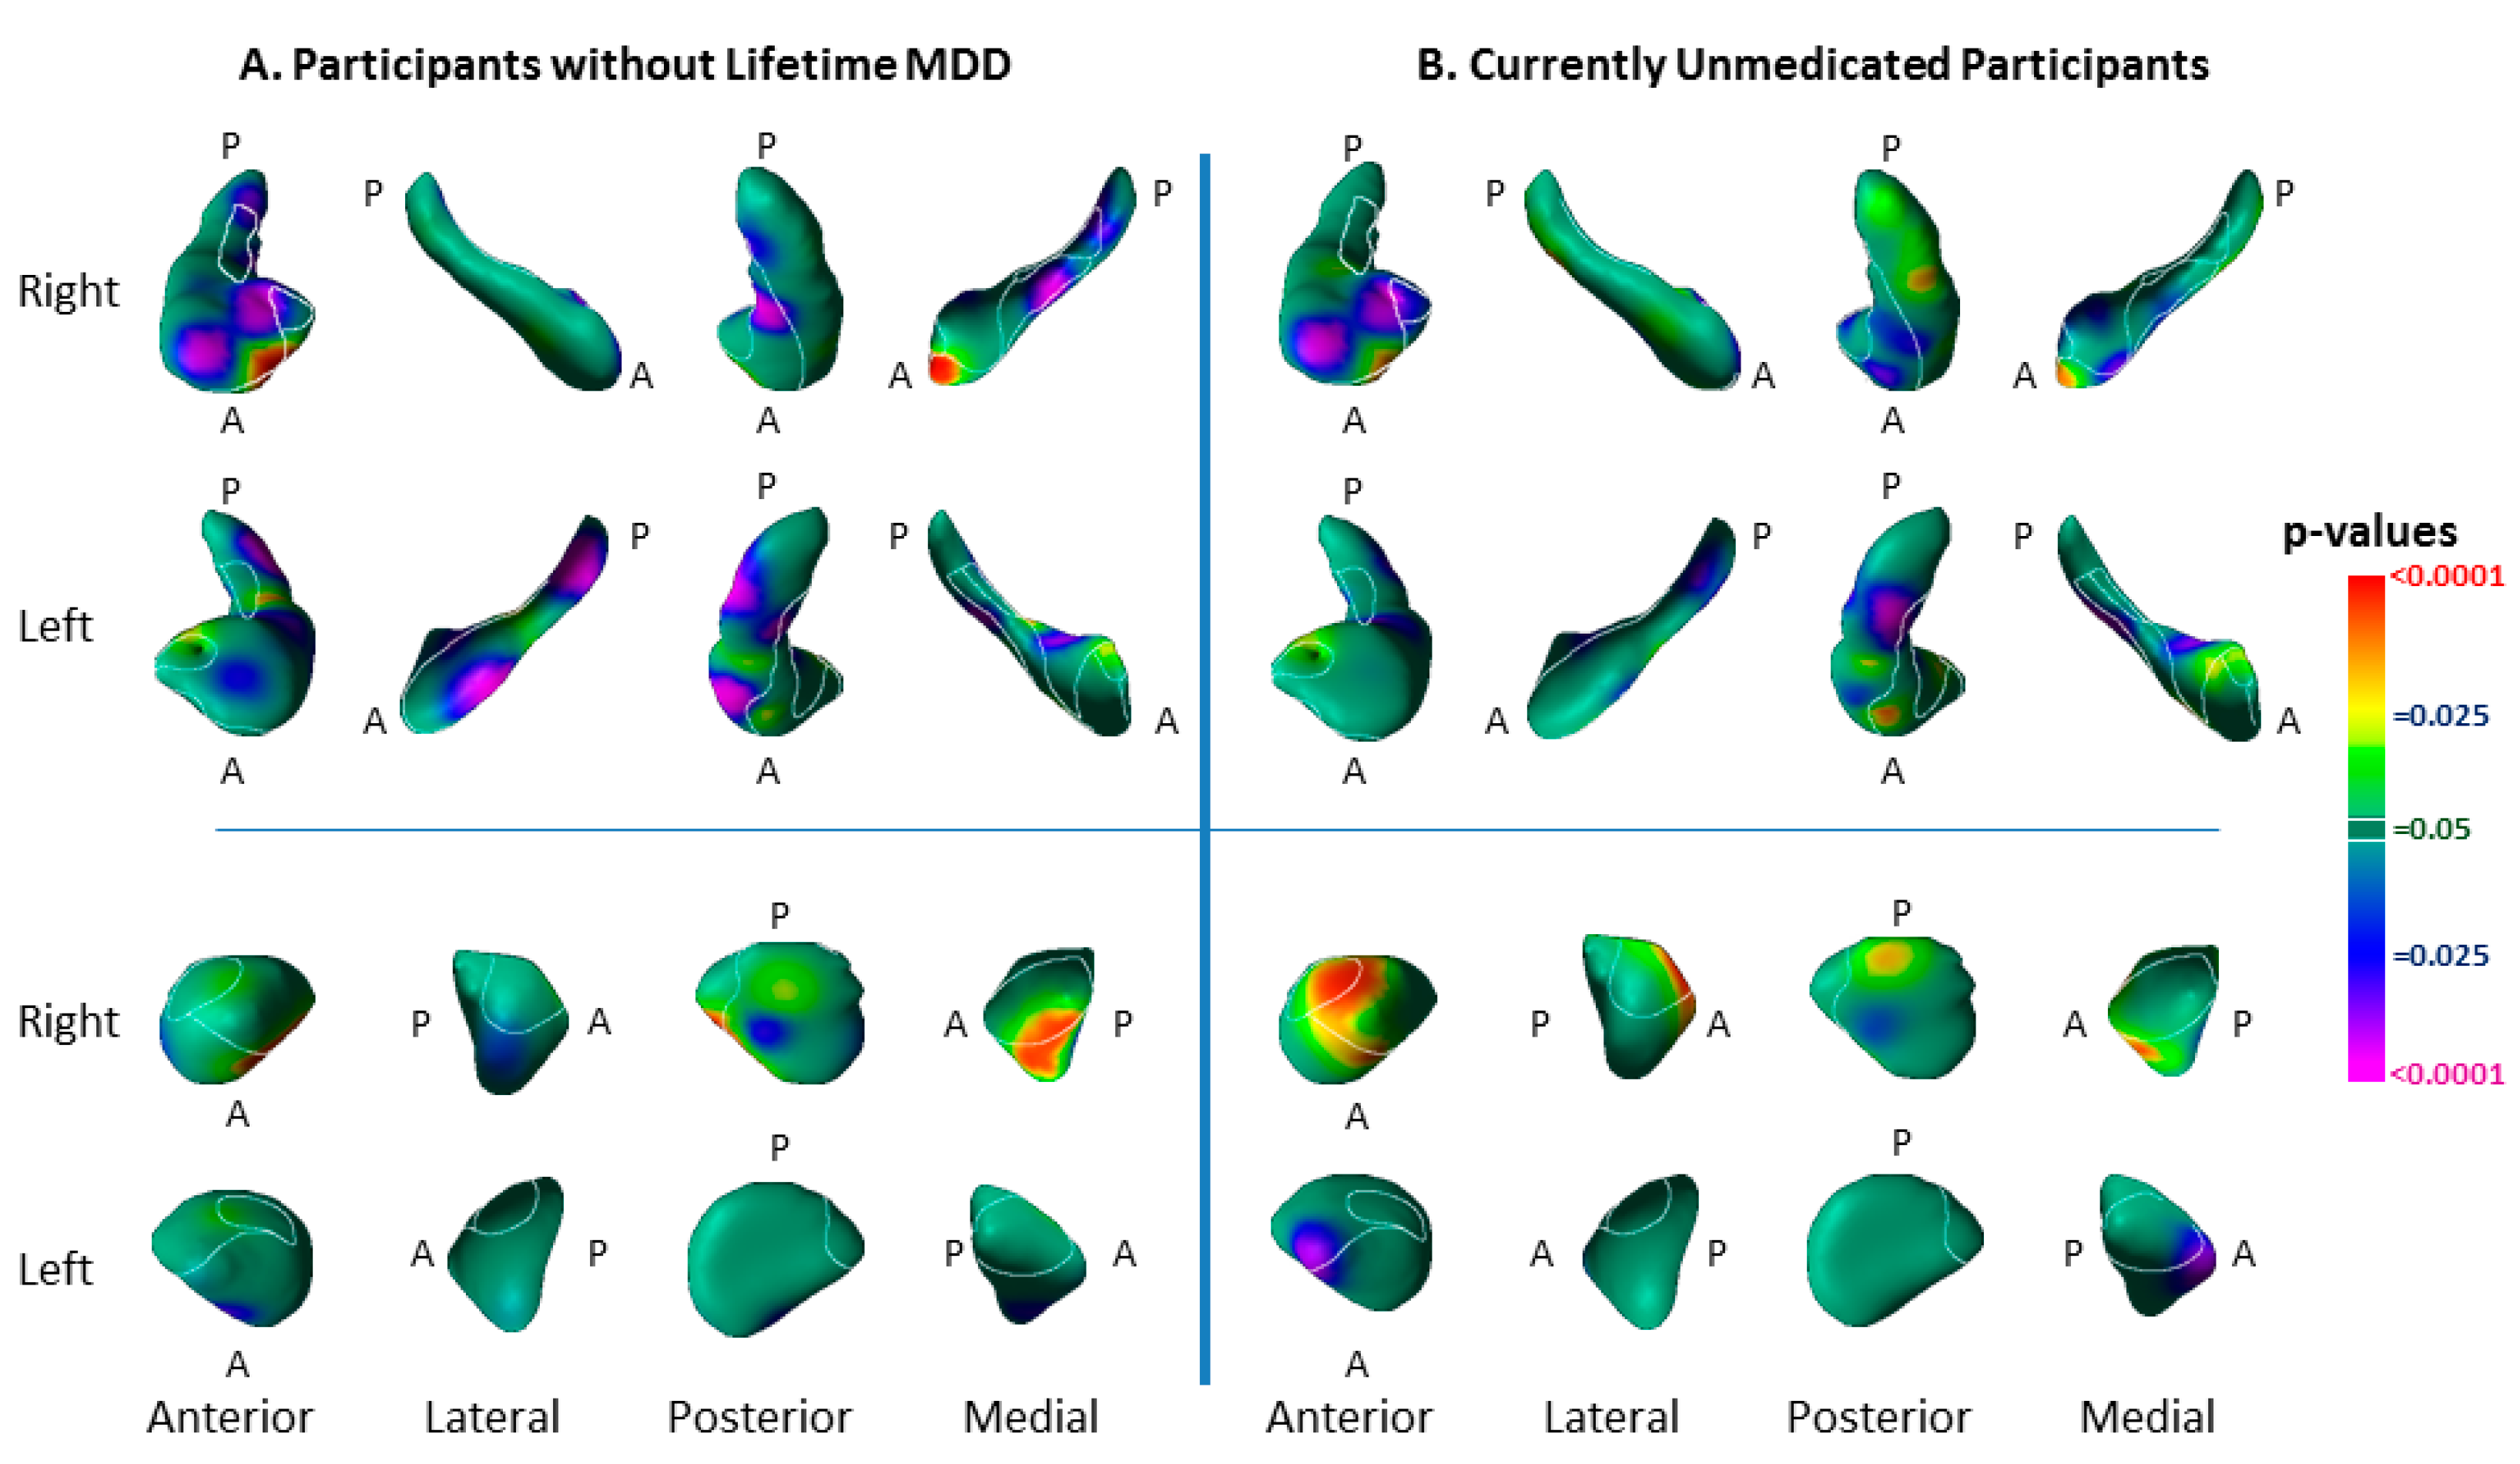
3.5. Medication Effects
4. Discussion
4.1. Hippocampus Subfields in the Pathogenesis of Depression
4.2. Amygdala Nuclei in the Pathogenesis of Depression
4.3. Relationship to Prior Studies
5. Limitations and Conclusions
Author Contributions
Funding
Institutional Review Board Statement
Informed Consent Statement
Data Availability Statement
Conflicts of Interest
References
- Peterson, B.S.; Warner, V.; Bansal, R.; Zhu, H.; Hao, X.; Liu, J.; Durkin, K.; Adams, P.B.; Wickramaratne, P.; Weissman, M.M. Cortical thinning in persons at increased familial risk for major depression. Proc. Natl. Acad. Sci. USA 2009, 106, 6273–6278. [Google Scholar] [CrossRef] [PubMed] [Green Version]
- Tu, P.C.; Chen, L.F.; Hsieh, J.C.; Bai, Y.M.; Li, C.T.; Su, T.P. Regional cortical thinning in patients with major depressive disorder: A surface-based morphometry study. Psychiatry Res. 2012, 202, 206–213. [Google Scholar] [CrossRef] [PubMed]
- Burke, J.; McQuoid, D.R.; Payne, M.E.; Steffens, D.C.; Krishnan, R.R.; Taylor, W.D. Amygdala volume in late-life depression: Relationship with age of onset. Am. J. Geriatr. Psychiatry 2011, 19, 771–776. [Google Scholar] [CrossRef] [PubMed] [Green Version]
- Campbell, S.; Marriott, M.; Nahmias, C.; MacQueen, G.M. Lower hippocampal volume in patients suffering from depression: A meta-analysis. Am. J. Psychiatry 2004, 161, 598–607. [Google Scholar] [CrossRef]
- Cole, J.; Costafreda, S.G.; McGuffin, P.; Fu, C.H. Hippocampal atrophy in first episode depression: A meta-analysis of magnetic resonance imaging studies. J. Affect. Disord. 2011, 134, 483–487. [Google Scholar] [CrossRef]
- Frodl, T.; Meisenzahl, E.M.; Zetzsche, T.; Born, C.; Jager, M.; Groll, C.; Bottlender, R.; Leinsinger, G.; Moller, H.J. Larger amygdala volumes in first depressive episode as compared to recurrent major depression and healthy control subjects. Biol. Psychiatry 2003, 53, 338–344. [Google Scholar] [CrossRef]
- Hamilton, J.P.; Siemer, M.; Gotlib, I.H. Amygdala volume in major depressive disorder: A meta-analysis of magnetic resonance imaging studies. Mol. Psychiatry 2008, 13, 993–1000. [Google Scholar] [CrossRef] [Green Version]
- Rosso, I.M.; Cintron, C.M.; Steingard, R.J.; Renshaw, P.F.; Young, A.D.; Yurgelun-Todd, D.A. Amygdala and hippocampus volumes in pediatric major depression. Biol. Psychiatry 2005, 57, 21–26. [Google Scholar] [CrossRef]
- Vakili, K.; Pillay, S.S.; Lafer, B.; Fava, M.; Renshaw, P.F.; Bonello-Cintron, C.M.; Yurgelun-Todd, D.A. Hippocampal volume in primary unipolar major depression: A magnetic resonance imaging study. Biol. Psychiatry 2000, 47, 1087–1090. [Google Scholar] [CrossRef]
- Videbech, P.; Ravnkilde, B. Hippocampal volume and depression: A meta-analysis of mri studies. Am. J. Psychiatry 2004, 161, 1957–1966. [Google Scholar] [CrossRef]
- Stratmann, M.; Konrad, C.; Kugel, H.; Krug, A.; Schöning, S.; Ohrmann, P.; Uhlmann, C.; Postert, C.; Suslow, T.; Heindel, W.; et al. Insular and hippocampal gray matter volume reductions in patients with major depressive disorder. PLoS ONE 2014, 9, e102692. [Google Scholar] [CrossRef] [PubMed] [Green Version]
- Romanczuk-Seiferth, N.; Pöhland, L.; Mohnke, S.; Garbusow, M.; Erk, S.; Haddad, L.; Grimm, O.; Tost, H.; Meyer-Lindenberg, A.; Walter, H.; et al. Larger amygdala volume in first-degree relatives of patients with major depression. NeuroImage Clin. 2014, 5, 62–68. [Google Scholar] [CrossRef] [PubMed] [Green Version]
- Yao, Z.; Fu, Y.; Wu, J.; Zhang, W.; Yu, Y.; Zhang, Z.; Wu, X.; Wang, Y.; Hu, B. Morphological changes in subregions of hippocampus and amygdala in major depressive disorder patients. Brain Imaging Behav. 2020, 14, 653–667. [Google Scholar] [CrossRef] [PubMed]
- Chai, X.J.; Hirshfeld-Becker, D.; Biederman, J.; Uchida, M.; Doehrmann, O.; Leonard, J.A.; Salvatore, J.; Kenworthy, T.; Brown, A.; Kagan, E.; et al. Functional and structural brain correlates of risk for major depression in children with familial depression. NeuroImage Clin. 2015, 8, 398–407. [Google Scholar] [CrossRef] [PubMed] [Green Version]
- Nolan, M.; Roman, E.; Nasa, A.; Levins, K.J.; O’Hanlon, E.; O’Keane, V.; Roddy, D.W. Hippocampal and amygdalar volume changes in major depressive disorder: A targeted review and focus on stress. Chronic Stress 2020, 4, 2470547020944553. [Google Scholar] [CrossRef]
- Stockmeier, C.A.; Mahajan, G.J.; Konick, L.C.; Overholser, J.C.; Jurjus, G.J.; Meltzer, H.Y.; Uylings, H.B.; Friedman, L.; Rajkowska, G. Cellular changes in the postmortem hippocampus in major depression. Biol. Psychiatry 2004, 56, 640–650. [Google Scholar] [CrossRef] [Green Version]
- Bowley, M.P.; Drevets, W.C.; Ongur, D.; Price, J.L. Low glial numbers in the amygdala in major depressive disorder. Biol. Psychiatry 2002, 52, 404–412. [Google Scholar] [CrossRef]
- Cobb, J.A.; O’Neill, K.; Milner, J.; Mahajan, G.J.; Lawrence, T.J.; May, W.L.; Miguel-Hidalgo, J.; Rajkowska, G.; Stockmeier, C.A. Density of gfap-immunoreactive astrocytes is decreased in left hippocampi in major depressive disorder. Neuroscience 2016, 316, 209–220. [Google Scholar] [CrossRef] [Green Version]
- Reynolds, L.M.; Reynolds, G.P. Differential regional n-acetylaspartate deficits in postmortem brain in schizophrenia, bipolar disorder and major depressive disorder. J. Psychiatr. Res. 2011, 45, 54–59. [Google Scholar] [CrossRef]
- de Diego-Adelino, J.; Portella, M.J.; Gomez-Anson, B.; Lopez-Moruelo, O.; Serra-Blasco, M.; Vives, Y.; Puigdemont, D.; Perez-Egea, R.; Alvarez, E.; Perez, V. Hippocampal abnormalities of glutamate/glutamine, n-acetylaspartate and choline in patients with depression are related to past illness burden. J. Psychiatry Neurosci. 2013, 38, 107–116. [Google Scholar] [CrossRef] [Green Version]
- Liao, Y.; Huang, X.; Wu, Q.; Yang, C.; Kuang, W.; Du, M.; Lui, S.; Yue, Q.; Chan, R.C.; Kemp, G.J.; et al. Is depression a disconnection syndrome? Meta-analysis of diffusion tensor imaging studies in patients with mdd. J. Psychiatry Neurosci. 2013, 38, 49–56. [Google Scholar] [CrossRef] [PubMed] [Green Version]
- Sexton, C.E.; Mackay, C.E.; Ebmeier, K.P. A systematic review of diffusion tensor imaging studies in affective disorders. Biol. Psychiatry 2009, 66, 814–823. [Google Scholar] [CrossRef] [PubMed]
- Peterson, B.S. Conceptual, methodological, and statistical challenges in brain imaging studies of developmentally based psychopathologies. Dev. Psychopathol. 2003, 15, 811–832. [Google Scholar] [CrossRef] [PubMed]
- Peterson, B.S.; Weissman, M.M. A brain-based endophenotype for major depressive disorder. Annu. Rev. Med. 2011, 62, 461–474. [Google Scholar] [CrossRef] [PubMed] [Green Version]
- Gottesman, I.I.; Gould, T.D. The endophenotype concept in psychiatry: Etymology and strategic intentions. Am. J. Psychiatry 2003, 160, 636–645. [Google Scholar] [CrossRef] [PubMed]
- McIntosh, A.M.; Sullivan, P.F.; Lewis, C.M. Uncovering the genetic architecture of major depression. Neuron 2019, 102, 91–103. [Google Scholar] [CrossRef]
- Weissman, M.M.; Wickramaratne, P.; Nomura, Y.; Warner, V.; Verdeli, H.; Pilowsky, D.J.; Grillon, C.; Bruder, G. Families at high and low risk for depression: A 3-generation study. Arch. Gen. Psychiatry 2005, 62, 29–36. [Google Scholar] [CrossRef]
- Weissman, M.M.; Wickramaratne, P.; Nomura, Y.; Warner, V.; Pilowsky, D.; Verdeli, H. Offspring of depressed parents: 20 years later. Am. J. Psychiatry 2006, 163, 1001–1008. [Google Scholar] [CrossRef]
- Mannuzza, S.; Fyer, A.J.; Klein, D.F.; Endicott, J. Schedule for affective disorders and schizophrenia–lifetime version modified for the study of anxiety disorders (sads-la): Rationale and conceptual development. J. Psychiatr. Res. 1986, 20, 317–325. [Google Scholar] [CrossRef]
- Poznanski, E.O.; Freeman, L.N.; Mokros, H.B. Children’s depression rating scale revised. Psychopharmacol. Bull. 1985, 21, 979–989. [Google Scholar]
- Hamilton, M. Development of a rating scale for primary depressive illness. Br. J. Soc. Clin. Psychol. 1967, 6, 278–296. [Google Scholar] [CrossRef] [PubMed]
- Perrin, S.; Last, C.G. Do childhood anxiety measures measure anxiety? J. Abnorm. Child Psychol. 1992, 20, 567–578. [Google Scholar] [CrossRef] [PubMed] [Green Version]
- Hamilton, M. The assessment of anxiety states by rating. Br. J. Med. Psychol. 1959, 55, 50–55. [Google Scholar] [CrossRef] [PubMed]
- Endicott, J.; Spitzer, R.L. A diagnostic interview: The schedule for affective disorders and schizophrenia. Arch. Gen. Psychiatry 1978, 35, 837–844. [Google Scholar] [CrossRef] [PubMed]
- Sled, J.G.; Zijdenbos, A.P.; Evans, A.C. A nonparametric method for automatic correction of intensity nonuniformity in mri data. IEEE Trans. Med. Imaging 1998, 17, 87–97. [Google Scholar] [CrossRef] [PubMed] [Green Version]
- Shattuck, D.W.; Leahy, R.M. Brainsuite: An automated cortical surface identification tool. Med. Image Anal. 2002, 6, 129–142. [Google Scholar] [CrossRef]
- Skullerud, K. Variations in the size of the human brain. Influence of age, sex, body length, body mass index, alcoholism, alzheimer changes, and cerebral atherosclerosis. Acta Neurol. Scand. Suppl. 1985, 102, 1–94. [Google Scholar]
- Kates, W.R.; Abrams, M.T.; Kaufmann, W.E.; Breiter, S.N.; Reiss, A.L. Reliability and validity of mri measurement of the amygdala and hippocampus in children with fragile x syndrome. Psychiatry Res. 1997, 75, 31–48. [Google Scholar] [CrossRef]
- Watson, C.; Andermann, F.; Gloor, P.; Jones-Gotman, M.; Peters, T.; Evans, A.; Olivier, A.; Melanson, D.; Leroux, G. Anatomic basis of amygdaloid and hippocampal volume measurement by magnetic resonance imaging. Neurology 1992, 42, 1743–1750. [Google Scholar] [CrossRef]
- Bansal, R.; Staib, L.; Xu, D.; Zhu, H.; Peterson, B. Statistical analyses of brain surfaces using gaussian random fields on 2-d manifolds. IEEE Trans. Med. Imaging 2007, 26, 46–57. [Google Scholar] [CrossRef] [Green Version]
- Christensen, G.; Joshi, S.; Miller, M. Volumetric transformation of brain anatomy. IEEE. Trans. Med. Imaging 1997, 16, 1369–1383. [Google Scholar] [CrossRef] [PubMed]
- Chakravarty, M.M.; Bertrand, G.; Hodge, C.P.; Sadikot, A.F.; Collins, D.L. The creation of a brain atlas for image guided neurosurgery using serial histological data. NeuroImage 2006, 30, 359–376. [Google Scholar] [CrossRef] [PubMed]
- Hirai, T.; Jones, E.G. A new parcellation of the human thalamus on the basis of histochemical staining. Brain Res. Brain Res. Rev. 1989, 14, 1–34. [Google Scholar] [CrossRef]
- Plessen, K.J.; Bansal, R.; Zhu, H.; Whiteman, R.; Amat, J.; Quackenbush, G.A.; Martin, L.; Durkin, K.; Blair, C.; Royal, J.; et al. Hippocampus and amygdala morphology in attention-deficit/hyperactivity disorder. Arch. Gen. Psychiatry 2006, 63, 795–807. [Google Scholar] [CrossRef] [Green Version]
- Amat, J.A.; Bansal, R.; Whiteman, R.; Haggerty, R.; Royal, J.; Peterson, B.S. Correlates of intellectual ability with morphology of the hippocampus and amygdala in healthy adults. Brain Cogn. 2008, 66, 105–114. [Google Scholar] [CrossRef] [PubMed] [Green Version]
- Peterson, B.S.; Bansal, R.; Sawardekar, S.; Nati, C.; Elgabalawy, E.R.; Hoepner, L.A.; Garcia, W.; Hao, X.; Margolis, A.; Perera, F.; et al. Prenatal exposure to air pollution is associated with altered brain structure, function, and metabolism in childhood. J. Child Psychol. Psychiatry 2022, 3, 6–14. [Google Scholar] [CrossRef]
- Littell, R.C.M.; Milliken, G.A.; Stroup, W.W.; Wolfinger, R.D. Sas System for Mixed Models; SAS Institute Inc.: Cary, NC, USA, 1996; p. 633. [Google Scholar]
- Hardin, J.N.; Hilbe, J.M. Generalized Estimating Equations, 2nd ed.; Chapman & Hall/CRC: Boca Raton, FL, USA, 2013; p. 277. [Google Scholar]
- Peterson, B.S.; Wang, Z.; Horga, G.; Warner, V.; Rutherford, B.; Klahr, K.W.; Graniello, B.; Wickramaratne, P.; Garcia, F.; Yu, S.; et al. Discriminating risk and resilience endophenotypes from lifetime illness effects in familial major depressive disorder. JAMA Psychiatry 2014, 71, 136–148. [Google Scholar] [CrossRef] [Green Version]
- Rubinow, D.R.; Schmidt, P.J. Sex differences and the neurobiology of affective disorders. Neuropsychopharmacology 2019, 44, 111–128. [Google Scholar] [CrossRef] [Green Version]
- Small, S.A.; Schobel, S.A.; Buxton, R.B.; Witter, M.P.; Barnes, C.A. A pathophysiological framework of hippocampal dysfunction in ageing and disease. Nat. Rev. Neurosci. 2011, 12, 585–601. [Google Scholar] [CrossRef]
- Fanselow, M.S.; Dong, H.W. Are the dorsal and ventral hippocampus functionally distinct structures? Neuron 2010, 65, 7–19. [Google Scholar] [CrossRef] [Green Version]
- Bast, T.; Feldon, J. Hippocampal modulation of sensorimotor processes. Prog. Neurobiol. 2003, 70, 319–345. [Google Scholar] [CrossRef]
- Bzdok, D.; Laird, A.R.; Zilles, K.; Fox, P.T.; Eickhoff, S.B. An investigation of the structural, connectional, and functional subspecialization in the human amygdala. Hum. Brain Mapp. 2012, 34, 3247–3266. [Google Scholar] [CrossRef] [PubMed] [Green Version]
- Amaral, D.G. The primate amygdala and the neurobiology of social behavior: Implications for understanding social anxiety. Biol. Psychiatry. 2002, 51, 11–17. [Google Scholar] [CrossRef]
- Amaral, D.G.; Schumann, C.M.; Nordahl, C.W. Neuroanatomy of autism. Trends Neurosci. 2008, 31, 137–145. [Google Scholar] [CrossRef] [PubMed]
- Sah, P.; Faber, E.S.; De Armentia, M.L.; Power, J. The amygdaloid complex: Anatomy and physiology. Physiol. Rev. 2003, 83, 803–834. [Google Scholar] [CrossRef] [Green Version]
- Rosene, D.L.; Van Hoesen, G.W. Hippocampal efferents reach widespread areas of cerebral cortex and amygdala in the rhesus monkey. Science 1977, 198, 315–317. [Google Scholar] [CrossRef]
- Peterson, B.S. Form determines function: New methods for identifying the neuroanatomical loci of circuit-based disturbances in childhood disorders. J. Am. Acad. Child Adolesc. Psychiatry 2010, 49, 533–538. [Google Scholar] [CrossRef]
- Cole, J.; Toga, A.W.; Hojatkashani, C.; Thompson, P.; Costafreda, S.G.; Cleare, A.J.; Williams, S.C.; Bullmore, E.T.; Scott, J.L.; Mitterschiffthaler, M.T.; et al. Subregional hippocampal deformations in major depressive disorder. J. Affect. Disord. 2010, 126, 272–277. [Google Scholar] [CrossRef] [Green Version]
- Ballmaier, M.; Narr, K.L.; Toga, A.W.; Elderkin-Thompson, V.; Thompson, P.M.; Hamilton, L.; Haroon, E.; Pham, D.; Heinz, A.; Kumar, A. Hippocampal morphology and distinguishing late-onset from early-onset elderly depression. Am. J. Psychiatry 2008, 165, 229–237. [Google Scholar] [CrossRef] [Green Version]
- Posener, J.A.; Wang, L.; Price, J.L.; Gado, M.H.; Province, M.A.; Miller, M.I.; Babb, C.M.; Csernansky, J.G. High-dimensional mapping of the hippocampus in depression. Am. J. Psychiatry 2003, 160, 83–89. [Google Scholar] [CrossRef]
- Ho, T.C.; Gutman, B.; Pozzi, E.; Grabe, H.J.; Hosten, N.; Wittfeld, K.; Völzke, H.; Baune, B.; Dannlowski, U.; Förster, K.; et al. Subcortical shape alterations in major depressive disorder: Findings from the enigma major depressive disorder working group. Hum. Brain Mapp. 2022, 43, 341–351. [Google Scholar] [CrossRef] [PubMed] [Green Version]
- MacMaster, F.P.; Mirza, Y.; Szeszko, P.R.; Kmiecik, L.E.; Easter, P.C.; Taormina, S.P.; Lynch, M.; Rose, M.; Moore, G.J.; Rosenberg, D.R. Amygdala and hippocampal volumes in familial early onset major depressive disorder. Biol. Psychiatry 2008, 63, 385–390. [Google Scholar] [CrossRef] [PubMed] [Green Version]
- Rao, U.; Chen, L.A.; Bidesi, A.S.; Shad, M.U.; Thomas, M.A.; Hammen, C.L. Hippocampal changes associated with early-life adversity and vulnerability to depression. Biol. Psychiatry 2010, 67, 357–364. [Google Scholar] [CrossRef] [PubMed] [Green Version]
- Chen, M.C.; Hamilton, J.P.; Gotlib, I.H. Decreased hippocampal volume in healthy girls at risk of depression. Arch. Gen. Psychiatry 2010, 67, 270–276. [Google Scholar] [CrossRef] [Green Version]


| Total Sample | Children | Adults | |||||||
|---|---|---|---|---|---|---|---|---|---|
| Characteristic | High-Risk | Low-Risk | p-Value | High-Risk | Low-Risk | p-Value | High-Risk | Low-Risk | p-Value |
| Age | 34.3 (12.7) | 25.2 (13.3) | 0.0001 | 13.1 (3.69) | 13.3 (2.76) | 0.788 | 38.4 (9.23) | 35.5 (9.72) | 0.127 |
| Sex | 35M:46F | 31M:36F | 0.742 | 8M:5F | 16M:15F | 0.395 | 27M:41F | 15M:21F | 0.505 |
| GAS/CGAS | 78.0 (9.48) | 80.9 (9.85) | 0.082 | 78.7 (9.689) | 79.9 (7.621) | 0.701 | 77.7 (9.80) | 82.7 (9.73) | 0.015 |
| SES | 35.2 (7.38) | 34.0 (6.24) | 0.301 | 32.9 (5.520) | 34.0 (5.592) | 0.534 | 35.7 (7.66) | 34.0 (6.83) | 0.281 |
| PPVT IQ | 101.6 (14.54) | 102.7 (11.72) | 0.689 | 109.9 (9.45) | 101.9 (12.45) | 0.103 | 100.0 (14.91) | 103.5 (11.12) | 0.296 |
| Z-score Anxiety Severity | 0.086 (0.903) | −1.094 (0.138) | 0.275 | 0.370 (0.976) | −0.146 (0.988) | 0.149 | 0.036 (0.889) | −0.066 (1.188) | 0.634 |
| Z-score Depression Severity | 0.063 (1.115) | −0.072 (0.843) | 0.425 | −0.021 (1.40) | 0.007 (0.836) | 0.936 | 0.079 (1.07) | −0.143 (0.855) | 0.299 |
| Lifetime MDD (yes, no) | 46.32 | 12.55 | 0.0001 | 1.11 | 0. 31 | 0.279 | 45.21 | 12.24 | 0.001 |
| Lifetime Anxiety (yes, no) | 42.36 | 19.48 | 0.002 | 4.8 | 5.26 | 0.201 | 38.28 | 14.22 | 0.056 |
| Current MDD (yes, no) | 2.76 | 0.67 | 0.189 | 0.12 | 0. 31 | n/a | 2.64 | 0.36 | 0.416 |
| Current Anxiety (yes, no) | 6.72 | 4.63 | 0.472 | 1.11 | 1.30 | 0.485 | 5.61 | 3.33 | 0.585 |
| Volume | High Risk (n = 81) | Low Risk (n = 67) | df | T | p-Value |
|---|---|---|---|---|---|
| Whole Brain (cm3) | 1267.5 (157.5) | 1298.7 (131.3) | 146 | 1.29 | 0.19 |
| Right Hippocampus (mm3) | 3164 (364.0) | 3218.2 (366.3) | 146 | 0.90 | 0.37 |
| Left Hippocampus (mm3) | 3098.9 (381.6) | 3172.3 (360.6) | 146 | 1.19 | 0.23 |
| Right Amygdala (mm3) | 1506.4 (261.4) | 1463 (238.4) | 146 | 1.04 | 0.29 |
| Left Amygdala (mm3) | 1505.5 (253.9) | 1497.5 (225.4) | 146 | 0.20 | 0.84 |
| Adjusted Beta (Risk Group) | p-Value | Adjusted Beta (Risk-by-Sex) | p-Value | |
|---|---|---|---|---|
| Unadjusted for Familial Correlations | −0.59 | 0.006 | −0.02 | 0.95 |
| Corrected with GEE | −0.567 | 0.002 | −0.006 | 0.98 |
| Corrected with Mixed Model | −0.3 | 0.0057 | 0.003 | 0.94 |
| Medication Class | High Risk (n = 77) | Low Risk (n = 65) |
|---|---|---|
| Antidepressant | 17 | 5 |
| Anticonvulsant | 5 | 0 |
| Stimulant | 1 | 1 |
| Benzodiazepines | 4 | 1 |
| Sleeping Pill | 1 | 0 |
| Neuroleptic | 0 | 0 |
| Any psychotropic medication | 20 | 6 |
Publisher’s Note: MDPI stays neutral with regard to jurisdictional claims in published maps and institutional affiliations. |
© 2022 by the authors. Licensee MDPI, Basel, Switzerland. This article is an open access article distributed under the terms and conditions of the Creative Commons Attribution (CC BY) license (https://creativecommons.org/licenses/by/4.0/).
Share and Cite
Peterson, B.S.; Kaur, T.; Baez, M.A.; Whiteman, R.C.; Sawardekar, S.; Sanchez-Peña, J.; Hao, X.; Klahr, K.W.; Talati, A.; Wickramaratne, P.; et al. Morphological Biomarkers in the Amygdala and Hippocampus of Children and Adults at High Familial Risk for Depression. Diagnostics 2022, 12, 1218. https://doi.org/10.3390/diagnostics12051218
Peterson BS, Kaur T, Baez MA, Whiteman RC, Sawardekar S, Sanchez-Peña J, Hao X, Klahr KW, Talati A, Wickramaratne P, et al. Morphological Biomarkers in the Amygdala and Hippocampus of Children and Adults at High Familial Risk for Depression. Diagnostics. 2022; 12(5):1218. https://doi.org/10.3390/diagnostics12051218
Chicago/Turabian StylePeterson, Bradley S., Tejal Kaur, Maria Andrea Baez, Ronald C. Whiteman, Siddhant Sawardekar, Juan Sanchez-Peña, Xuejun Hao, Kristin W. Klahr, Ardesheer Talati, Priya Wickramaratne, and et al. 2022. "Morphological Biomarkers in the Amygdala and Hippocampus of Children and Adults at High Familial Risk for Depression" Diagnostics 12, no. 5: 1218. https://doi.org/10.3390/diagnostics12051218
APA StylePeterson, B. S., Kaur, T., Baez, M. A., Whiteman, R. C., Sawardekar, S., Sanchez-Peña, J., Hao, X., Klahr, K. W., Talati, A., Wickramaratne, P., Weissman, M. M., & Bansal, R. (2022). Morphological Biomarkers in the Amygdala and Hippocampus of Children and Adults at High Familial Risk for Depression. Diagnostics, 12(5), 1218. https://doi.org/10.3390/diagnostics12051218