
Super-Resolution Ultrasound Imaging Can Quantify Alterations in Microbubble Velocities in the Renal Vasculature of Rats

 , ,
, ,  , and
, and 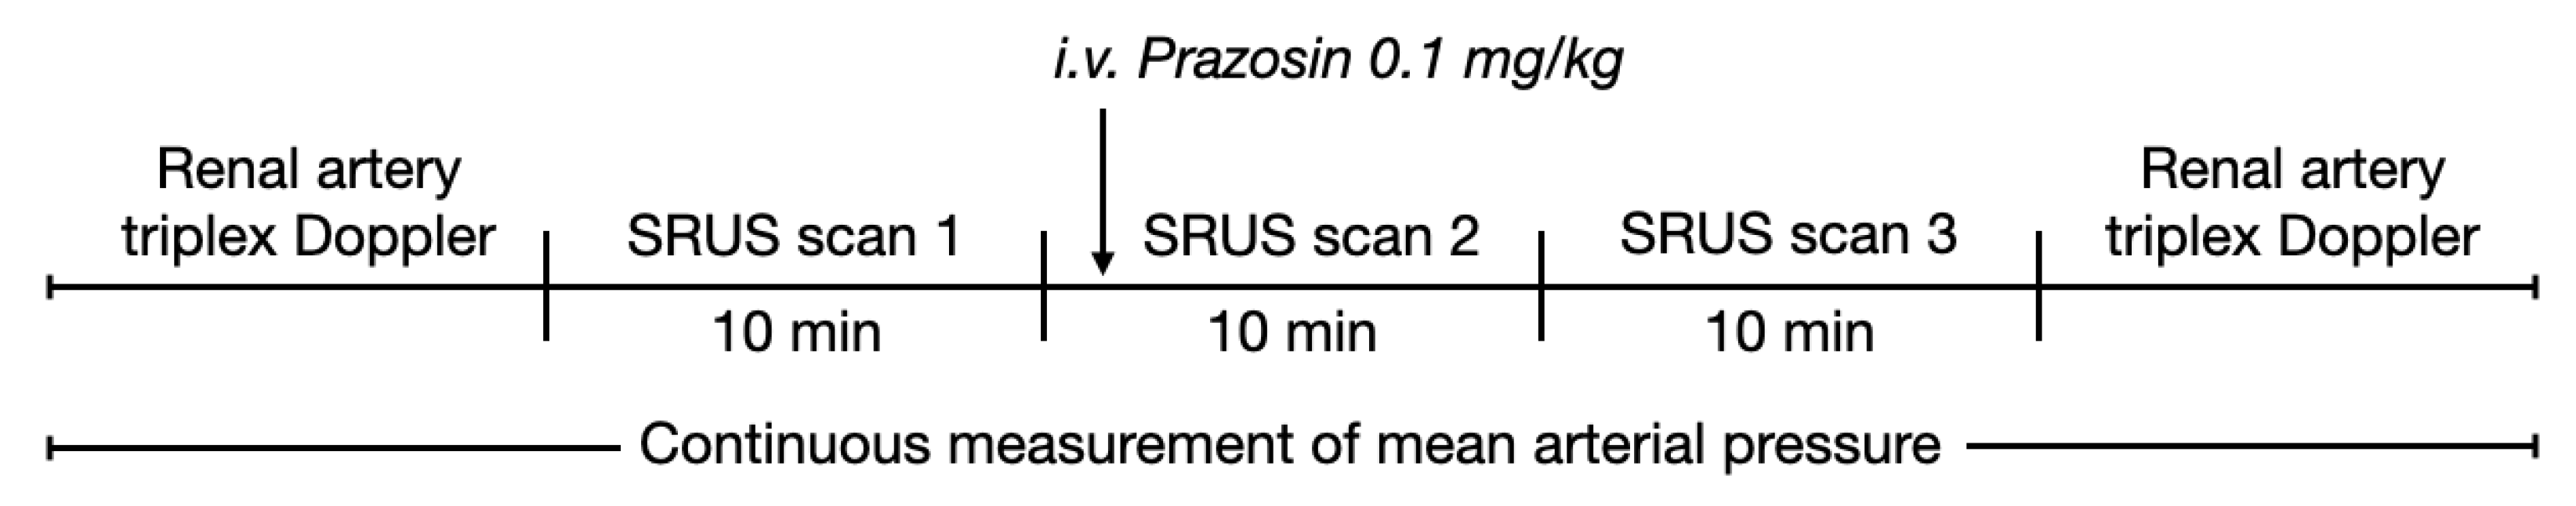
Abstract
1. Introduction
2. Materials and Methods
2.1. Ethical Considerations
2.2. Animal Preparations
2.3. Ultrasound Scanning and Prazosin Injection Procedure
2.4. Super-Resolution Ultrasound Imaging Post-Processing and Region Labeling
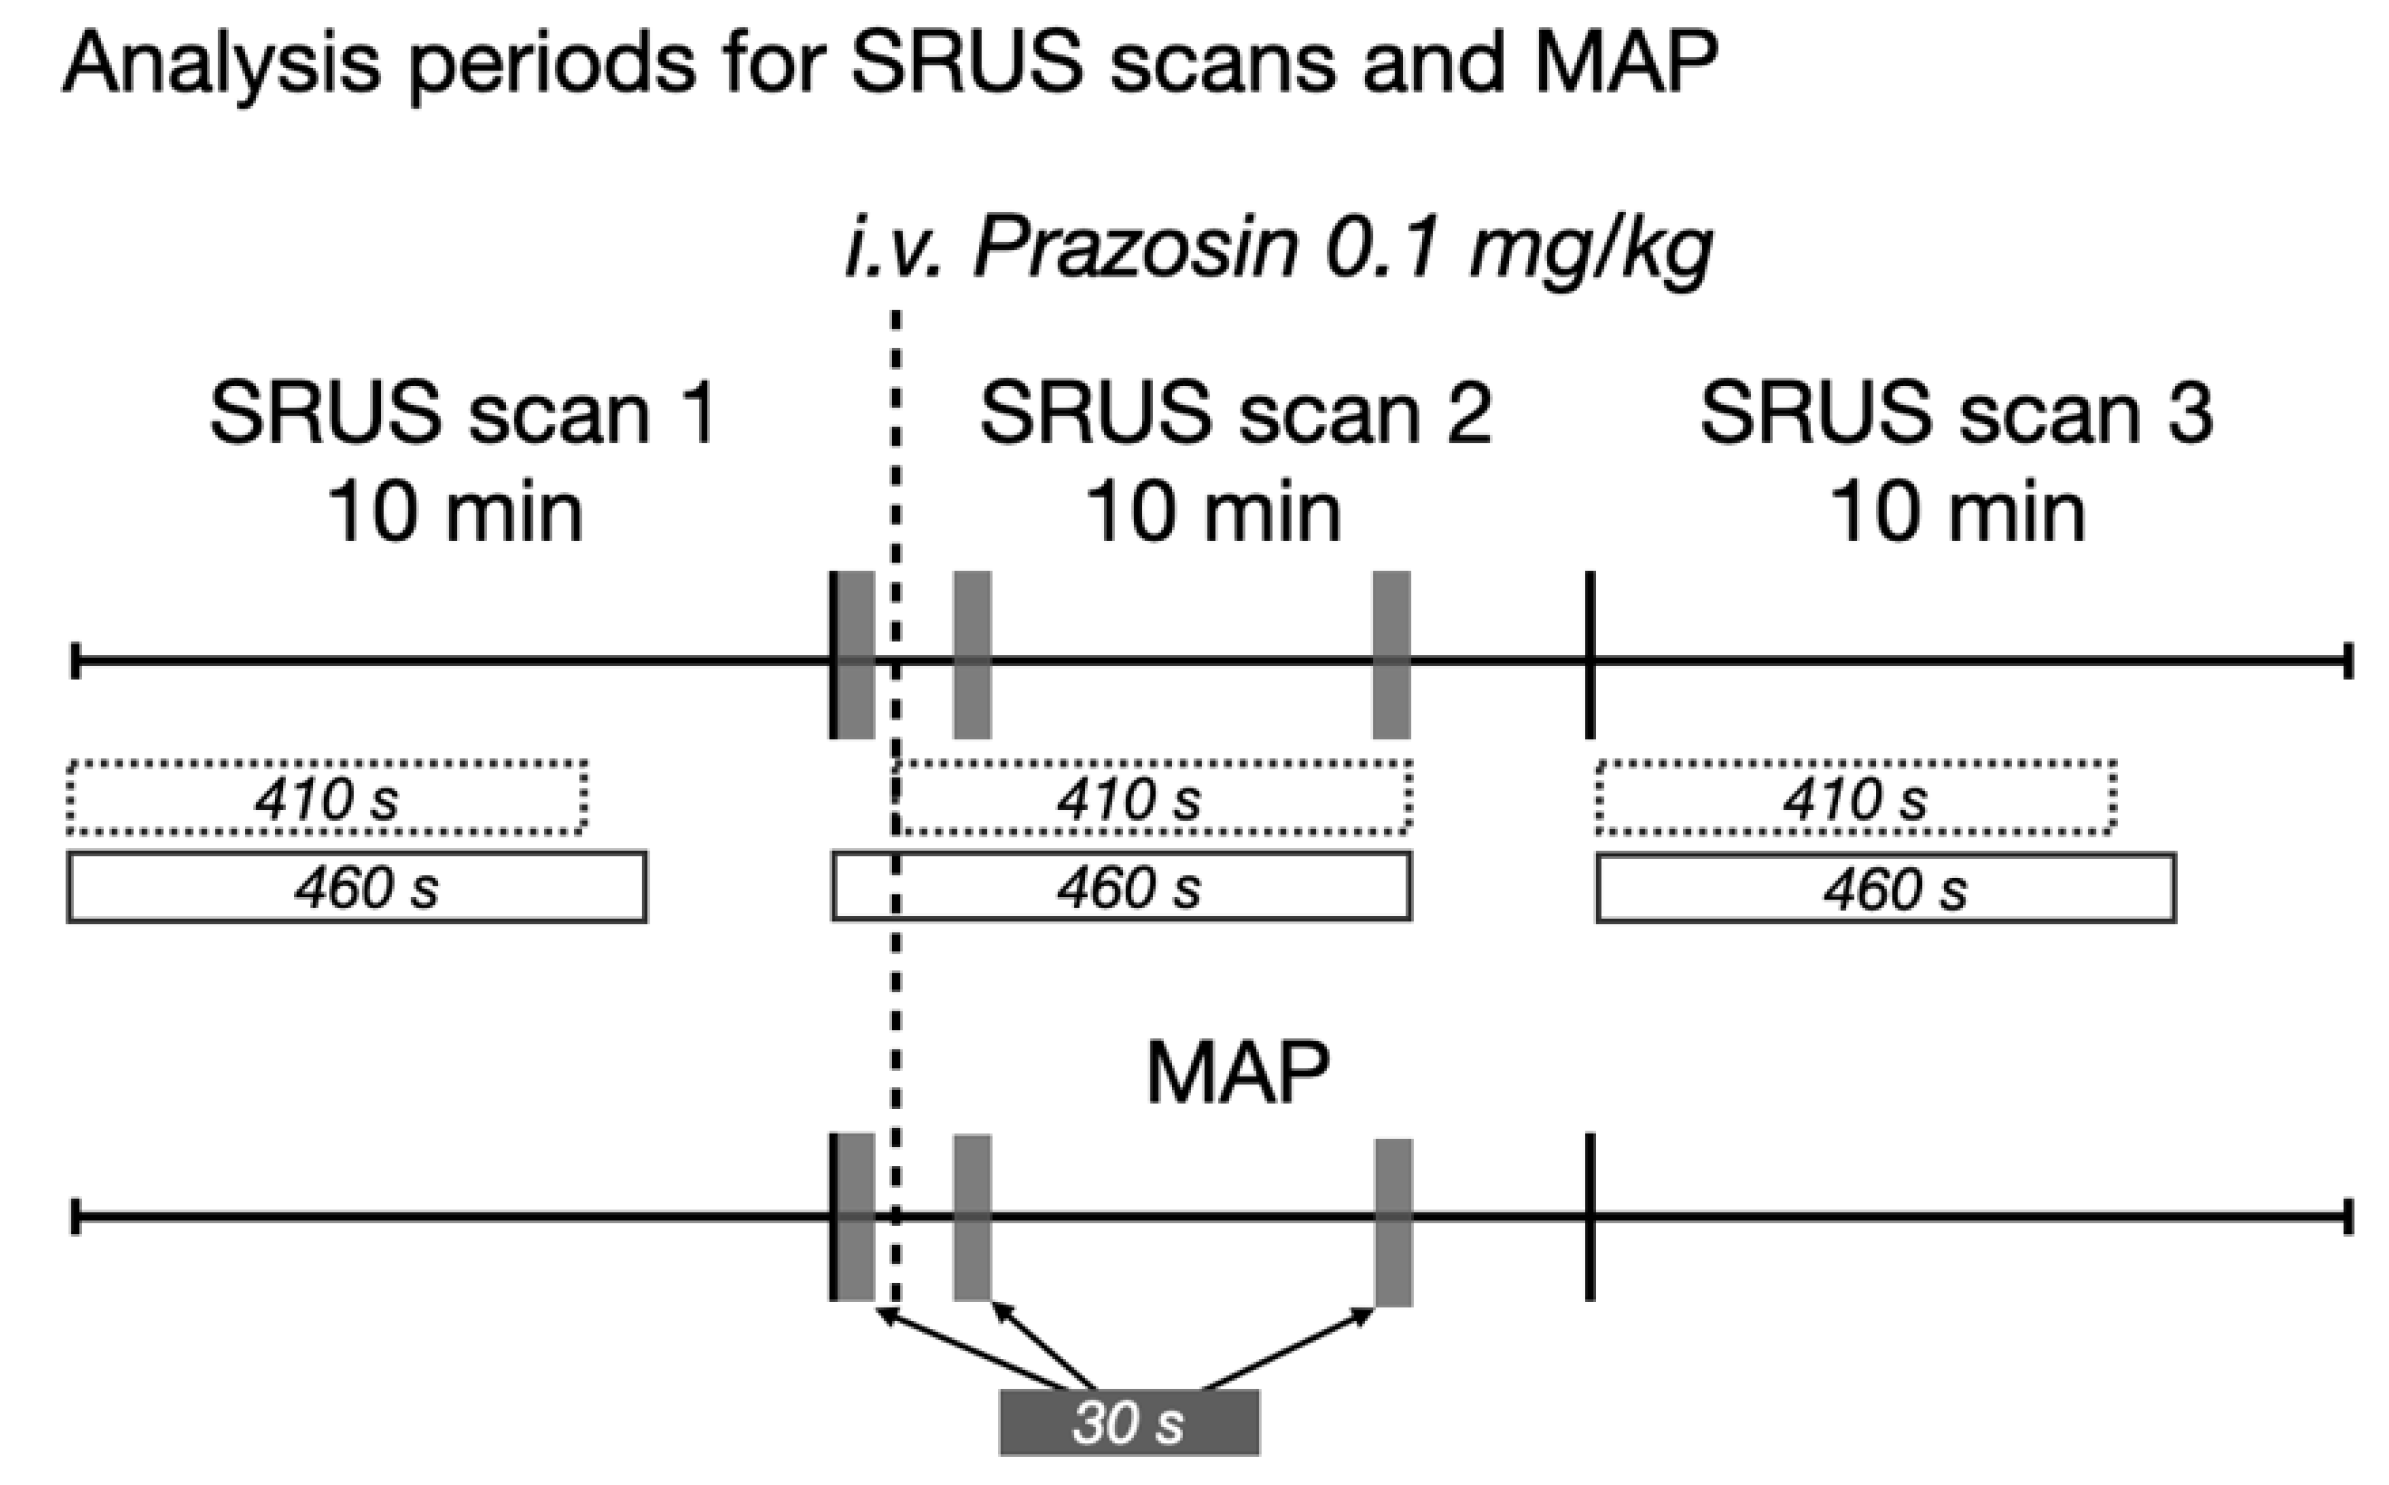
2.5. Microbubble Velocity Estimations
2.6. Statistical Analyses
3. Results
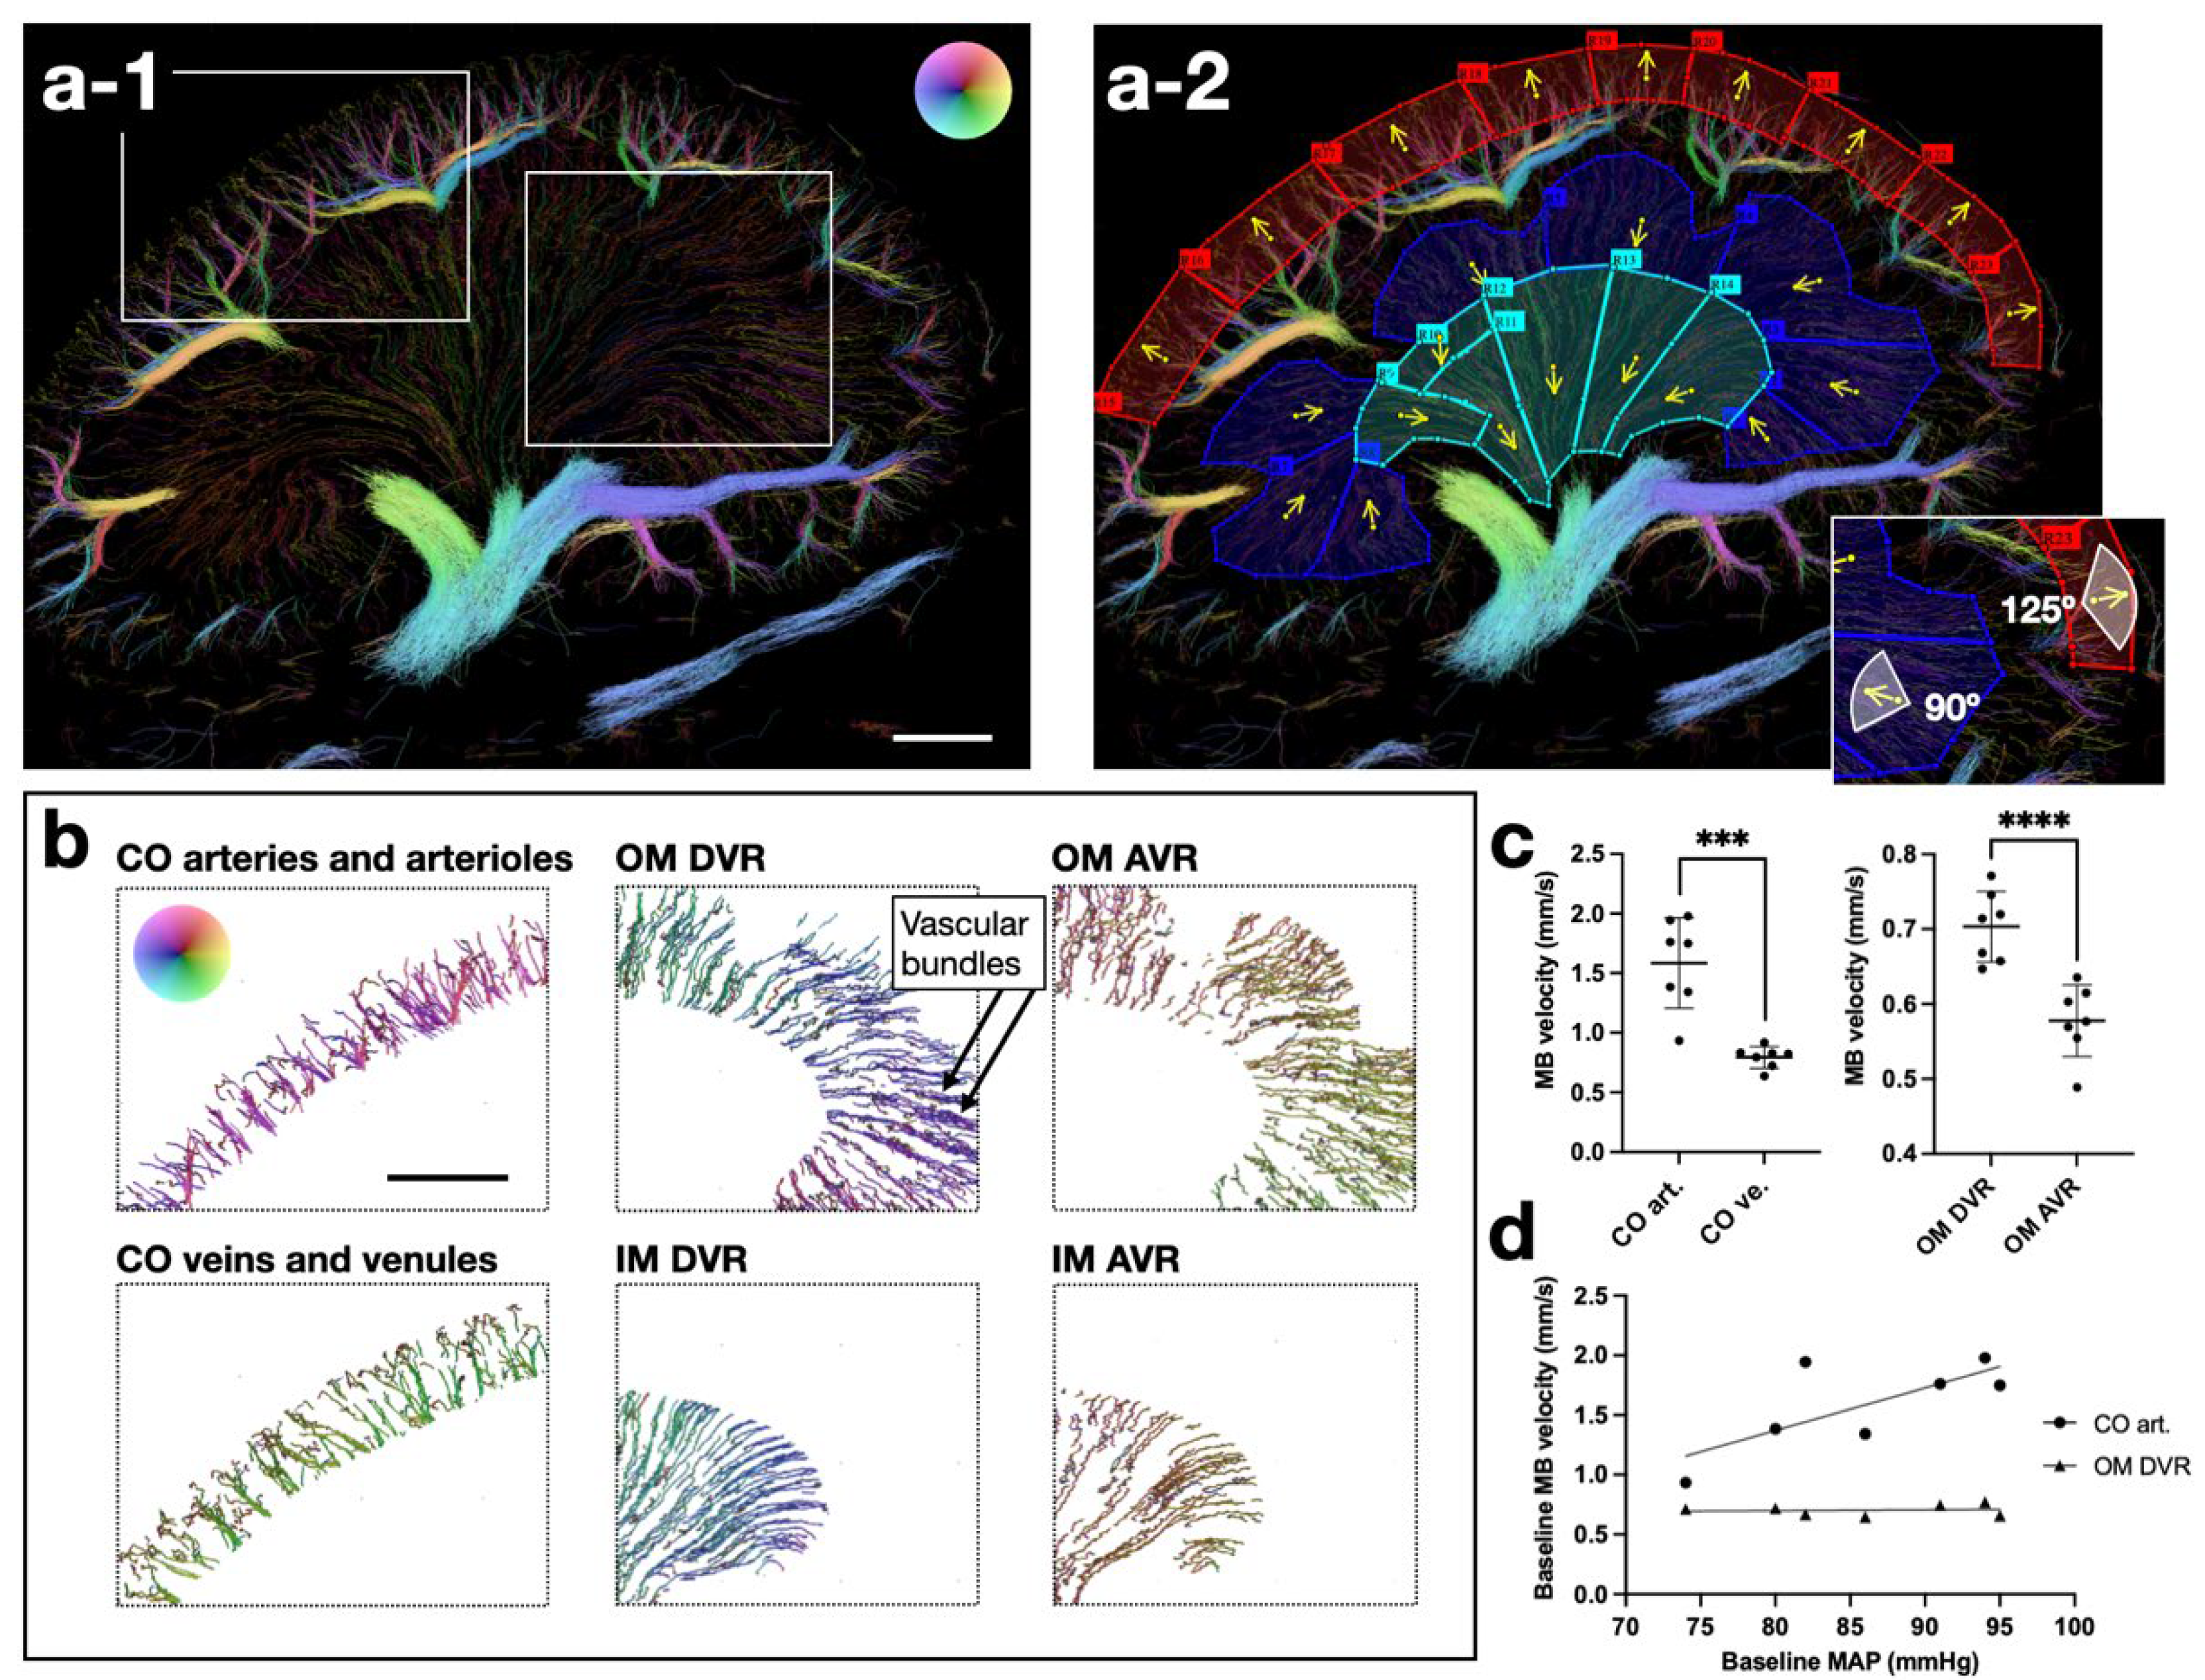
3.1. Segmentation and Analysis of the Normal Renal Vasculature
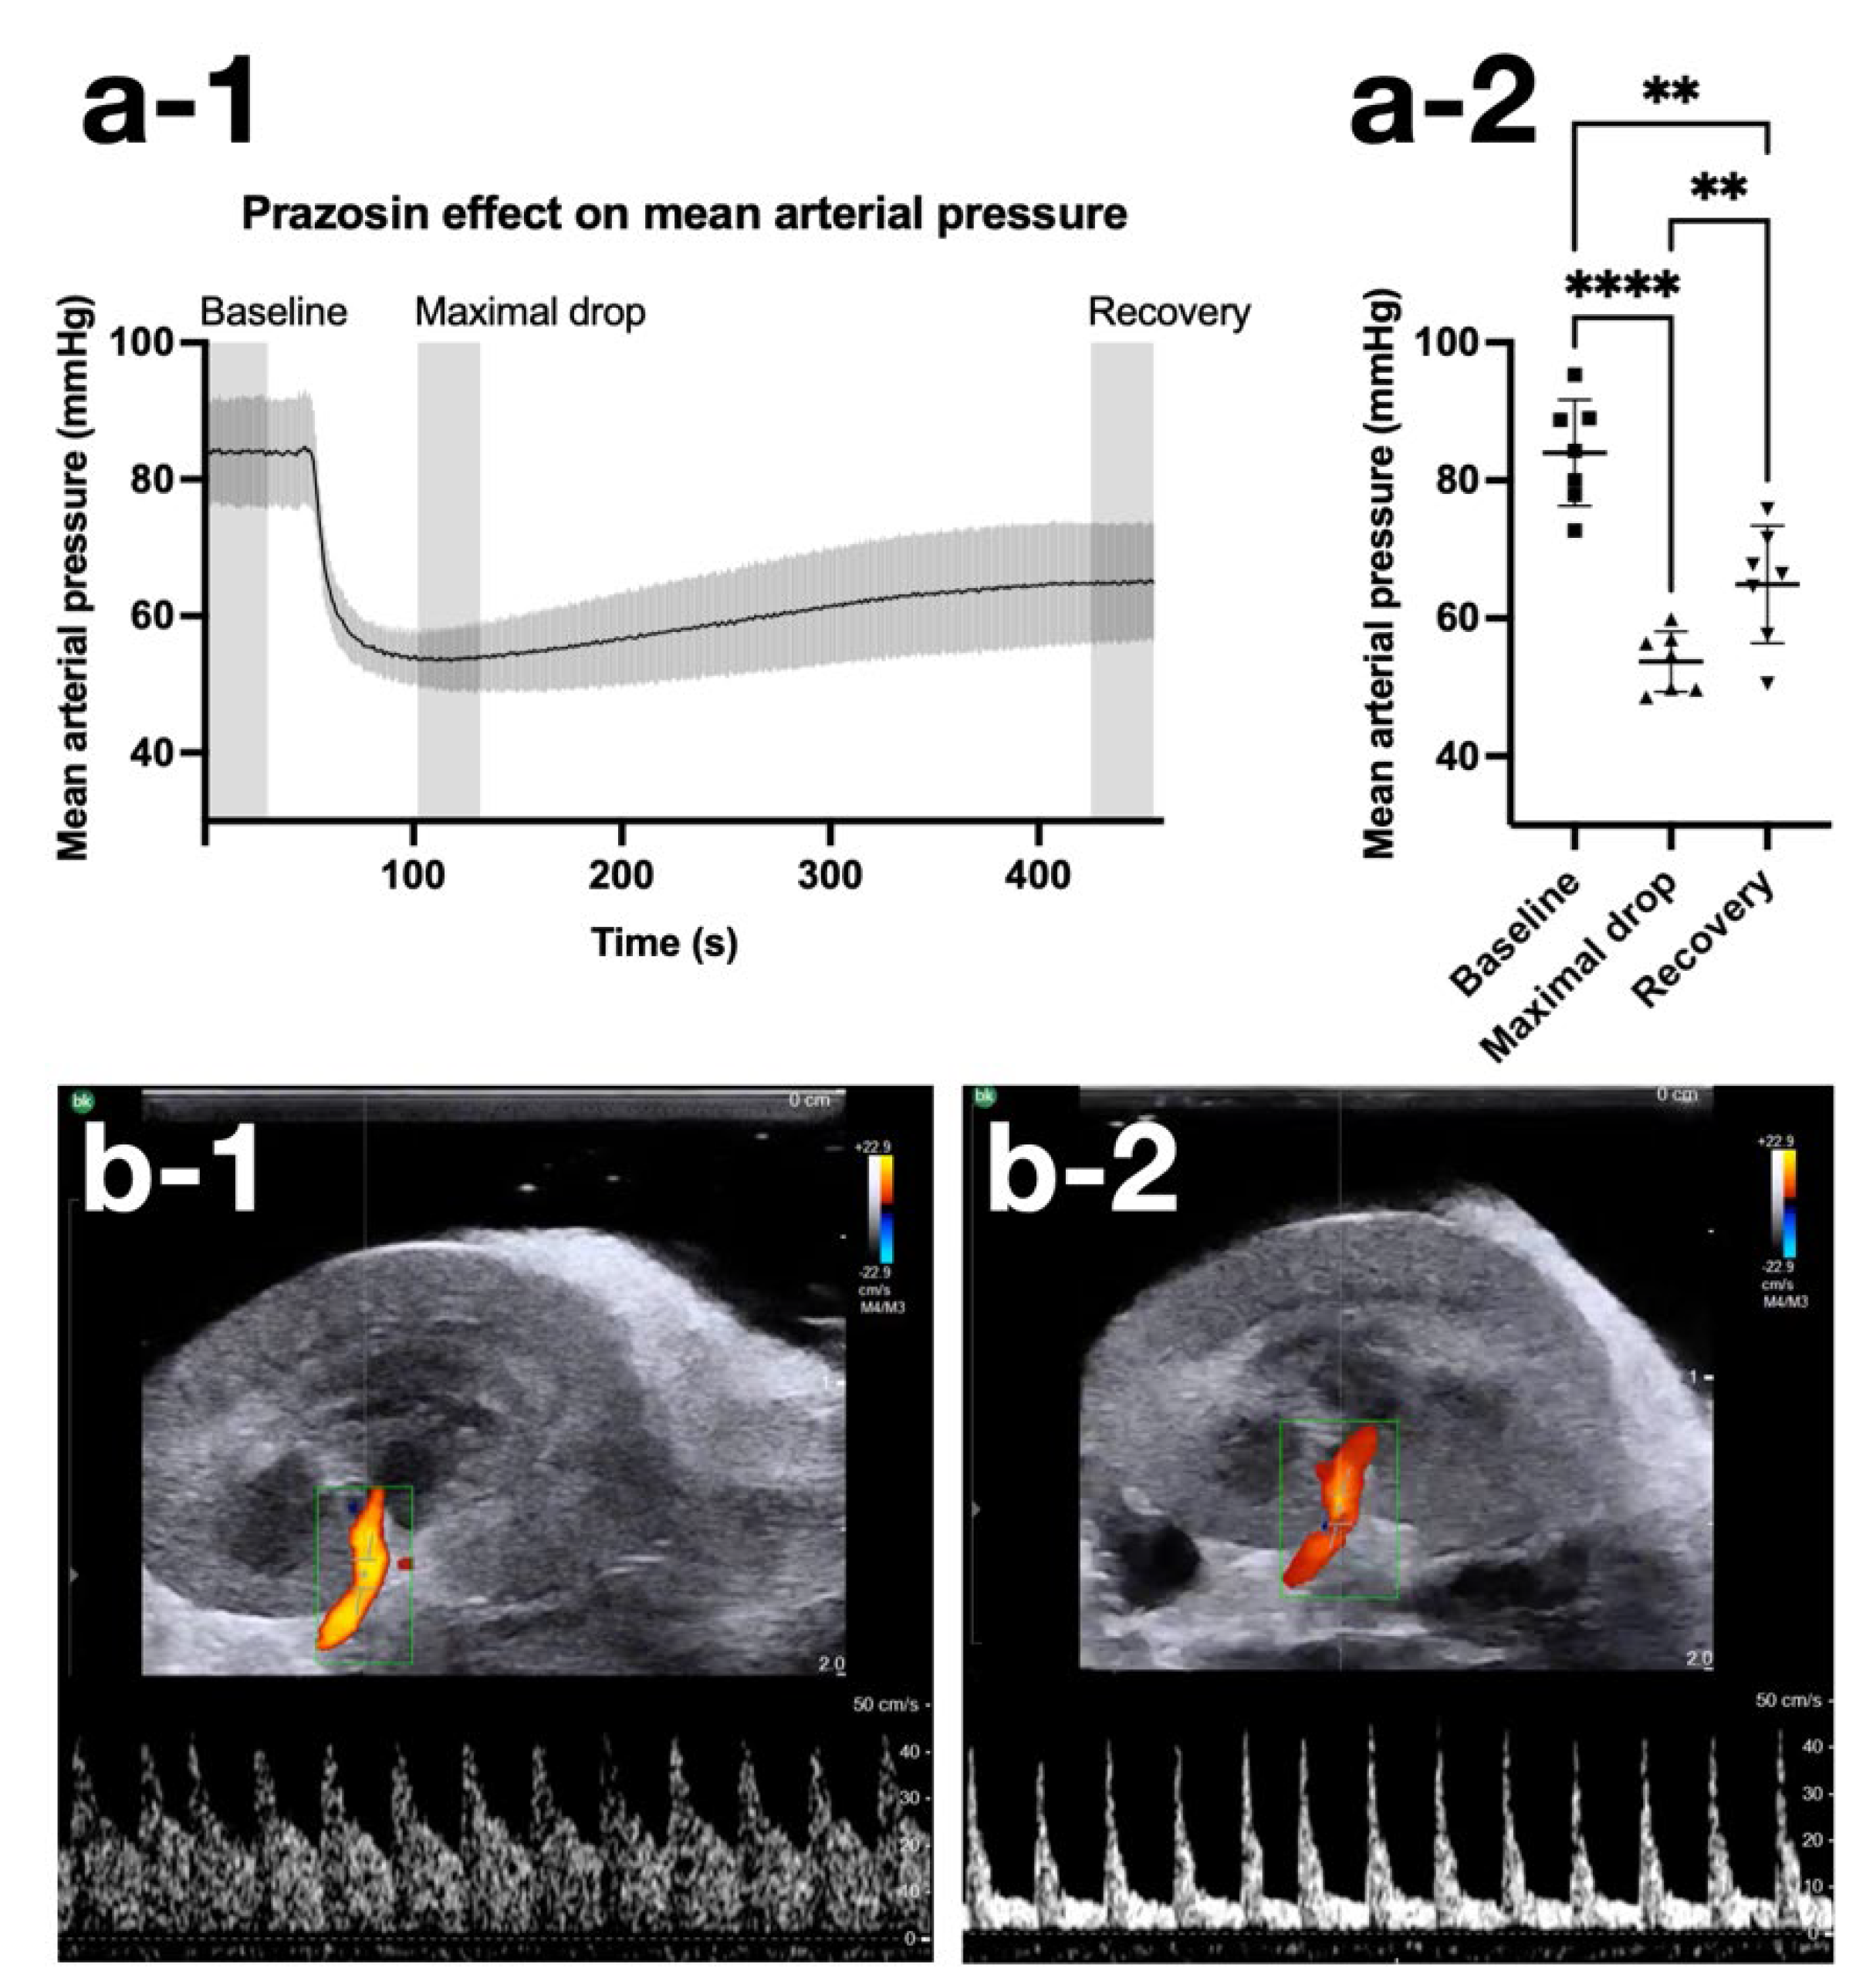
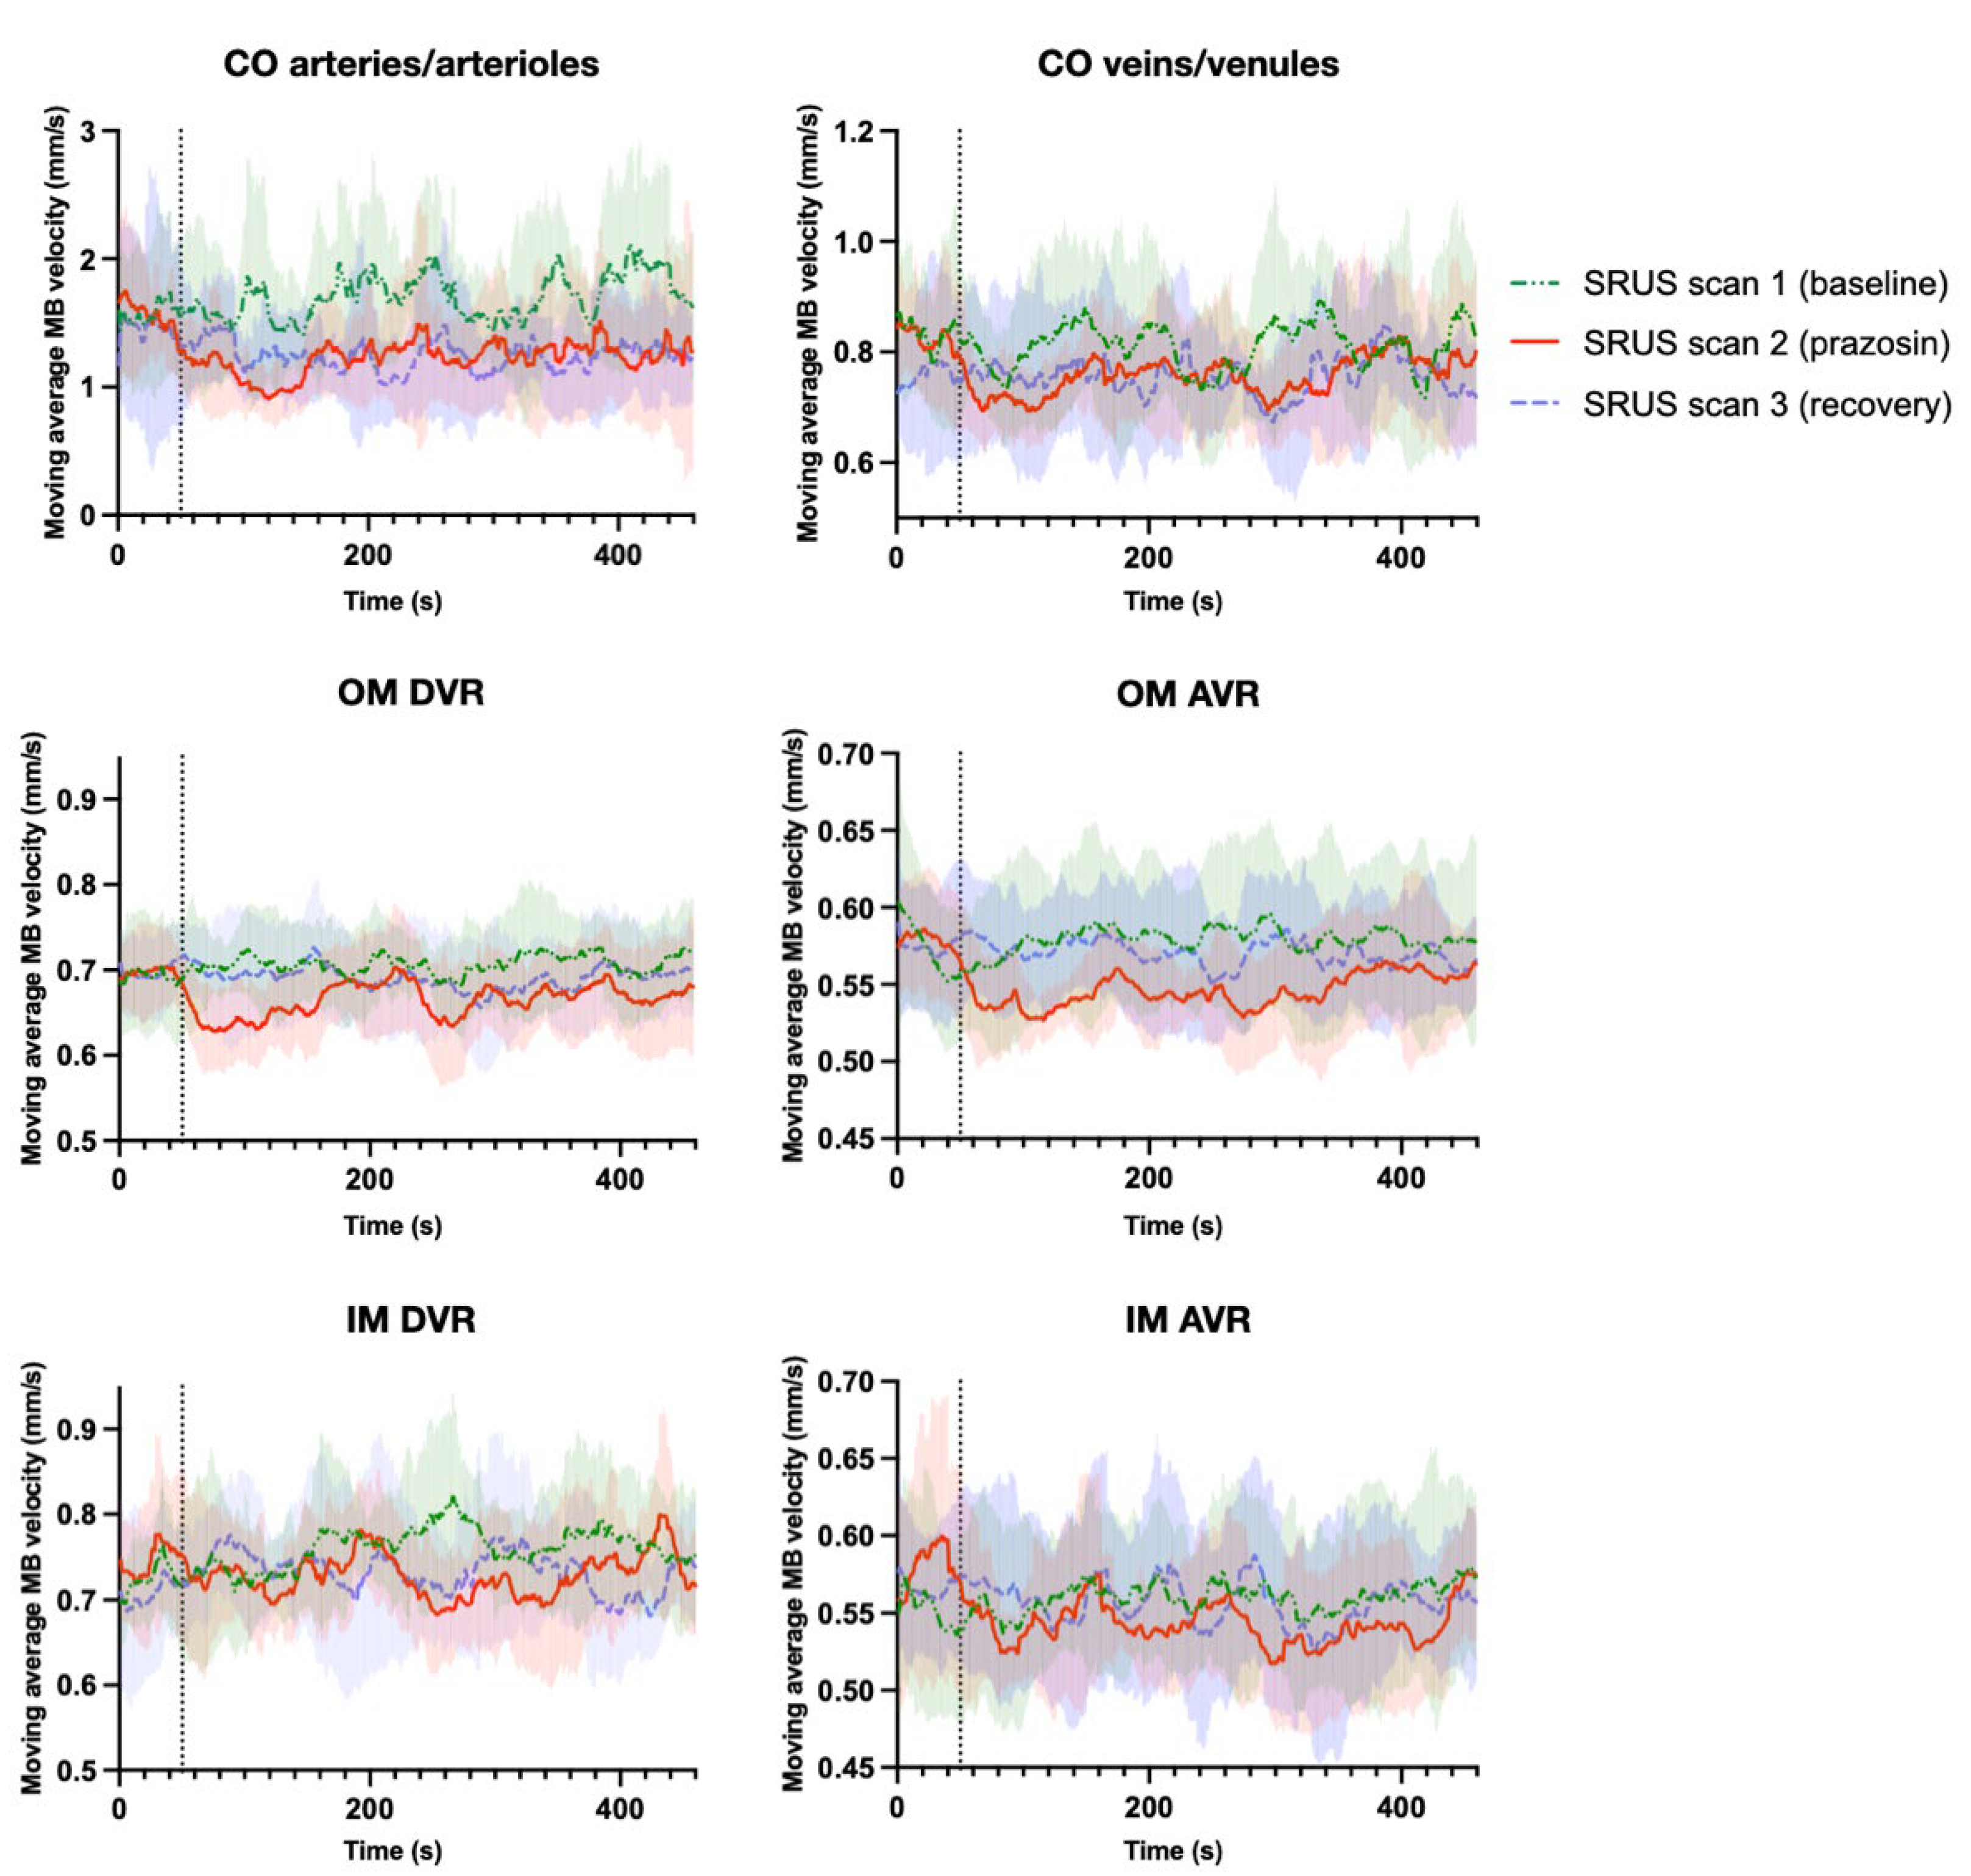
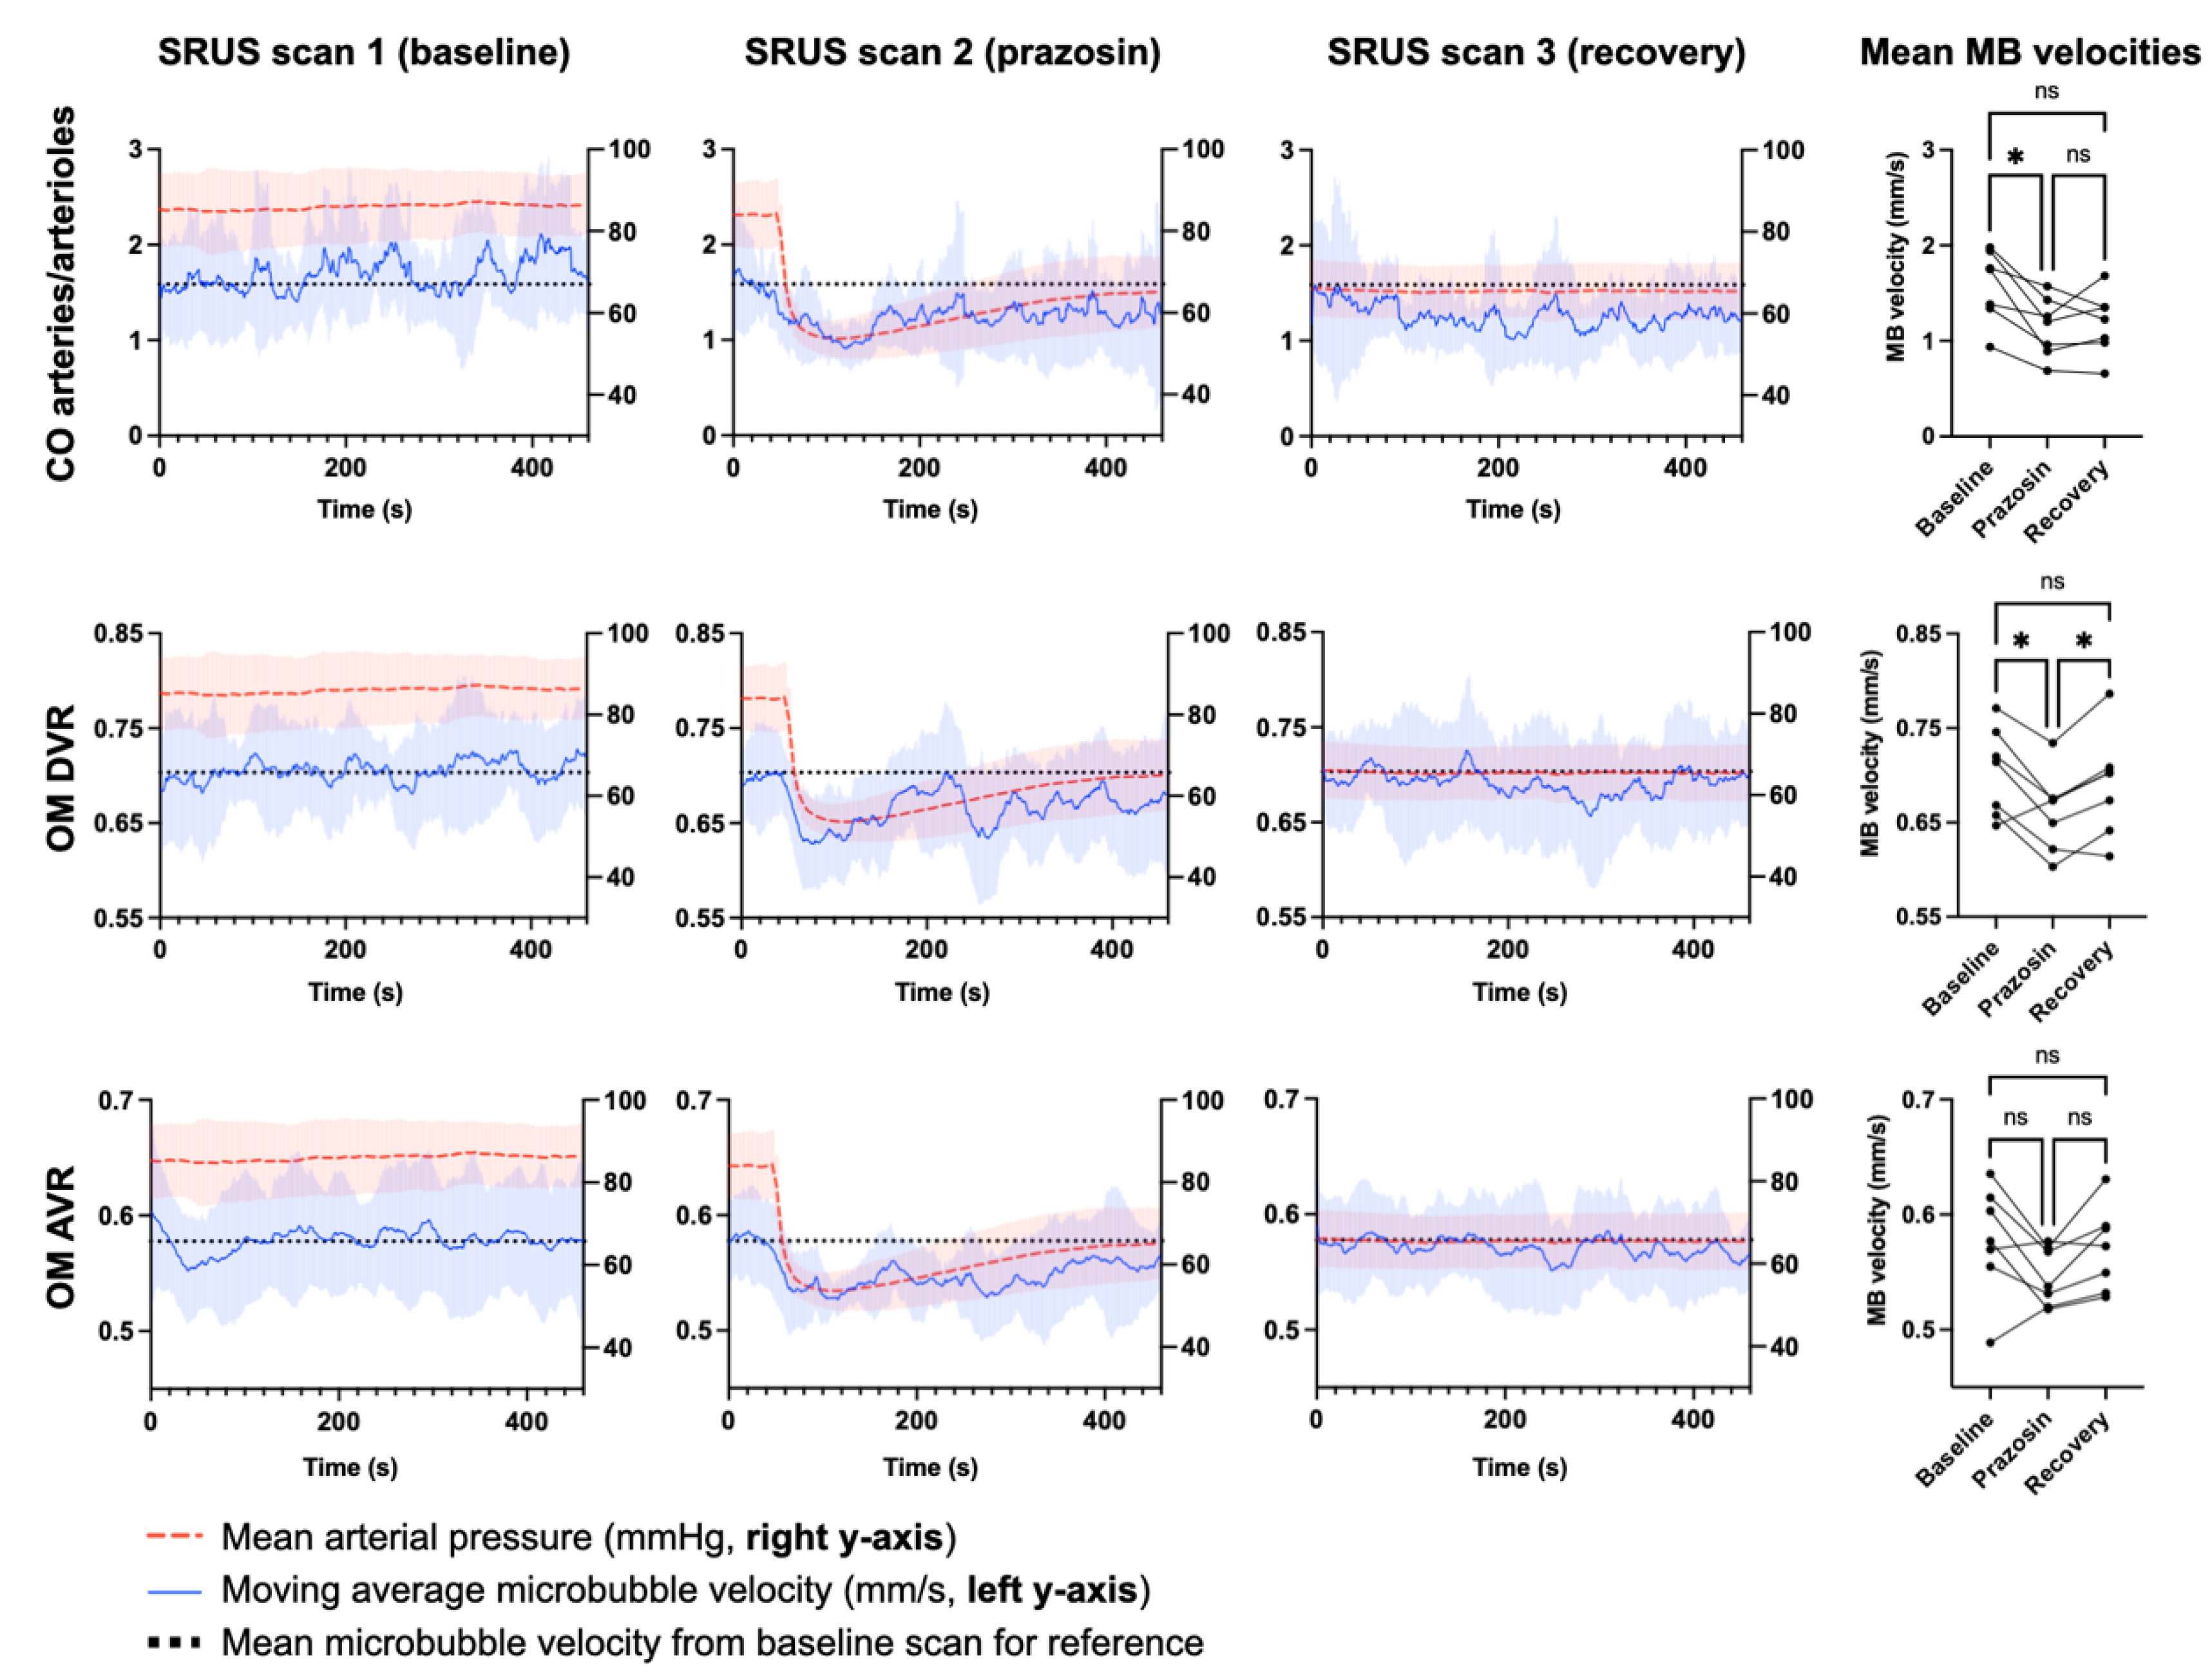
3.2. Effects of Prazosin on MAP and Intrarenal Microbubble Velocities
4. Discussion
5. Conclusions
6. Patents
Supplementary Materials
Author Contributions
Funding
Institutional Review Board Statement
Informed Consent Statement
Data Availability Statement
Acknowledgments
Conflicts of Interest
References
- Christensen-Jeffries, K.; Couture, O.; Dayton, P.A.; Eldar, Y.C.; Hynynen, K.; Kiessling, F.; O’Reilly, M.; Pinton, G.F.; Schmitz, G.; Tang, M.X.; et al. Super-resolution Ultrasound Imaging. Ultrasound Med. Biol. 2020, 46, 865–891. [Google Scholar] [CrossRef] [PubMed]
- Errico, C.; Pierre, J.; Pezet, S.; Desailly, Y.; Lenkei, Z.; Couture, O.; Tanter, M. Ultrafast ultrasound localization microscopy for deep super-resolution vascular imaging. Nature 2015, 527, 499–502. [Google Scholar] [CrossRef]
- Christensen-Jeffries, K.; Browning, R.J.; Tang, M.X.; Dunsby, C.; Eckersley, R.J. In Vivo Acoustic Super-Resolution and Super-Resolved Velocity Mapping Using Microbubbles. IEEE Trans. Med. Imaging 2015, 34, 433–440. [Google Scholar] [CrossRef] [PubMed]
- Keller, M.W.; Segal, S.S.; Kaul, S.; Duling, B. The behavior of sonicated albumin microbubbles within the microcirculation: A basis for their use during myocardial contrast echocardiography. Circ. Res. 1989, 65, 458–467. [Google Scholar] [CrossRef]
- Ismail, S.; Jayaweera, A.R.; Camarano, G.; Gimple, L.W.; Powers, E.R.; Kaul, S. Relation between air-filled albumin microbubble and red blood cell rheology in the human myocardium: Influence of echocardiographic systems and chest wall attenuation. Circulation 1996, 94, 445–451. [Google Scholar] [CrossRef] [PubMed]
- Lindner, J.R.; Song, J.; Jayaweera, A.R.; Sklenar, J.; Kaul, S. Microvascular rheology of definity microbubbles after intra-arterial and intravenous administration. J. Am. Soc. Echocardiogr. 2002, 15, 396–403. [Google Scholar] [CrossRef]
- Schneider, M. Characteristics of SonoVue(TM). In Proceedings of the Echocardiography; John Wiley & Sons, Ltd.: Hoboken, NJ, USA, 1999; Volume 16, pp. 743–746. [Google Scholar]
- Schneider, M.; Arditi, M.; Barrau, M.B.; Brochot, J.; Broillet, A.; Ventrone, R.; Yan, F. BR1: A new ultrasonographic contrast agent based on sulfur hexafluoride-filled microbubbles. Invest. Radiol. 1995, 30, 451–457. [Google Scholar] [CrossRef]
- Tang, S.; Song, P.; Trzasko, J.D.; Lowerison, M.; Huang, C.; Gong, P.; Lok, U.W.; Manduca, A.; Chen, S. Kalman Filter-Based Microbubble Tracking for Robust Super-Resolution Ultrasound Microvessel Imaging. IEEE Trans. Ultrason. Ferroelectr. Freq. Control 2020, 67, 1738–1751. [Google Scholar] [CrossRef]
- Taghavi, I.; Andersen, S.B.; Hoyos, C.A.V.; Schou, M.; Gran, F.; Hansen, K.L.; Nielsen, M.B.; Sørensen, C.M.; Stuart, M.B.; Jensen, J.A. Ultrasound Super-Resolution Imaging with a Hierarchical Kalman Tracker. Ultrasonics 2022, 122, 106695. [Google Scholar] [CrossRef]
- Song, P.; Trzasko, J.D.; Manduca, A.; Huang, R.; Kadirvel, R.; Kallmes, D.F.; Chen, S. Improved Super-Resolution Ultrasound Microvessel Imaging with Spatiotemporal Nonlocal Means Filtering and Bipartite Graph-Based Microbubble Tracking. IEEE Trans. Ultrason. Ferroelectr. Freq. Control 2018, 65, 149–167. [Google Scholar] [CrossRef]
- Huang, C.; Lowerison, M.R.; Trzasko, J.D.; Manduca, A.; Bresler, Y.; Tang, S.; Gong, P.; Lok, U.W.; Song, P.; Chen, S. Short Acquisition Time Super-Resolution Ultrasound Microvessel Imaging via Microbubble Separation. Sci. Rep. 2020, 10, 6007. [Google Scholar] [CrossRef] [PubMed]
- Solomon, O.; Van Sloun, R.J.G.; Wijkstra, H.; Mischi, M.; Eldar, Y.C. Exploiting Flow Dynamics for Superresolution in Contrast-Enhanced Ultrasound. IEEE Trans. Ultrason. Ferroelectr. Freq. Control 2019, 66, 1573–1586. [Google Scholar] [CrossRef] [PubMed]
- Espíndola, D.; Deruiter, R.M.; Santibanez, F.; Dayton, P.A.; Pinton, G. Quantitative sub-resolution blood velocity estimation using ultrasound localization microscopy ex-vivo and in-vivo. Biomed. Phys. Eng. Express 2020, 6, 035019. [Google Scholar] [CrossRef] [PubMed]
- Li, B.; Yao, J.; Kawamura, K.; Oyanagi-Tanaka, Y.; Hoshiyama, M.; Morioka, T.; Gejyo, F.; Uchiyama, M.; Oite, T. Real-time observation of glomerular hemodynamic changes in diabetic rats: Effects of insulin and ARB. Kidney Int. 2004, 66, 1939–1948. [Google Scholar] [CrossRef][Green Version]
- Regner, K.R.; Zuk, A.; Van Why, S.K.; Shames, B.D.; Ryan, R.P.; Falck, J.R.; Manthati, V.L.; McMullen, M.E.; Ledbetter, S.R.; Roman, R.J. Protective effect of 20-HETE analogues in experimental renal ischemia reperfusion injury. Kidney Int. 2009, 75, 511–517. [Google Scholar] [CrossRef]
- Fischer, K.; Meral, F.C.; Zhang, Y.; Vangel, M.G.; Jolesz, F.A.; Ichimura, T.; Bonventre, J. V High-resolution renal perfusion mapping using contrast-enhanced ultrasonography in ischemia-reperfusion injury monitors changes in renal microperfusion. Kidney Int. 2016, 89, 1388–1398. [Google Scholar] [CrossRef]
- Post, E.H.; Kellum, J.A.; Bellomo, R.; Vincent, J.L. Renal perfusion in sepsis: From macro- to microcirculation. Kidney Int. 2017, 91, 45–60. [Google Scholar] [CrossRef]
- Andersen, S.B.; Taghavi, I.; Hoyos, C.A.V.; Søgaard, S.B.; Gran, F.; Lönn, L.; Hansen, K.L.; Jensen, J.A.; Nielsen, M.B.; Sørensen, C.M. Super-resolution imaging with ultrasound for visualization of the renal microvasculature in rats before and after renal ischemia: A pilot study. Diagnostics 2020, 10, 862. [Google Scholar] [CrossRef]
- Chen, Q.; Yu, J.; Rush, B.M.; Stocker, S.D.; Tan, R.J.; Kim, K. Ultrasound super-resolution imaging provides a noninvasive assessment of renal microvasculature changes during mouse acute kidney injury. Kidney Int. 2020, 98, 355–365. [Google Scholar] [CrossRef]
- Opacic, T.; Dencks, S.; Theek, B.; Piepenbrock, M.; Ackermann, D.; Rix, A.; Lammers, T.; Stickeler, E.; Delorme, S.; Schmitz, G.; et al. Motion model ultrasound localization microscopy for preclinical and clinical multiparametric tumor characterization. Nat. Commun. 2018, 9, 1527. [Google Scholar] [CrossRef]
- Lowerison, M.R.; Huang, C.; Lucien, F.; Chen, S.; Song, P. Ultrasound localization microscopy of renal tumor xenografts in chicken embryo is correlated to hypoxia. Sci. Rep. 2020, 10, 2478. [Google Scholar] [CrossRef] [PubMed]
- Yu, J.; Lavery, L.; Kim, K. Super-resolution ultrasound imaging method for microvasculature in vivo with a high temporal accuracy. Sci. Rep. 2018, 8, 13918. [Google Scholar] [CrossRef] [PubMed]
- Chen, Q.; Yu, J.; Lukashova, L.; Latoche, J.D.; Zhu, J.; Lavery, L.; Verdelis, K.; Anderson, C.J.; Kim, K. Validation of Ultrasound Super-Resolution Imaging of Vasa Vasorum in Rabbit Atherosclerotic Plaques. IEEE Trans. Ultrason. Ferroelectr. Freq. Control 2020, 67, 1725–1729. [Google Scholar] [CrossRef] [PubMed]
- Foiret, J.; Zhang, H.; Ilovitsh, T.; Mahakian, L.; Tam, S.; Ferrara, K.W. Ultrasound localization microscopy to image and assess microvasculature in a rat kidney. Sci. Rep. 2017, 7, 13662. [Google Scholar] [CrossRef] [PubMed]
- Huang, C.; Zhang, W.; Gong, P.; Lok, U.W.; Tang, S.; Yin, T.; Zhang, X.; Zhu, L.; Sang, M.; Song, P.; et al. Super-resolution ultrasound localization microscopy based on a high frame-rate clinical ultrasound scanner: An in-human feasibility study. Phys. Med. Biol. 2021, 66, 8. [Google Scholar] [CrossRef] [PubMed]
- Lowerison, M.R.; Sekaran, N.V.C.; Zhang, W.; Dong, Z.; Chen, X.; Llano, D.A.; Song, P. Aging-related cerebral microvascular changes visualized using ultrasound localization microscopy in the living mouse. Sci. Rep. 2022, 12, 619. [Google Scholar] [CrossRef]
- Qian, X.; Huang, C.; Li, R.; Song, B.; Tchelepi, H.; Shung, K.K.; Chen, S.; Humayun, M.; Zhou, Q. Super-resolution Ultrasound Localization Microscopy for Visualization of the Ocular Blood Flow. IEEE Trans. Biomed. Eng. 2021, 69, 1585–1594. [Google Scholar] [CrossRef]
- Qiu, L.; Zhang, J.; Yang, Y.; Zhang, H.; Lee, F.; He, Q.; Huang, C.; Huang, L.; Qian, L.; Luo, J. In vivo assessment of hypertensive nephrosclerosis using ultrasound localization microscopy. Med. Phys. 2022, 49, 2295–2308. [Google Scholar] [CrossRef]
- Taghavi, I.; Andersen, S.B.; Hoyos, C.A.V.; Nielsen, M.B.; Sørensen, C.M.; Jensen, J.A. In vivo Motion Correction in Super Resolution Imaging of Rat Kidneys. IEEE Trans. Ultrason. Ferroelectr. Freq. Control 2021, 68, 3082–3093. [Google Scholar] [CrossRef]
- Nordsletten, D.A.; Blackett, S.; Bentley, M.D.; Ritman, E.L.; Smith, N.P. Structural morphology of renal vasculature. Am. J. Physiol. Heart Circ. Physiol. 2006, 291, 296–309. [Google Scholar] [CrossRef]
- Christensen-Jeffries, K.; Brown, J.; Harput, S.; Zhang, G.; Zhu, J.; Tang, M.X.; Dunsby, C.; Eckersley, R.J. Poisson Statistical Model of Ultrasound Super-Resolution Imaging Acquisition Time. IEEE Trans. Ultrason. Ferroelectr. Freq. Control 2019, 66, 1246–1254. [Google Scholar] [CrossRef] [PubMed]
- Hingot, V.; Errico, C.; Heiles, B.; Rahal, L.; Tanter, M.; Couture, O. Microvascular flow dictates the compromise between spatial resolution and acquisition time in Ultrasound Localization Microscopy. Sci. Rep. 2019, 9, 2456. [Google Scholar] [CrossRef] [PubMed]
- Dencks, S.; Piepenbrock, M.; Schmitz, G. Assessing Vessel Reconstruction in Ultrasound Localization Microscopy by Maximum Likelihood Estimation of a Zero-Inflated Poisson Model. IEEE Trans. Ultrason. Ferroelectr. Freq. Control 2020, 67, 1603–1612. [Google Scholar] [CrossRef] [PubMed]
- Lowerison, M.R.; Huang, C.; Kim, Y.; Lucien, F.; Chen, S.; Song, P. In Vivo Confocal Imaging of Fluorescently Labeled Microbubbles: Implications for Ultrasound Localization Microscopy. IEEE Trans. Ultrason. Ferroelectr. Freq. Control 2020, 67, 1811–1819. [Google Scholar] [CrossRef]
- Postnov, D.D.; Holstein-Rathlou, N.-H.; Sosnovtseva, O. Laser speckle imaging of intra organ drug distribution. Biomed. Opt. Express 2015, 6, 5055. [Google Scholar] [CrossRef]
- Yang, S.; Silldorff, E.P.; Pallone, T.L. Effect of norepinephrine and acetylcholine on outer medullary descending vasa recta. Am. J. Physiol. Heart Circ. Physiol. 1995, 269, H710–H716. [Google Scholar] [CrossRef]
- Saito, H.; Togashi, H.; Yoshioka, M. A comparative study of the effects of α1-adrenoceptor antagonists on sympathetic function in rats. Am. J. Hypertens. 1996, 9, 160S–169S. [Google Scholar] [CrossRef]
- Ren, H.; Gu, L.; Andreasen, A.; Thomsen, J.S.; Cao, L.; Christensen, E.I.; Zhai, X.Y. Spatial organization of the vascular bundle and the interbundle region: Three-dimensional reconstruction at the inner stripe of the outer medulla in the mouse kidney. Am. J. Physiol. Ren. Physiol. 2014, 306, F321–F326. [Google Scholar] [CrossRef]
- Holliger, C.; Lemley, K.V.; Schmitt, S.L.; Thomas, F.C.; Robertson, C.R.; Jamison, R.L. Direct Determination of Vasa Recta Blood Flow in the Rat Renal Papilla. Circ. Res. 1983, 53, 401–413. [Google Scholar] [CrossRef]
- Hansell, P. Evaluation of methods for estimating renal medullary blood flow. Ren. Physiol. Biochem. 1992, 15, 217–230. [Google Scholar] [CrossRef]
- Kennedy-Lydon, T.M.; Crawford, C.; Wildman, S.S.P.; Peppiatt-Wildman, C.M. Renal pericytes: Regulators of medullary blood flow. Acta Physiol. 2013, 207, 212–225. [Google Scholar] [CrossRef] [PubMed]
- Basile, D.P.; Anderson, M.D.; Sutton, T.A. Pathophysiology of acute kidney injury. Compr. Physiol. 2012, 2, 1303–1353. [Google Scholar] [CrossRef] [PubMed]
- Tabrizchi, R.; Pang, C.C.Y. Comparative effects of rauwolscine, prazosin, and phentolamine on blood pressure and cardiac output in anesthetized rats. Can. J. Physiol. Pharmacol. 1987, 65, 1421–1427. [Google Scholar] [CrossRef] [PubMed]
- Luft, F.C.; Veelken, R.; Becker, H.; Ganten, D.; Lang, R.E.; Unger, T. Effect of urapidil, clonidine, and prazosin on sympathetic tone in conscious rats. Hypertension 1986, 8, 303–311. [Google Scholar] [CrossRef] [PubMed]
- Crawford, C.; Kennedy-Lydon, T.; Sprott, C.; Desai, T.; Sawbridge, L.; Munday, J.; Unwin, R.J.; Wildman, S.S.P.; Peppiatt-Wildman, C.M. An intact kidney slice model to investigate vasa recta properties and function in situ. Nephron Physiol. 2012, 120, p17. [Google Scholar] [CrossRef] [PubMed]
- McKenna, O.C.; Angelakos, E.T. Adrenergic innervation of the canine kidney. Circ. Res. 1968, 22, 345–354. [Google Scholar] [CrossRef]
- Correia, A.G.; Bergström, G.; Lawrence, A.J.; Evans, R.G. Renal medullary interstitial infusion of norepinephrine in anesthetized rabbits: Methodological considerations. Am. J. Physiol. Regul. Integr. Comp. Physiol. 1999, 277, R112–R122. [Google Scholar] [CrossRef]
- Edwards, R.M.; Trizna, W. Characterization of α-adrenoceptors on isolated rabbit renal arterioles. Am. J. Physiol. Ren. Fluid Electrolyte Physiol. 1988, 254, F178–F183. [Google Scholar] [CrossRef]
- Park, F.; Mattson, D.L.; Roberts, L.A.; Cowley, A.W. Evidence for the presence of smooth muscle α-actin within pericytes of the renal medulla. Am. J. Physiol. Regul. Integr. Comp. Physiol. 1997, 273, R1742–R1748. [Google Scholar] [CrossRef]
- Moffat, D.B. The fine structure of the blood vessels of the renal medulla with particular reference to the control of the medullary circulation. J. Ultrasructure Res. 1967, 19, 532–545. [Google Scholar] [CrossRef]
- Bourquin, C.; Poree, J.; Lesage, F.; Provost, J. In vivo pulsatility measurement of cerebral microcirculation in rodents using Dynamic Ultrasound Localization Microscopy. IEEE Trans. Med. Imaging 2021, 41, 782–792. [Google Scholar] [CrossRef] [PubMed]
- Bankir, L.; Bouby, N.; Trinh-Trang-Tan, M.-M. The role of the kidney in the maintenance of water balance. In Baillière’s Clinical Endocrinology and Metabolism; Bailliere Tindall: Paris, France, 1989; Volume 3, pp. 249–311. [Google Scholar]
- Christensen-Jeffries, K.; Harput, S.; Brown, J.; Wells, P.N.T.; Aljabar, P.; Dunsby, C.; Tang, M.X.; Eckersley, R.J. Microbubble Axial Localization Errors in Ultrasound Super-Resolution Imaging. IEEE Trans. Ultrason. Ferroelectr. Freq. Control 2017, 64, 1644–1654. [Google Scholar] [CrossRef] [PubMed]
- Zhang, J.; Huang, L.; Liao, H.; Luo, J. Improved Background Noise Suppression in Ultrasound Localization Microscopy using Spatial Coherence Beamforming. In Proceedings of the 2021 IEEE International Ultrasonics Symposium (IUS), Virtual, 11–16 September 2021; pp. 1–4. [Google Scholar]
- Nakamoto, H.; Ogasawara, Y.; Kajiya, F. Visualisation of the effects of dilazep on rat afferent and efferent arterioles in vivo. Hypertens. Res. 2008, 31, 315–324. [Google Scholar] [CrossRef] [PubMed]
- Patzak, A.; Petzhold, D.; Wronski, T.; Martinka, P.; Babu, G.J.; Periasamy, M.; Haase, H.; Morano, I. Constriction velocities of renal afferent and efferent arterioles of mice are not related to SMB expression. Kidney Int. 2005, 68, 2726–2734. [Google Scholar] [CrossRef]
- Andersen, S.B.; Taghavi, I.; Kjer, H.M.; Søgaard, S.B.; Gundlach, C.; Dahl, V.A.; Nielsen, M.B.; Dahl, A.B.; Jensen, J.A.; Sørensen, C.M. Evaluation of 2D super-resolution ultrasound imaging of the rat renal vasculature using ex vivo micro-computed tomography. Sci. Rep. 2021, 11, 24335. [Google Scholar] [CrossRef]
- Hingot, V.; Brodin, C.; Lebrun, F.; Heiles, B.; Chagnot, A.; Yetim, M.; Gauberti, M.; Orset, C.; Tanter, M.; Couture, O.; et al. Early ultrafast ultrasound imaging of cerebral perfusion correlates with ischemic stroke outcomes and responses to treatment in mice. Theranostics 2020, 10, 7480–7491. [Google Scholar] [CrossRef]
- Hoyos, C.A.V.; Stuart, M.B.; Hansen, K.L.; Nielsen, M.B.; Jensen, J.A. Accurate Angle Estimator for High-Frame-Rate 2-D Vector Flow Imaging. IEEE Trans. Ultrason. Ferroelectr. Freq. Control 2016, 63, 842–853. [Google Scholar] [CrossRef]
- Couture, O.; Hingot, V.; Heiles, B.; Muleki-Seya, P.; Tanter, M. Ultrasound localization microscopy and super-resolution: A state-of-the-art. IEEE Trans. Ultrason. Ferroelectr. Freq. Control 2018, 65, 1304–1320. [Google Scholar] [CrossRef]
- McCall, J.R.; Dayton, P.A.; Pinton, G.F. Characterization of the Ultrasound Localization Microscopy Resolution Limit in the Presence of Image Degradation. IEEE Trans. Ultrason. Ferroelectr. Freq. Control 2022, 69, 124–134. [Google Scholar] [CrossRef]


Publisher’s Note: MDPI stays neutral with regard to jurisdictional claims in published maps and institutional affiliations. |
© 2022 by the authors. Licensee MDPI, Basel, Switzerland. This article is an open access article distributed under the terms and conditions of the Creative Commons Attribution (CC BY) license (https://creativecommons.org/licenses/by/4.0/).
Share and Cite
Andersen, S.B.; Taghavi, I.; Søgaard, S.B.; Hoyos, C.A.V.; Nielsen, M.B.; Jensen, J.A.; Sørensen, C.M. Super-Resolution Ultrasound Imaging Can Quantify Alterations in Microbubble Velocities in the Renal Vasculature of Rats. Diagnostics 2022, 12, 1111. https://doi.org/10.3390/diagnostics12051111
Andersen SB, Taghavi I, Søgaard SB, Hoyos CAV, Nielsen MB, Jensen JA, Sørensen CM. Super-Resolution Ultrasound Imaging Can Quantify Alterations in Microbubble Velocities in the Renal Vasculature of Rats. Diagnostics. 2022; 12(5):1111. https://doi.org/10.3390/diagnostics12051111
Chicago/Turabian StyleAndersen, Sofie Bech, Iman Taghavi, Stinne Byrholdt Søgaard, Carlos Armando Villagómez Hoyos, Michael Bachmann Nielsen, Jørgen Arendt Jensen, and Charlotte Mehlin Sørensen. 2022. "Super-Resolution Ultrasound Imaging Can Quantify Alterations in Microbubble Velocities in the Renal Vasculature of Rats" Diagnostics 12, no. 5: 1111. https://doi.org/10.3390/diagnostics12051111
APA StyleAndersen, S. B., Taghavi, I., Søgaard, S. B., Hoyos, C. A. V., Nielsen, M. B., Jensen, J. A., & Sørensen, C. M. (2022). Super-Resolution Ultrasound Imaging Can Quantify Alterations in Microbubble Velocities in the Renal Vasculature of Rats. Diagnostics, 12(5), 1111. https://doi.org/10.3390/diagnostics12051111