
Fine-Tuned Siamese Network with Modified Enhanced Super-Resolution GAN Plus Based on Low-Quality Chest X-ray Images for COVID-19 Identification

 ,
,  ,
,  , , ,
, , ,  and
and
Abstract
:1. Introduction
2. Related Works
Imaging-Based Diagnosis of COVID-19
3. Methodology
3.1. Problem Statement
3.2. Datasets
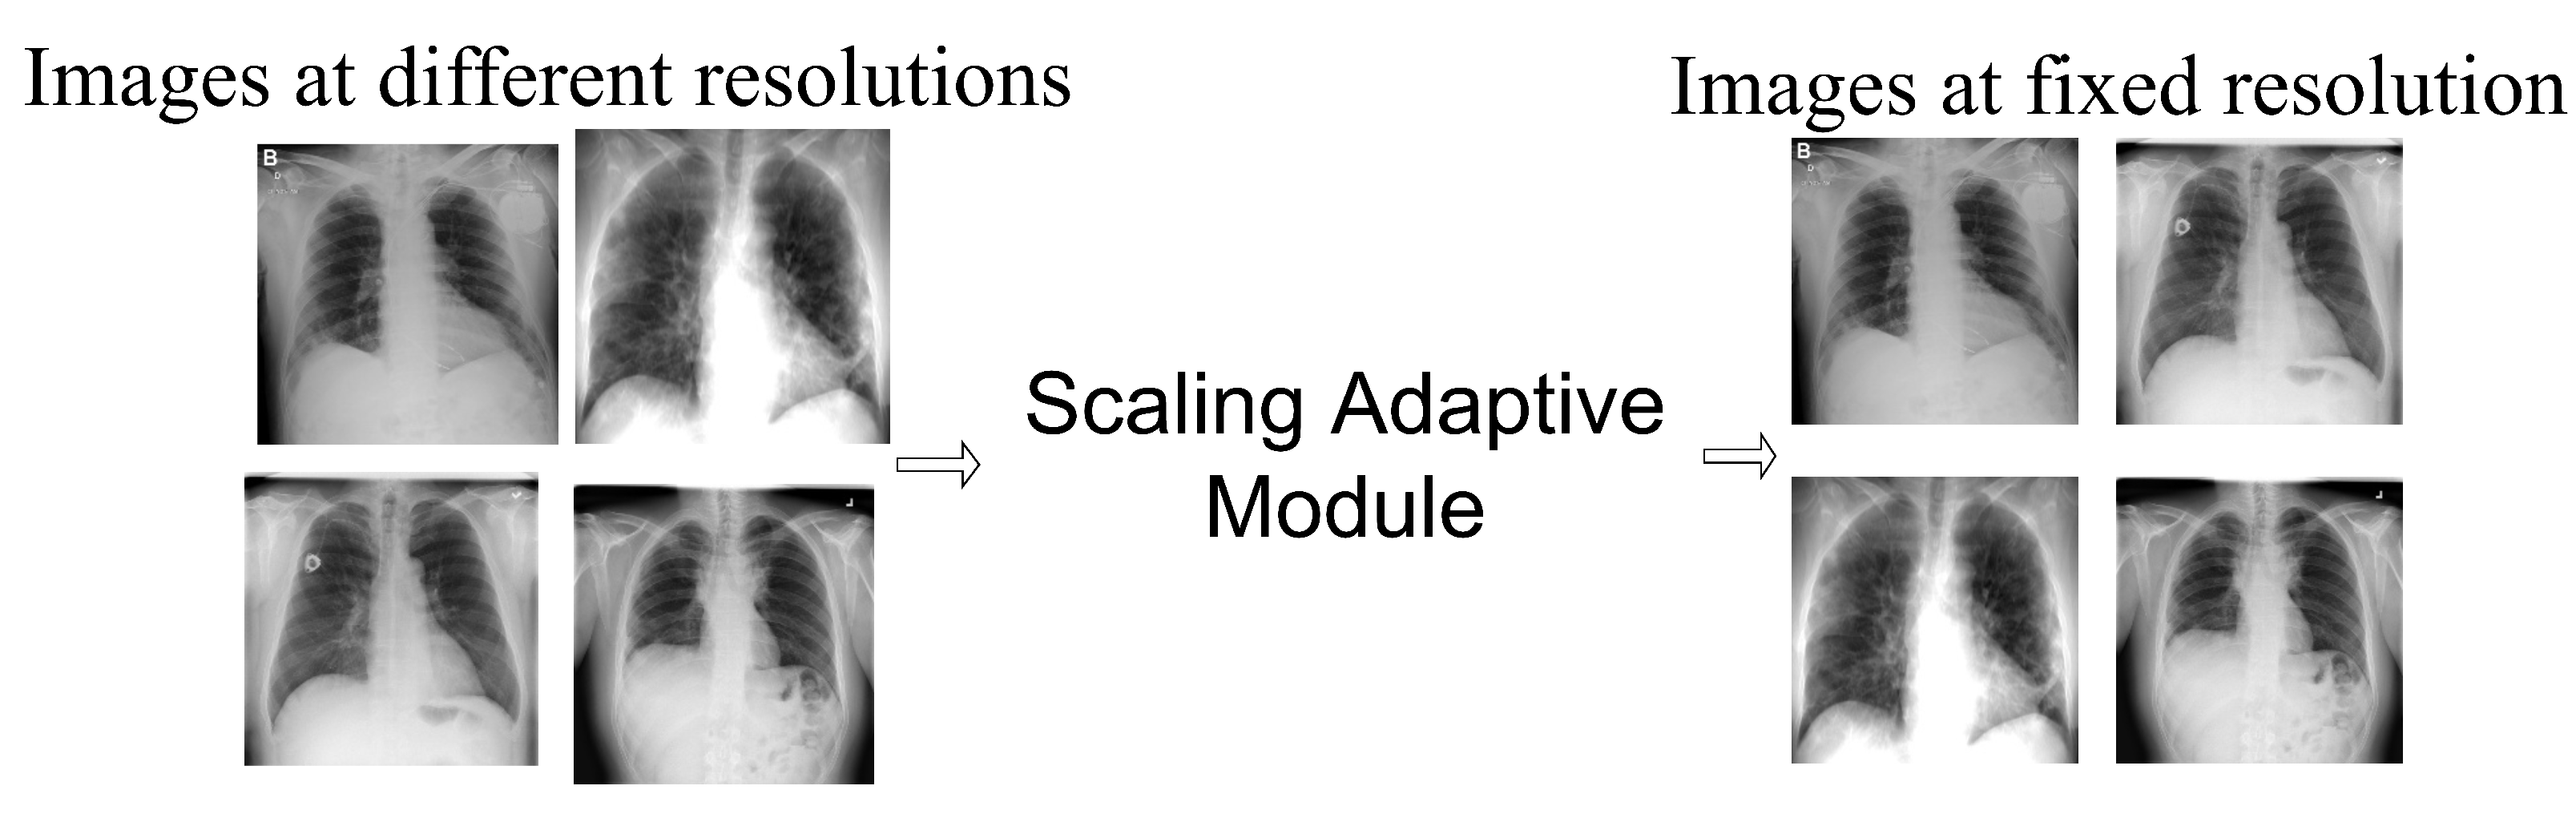
Image Scale-Based Adaptive Module
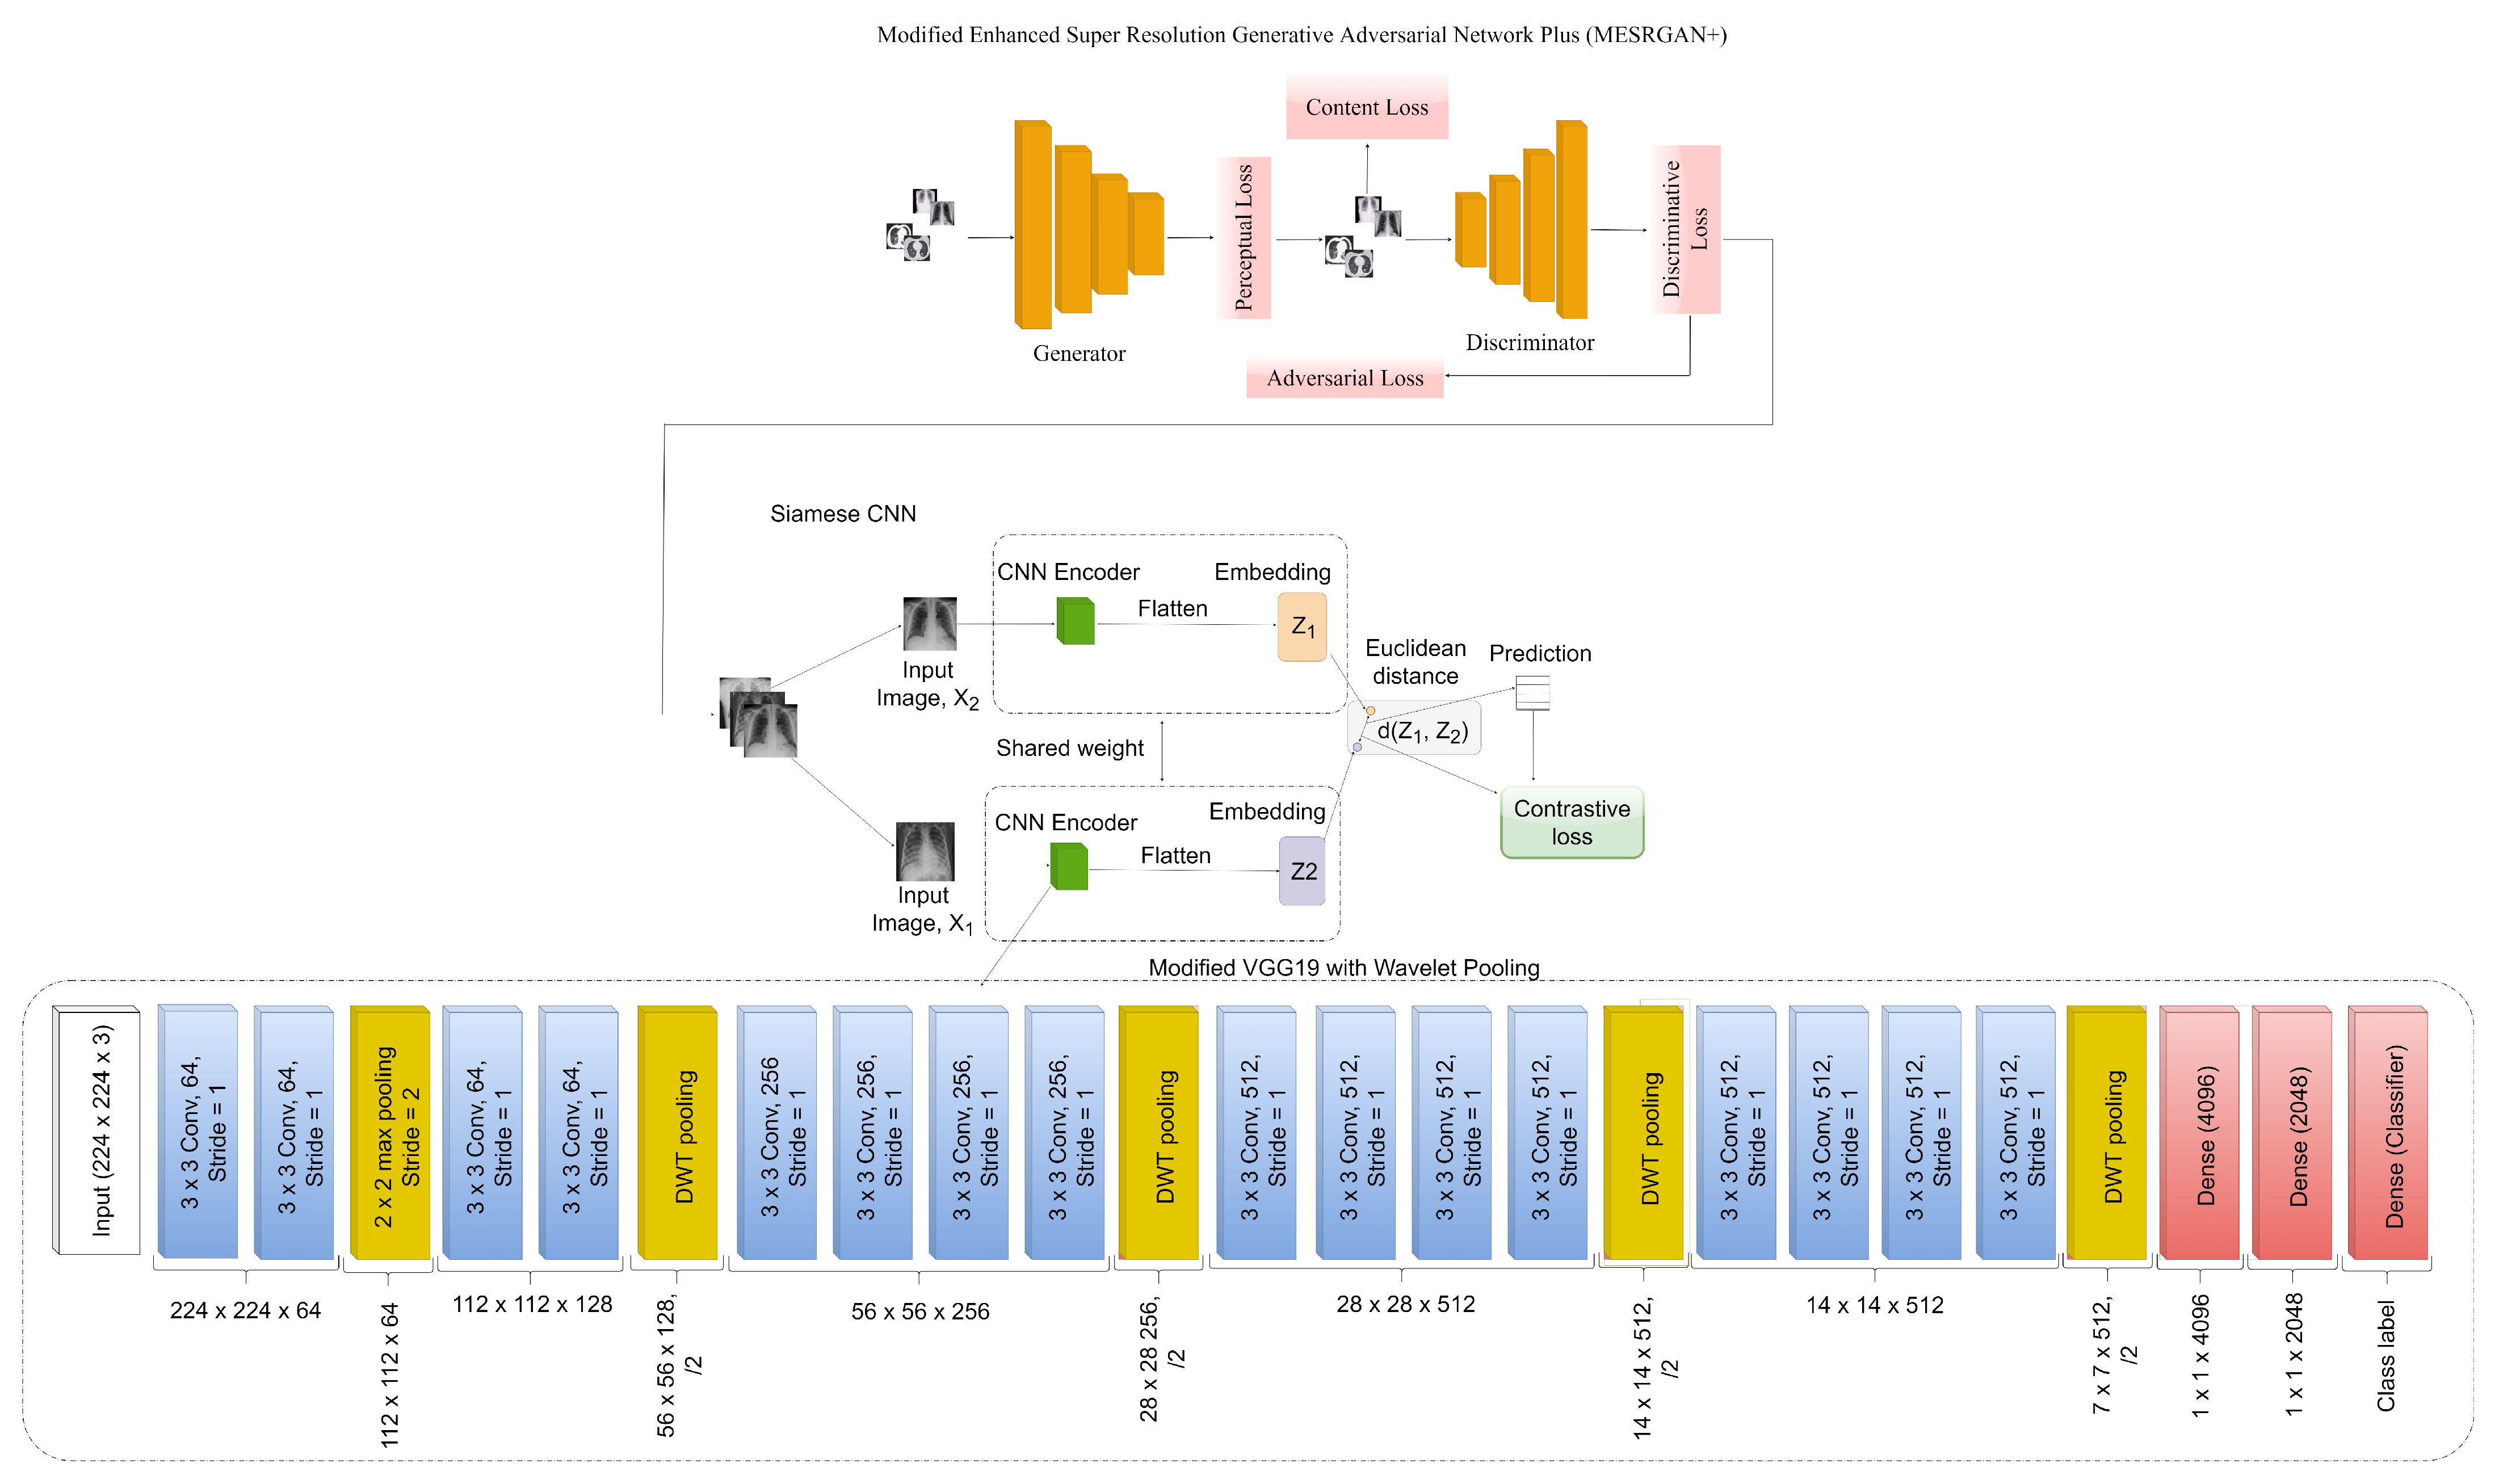
3.3. COVID-SRSNet Identification Architecture
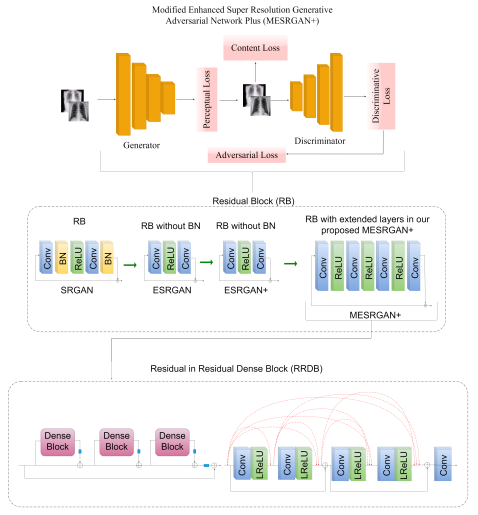
3.3.1. Modified Enhanced Super-Resolution GAN plus (MESRGAN+)
3.3.2. Transition of Super Resolution by GAN
3.4. The Proposed MESRGAN+ Architecture
3.4.1. Perceptual Loss
3.4.2. Content Loss
3.4.3. Relativistic Loss
3.5. Enhanced Siamese Fine-Tuned Model with Wavelet Pooling (ESFMWP)
4. Experiments
4.1. Experimental Setup
4.2. Implementation Details
4.3. Evaluation
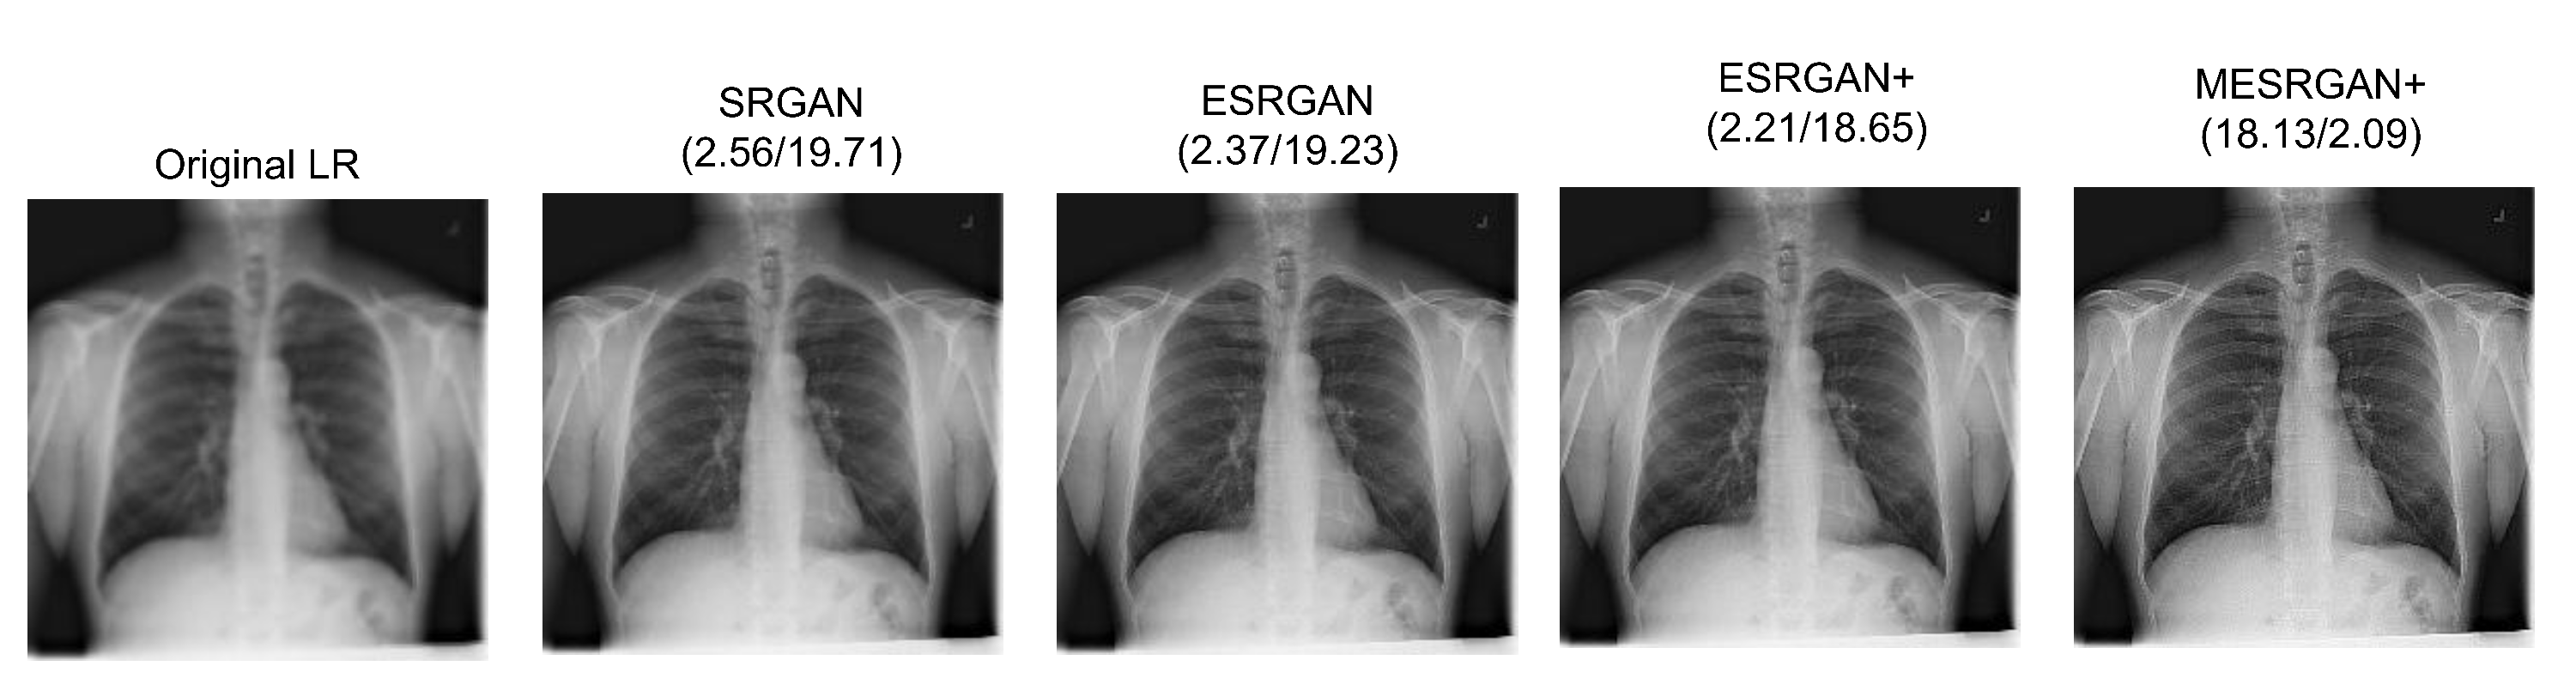
4.4. Super-Resolution Evaluation
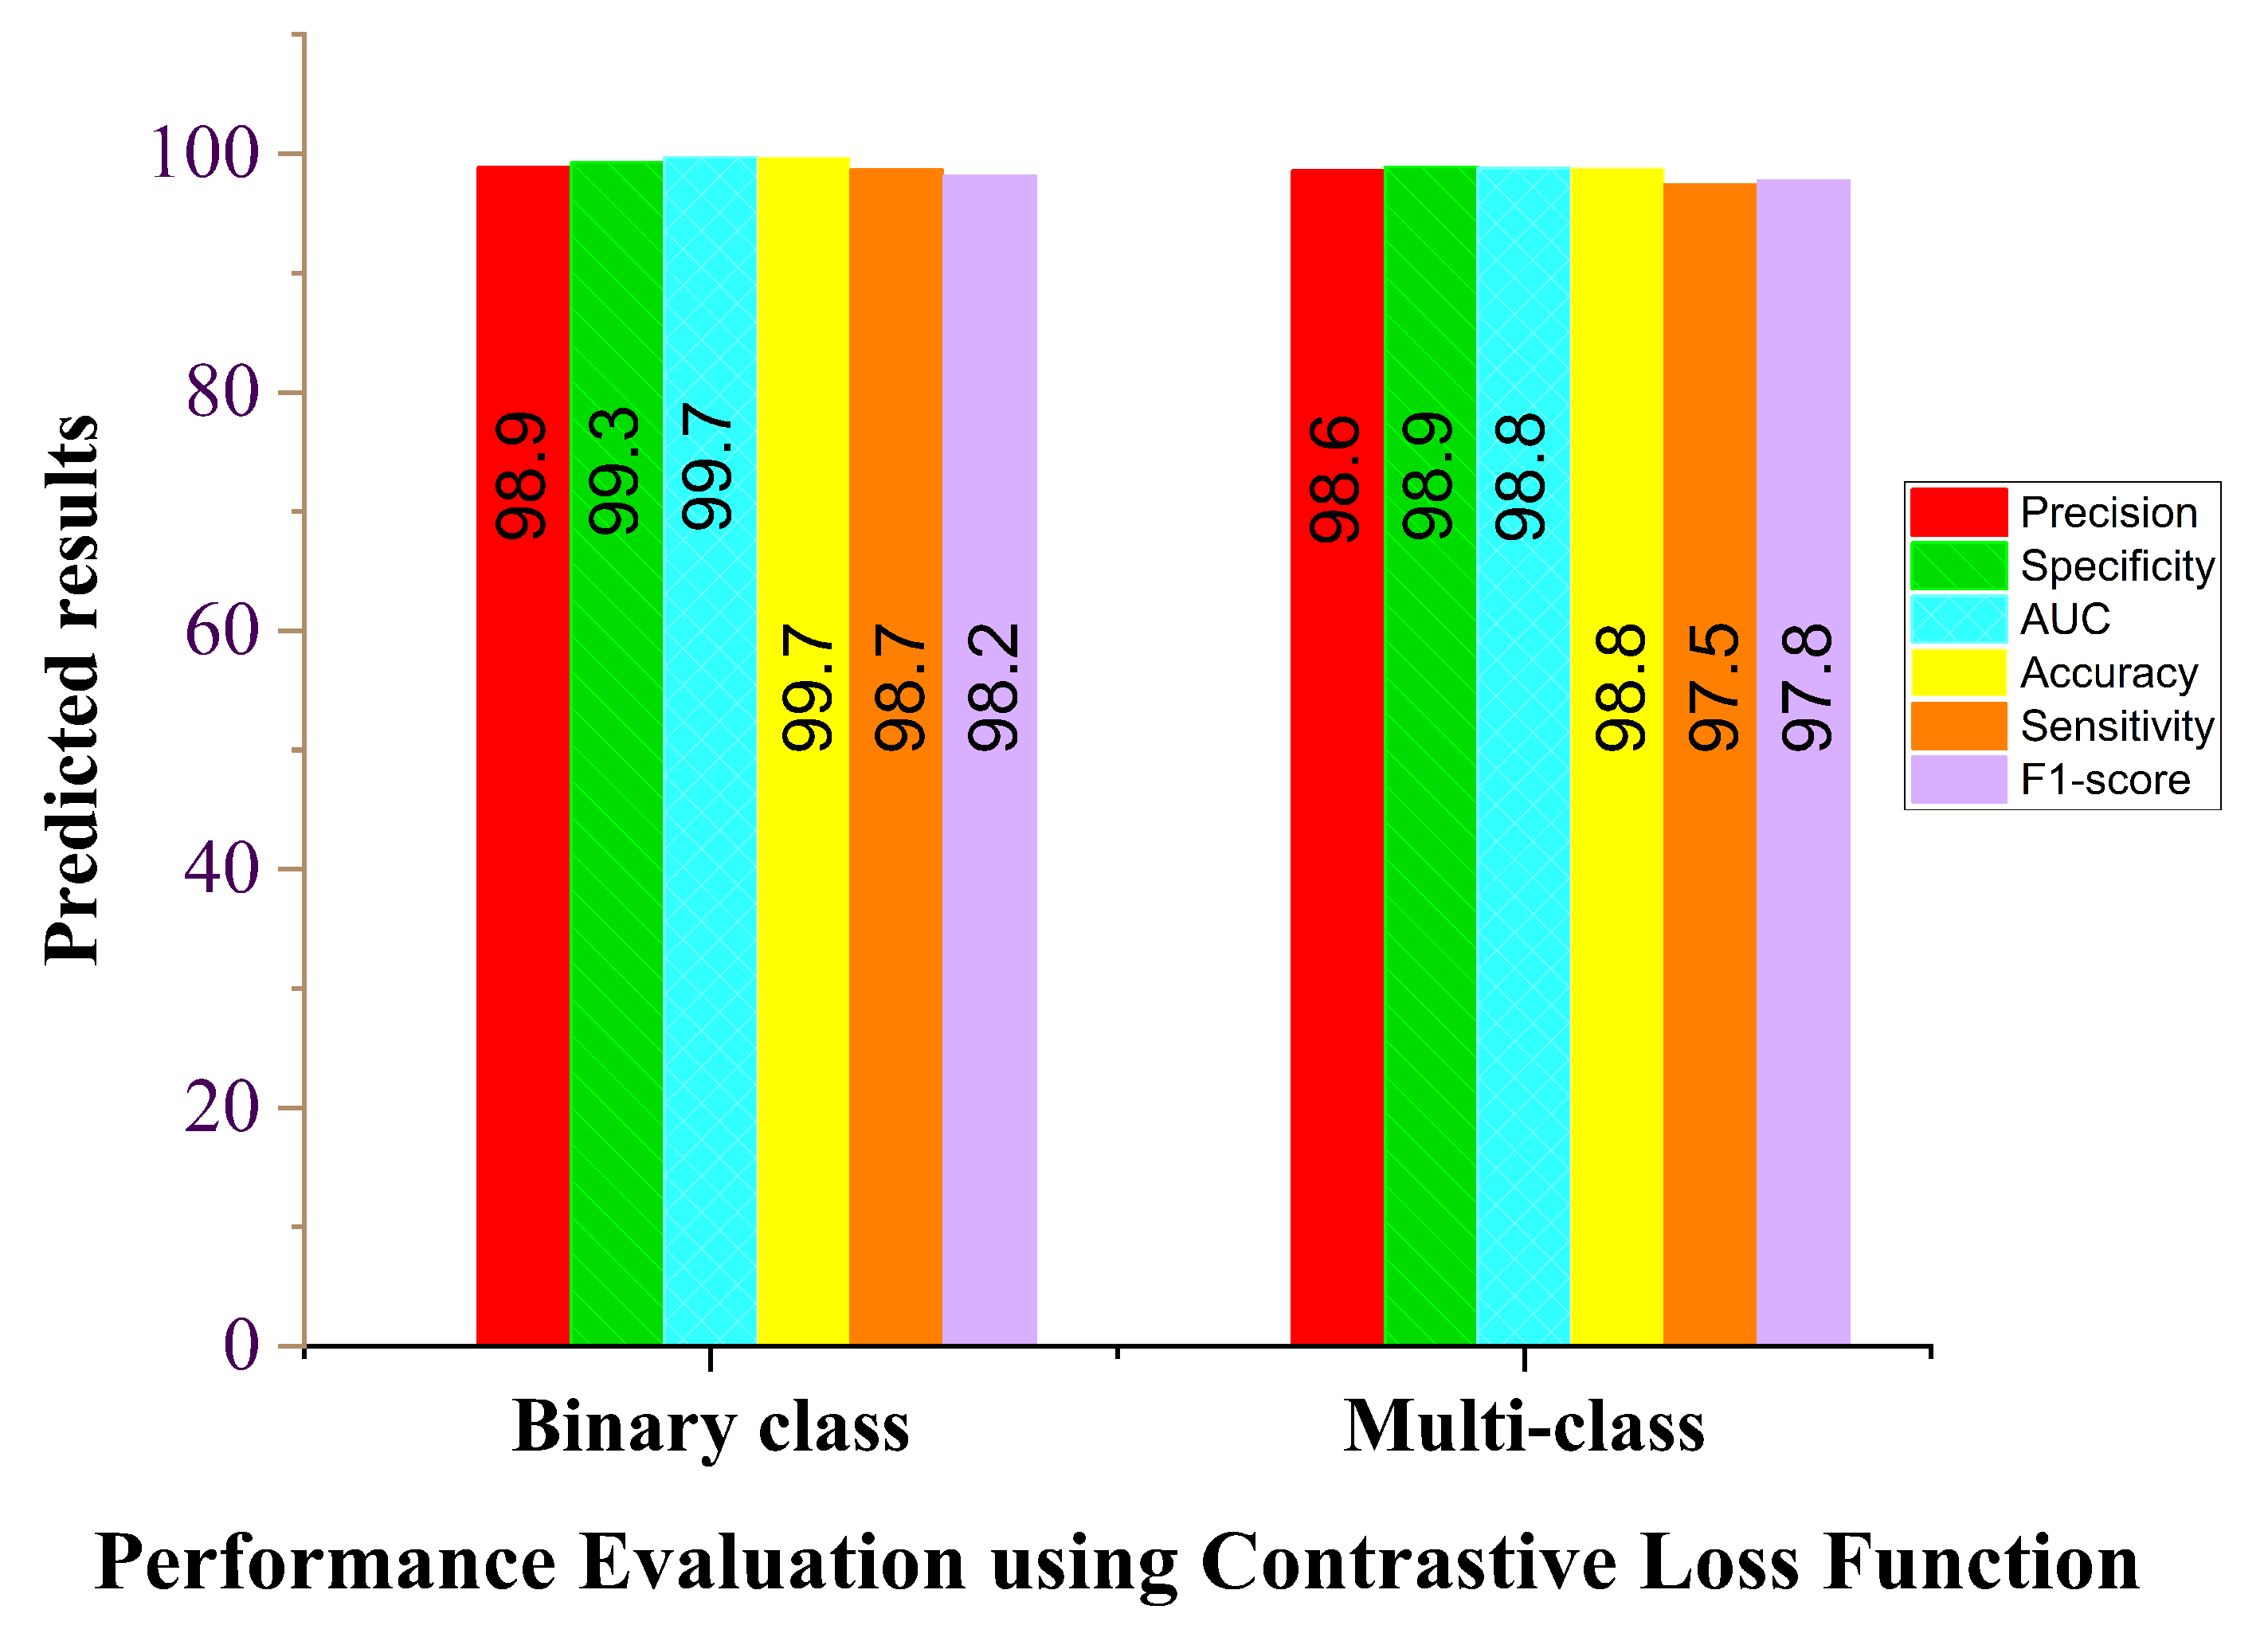
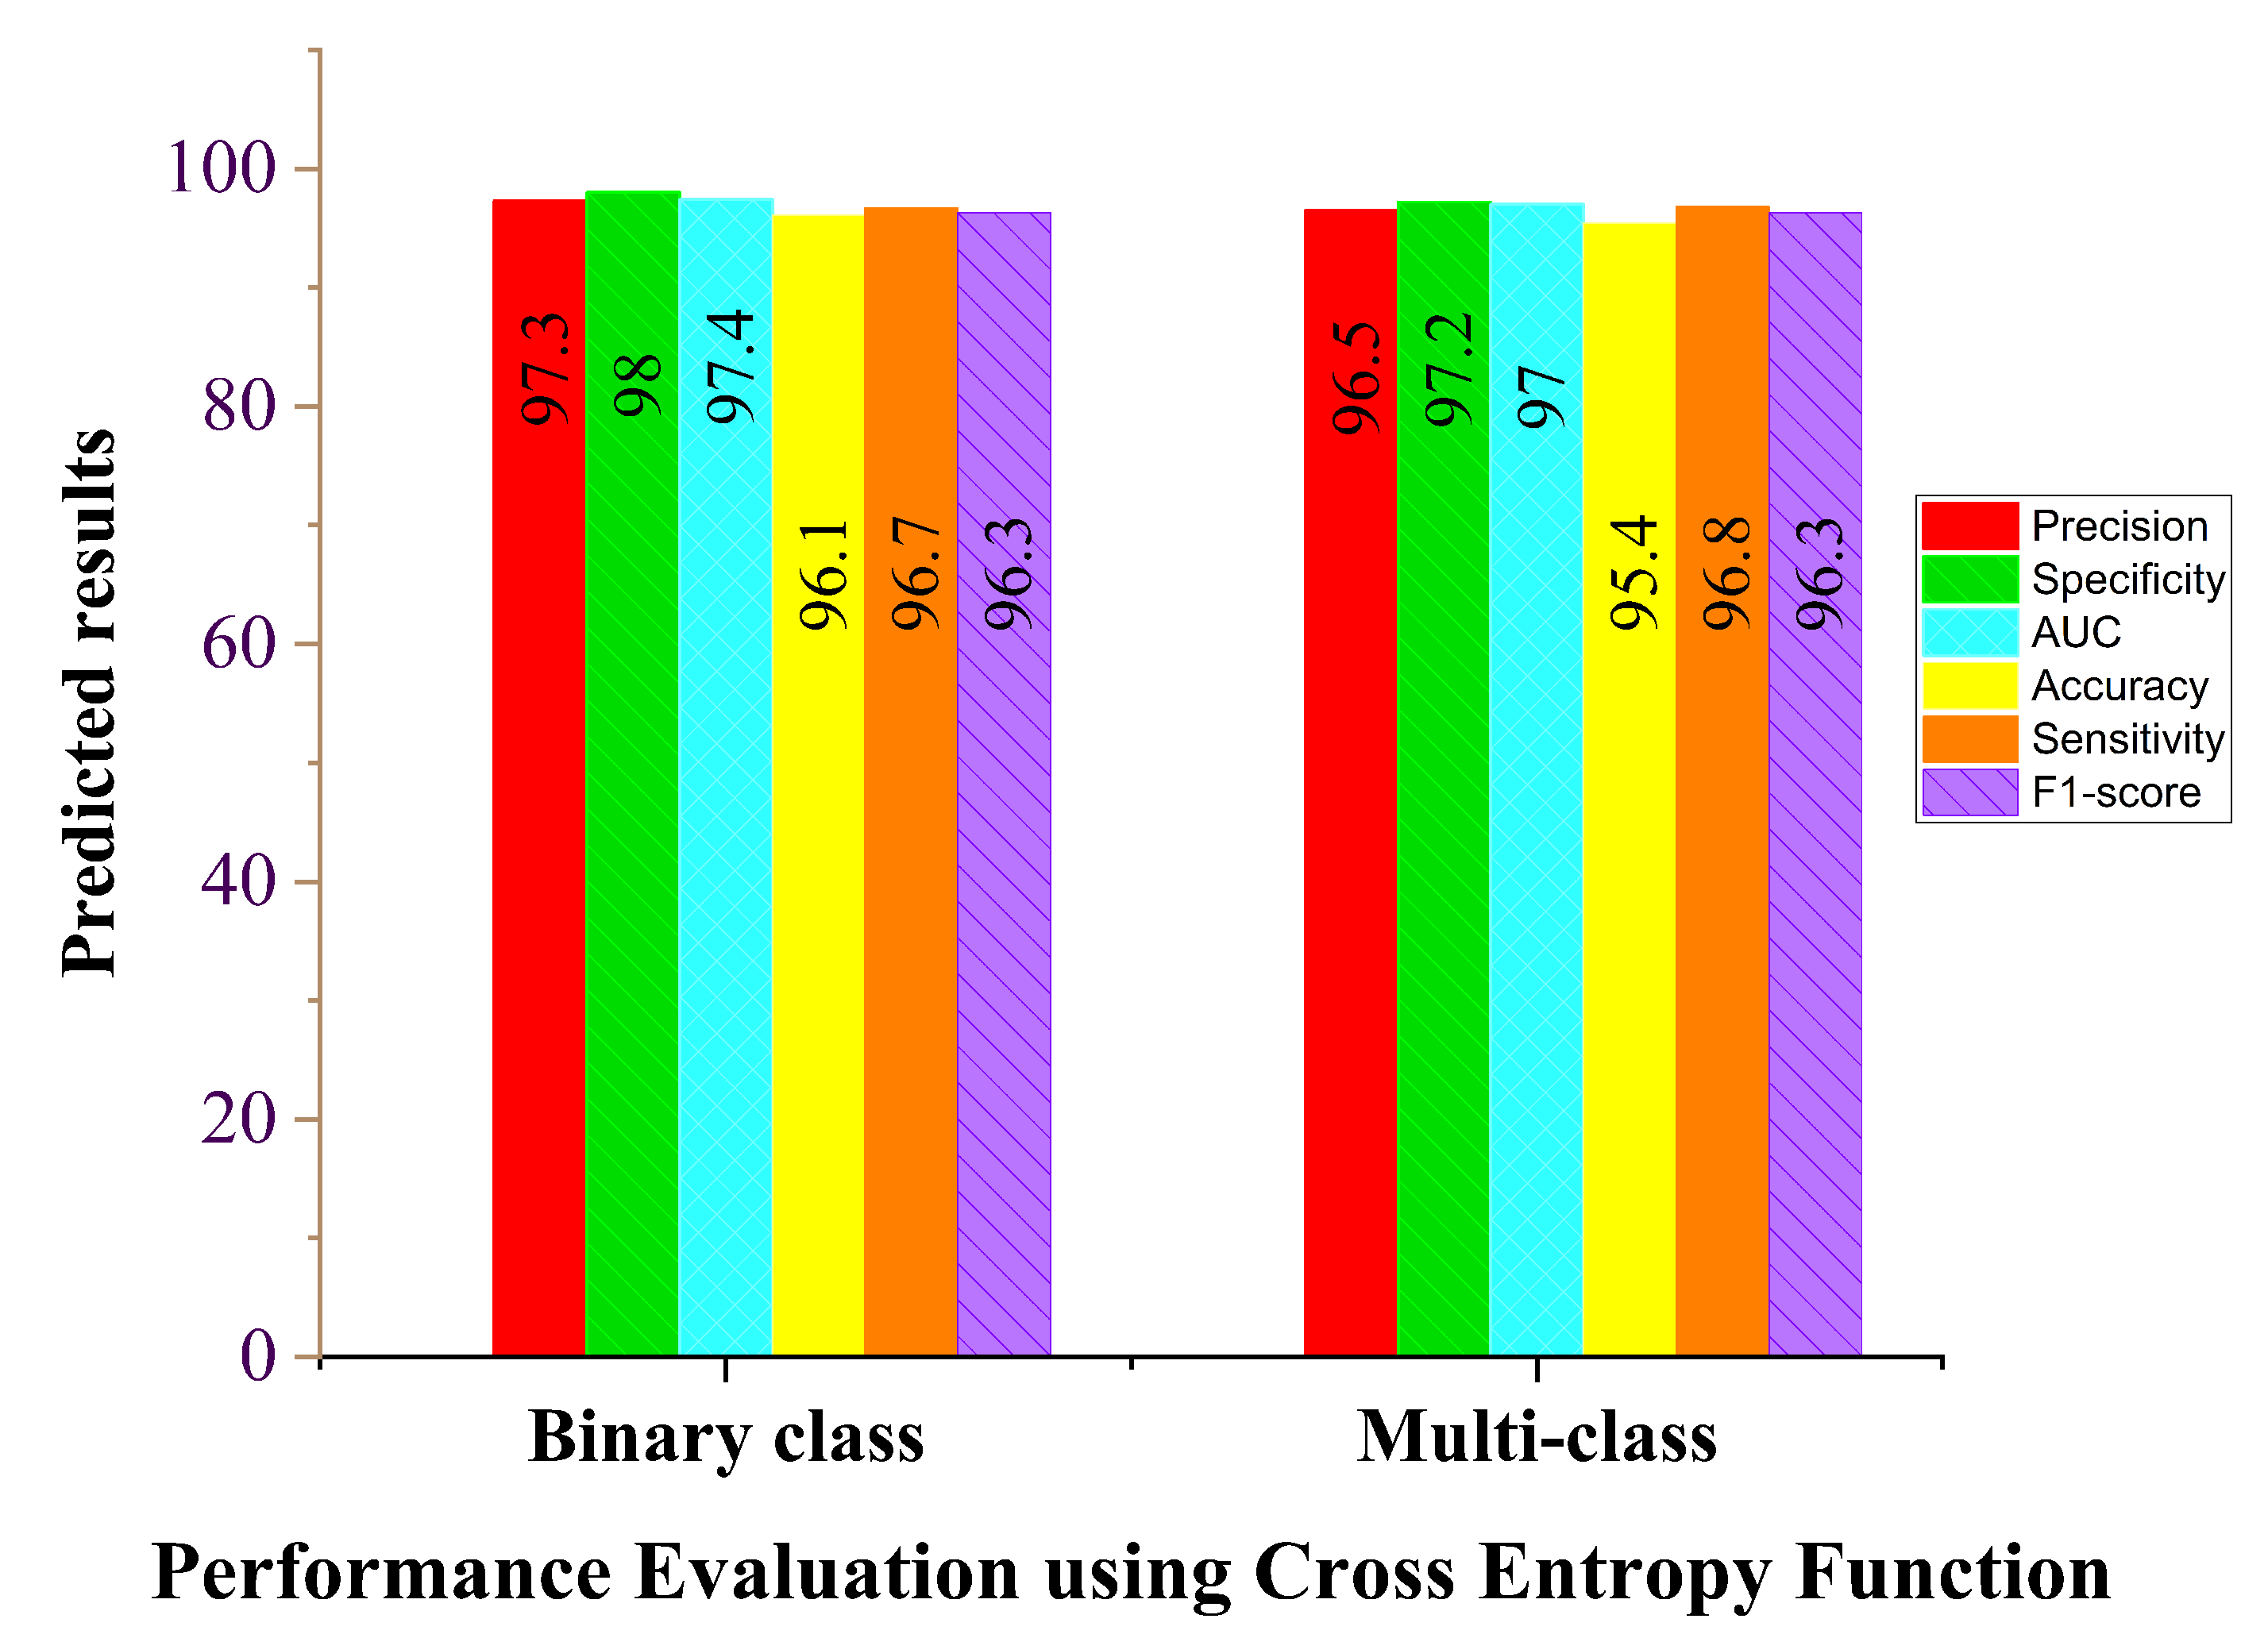
4.5. Loss Function Evaluation
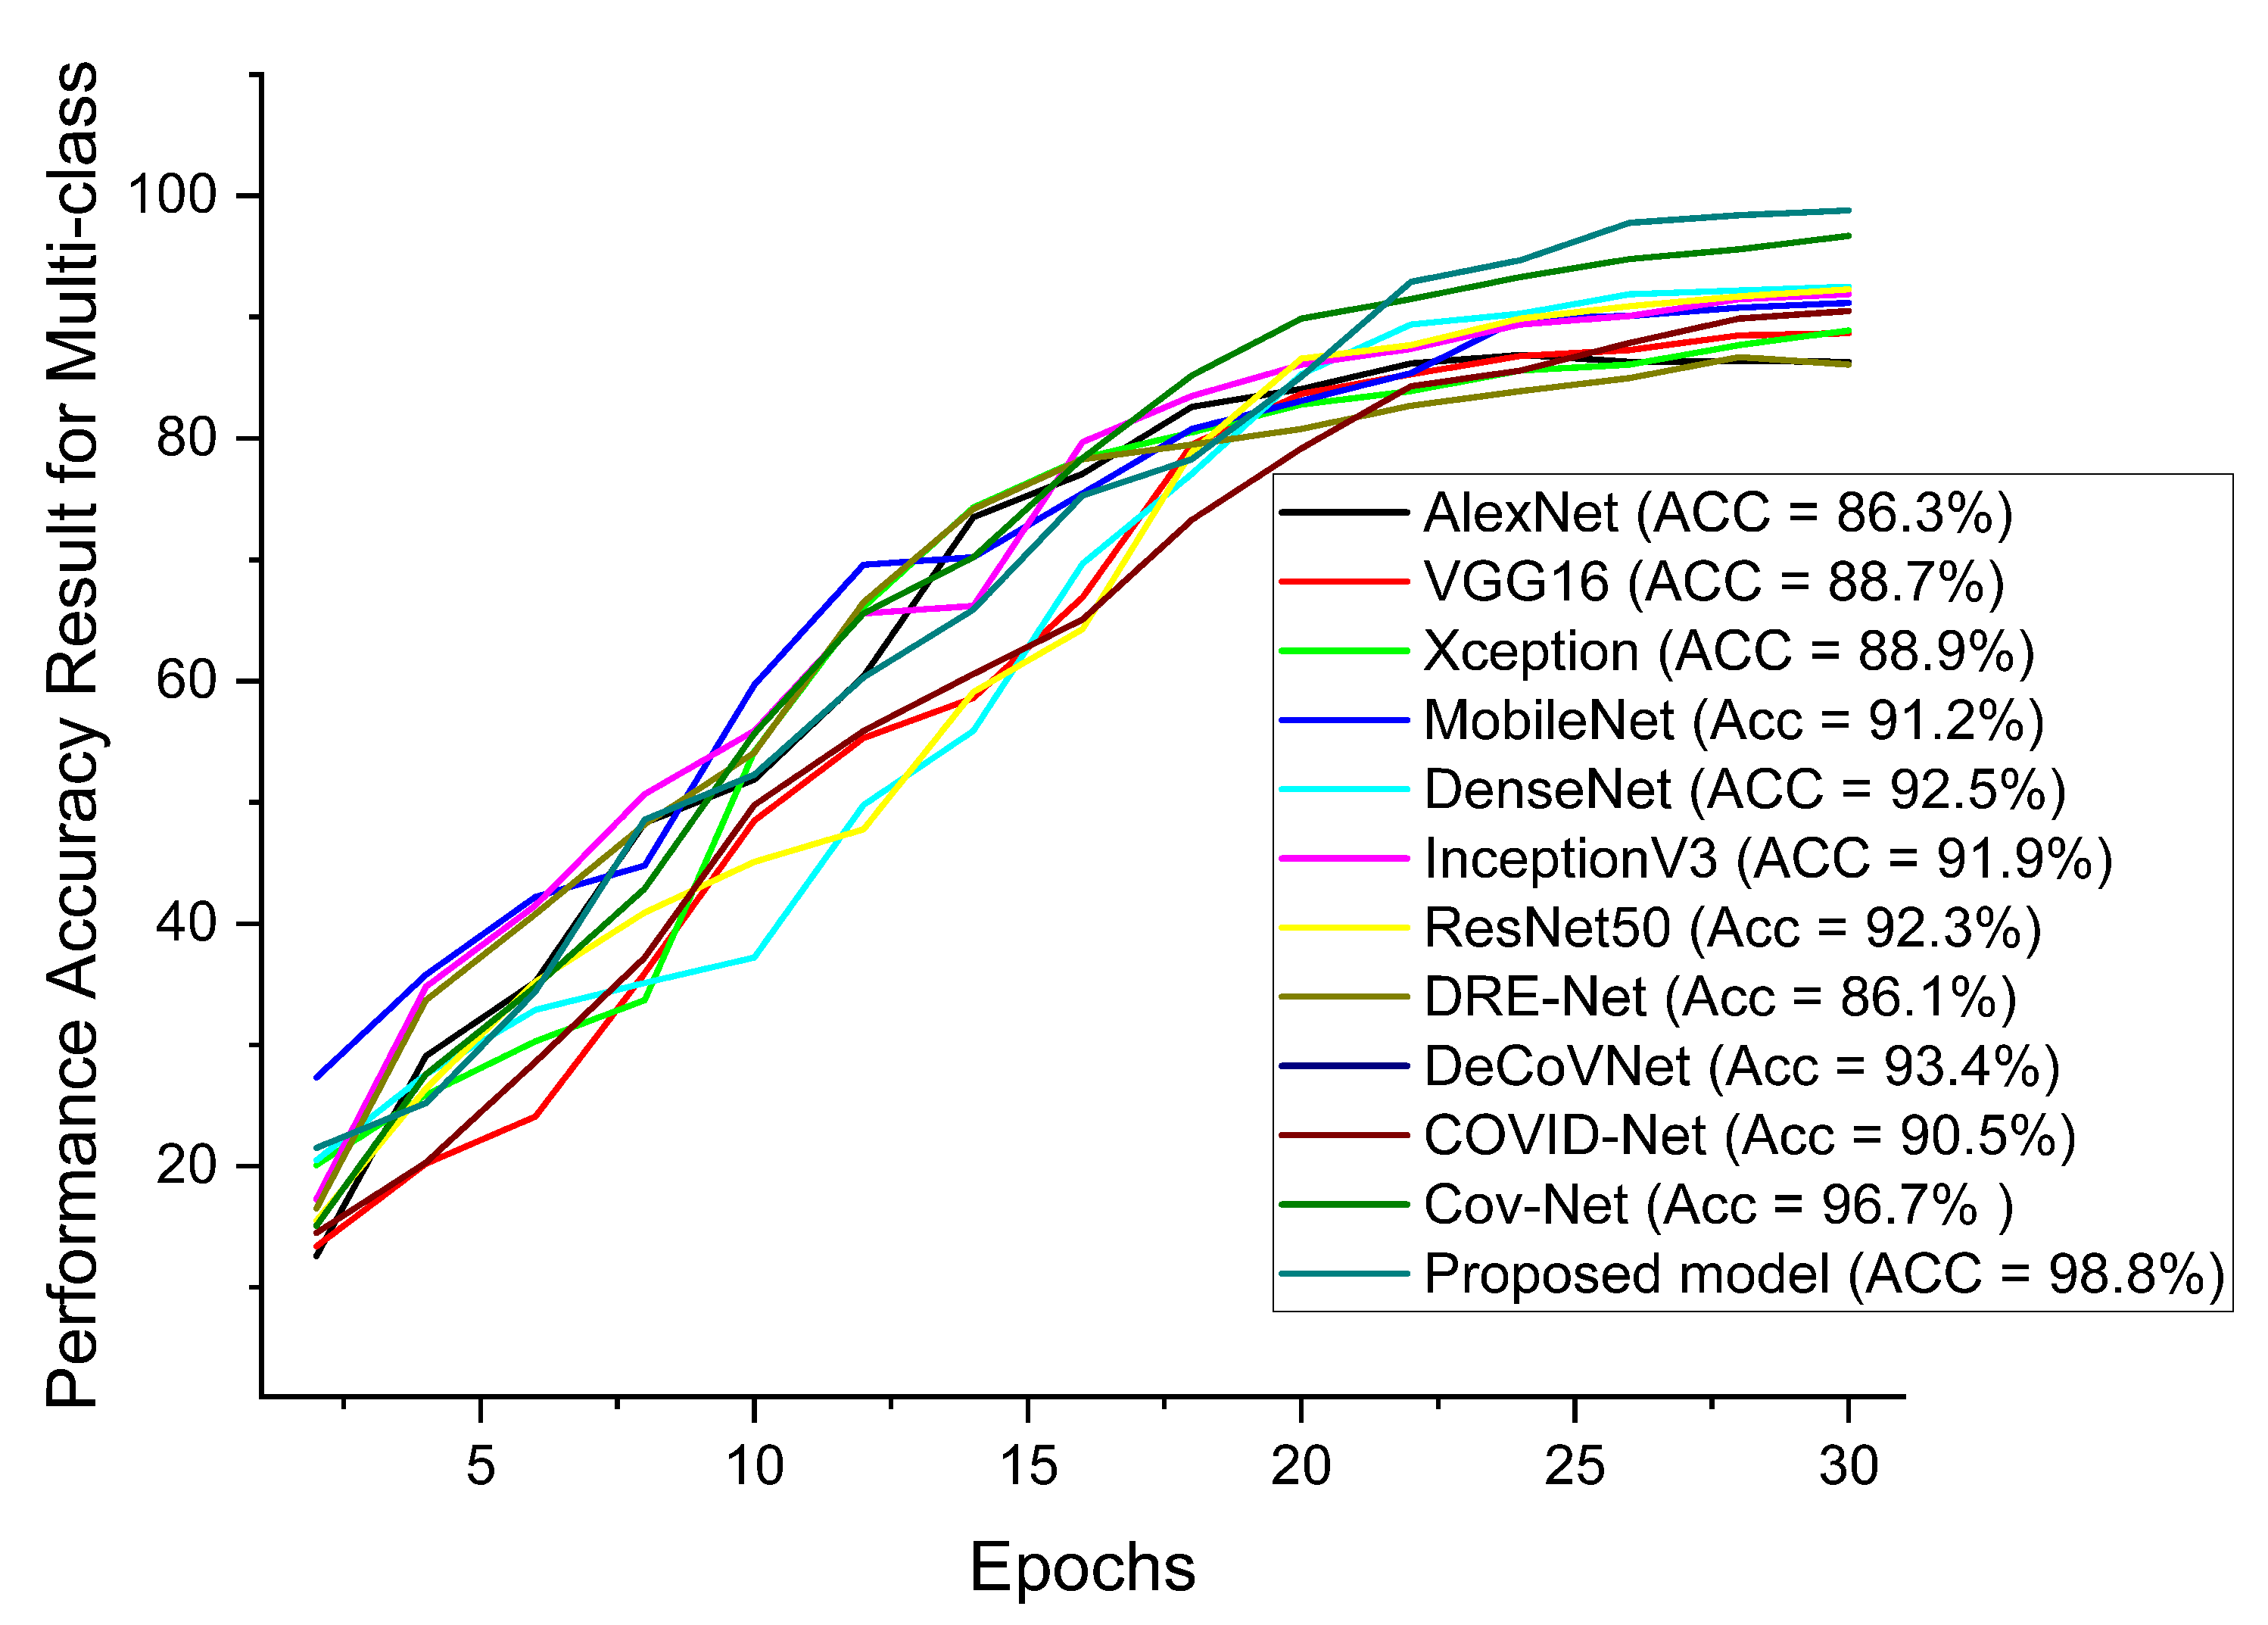
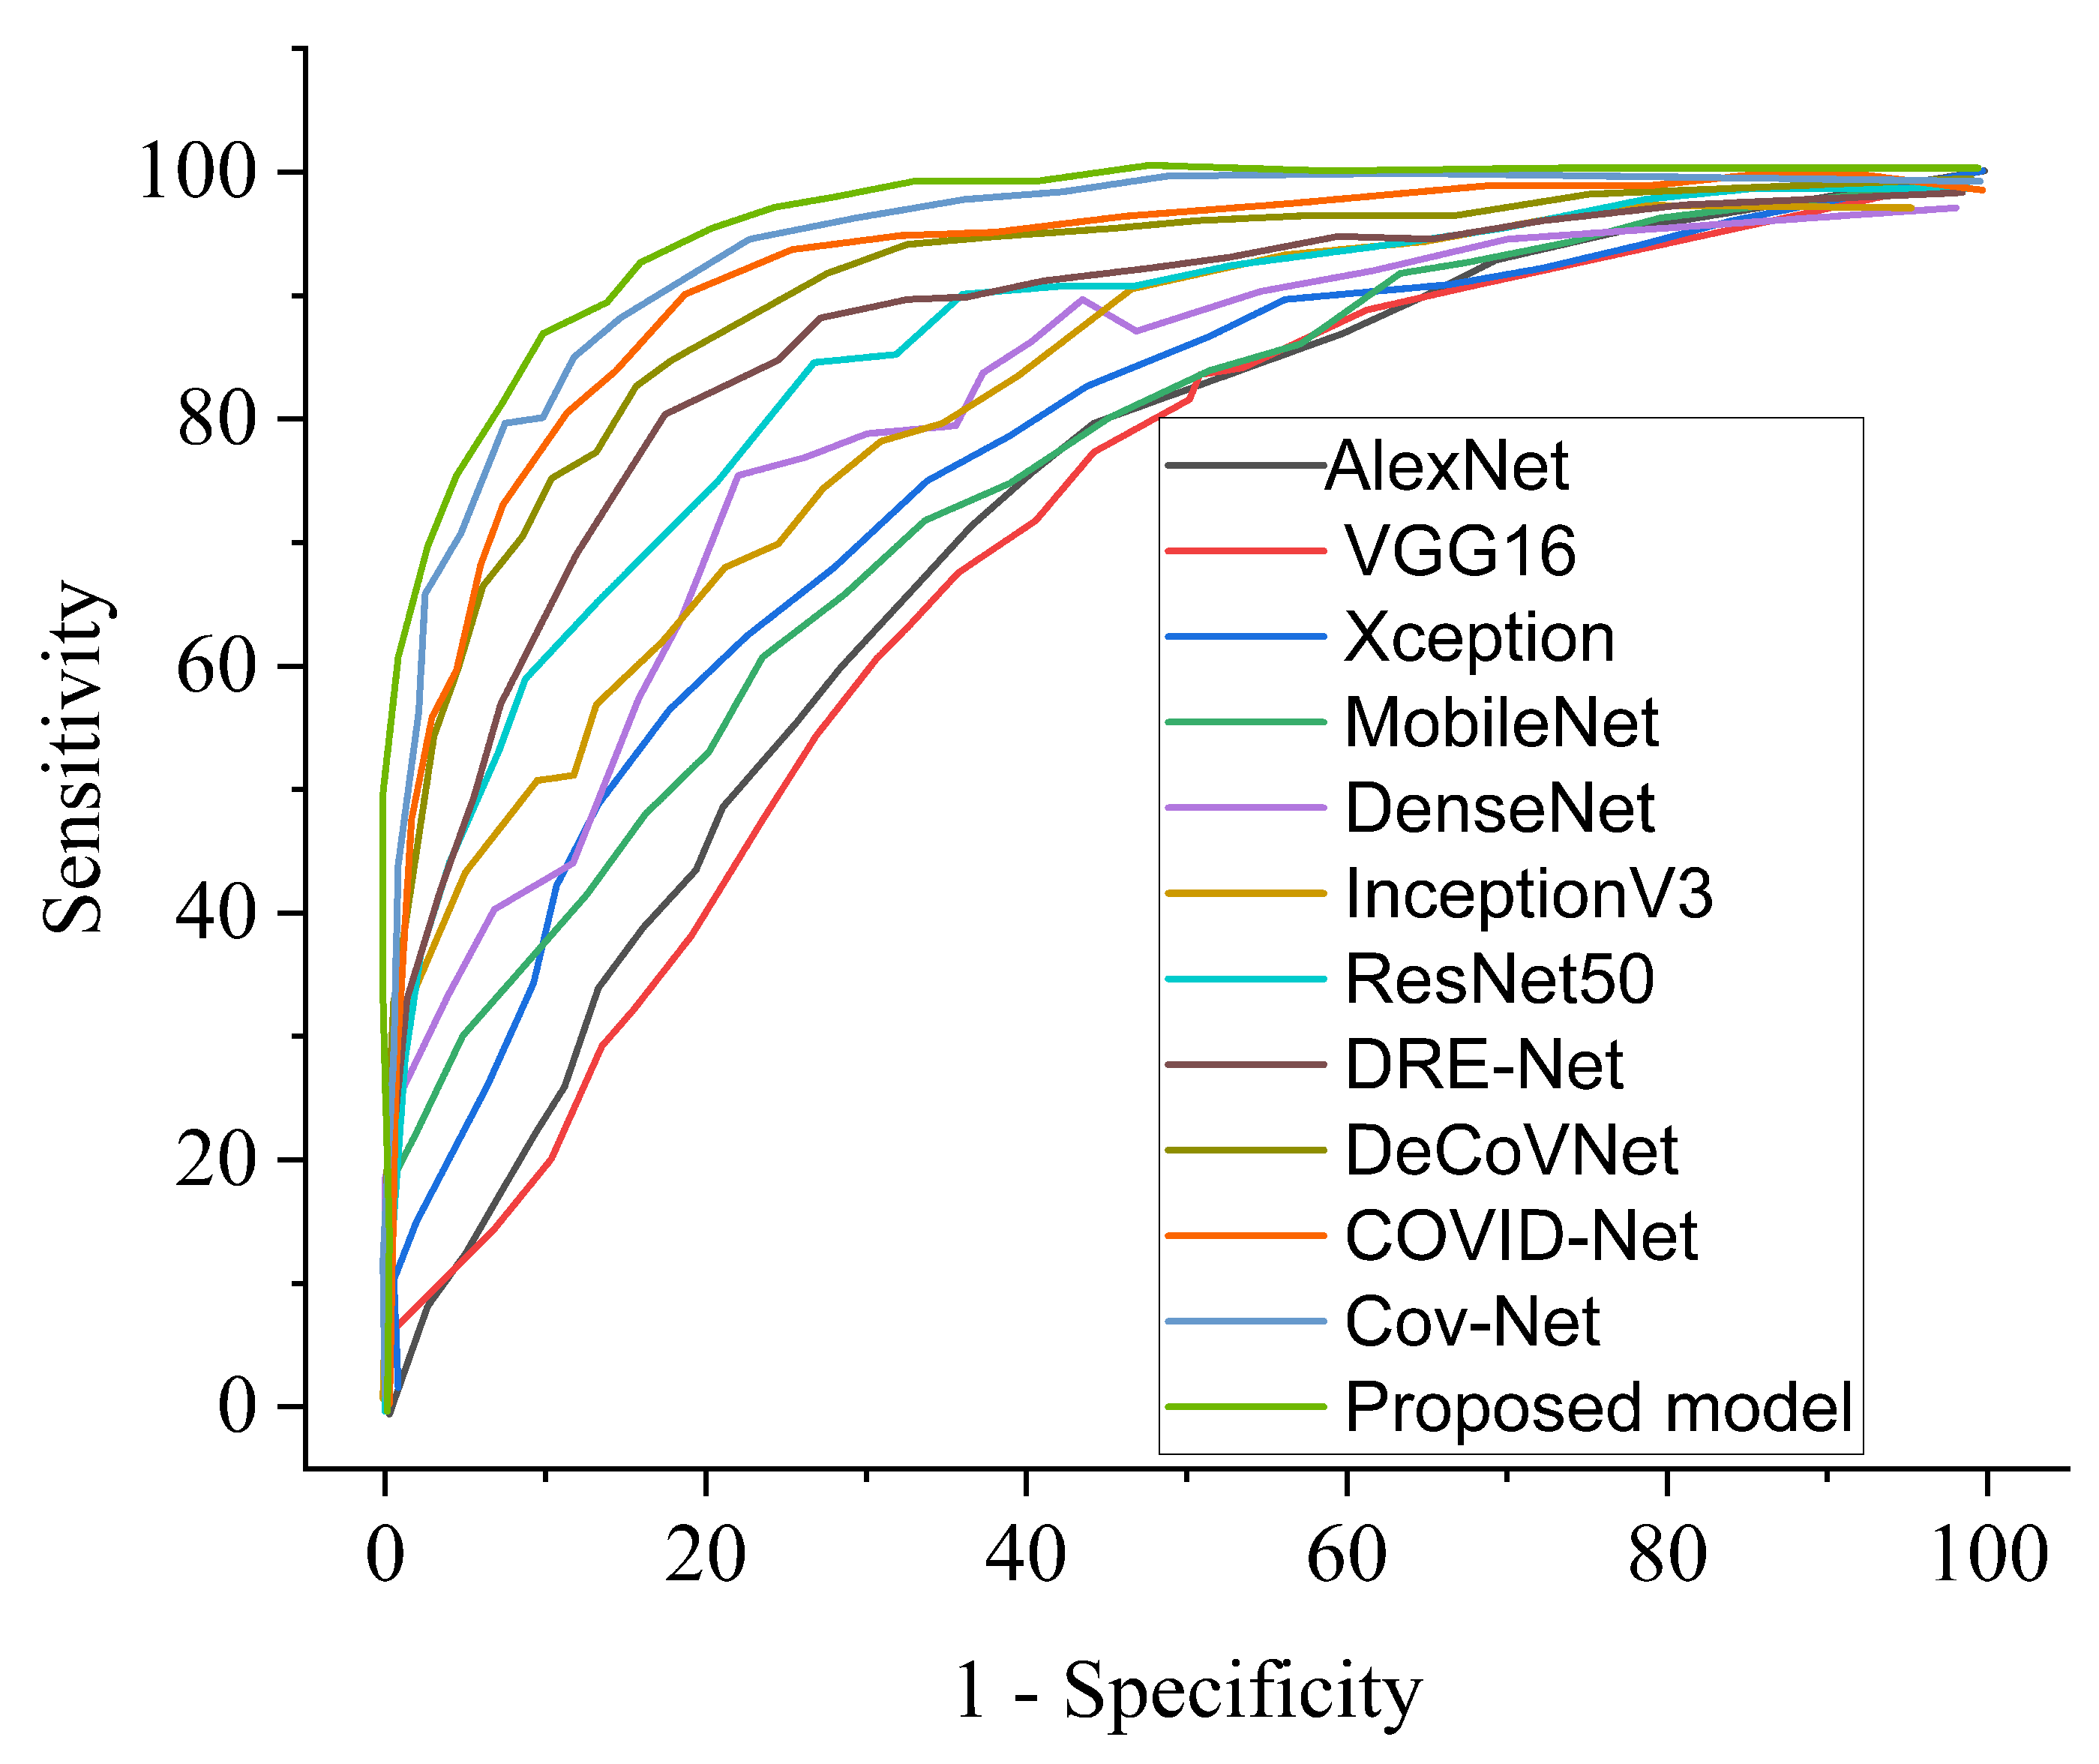
4.6. COVID-19 Identification Evaluation
4.6.1. Result
4.6.2. Comparison of Procedures
5. Discussion
6. Conclusions
Author Contributions
Funding
Institutional Review Board Statement
Informed Consent Statement
Data Availability Statement
Conflicts of Interest
References
- COVID-19 Map-Johns Hopkins Coronavirus Resource Center [Internet]. Available online: https://coronavirus.jhu.edu/map.html (accessed on 17 February 2022).
- WHO Coronavirus (COVID-19) Dashboard|WHO Coronavirus (COVID-19) Dashboard with Vaccination Data [Internet]. Available online: https://covid19.who.int/ (accessed on 17 February 2022).
- Xie, X.; Zhong, Z.; Zhao, W.; Zheng, C.; Wang, F.; Liu, J. Chest CT for typical coronavirus disease 2019 (COVID-19) pneumonia: Relationship to negative RT-PCR testing. Radiol. Radiol. Soc. N. Am. 2020, 296, E41–E45. [Google Scholar] [CrossRef] [PubMed] [Green Version]
- Ai, T.; Yang, Z.; Hou, H.; Zhan, C.; Chen, C.; Lv, W.; Tao, Q.; Sun, Z.; Xia, L. Correlation of chest CT and RT-PCR testing for coronavirus disease 2019 (COVID-19) in China: A report of 1014 cases. Radiol. Radiol. Soc. N. Am. 2020, 296, E32–E40. [Google Scholar] [CrossRef] [PubMed] [Green Version]
- Rajpurkar, P.; Irvin, J.; Zhu, K.; Yang, B.; Mehta, H.; Duan, T.; Ding, D.; Bagul, A.; Langlotz, C.; Shpanskaya, K.; et al. Chexnet: Radiologist-level pneumonia detection on chest X-rays with deep learning. arXiv 2017, arXiv:171105225. [Google Scholar]
- Franquet, T. Imaging of community-acquired pneumonia. J. Thorac. Imaging 2018, 33, 282–294. [Google Scholar] [CrossRef]
- Abbas, A.; Abdelsamea, M.M.; Gaber, M.M. Classification of COVID-19 in chest X-ray images using DeTraC deep convolutional neural network. Appl. Intell. 2021, 51, 854–864. [Google Scholar] [CrossRef] [PubMed]
- Yeh, C.-F.; Cheng, H.-T.; Wei, A.; Chen, H.-M.; Kuo, P.-C.; Liu, K.-C.; Ko, M.-C.; Chen, R.-J.; Lee, P.-C.; Chuang, J.-H.; et al. A cascaded learning strategy for robust COVID-19 pneumonia chest X-ray screening. arXiv 2020, arXiv:200412786. [Google Scholar]
- Apostolopoulos, I.D.; Mpesiana, T.A. Covid-19: Automatic detection from X-ray images utilizing transfer learning with convolutional neural networks. Phys. Eng. Sci. Med. 2020, 43, 635–640. [Google Scholar] [CrossRef] [Green Version]
- Hemdan, E.E.-D.; Shouman, M.A.; Karar, M.E. Covidx-net: A framework of deep learning classifiers to diagnose COVID-19 in X-ray images. arXiv 2020, arXiv:200311055. [Google Scholar]
- Wang, L.; Lin, Z.Q.; Wong, A. Covid-net: A tailored deep convolutional neural network design for detection of COVID-19 cases from chest X-ray images. Sci. Rep. 2020, 10, 19549. [Google Scholar] [CrossRef]
- Zhou, S.K.; Greenspan, H.; Shen, D. Deep Learning for Medical Image Analysis; Academic Press: Cambridge, MA, USA, 2017. [Google Scholar]
- Li, T.; Han, Z.; Wei, B.; Zheng, Y.; Hong, Y.; Cong, J. Robust screening of COVID-19 from chest X-ray via discriminative cost-sensitive learning. arXiv 2020, arXiv:200412592. [Google Scholar]
- Cohen, J.P.; Morrison, P.; Dao, L.; Roth, K.; Duong, T.Q.; Ghassemi, M. COVID-19 image data collection: Prospective predictions are the future. arXiv 2020, arXiv:200611988. [Google Scholar]
- Wang, X.; Peng, Y.; Lu, L.; Lu, Z.; Bagheri, M.; Summers, R.M. ChestX-ray8: Hospital-scale chest X-ray database and benchmarks on weakly-supervised classification and localization of common thorax diseases. In Proceedings of the IEEE Conference on Computer Vision and Pattern Recognition, Honolulu, HI, USA, 26 July 2017; pp. 2097–2106. [Google Scholar]
- He, K.; Zhang, X.; Ren, S.; Sun, J. Identity mappings in deep residual networks. Eur. Conf. Comput. Vis. 2016, 8, 630–645. [Google Scholar]
- Nneji, G.U.; Cai, J.; Deng, J.; Monday, H.N.; James, E.C.; Lemessa, B.D.; Yutra, A.Z.; Leta, Y.B.; Nahar, S. COVID-19 Identification Using Deep Capsule Network: A Perspective of Super-Resolution CNN on Low-Quality CXR Images. In Proceedings of the 7th International Conference on Communication and Information Processing (ICCIP 2021), Beijing, China, 16–18 December 2021; pp. 96–102. [Google Scholar]
- Narin, A.; Kaya, C.; Pamuk, Z. Automatic detection of coronavirus disease (covid-19) using X-ray images and deep convolutional neural networks. arXiv 2020, arXiv:200310849. [Google Scholar] [CrossRef] [PubMed]
- Monday, H.N.; Li, J.P.; Nneji, G.U.; Oluwasanmi, A.; Mgbejime, G.T.; Ejiyi, C.J.; Chikwendu, I.A.; James, E.C. Improved convolutional neural multi-resolution wavelet network for COVID-19 pneumonia classification. In Proceedings of the 4th International Conference on Pattern Recognition and Artificial Intelligence (PRAI 2021), Yibin, China, 20–22 August 2021; pp. 267–273. [Google Scholar]
- Nneji, G.U.; Cai, J.; Jianhua, D.; Monday, H.N.; Chikwendu, I.A.; Oluwasanmi, A.; James, E.C.; Mgbejime, G.T. Enhancing low quality in radiograph datasets using wavelet transform convolutional neural network and generative adversarial network for COVID-19 identification. In Proceedings of the 4th International Conference on Pattern Recognition and Artificial Intelligence (PRAI 2021), Yibin, China, 20–22 August 2021; pp. 146–151. [Google Scholar]
- Monday, H.N.; Li, J.P.; Nneji, G.U.; James, E.C.; Chikwendu, I.A.; Ejiyi, C.J.; Oluwasanmi, A.; Mgbejime, G.T. The capability of multi resolution analysis: A case study of COVID-19 diagnosis. In Proceedings of the 4th International Conference on Pattern Recognition and Artificial Intelligence (PRAI 2021), Yibin, China, 20–22 August 2021; pp. 236–242. [Google Scholar]
- Nneji, G.U.; Cai, J.; Deng, J.; Monday, H.N.; James, E.C.; Ukwuoma, C.C. Multi-Channel Based Image Processing Scheme for Pneumonia Identification. Diagnostics 2022, 12, 325. [Google Scholar] [CrossRef] [PubMed]
- Zhang, J.; Xie, Y.; Li, Y.; Shen, C.; Xia, Y. COVID-19 screening on chest X-ray images using deep learning based anomaly detection. arXiv 2020, arXiv:200312338. [Google Scholar]
- Chen, J.; Wu, L.; Zhang, J.; Zhang, L.; Gong, D.; Zhao, Y.; Chen, Q.; Huang, S.; Yang, M.; Yang, X.; et al. Deep learning-based model for detecting 2019 novel coronavirus pneumonia on high-resolution computed tomography. Sci. Rep. 2020, 10, 19196. [Google Scholar] [CrossRef] [PubMed]
- Zhou, Z.; Siddiquee, M.M.R.; Tajbakhsh, N.; Liang, J. Unet++: A nested u-net architecture for medical image segmentation. In Deep Learn Med image Anal multimodal Learn Clin Decis Support; Springer: Berlin/Heidelberg, Germany, 2018; pp. 3–11. [Google Scholar]
- Shan, F.; Gao, Y.; Wang, J.; Shi, W.; Shi, N.; Han, M.; Xue, Z.; Shen, D.; Shi, Y. Lung infection quantification of COVID-19 in CT images with deep learning. arXiv 2020, arXiv:200304655. [Google Scholar]
- Gozes, O.; Frid-Adar, M.; Greenspan, H.; Browning, P.D.; Zhang, H.; Ji, W.; Bernheim, A.; Siegel, E. Rapid ai development cycle for the coronavirus (COVID-19) pandemic: Initial results for automated detection & patient monitoring using deep learning ct image analysis. arXiv 2020, arXiv:200305037. [Google Scholar]
- Li, L.; Qin, L.; Xu, Z.; Yin, Y.; Wang, X.; Kong, B.; Bai, J.; Lu, Y.; Fang, Z.; Song, Q.; et al. Artificial intelligence distinguishes COVID-19 from community acquired pneumonia on chest CT. Radiol. Radiol. Soc. N. Am. 2020, 19, 944. [Google Scholar]
- Zhang, J.; Xie, Y.; Pang, G.; Liao, Z.; Verjans, J.; Li, W.; Xia, Y. Viral Pneumonia Screening on Chest X-rays Using Confidence-Aware Anomaly Detection. IEEE Trans. Med. Imaging 2020, 40, 879–890. [Google Scholar] [CrossRef]
- Chowdhury, M.E.; Rahman, T.; Kadir, M.A.; Mazhar, R.; Kadir, M.A.; Mahbub, Z.B.; Islam, M.T. Can AI help in screening viral and COVID-19 pneumonia? IEEE Access 2020, 8, 132665–132676. [Google Scholar] [CrossRef]
- Montazeri, M.; ZahediNasab, R.; Farahani, A.; Mohseni, H.; Ghasemian, F. Machine Learning Models for Image-Based Diagnosis and Prognosis of COVID-19: Systematic Review. JMIR Med. Inform. 2021, 9, e25181. [Google Scholar] [CrossRef] [PubMed]
- Lu, J.Q.; Musheyev, B.; Peng, Q.; Duong, T.Q. Neural Network Analysis of Clinical Variables Predicts Escalated Care in COVID-19 Patients: A Retrospective Study. PeerJ 2021, 9, e11205. [Google Scholar] [CrossRef] [PubMed]
- Plante, T.B.; Blau, A.M.; Berg, A.N.; Weinberg, A.S.; Jun, I.C.; Tapson, V.F.; Kanigan, T.S.; Adib, A.B. Development and external validation of a machine learning tool to rule out COVID-19 among adults in the emergency department using routine blood tests: A large, multicenter, real-world study. J. Med. Internet Res. 2020, 22, e24048. [Google Scholar] [CrossRef]
- Aslan, M.F.; Sabanci, K.; Durdu, A.; Unlersen, M.F. COVID-19 diagnosis using state-of-the-art CNN architecture features and Bayesian Optimization. Comput. Biol. Med. 2022, 20, 105244. [Google Scholar] [CrossRef]
- Liu, T.; Tsang, W.; Xie, Y.; Kang, T.; Huang, F.; Chen, Y.; Lau, O.; Feng, G.; Du, J.; Chu, B.; et al. Preferences for Artificial Intelligence Clinicians Before and During the COVID-19 Pandemic: Discrete Choice Experiment and Propensity Score Matching Study. Comput. Biol. Med. 2021, 23, 105244. [Google Scholar] [CrossRef]
- Aslan, M.F.; Unlersen, M.F.; Sabanci, K.; Durdu, A. CNN-based transfer learning–BiLSTM network: A novel approach for COVID-19 infection detection. Appl. Soft Comput. 2021, 98, 106912. [Google Scholar] [CrossRef]
- dos Santos Santana, Í.V.; da Silveira, A.C.M.; Sobrinho, Á.; e Silva, L.C.; da Silva, L.D.; Santos, D.F.S.; Gurjão, E.C.; Perkusich, A. Classification Models for COVID-19 Test Prioritization in Brazil: Machine Learning Approach. J. Med. Internet Res. 2021, 23, e27293. [Google Scholar] [CrossRef]
- Li, X.; Ge, P.; Zhu, J.; Li, H.; Graham, J.; Singer, A.; Richman, P.S.; Duong, T.Q. Deep learning prediction of likelihood of ICU admission and mortality in COVID-19 patients using clinical variables. PeerJ 2020, 8, e10337. [Google Scholar] [CrossRef]
- Barstugan, M.; Ozkaya, U.; Ozturk, S. Coronavirus (COVID-19) classification using ct images by machine learning methods. arXiv 2020, arXiv:200309424. [Google Scholar]
- Shi, F.; Xia, L.; Shan, F.; Song, B.; Wu, D.; Wei, Y.; Yuan, H.; Jiang, H.; He, Y.; Gao, Y.; et al. Large-scale screening to distinguish between COVID-19 and community-acquired pneumonia using infection size-aware classification. Phys. Med. Biol. 2021, 66, 65031. [Google Scholar] [CrossRef] [PubMed]
- Jin, S.; Wang, B.; Xu, H.; Luo, C.; Wei, L.; Zhao, W.; Hou, X.; Ma, W.; Xu, Z.; Zheng, Z.; et al. AI-assisted CT imaging analysis for COVID-19 screening: Building and deploying a medical AI system in four weeks. MedRxiv 2020. [Google Scholar] [CrossRef]
- Jin, C.; Chen, W.; Cao, Y.; Xu, Z.; Tan, Z.; Zhang, X.; Deng, L.; Zheng, C.; Zhou, J.; Shi, H.; et al. Development and evaluation of an artificial intelligence system for COVID-19 diagnosis. Nat. Commun. 2020, 11, 5088. [Google Scholar] [CrossRef] [PubMed]
- Chen, L.-C.; Papandreou, G.; Kokkinos, I.; Murphy, K.; Yuille, A.L. Semantic image segmentation with deep convolutional nets and fully connected crfs. arXiv 2014, arXiv:14127062. [Google Scholar]
- Selvaraju, R.R.; Cogswell, M.; Das, A.; Vedantam, R.; Parikh, D.; Batra, D. Grad-cam: Visual explanations from deep networks via gradient-based localization. In Proceedings of the IEEE International Conference on Computer Vision, Venice, Italy, 25 December 2017; pp. 618–626. [Google Scholar]
- Xu, X.; Jiang, X.; Ma, C.; Du, P.; Li, X.; Lv, S.; Yu, L.; Ni, Q.; Chen, Y.; Su, J.; et al. A deep learning system to screen novel coronavirus disease 2019 pneumonia. Engineering 2020, 6, 1122–1129. [Google Scholar] [CrossRef] [PubMed]
- Wang, S.; Kang, B.; Ma, J.; Zeng, X.; Xiao, M.; Guo, J.; Cai, M.; Yang, J.; Li, Y.; Meng, X.; et al. A deep learning algorithm using CT images to screen for Corona Virus Disease (COVID-19). Eur. Radiol. 2021, 31, 1–9. [Google Scholar] [CrossRef]
- Song, Y.; Zheng, S.; Li, L.; Zhang, X.; Zhang, X.; Huang, Z.; Chen, J.; Wang, R.; Zhao, H.; Zha, Y.; et al. Deep learning enables accurate diagnosis of novel coronavirus (COVID-19) with CT images. IEEE/ACM Trans. Comput. Biol. Bioinform. 2021, 18, 2775–2780. [Google Scholar] [CrossRef]
- Tang Z, Zhao W, Xie X, Zhong Z, Shi F, Liu J, Shen D. Severity assessment of coronavirus disease 2019 (COVID-19) using quantitative features from chest CT images. arXiv 2020, arXiv:200311988.
- Zheng, C.; Deng, X.; Fu, Q.; Zhou, Q.; Feng, J.; Ma, H.; Liu, W.; Wang, X. Deep learning-based detection for COVID-19 from chest CT using weak label. MedRxiv 2020. [Google Scholar] [CrossRef] [Green Version]
- Wynants, L.; Van Calster, B.; Collins, G.S.; Riley, R.D.; Heinze, G.; Schuit, E.; Bonten, M.M.J.; Dahly, D.L.; Damen, J.A.A.; Debray, T.P.A.; et al. Prediction models for diagnosis and prognosis of COVID-19: Systematic review and critical appraisal. BMJ Br. Med. J. 2020, 369, m1328. [Google Scholar] [CrossRef] [Green Version]
- Wolff, R.F.; Moons, K.G.M.; Riley, R.D.; Whiting, P.F.; Westwood, M.; Collins, G.S.; Reitsma, J.B.; Kleijnen, J.; Mallett, S. PROBAST: A tool to assess the risk of bias and applicability of prediction model studies. Ann. Intern. Med. 2019, 170, 51–58. [Google Scholar] [CrossRef] [PubMed] [Green Version]
- Kotz, S.; Nadarajah, S. Extreme Value Distributions: Theory and Applications; World Scientific: Singapore, 2000. [Google Scholar]
- Rahman, T.; Khandakar, A.; Qiblawey, Y.; Tahir, A.; Kiranyaz, S.; Kashem, S.B.A.; Islam, M.T.; Al Maadeed, S.; Zughaier, S.M.; Khan, M.S.; et al. Exploring the effect of image enhancement techniques on COVID-19 detection using chest X-ray images. Comput. Biol. Med. 2021, 132, 104319. [Google Scholar] [CrossRef] [PubMed]
- RSNA Pneumonia Detection Challenge|Kaggle [Internet]. Available online: https://www.kaggle.com/c/rsna-pneumonia-detection-challenge/data (accessed on 1 May 2021).
- Ledig, C.; Theis, L.; Huszár, F.; Caballero, J.; Cunningham, A.; Acosta, A.; Aitken, A.; Tejani, A.; Totz, J.; Wang, Z.; et al. Photo-realistic single image super-resolution using a generative adversarial network. In Proceedings of the IEEE Conference on Computer Vision and Pattern Recognition, Honolulu, HI, USA, 26 July 2017; pp. 4681–4690. [Google Scholar]
- Wang, X.; Yu, K.; Wu, S.; Gu, J.; Liu, Y.; Dong, C.; Qiao, Y.; Change Loy, C. Esrgan: Enhanced super-resolution generative adversarial networks. In Proceedings of the European Conference on Computer Vision (ECCV) Workshops, Munich, Germany, 8–14 September 2018. [Google Scholar]
- Rakotonirina, N.C.; Rasoanaivo, A. ESRGAN+: Further improving enhanced super-resolution generative adversarial network. In Proceedings of the ICASSP 2020—2020 IEEE International Conference on Acoustics, Speech and Signal Processing (ICASSP), Piscataway, NJ, USA, 4–9 May 2020; pp. 3637–3641. [Google Scholar]


| Classes | Data Count per Class | Selected No. of Data per Class | Train Set | Val Set | Test Set |
|---|---|---|---|---|---|
| Bacteria | 3029 | 2980 | 1192 | 1192 | 596 |
| COVID-19 | 3616 | 2980 | 1192 | 1192 | 596 |
| Healthy | 8851 | 2980 | 1192 | 1192 | 596 |
| Virus | 2983 | 2980 | 1192 | 1192 | 596 |
| Total | 11,920 | 4768 | 4768 | 2384 |
| Parameter | SRGAN | ESRGAN | ESRGAN+ | MESRGAN+ |
|---|---|---|---|---|
| Residual block of the generator | Conv(3, 64, 1) Batch norm ReLU Conv(3, 64, 1) Batch norm | Conv(3, 64, 1) ReLU Conv(3, 64, 1) | Conv(3, 64, 1) ReLU Conv(3, 64, 1) | Conv(3, 64, 1) ReLU Conv(1, 64, 1) ReLU Conv(3,64,1) ReLU Conv(3, 64, 1) |
| Input size | LR | LR | LR | LR |
| PSNR | 19.71 dB | 19.23 dB | 18.65 dB | 18.12 dB |
| PI | 2.56 | 2.37 | 2.21 | 2.09 |
| Model | ACC (%) | SEN (%) | SPE (%) | AUC (%) | PRE (%) | F1 Score (%) |
|---|---|---|---|---|---|---|
| Cross-entropy binary class | 96.1 | 96.7 | 98.0 | 97.4 | 97.3 | 96.3 |
| Cross-entropy multi-class | 95.4 | 96.8 | 97.2 | 97.0 | 96.5 | 96.3 |
| Contrastive loss binary class | 99.7 | 98.7 | 99.3 | 99.7 | 98.9 | 98.2 |
| Contrastive loss multi-class | 98.8 | 97.5 | 98.9 | 98.8 | 98.6 | 97.6 |
| Performance Metrics | Proposed Model for Binary Class | Proposed Model for Multi-Class |
|---|---|---|
| Accuracy (%) | 99.7 | 98.8 |
| Sensitivity (%) | 98.7 | 97.5 |
| Specificity (%) | 99.3 | 98.9 |
| AUC (%) | 99.7 | 98.8 |
| Precision (%) | 98.9 | 98.6 |
| F1 score (%) | 98.2 | 97.8 |
| Time (min) | 36.3 | 39.8 |
| SOTA Research Report | Methodology | Performance Evaluation (%) | |
|---|---|---|---|
| Chen et al. [24] | 2D UNet ++ | ACC | 95.2 |
| SEN | 100.0 | ||
| SPE | 93.6 | ||
| Jin et al. [41] | 2D UNet ++ and 2D CNN | SEN | 97.4 |
| SPE | 92.2 | ||
| Jin et al. [42] | 2D CNN | SEN | 94.1 |
| SPE | 95.5 | ||
| Li et al. [28] | 2D ResNet-50 | SEN | 90.0 |
| SPE | 96.0 | ||
| Shi et al. [40] | Random forest-based CNN | ACC | 87.9 |
| SEN | 83.3 | ||
| SPE | 90.7 | ||
| Song et al. [47] | 2D ResNet-50 | SEN | 86.0 |
| Wang et al. [11] | 2D CNN | ACC | 82.9 |
| Wang et al. [46] | 3D ResNet and attention | ACC | 93.3 |
| SEN | 87.6 | ||
| SPE | 95.5 | ||
| Xu et al. [40] | 2D CNN | ACC | 86.7 |
| Zhang et al. [40] | 2D UNet and 2D CNN | SEN | 90.7 |
| SPE | 90.7 | ||
| Ours | MESRGAN+ with Siamese VGGNet for multi-class | ACC | 98.8 |
| SEN | 97.5 | ||
| SPE | 98.9 | ||
| AUC | 98.8 | ||
| PRE | 98.6 | ||
| F1 score | 97.8 | ||
| Ours | MESRGAN+ with Siamese VGGNet for multi-class | ACC | 99.7 |
| SEN | 98.7 | ||
| SPE | 99.3 | ||
| AUC | 99.7 | ||
| PRE | 98.9 | ||
| F1 score | 98.2 | ||
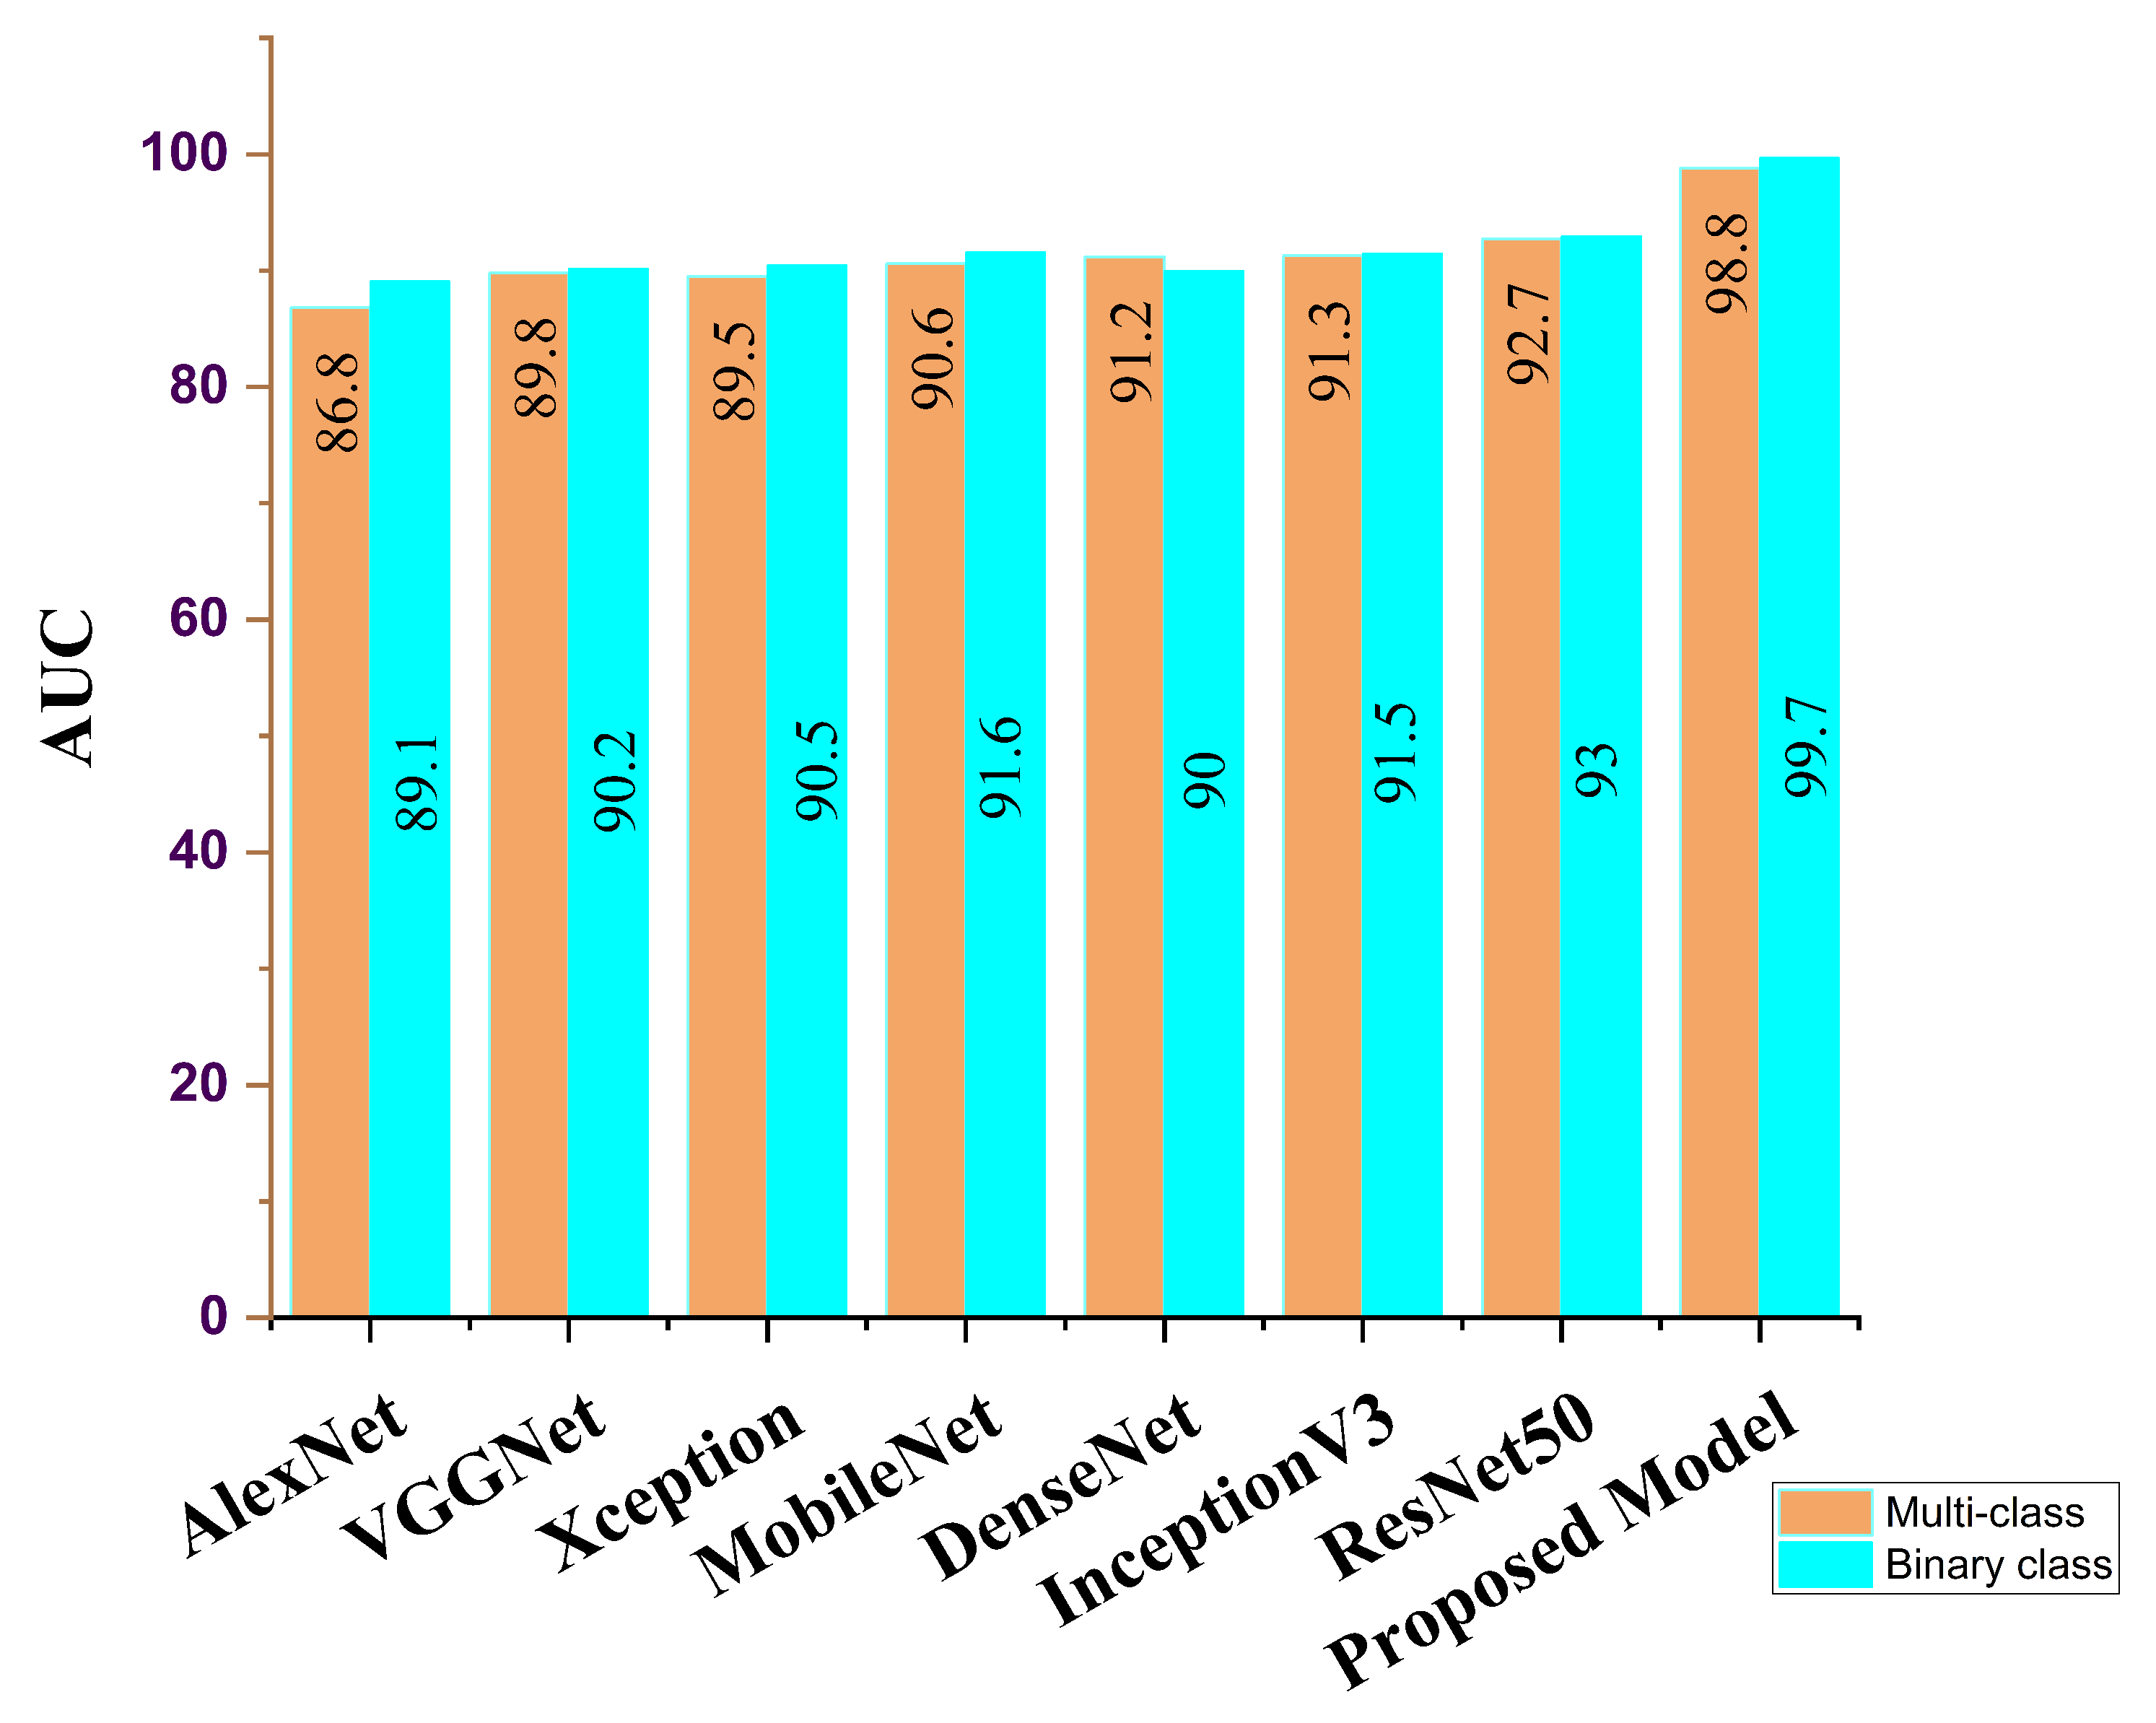
| Feature Learning Model | ACC (%) | SEN (%) | SPE (%) | AUC (%) | PRE (%) | F1 Score (%) |
|---|---|---|---|---|---|---|
| AlexNet | 86.3 | 86.5 | 87.7 | 86.8 | 86.8 | 86.9 |
| VGG16 | 88.7 | 89.5 | 88.0 | 89.8 | 87.9 | 89.9 |
| Xception | 88.9 | 88.6 | 88.6 | 89.5 | 88.1 | 89.8 |
| MobileNet | 91.2 | 90.8 | 89.2 | 90.6 | 89.7 | 90.5 |
| DenseNet | 92.5 | 91.7 | 92.2 | 91.2 | 91.8 | 90.8 |
| InceptionV3 | 91.9 | 91.5 | 92.1 | 91.3 | 92.1 | 91.8 |
| ResNet50 | 92.3 | 92.1 | 92.5 | 92.7 | 92.5 | 92.1 |
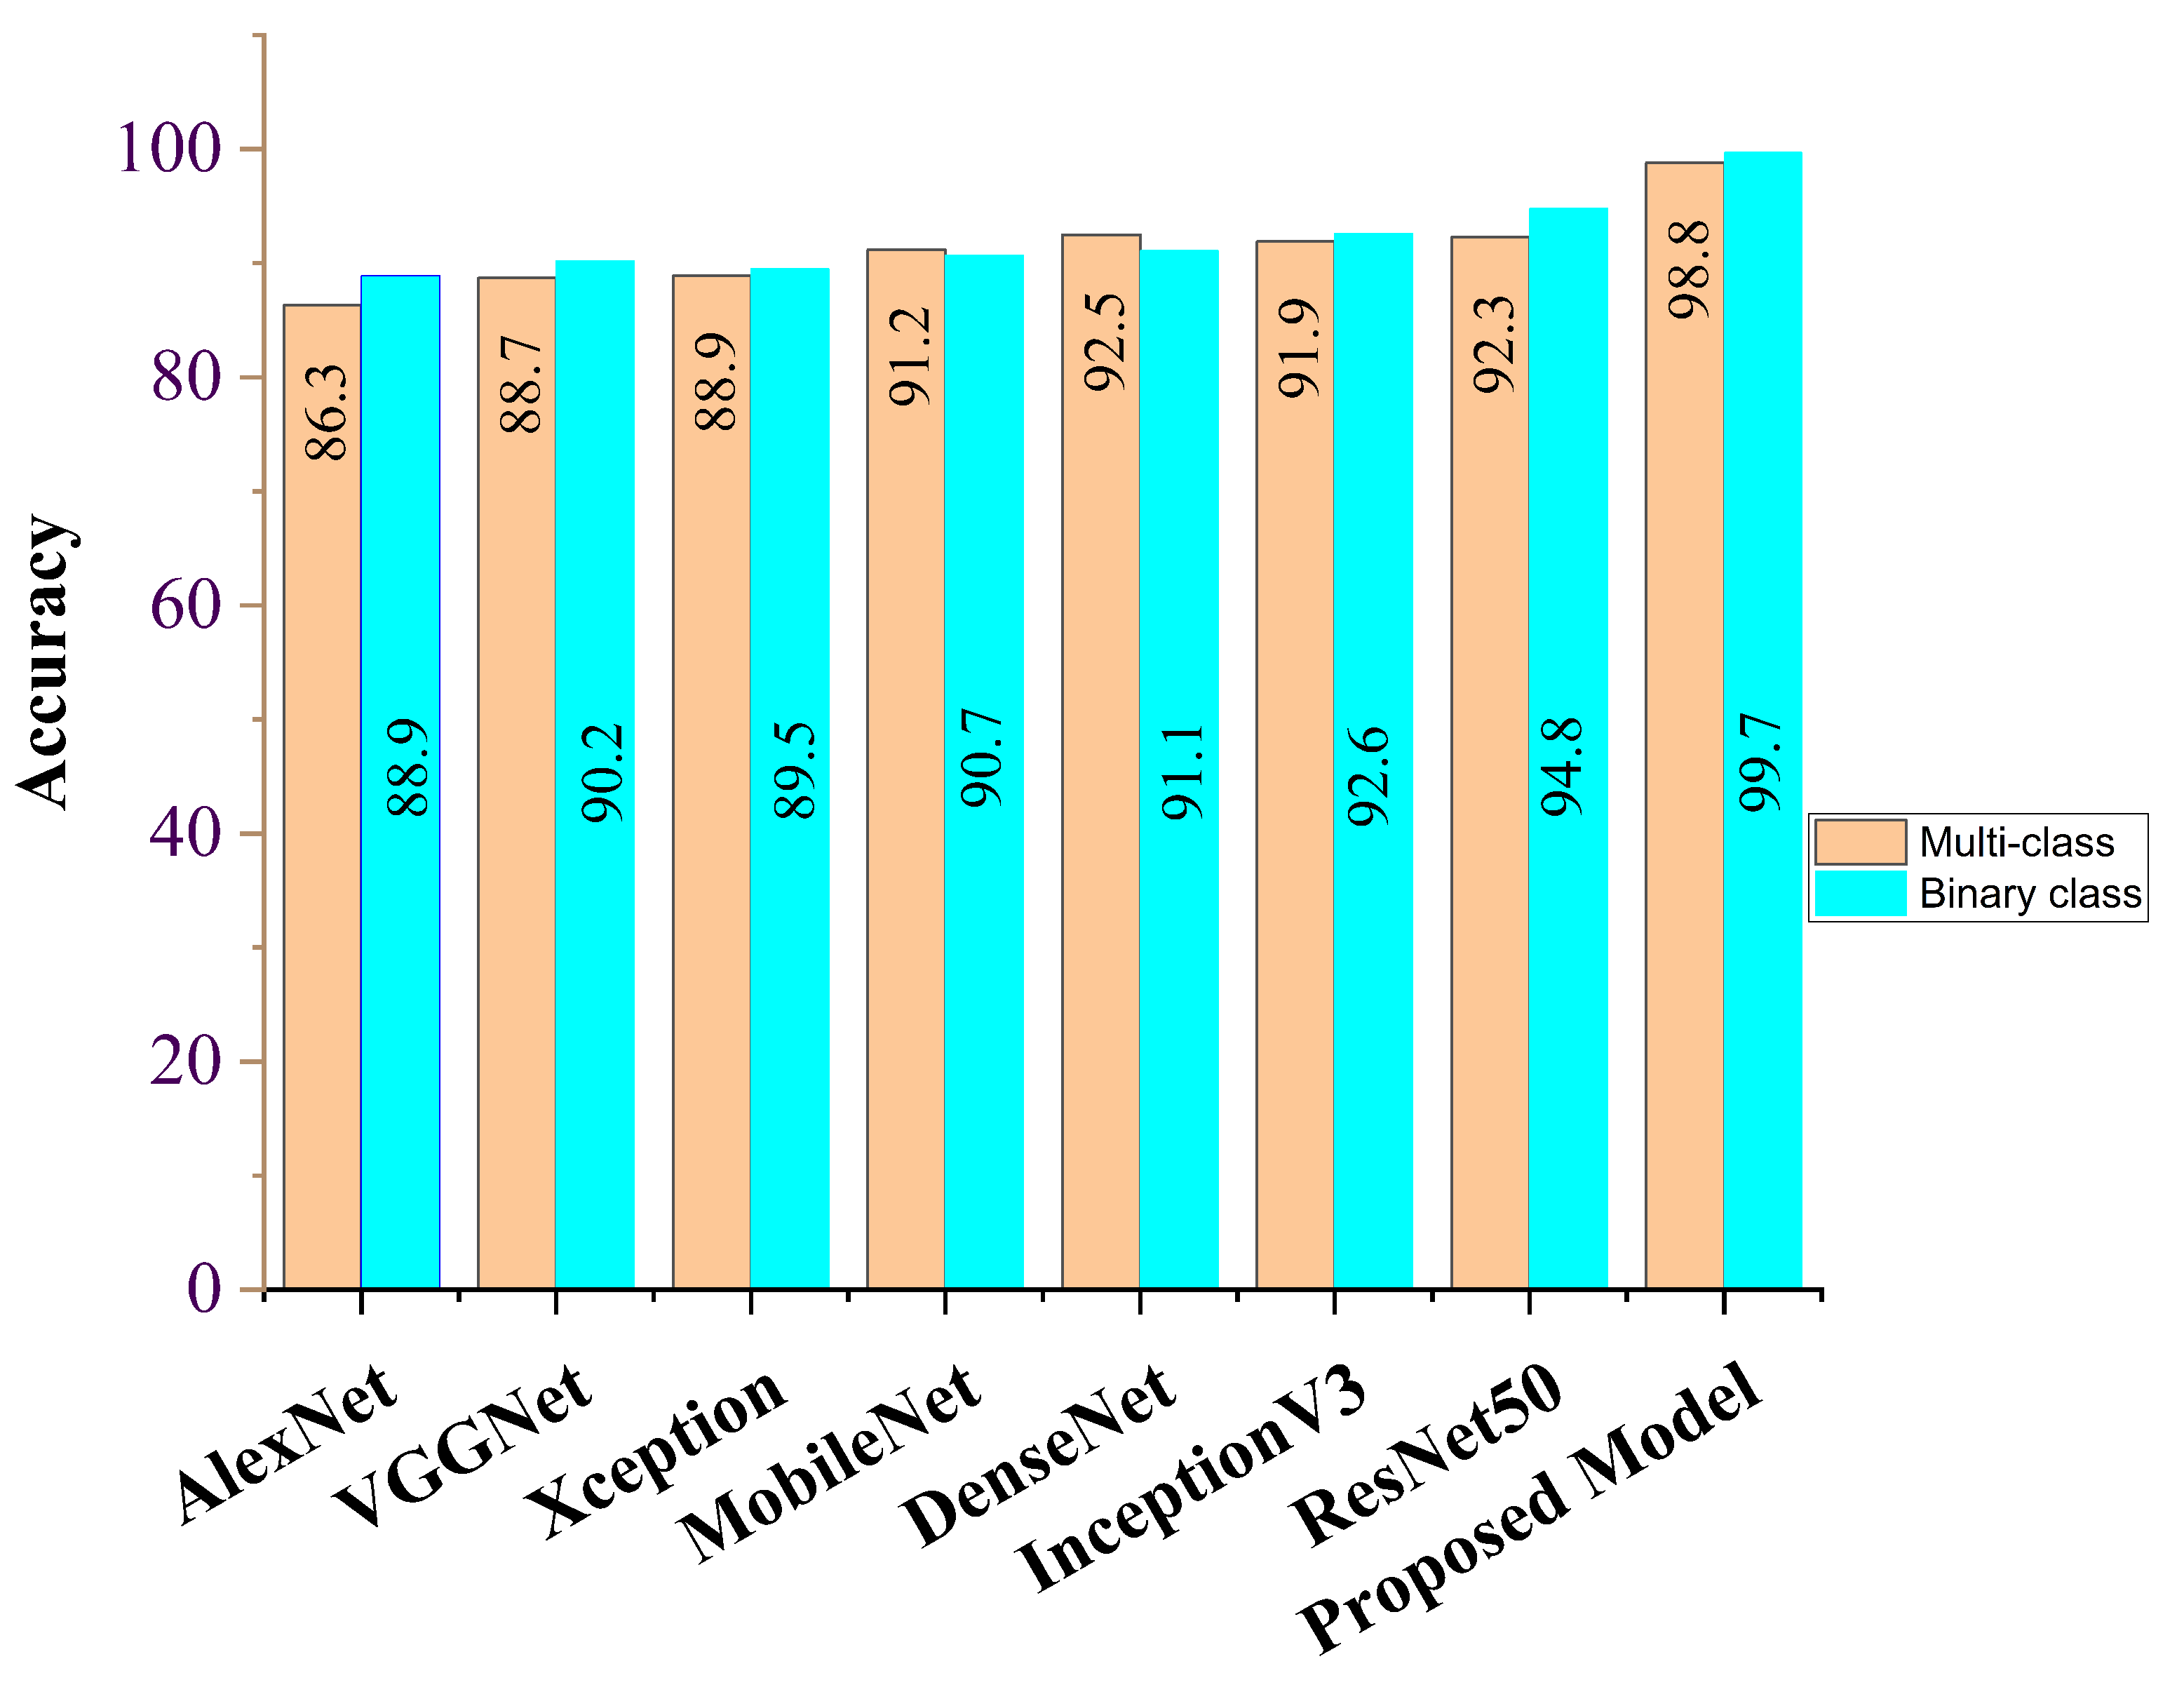
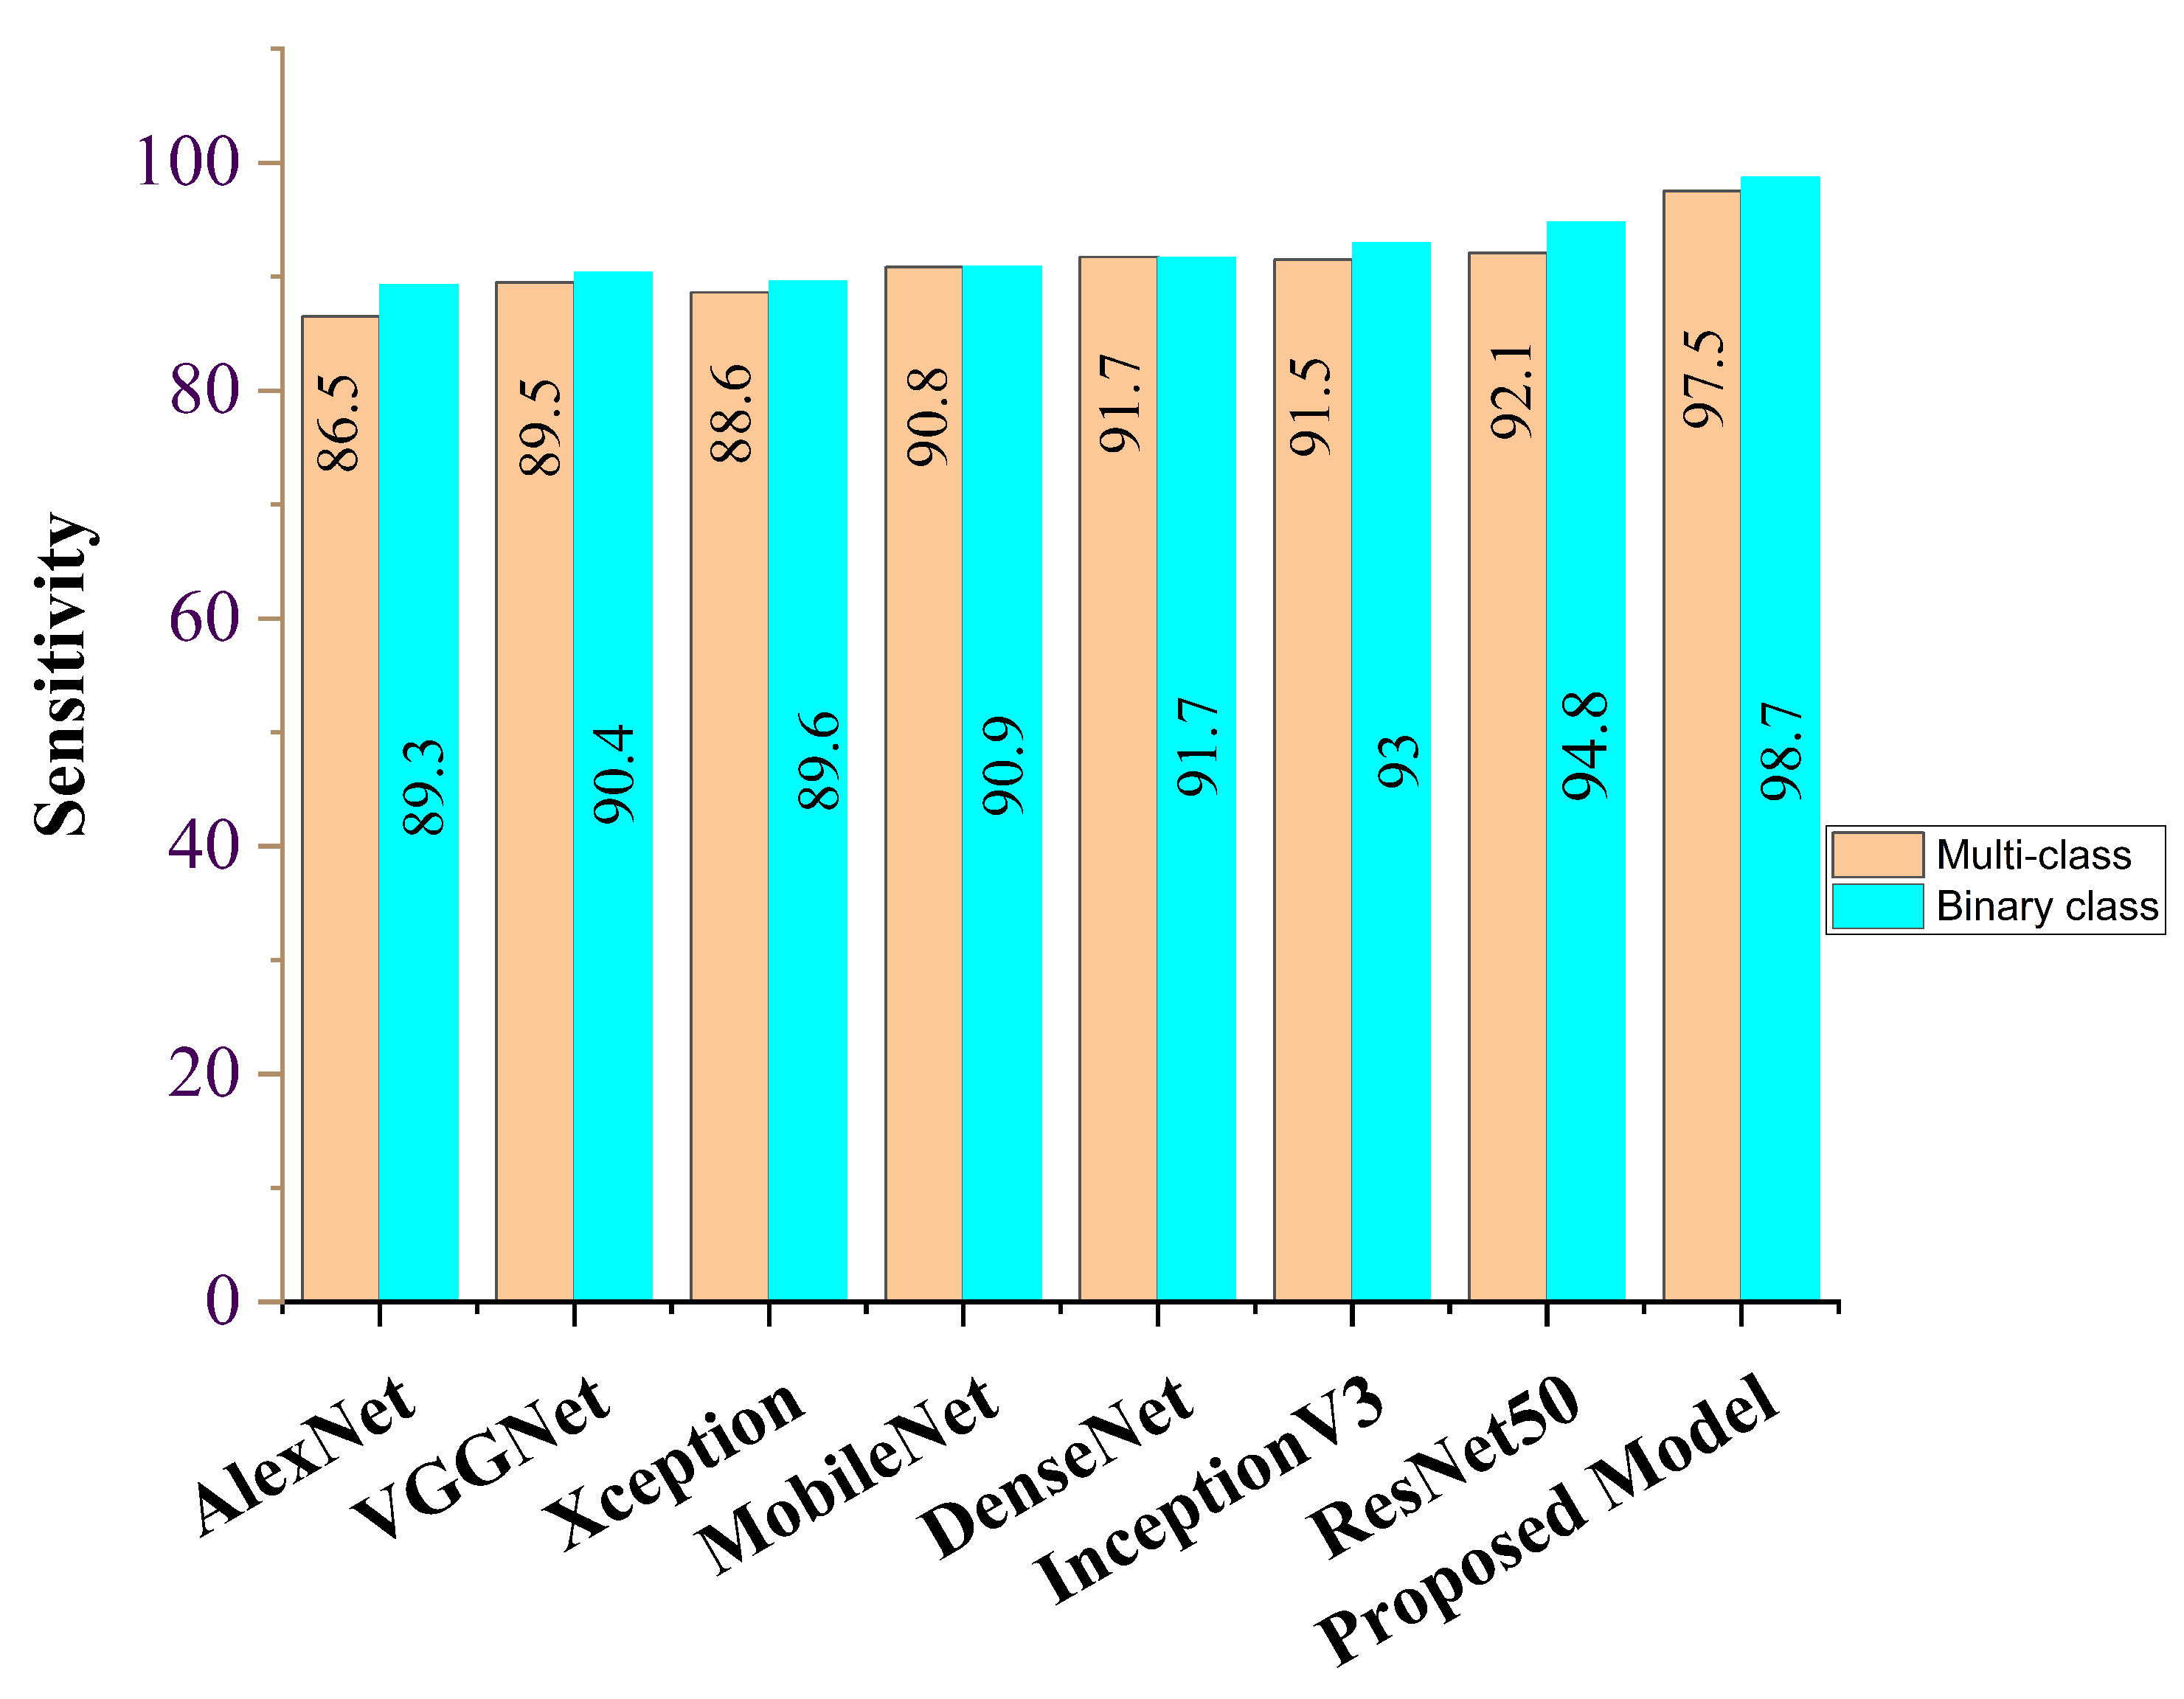
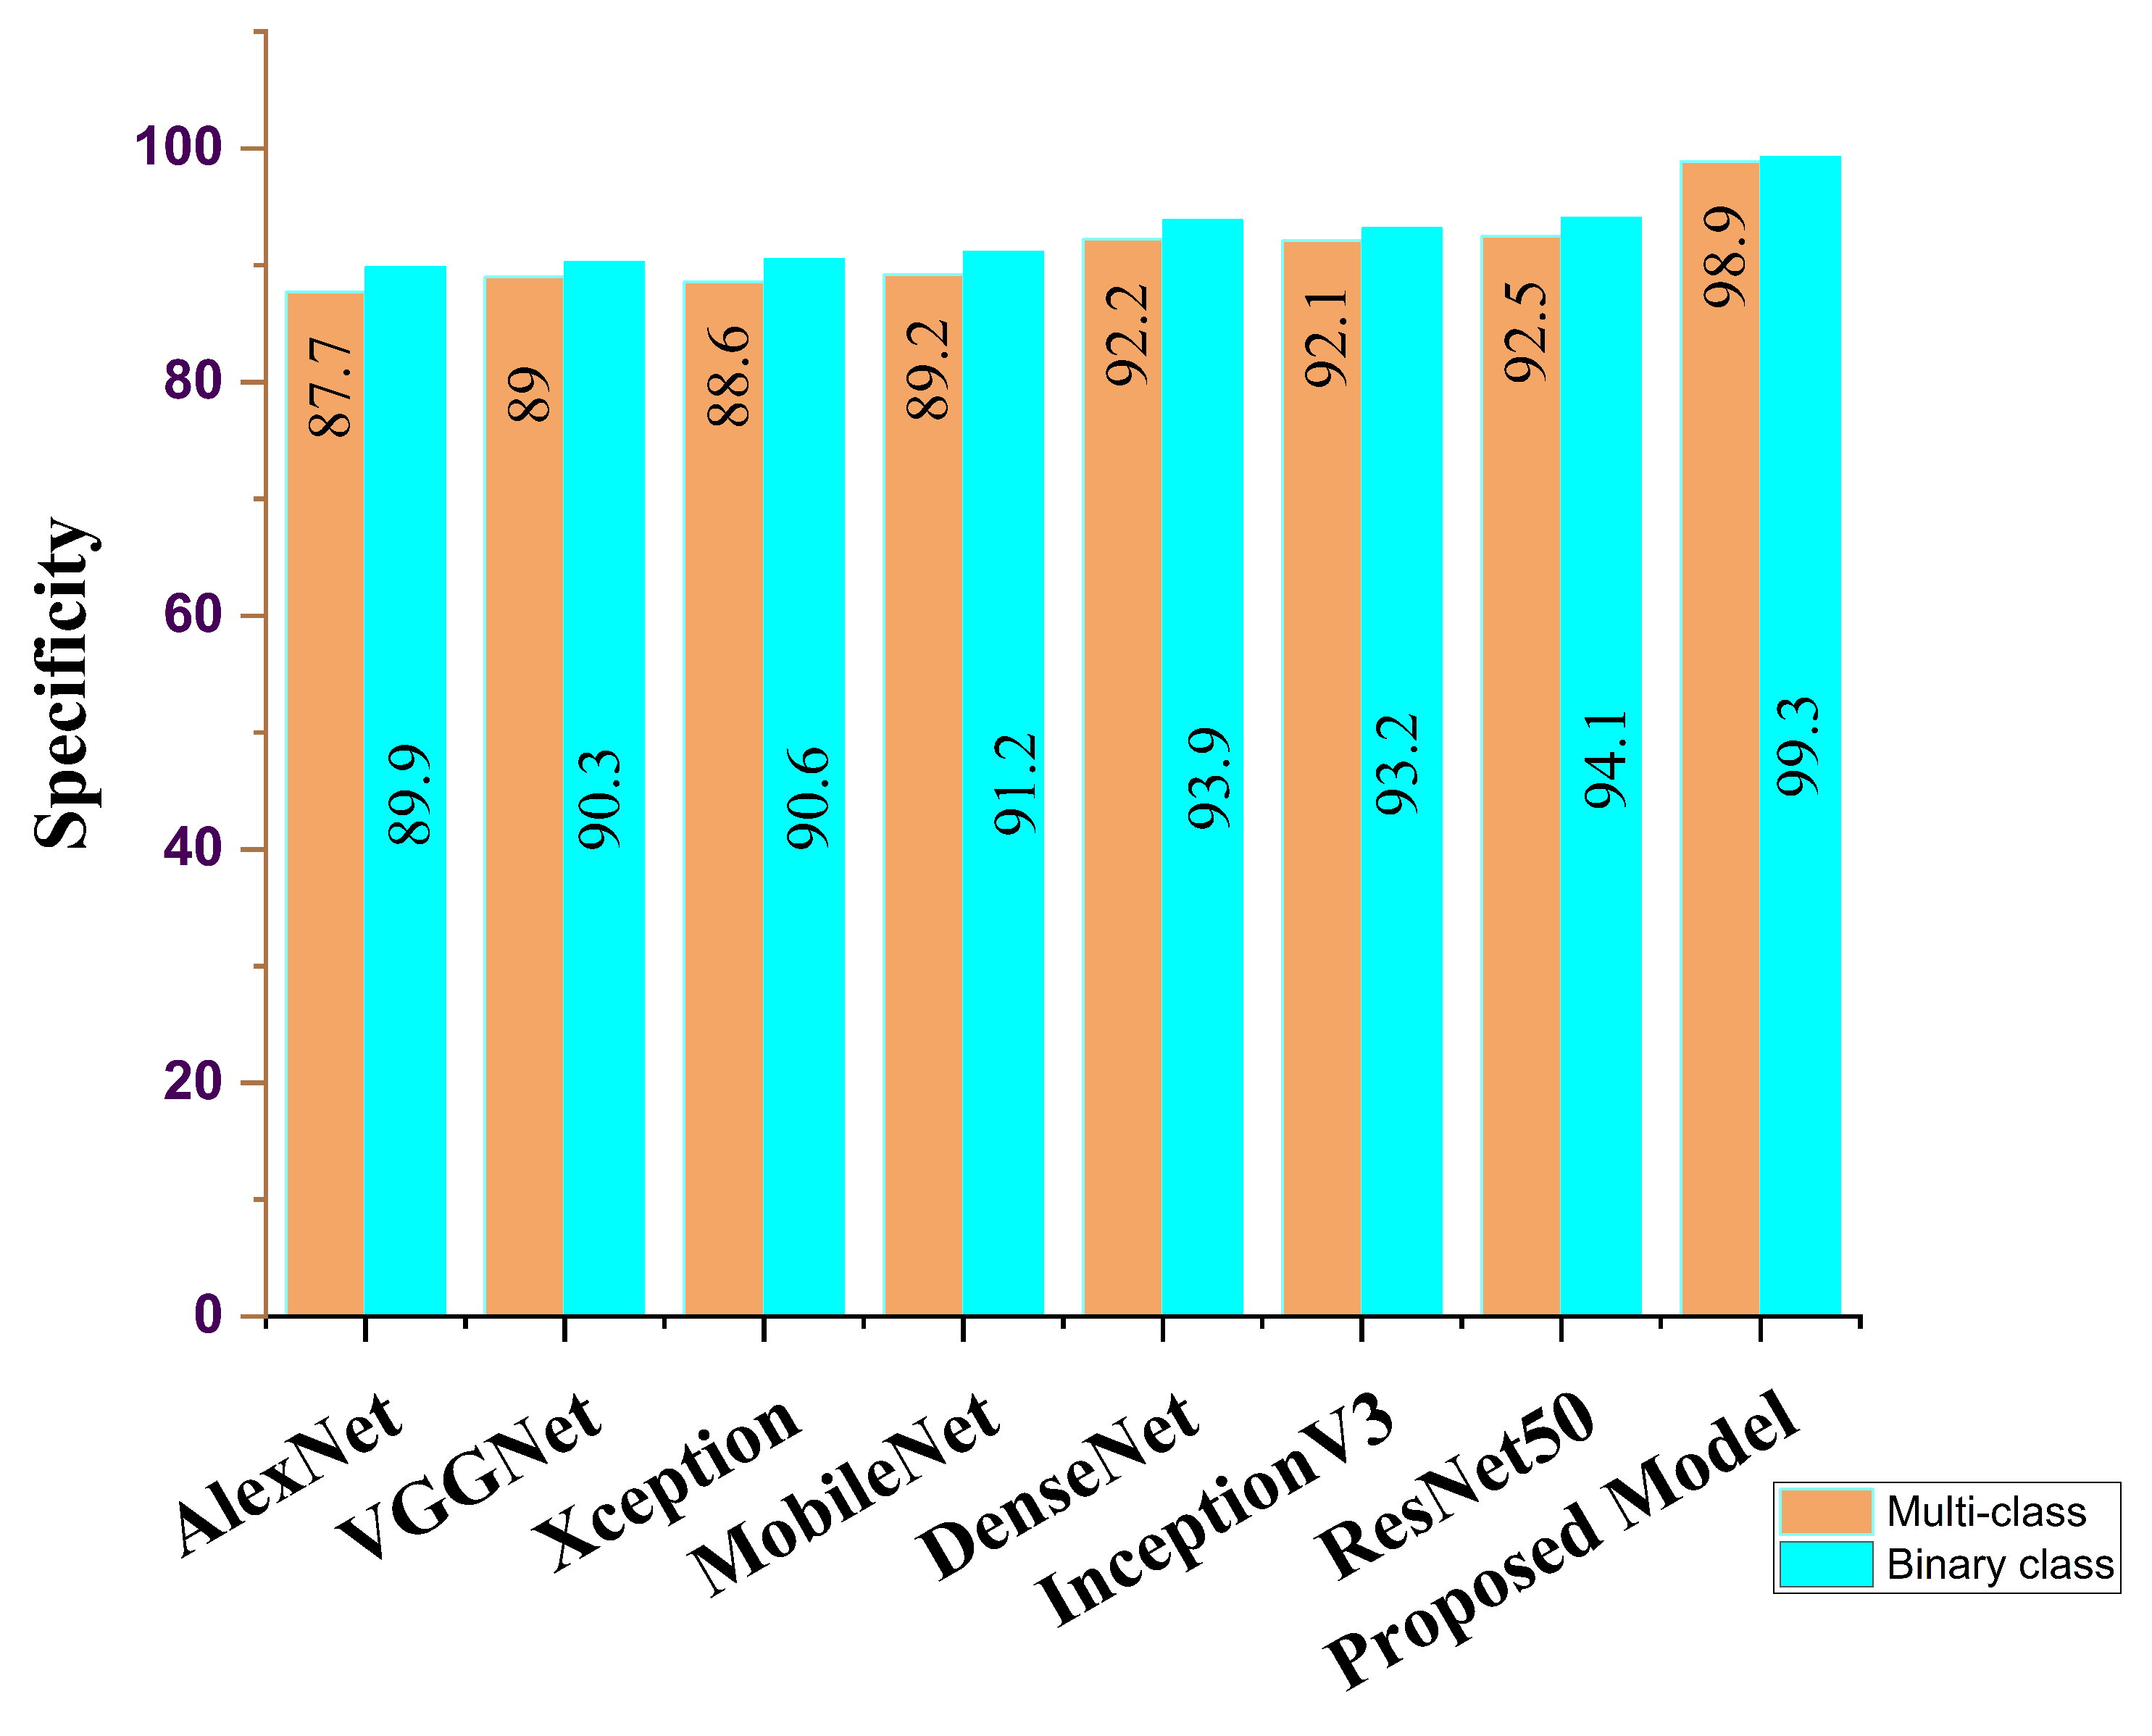
| Ours | 98.8 | 97.5 | 98.9 | 98.8 | 98.6 | 97.8 |
| Feature Learning Model | ACC (%) | SEN (%) | SPE (%) | AUC (%) | PRE (%) | F1 Score (%) |
|---|---|---|---|---|---|---|
| AlexNet | 88.9 | 89.3 | 89.9 | 89.1 | 88.2 | 89.5 |
| VGG16 | 90.2 | 90.4 | 90.3 | 90.2 | 89.9 | 90.1 |
| Xception | 89.5 | 89.6 | 90.6 | 90.5 | 88.6 | 90.8 |
| MobileNet | 90.7 | 90.9 | 91.2 | 91.6 | 89.8 | 91.7 |
| DenseNet | 91.1 | 91.7 | 93.7 | 90.0 | 90.8 | 91.2 |
| InceptionV3 | 92.6 | 93.0 | 93.2 | 91.5 | 92.2 | 92.1 |
| ResNet50 | 94.8 | 94.8 | 94.1 | 93.0 | 93.6 | 93.8 |
| Ours | 99.7 | 98.7 | 99.3 | 99.7 | 98.9 | 98.2 |
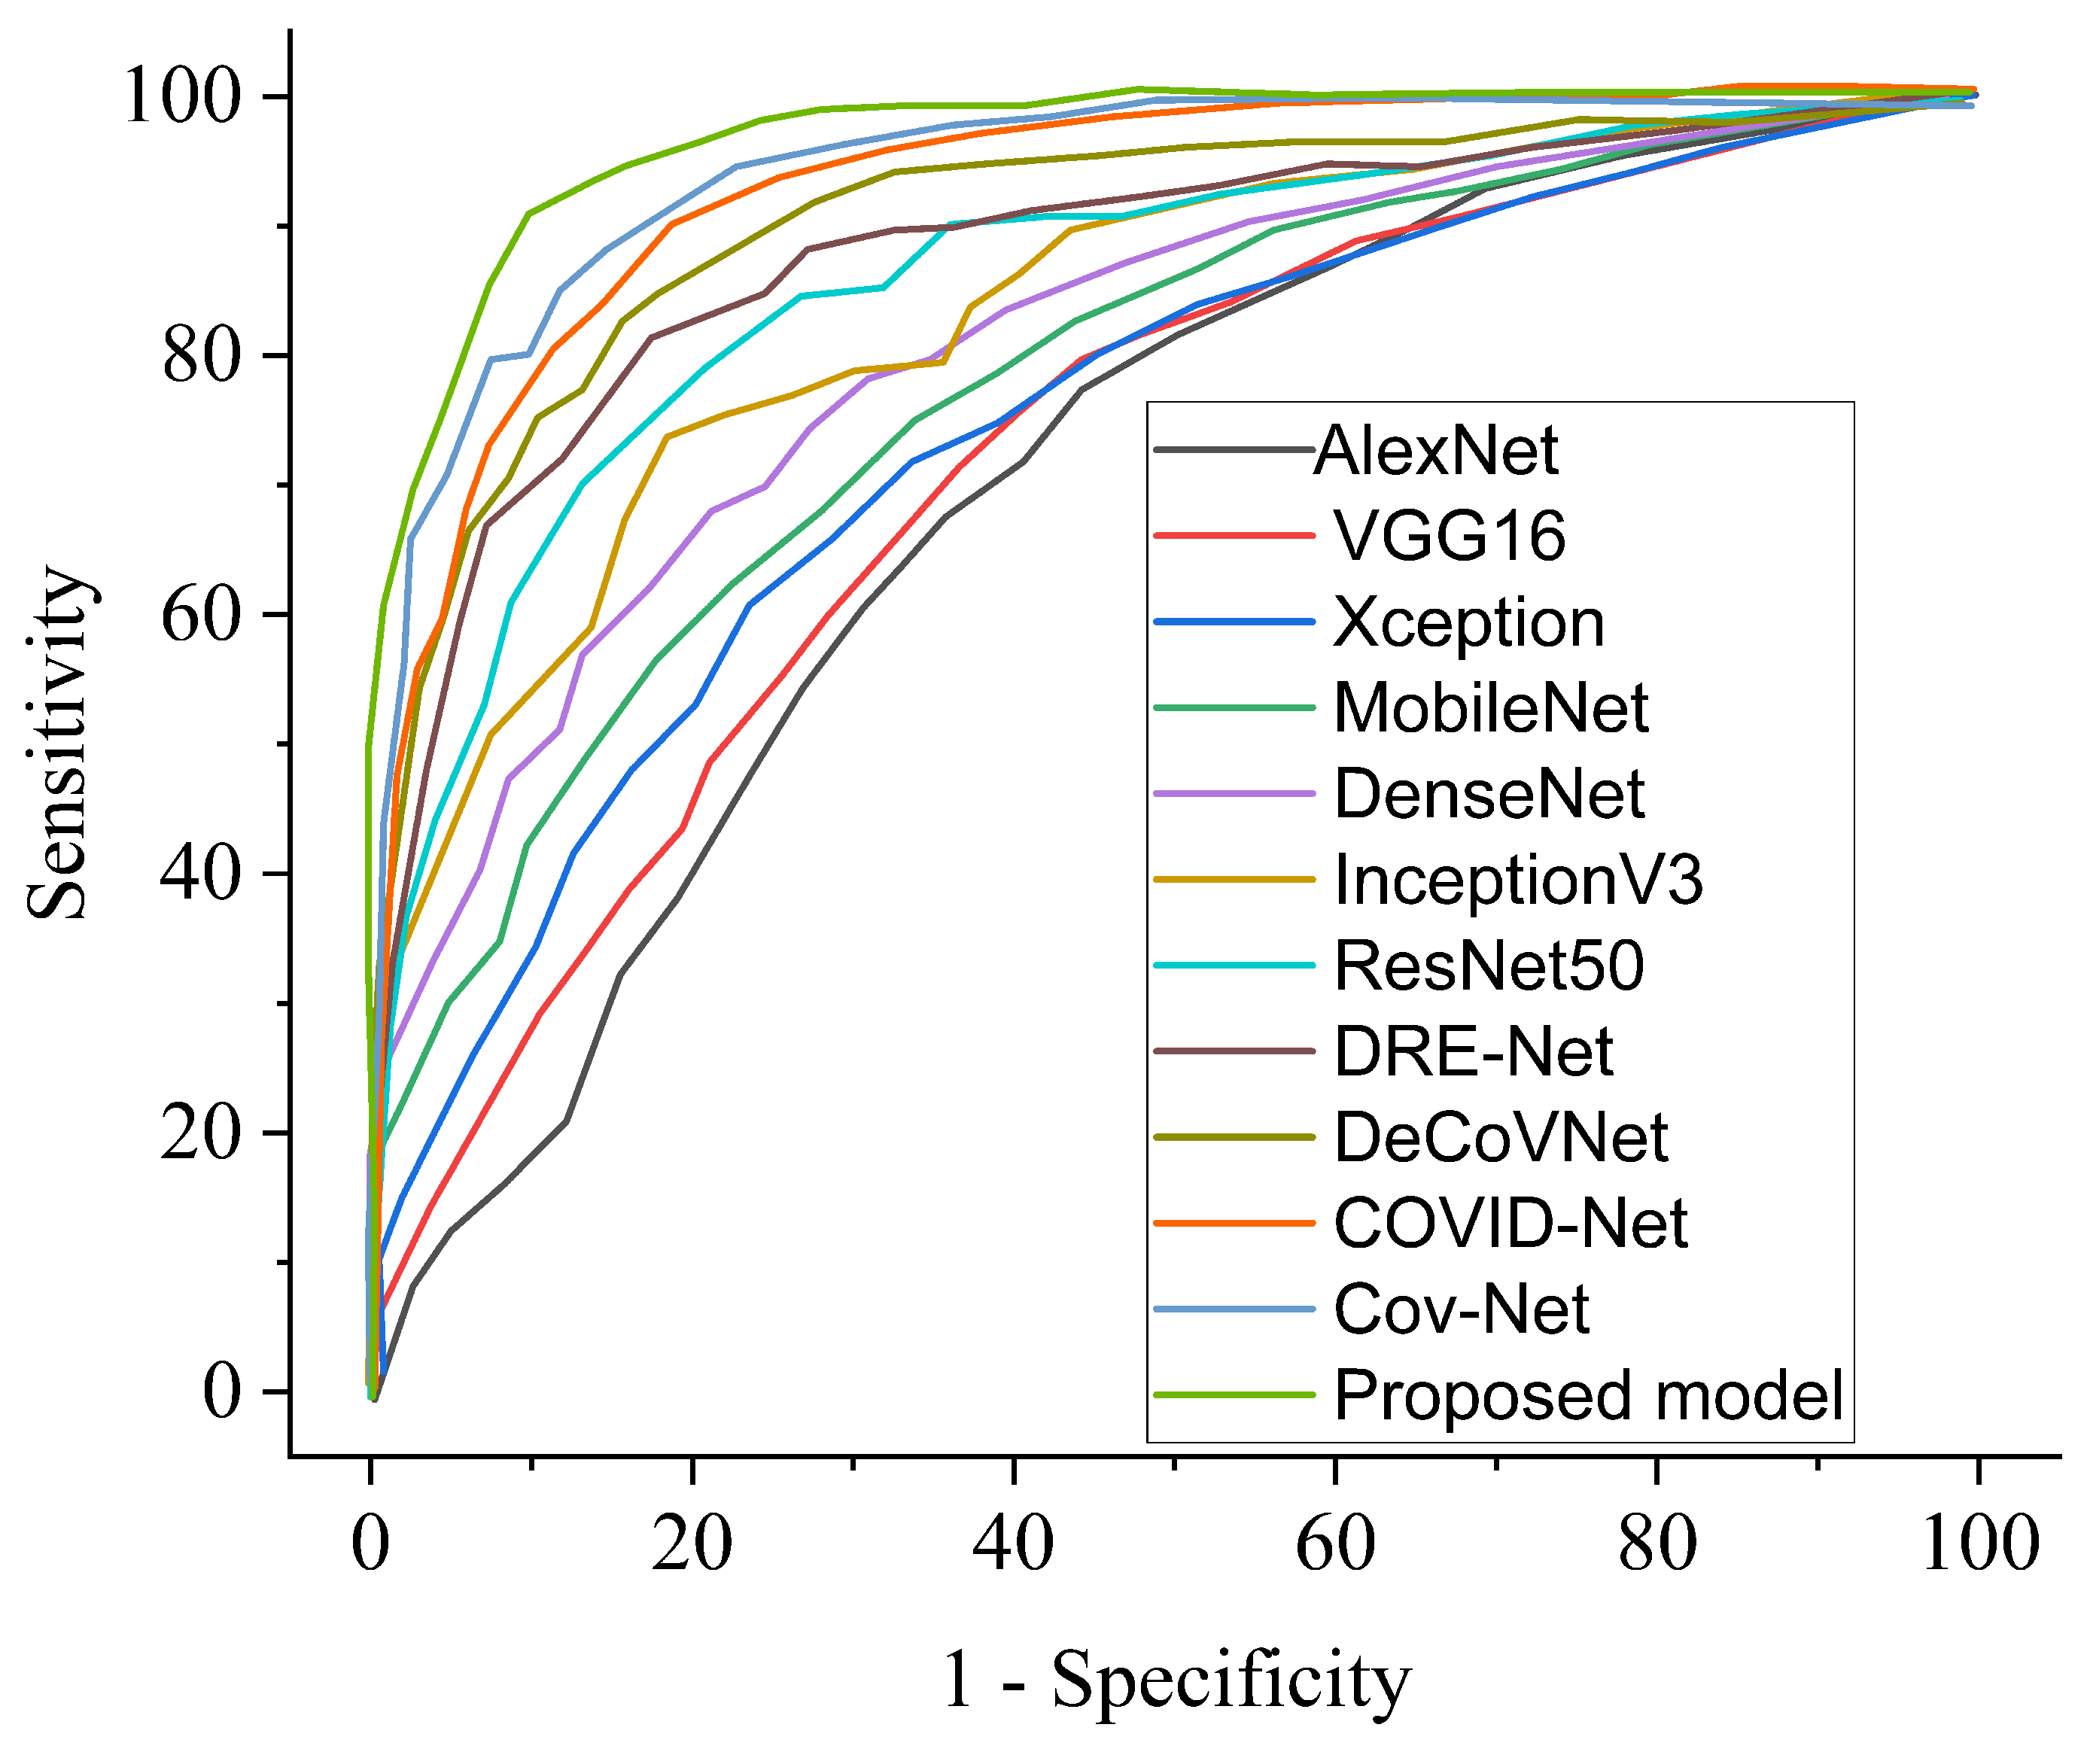
| COVID-19 Model | ACC (%) | SEN (%) | SPE (%) | AUC (%) | PRE (%) |
|---|---|---|---|---|---|
| COVID-Net [11] | 90.5 | 89.2 | 91.1 | 89.9 | 90.0 |
| DRE-Net [47] | 86.1 | 86.7 | 85.9 | 86.0 | 85.8 |
| DeCoVNet [49] | 93.4 | 92.8 | 93.2 | 92.1 | 91.5 |
| Cov-Net [28] | 96.7 | 95.9 | 96.3 | 96.1 | 96.5 |
| Ours | 98.8 | 97.5 | 98.9 | 98.8 | 98.6 |
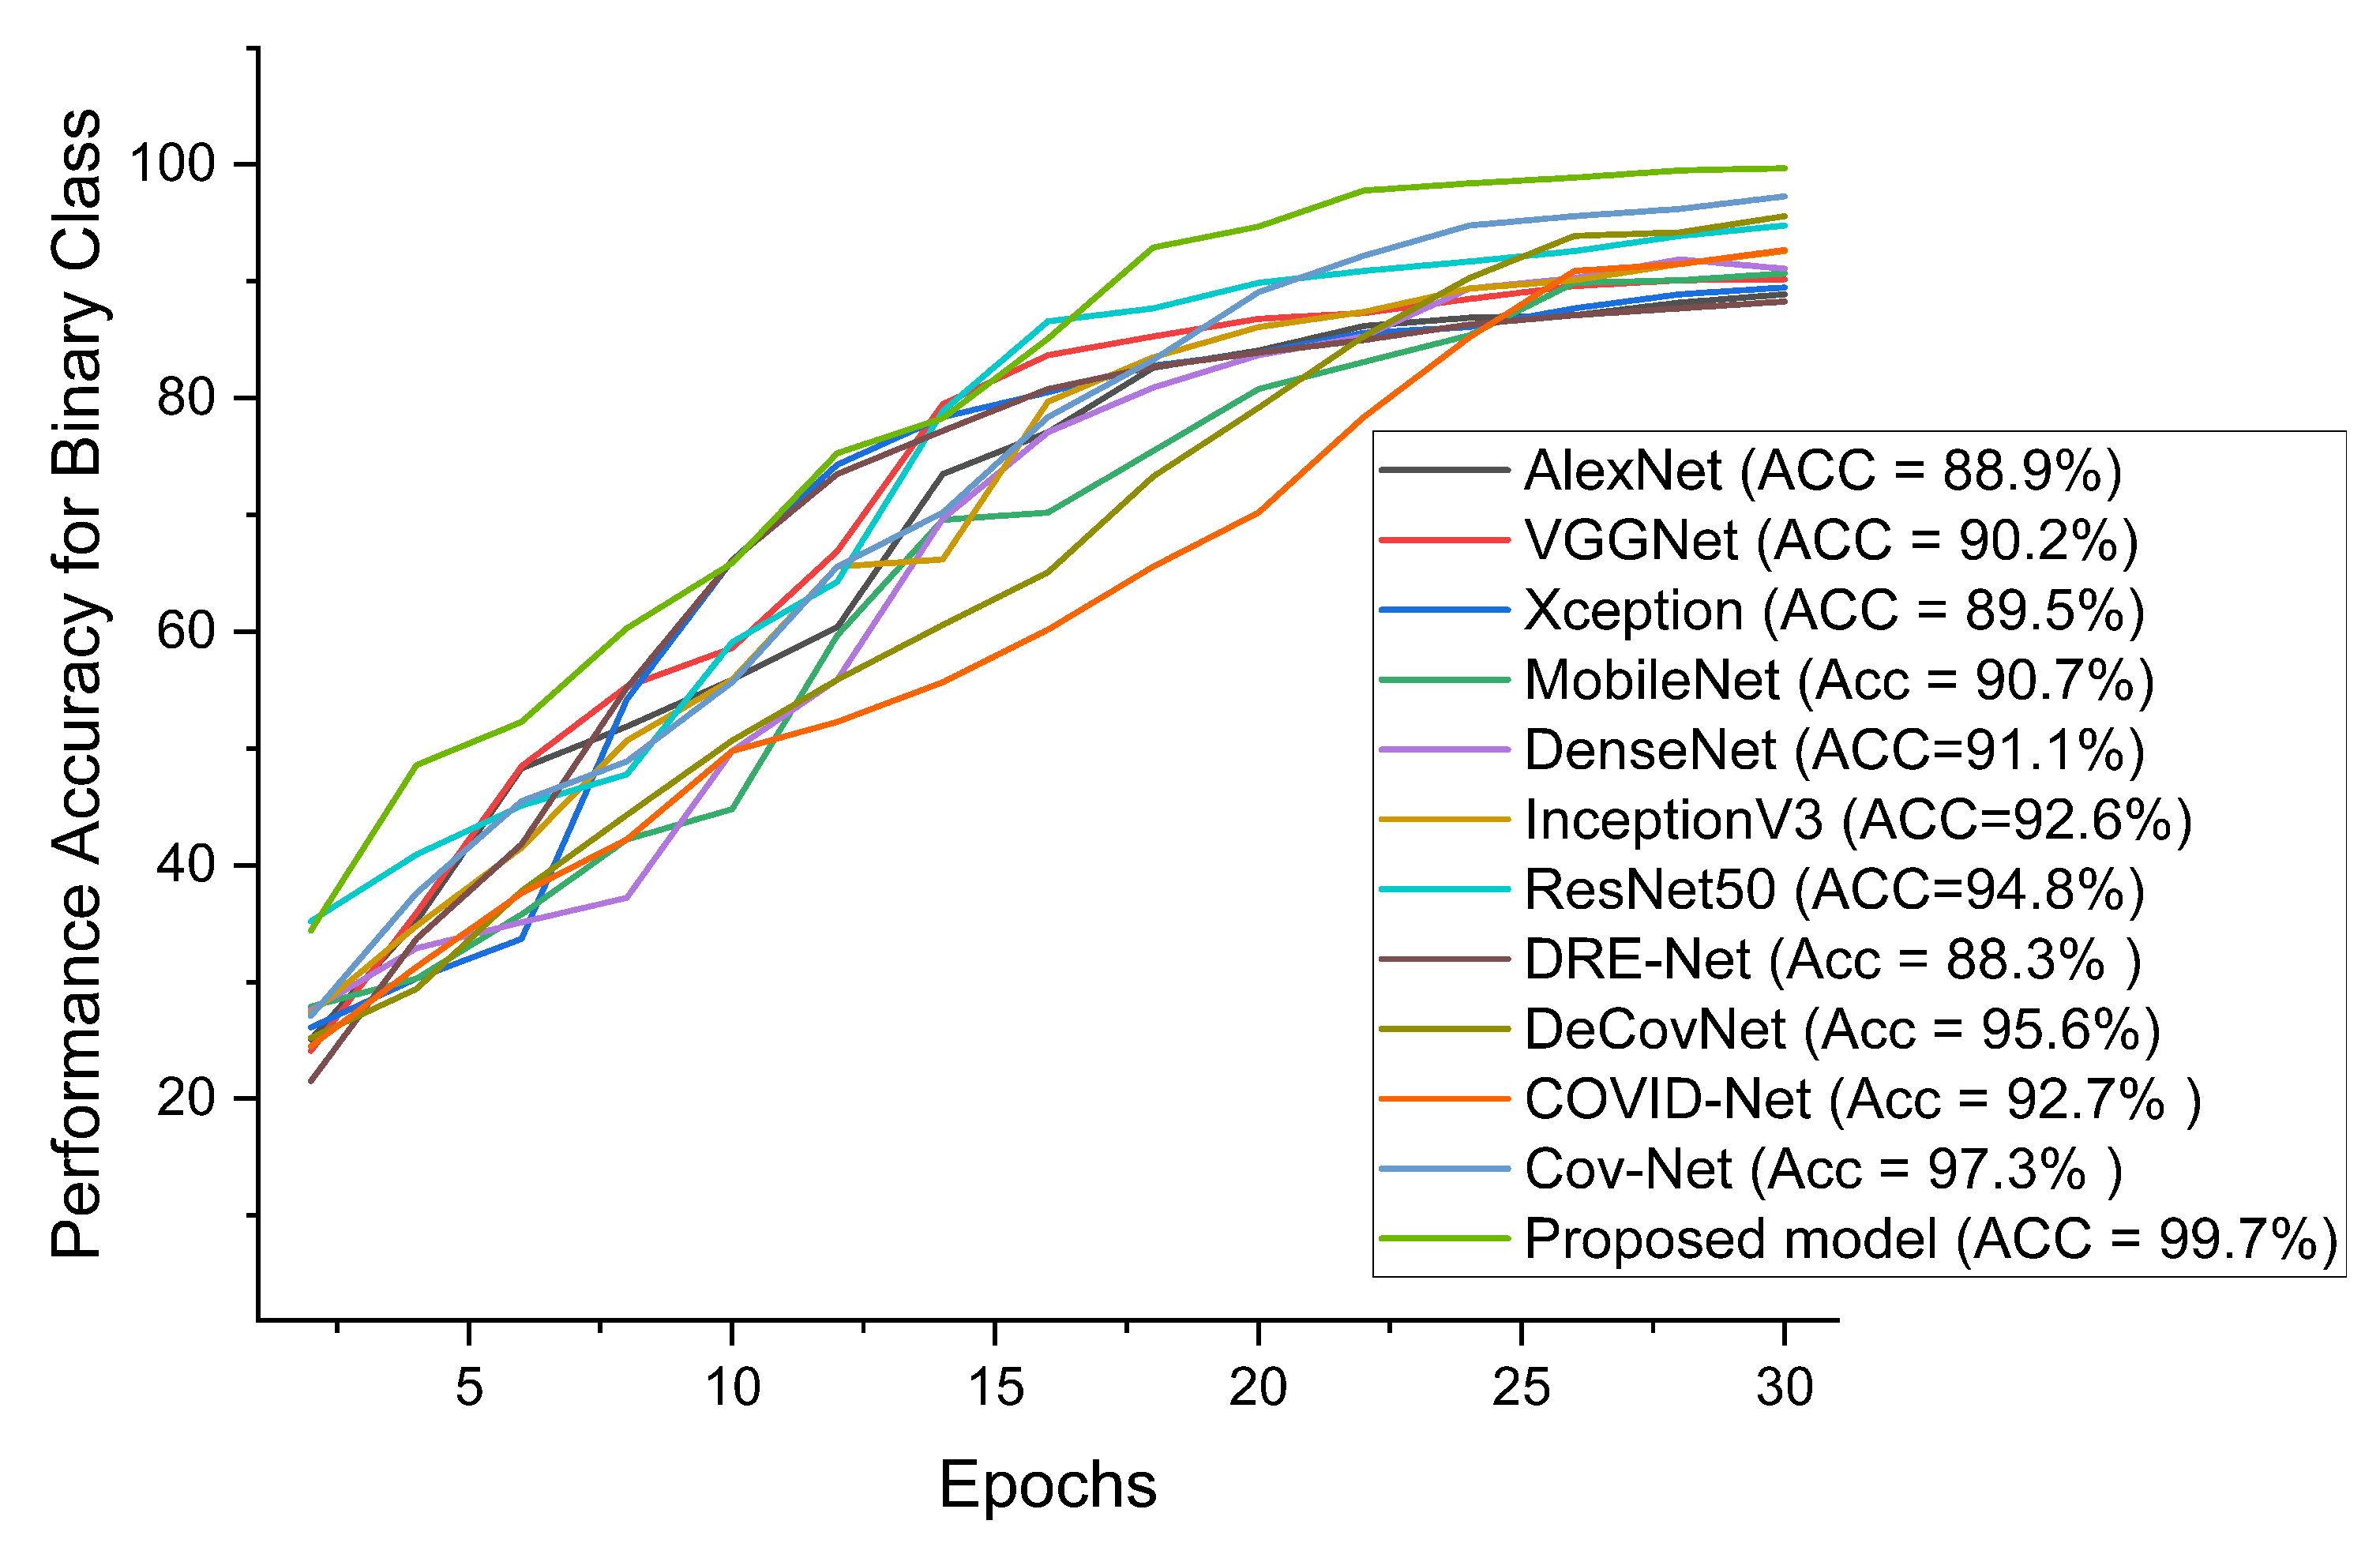
| COVID-19 Model | ACC (%) | SEN (%) | SPE (%) | AUC (%) | PRE (%) |
|---|---|---|---|---|---|
| COVID-Net [11] | 92.7 | 91.8 | 92.8 | 92.2 | 92.5 |
| DRE-Net [47] | 88.3 | 87.5 | 88.2 | 89.4 | 88.8 |
| DeCoVNet [49] | 95.6 | 95.1 | 95.8 | 95.0 | 95.4 |
| Cov-Net [28] | 97.3 | 97.2 | 96.9 | 96.1 | 97.5 |
| Ours | 99.7 | 98.7 | 99.3 | 99.7 | 98.9 |
Publisher’s Note: MDPI stays neutral with regard to jurisdictional claims in published maps and institutional affiliations. |
© 2022 by the authors. Licensee MDPI, Basel, Switzerland. This article is an open access article distributed under the terms and conditions of the Creative Commons Attribution (CC BY) license (https://creativecommons.org/licenses/by/4.0/).
Share and Cite
Nneji, G.U.; Cai, J.; Monday, H.N.; Hossin, M.A.; Nahar, S.; Mgbejime, G.T.; Deng, J. Fine-Tuned Siamese Network with Modified Enhanced Super-Resolution GAN Plus Based on Low-Quality Chest X-ray Images for COVID-19 Identification. Diagnostics 2022, 12, 717. https://doi.org/10.3390/diagnostics12030717
Nneji GU, Cai J, Monday HN, Hossin MA, Nahar S, Mgbejime GT, Deng J. Fine-Tuned Siamese Network with Modified Enhanced Super-Resolution GAN Plus Based on Low-Quality Chest X-ray Images for COVID-19 Identification. Diagnostics. 2022; 12(3):717. https://doi.org/10.3390/diagnostics12030717
Chicago/Turabian StyleNneji, Grace Ugochi, Jingye Cai, Happy Nkanta Monday, Md Altab Hossin, Saifun Nahar, Goodness Temofe Mgbejime, and Jianhua Deng. 2022. "Fine-Tuned Siamese Network with Modified Enhanced Super-Resolution GAN Plus Based on Low-Quality Chest X-ray Images for COVID-19 Identification" Diagnostics 12, no. 3: 717. https://doi.org/10.3390/diagnostics12030717
APA StyleNneji, G. U., Cai, J., Monday, H. N., Hossin, M. A., Nahar, S., Mgbejime, G. T., & Deng, J. (2022). Fine-Tuned Siamese Network with Modified Enhanced Super-Resolution GAN Plus Based on Low-Quality Chest X-ray Images for COVID-19 Identification. Diagnostics, 12(3), 717. https://doi.org/10.3390/diagnostics12030717