
Open-Source, Adaptable, All-in-One Smartphone-Based System for Quantitative Analysis of Point-of-Care Diagnostics

 , , , , , and
Abstract
:1. Introduction
2. Materials and Methods
2.1. Image Acquisition
2.2. R Package Development and Functionality of the Apps
2.3. Analyzed Assays
3. Results
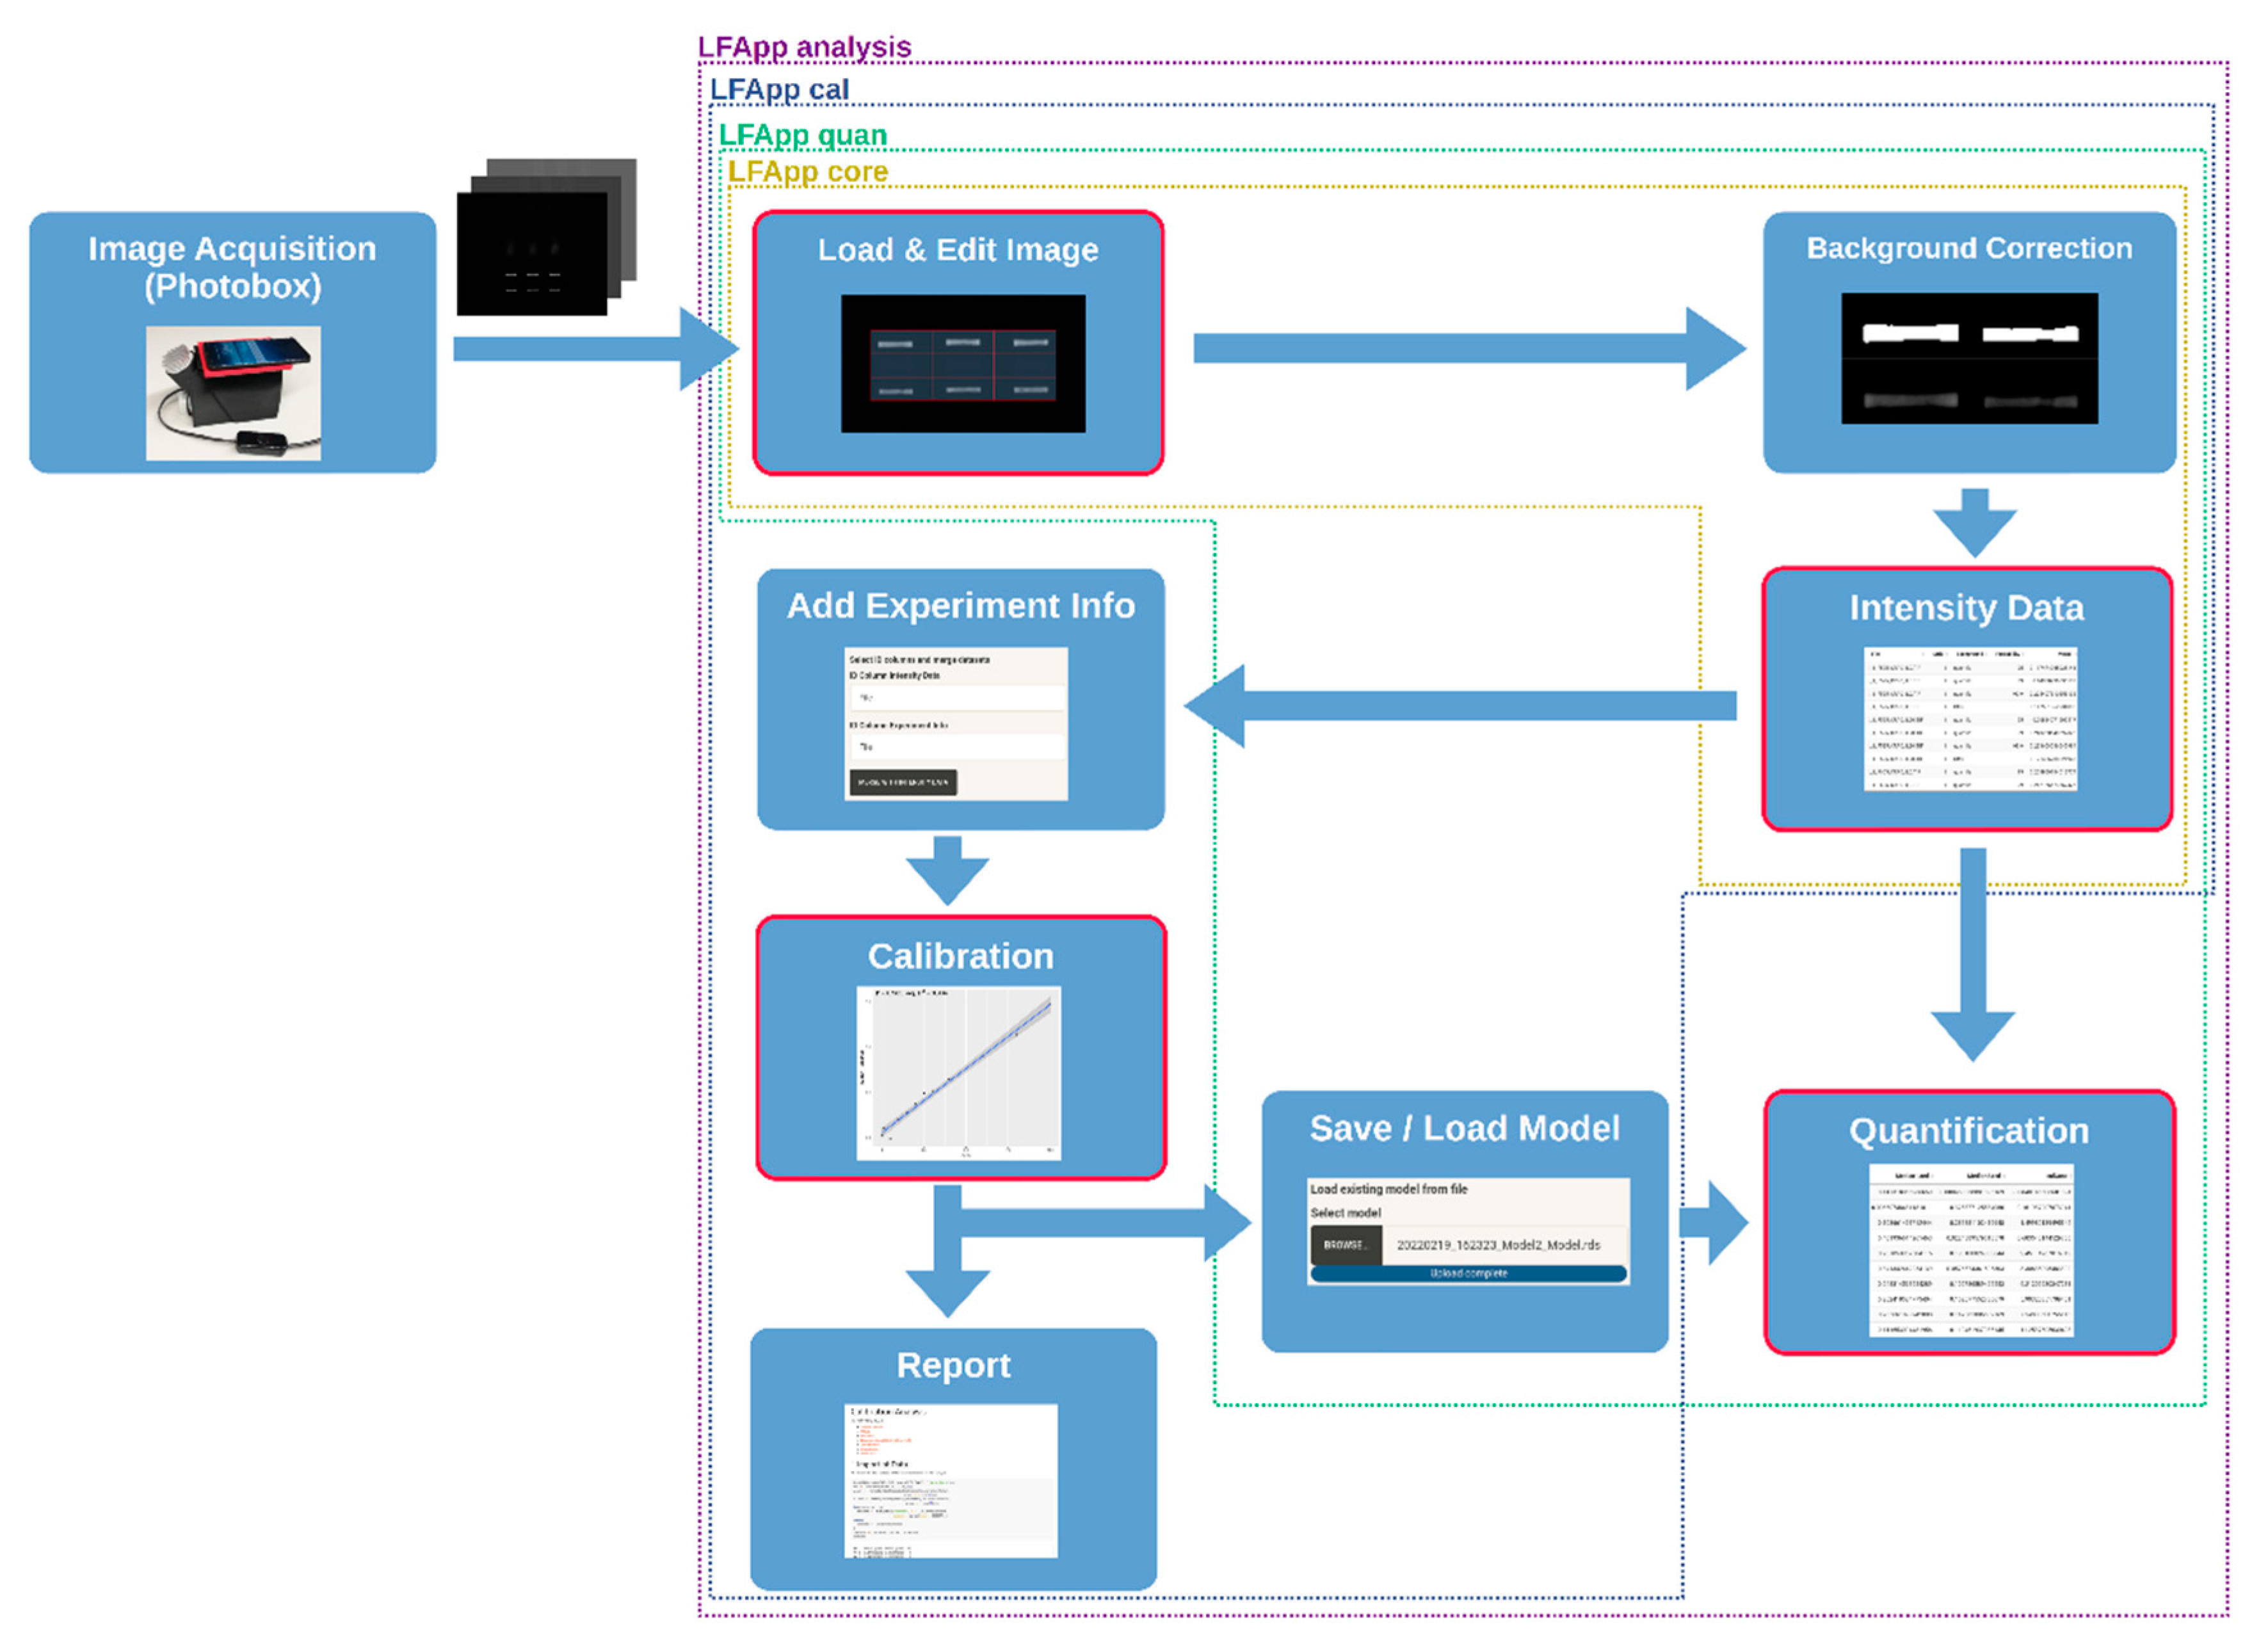
- (1)
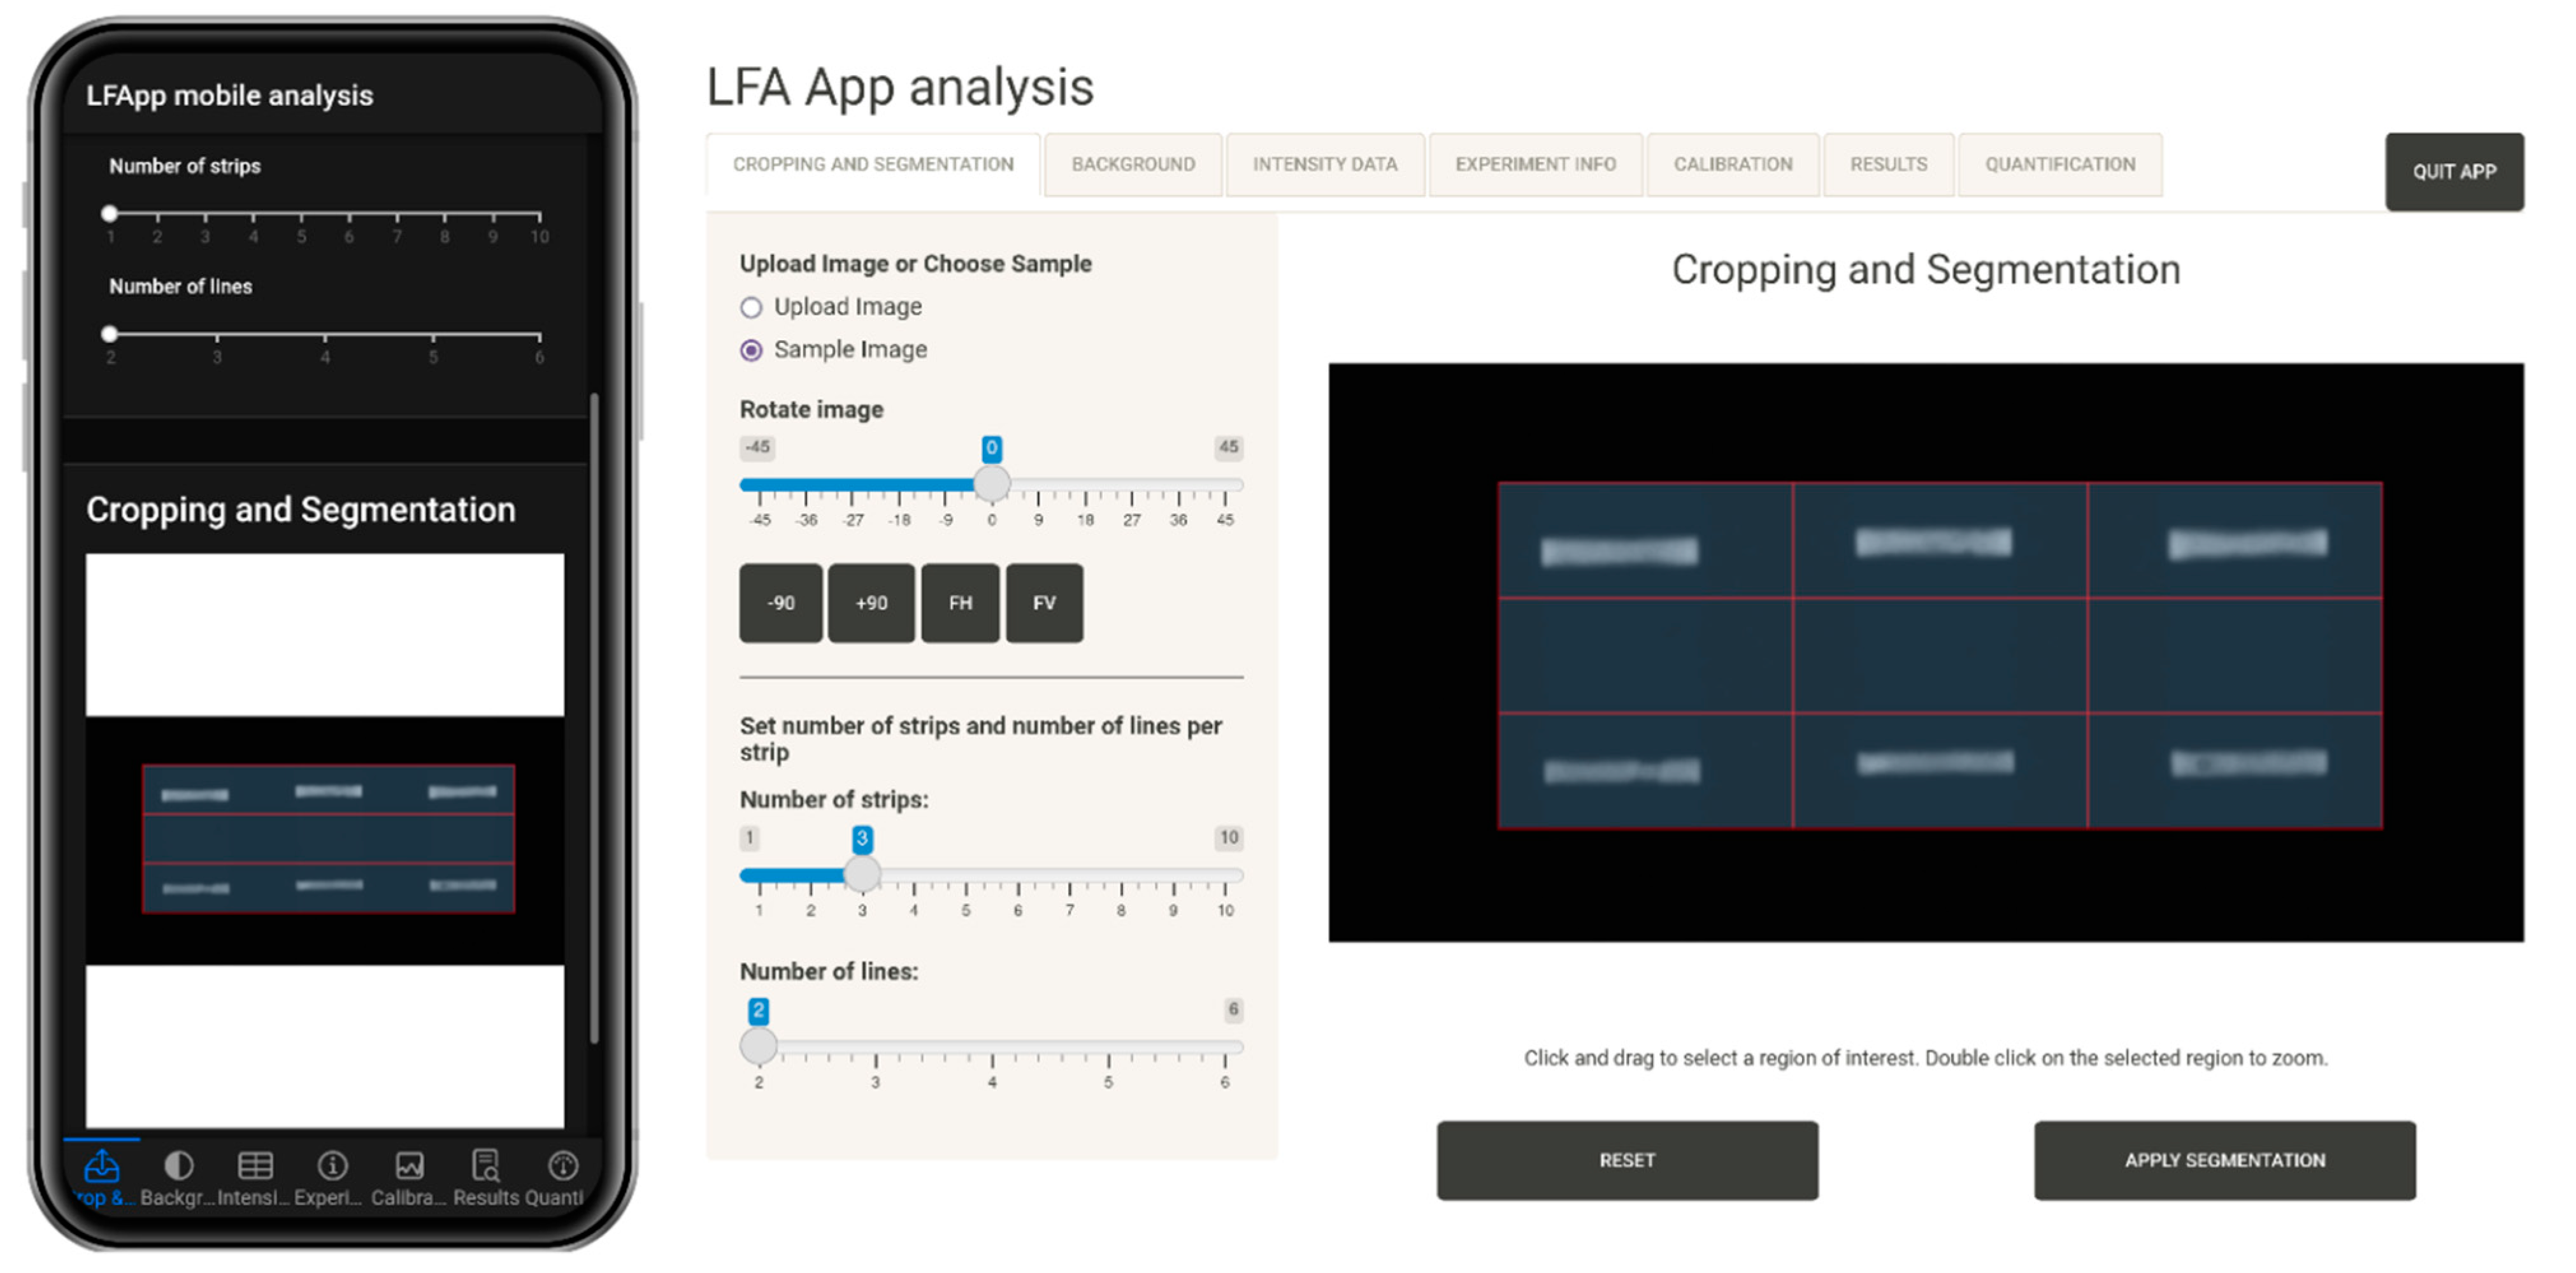
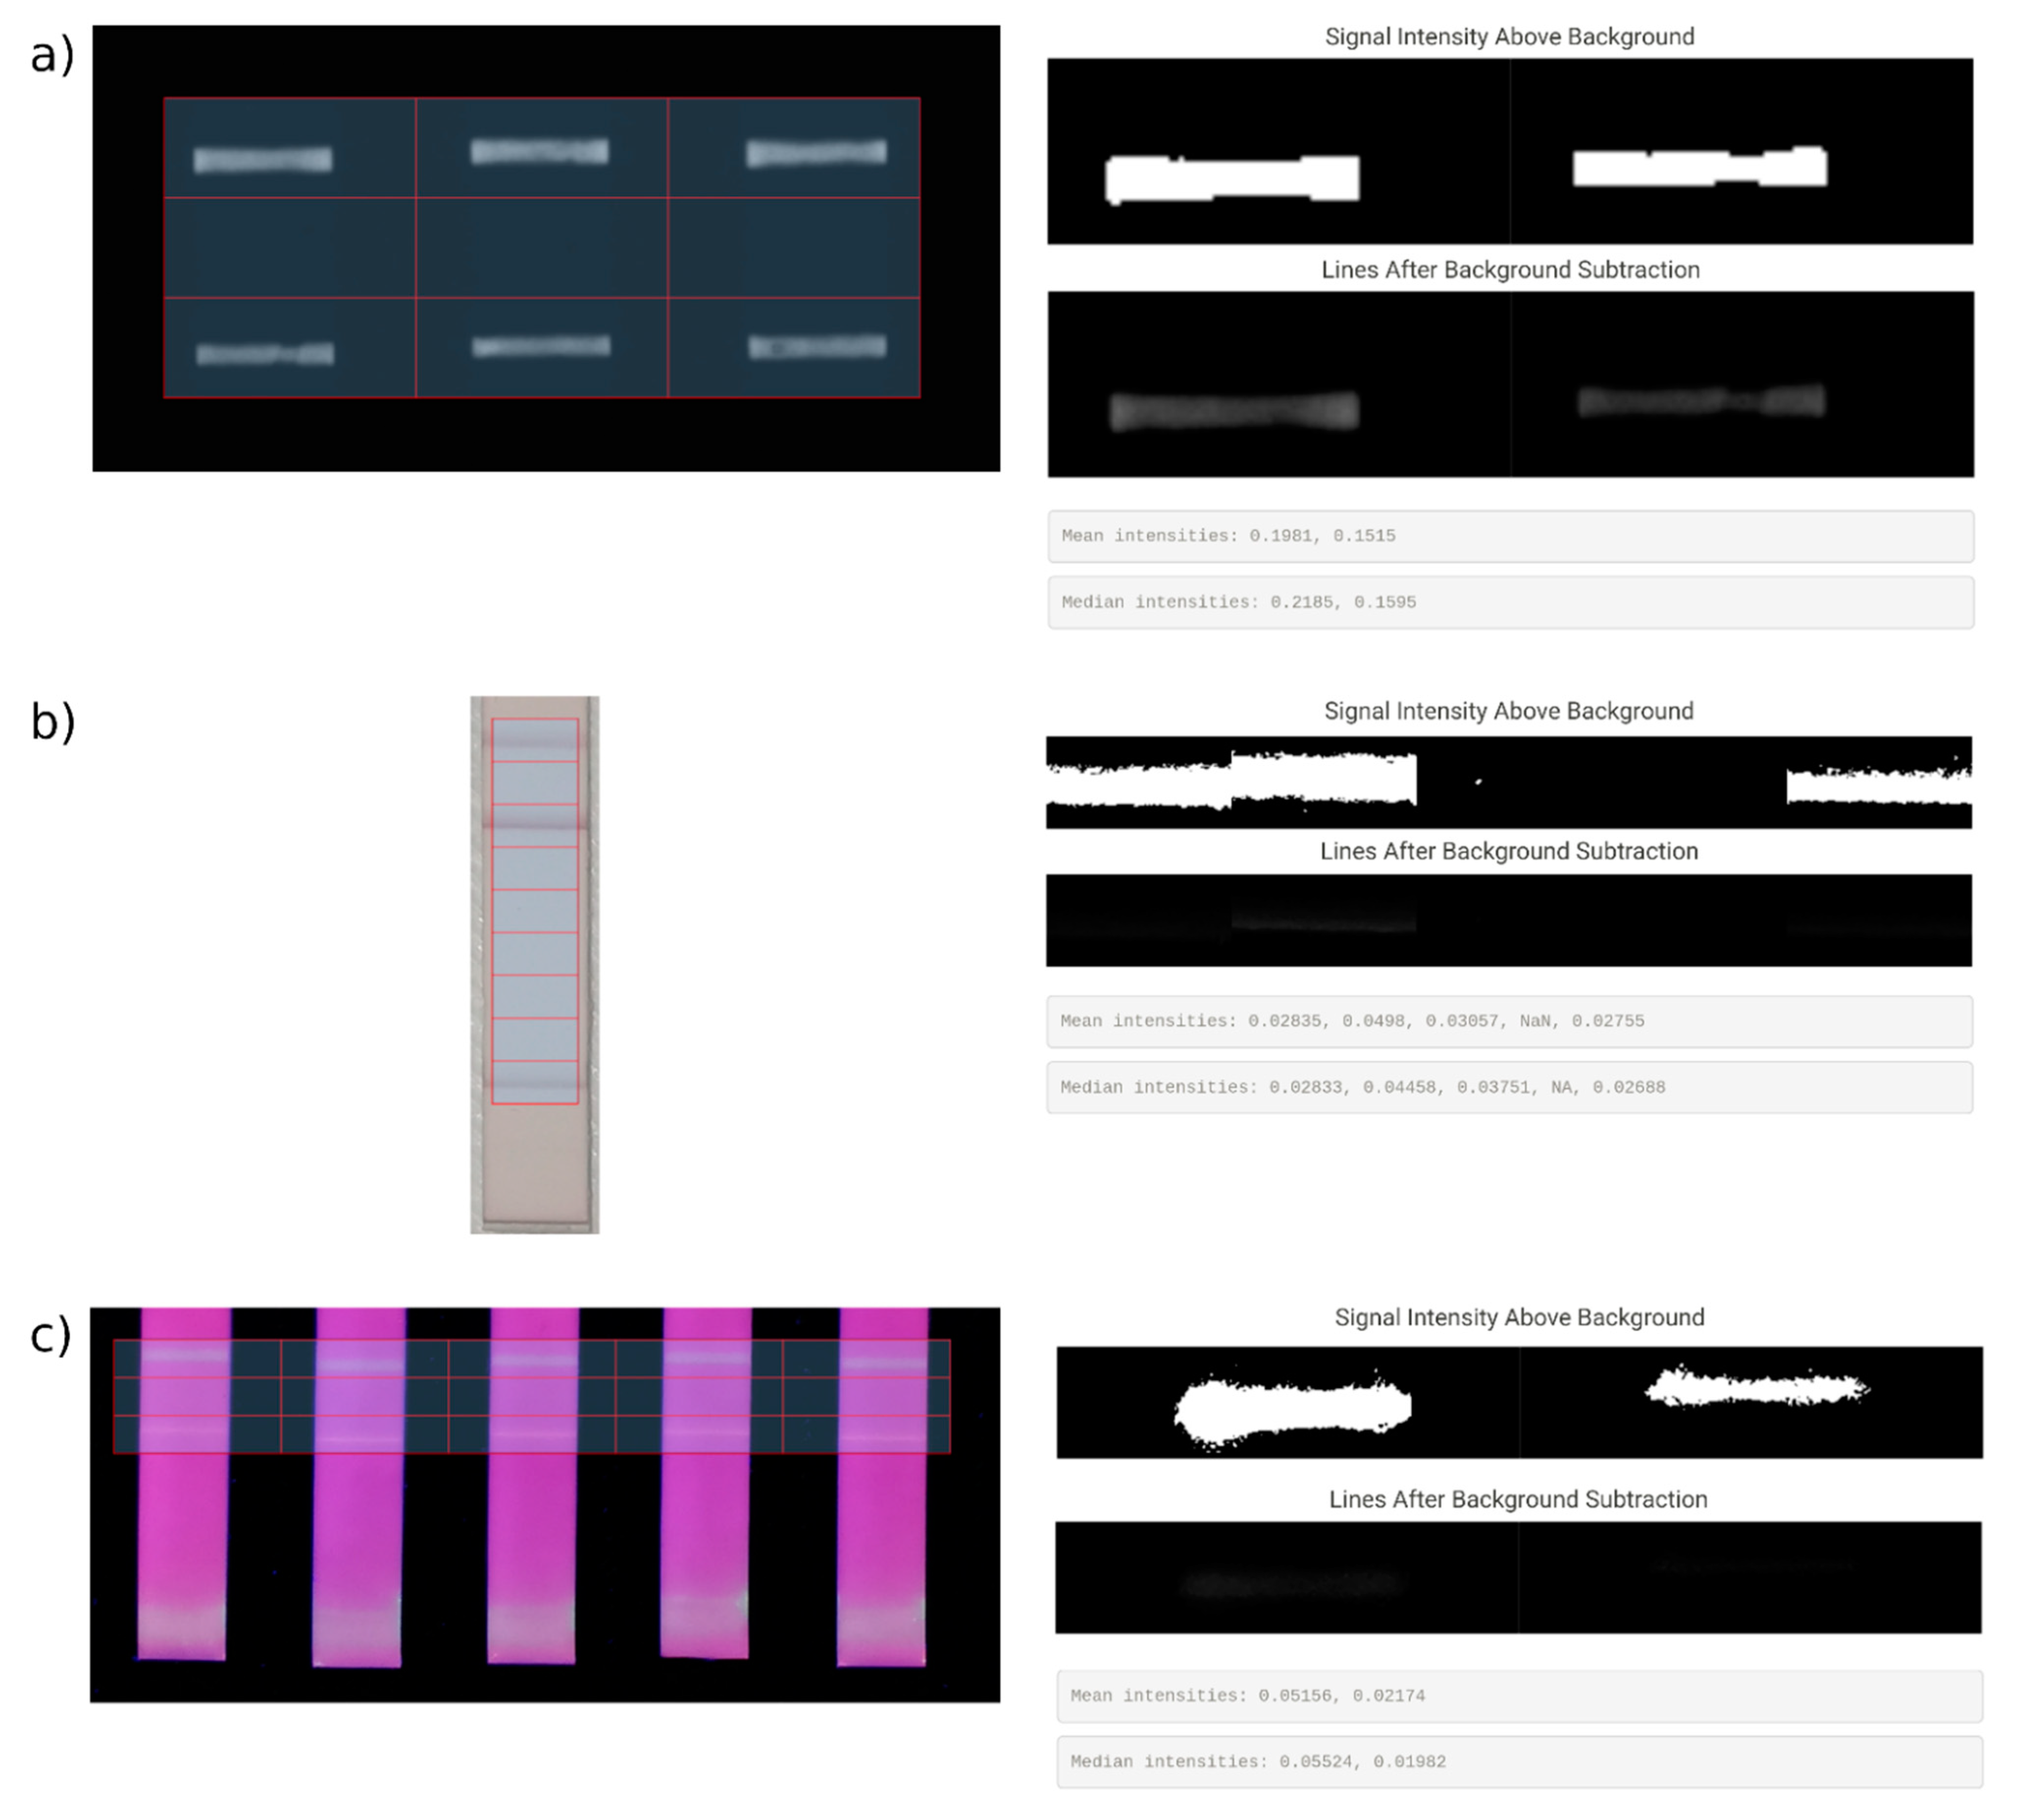
- LFA App core for image acquisition, editing, region of interest definition via gridding, background correction with multiple available methods, as well as intensity data extraction of the pre-defined bands of the analysed LFAs;
- (2)
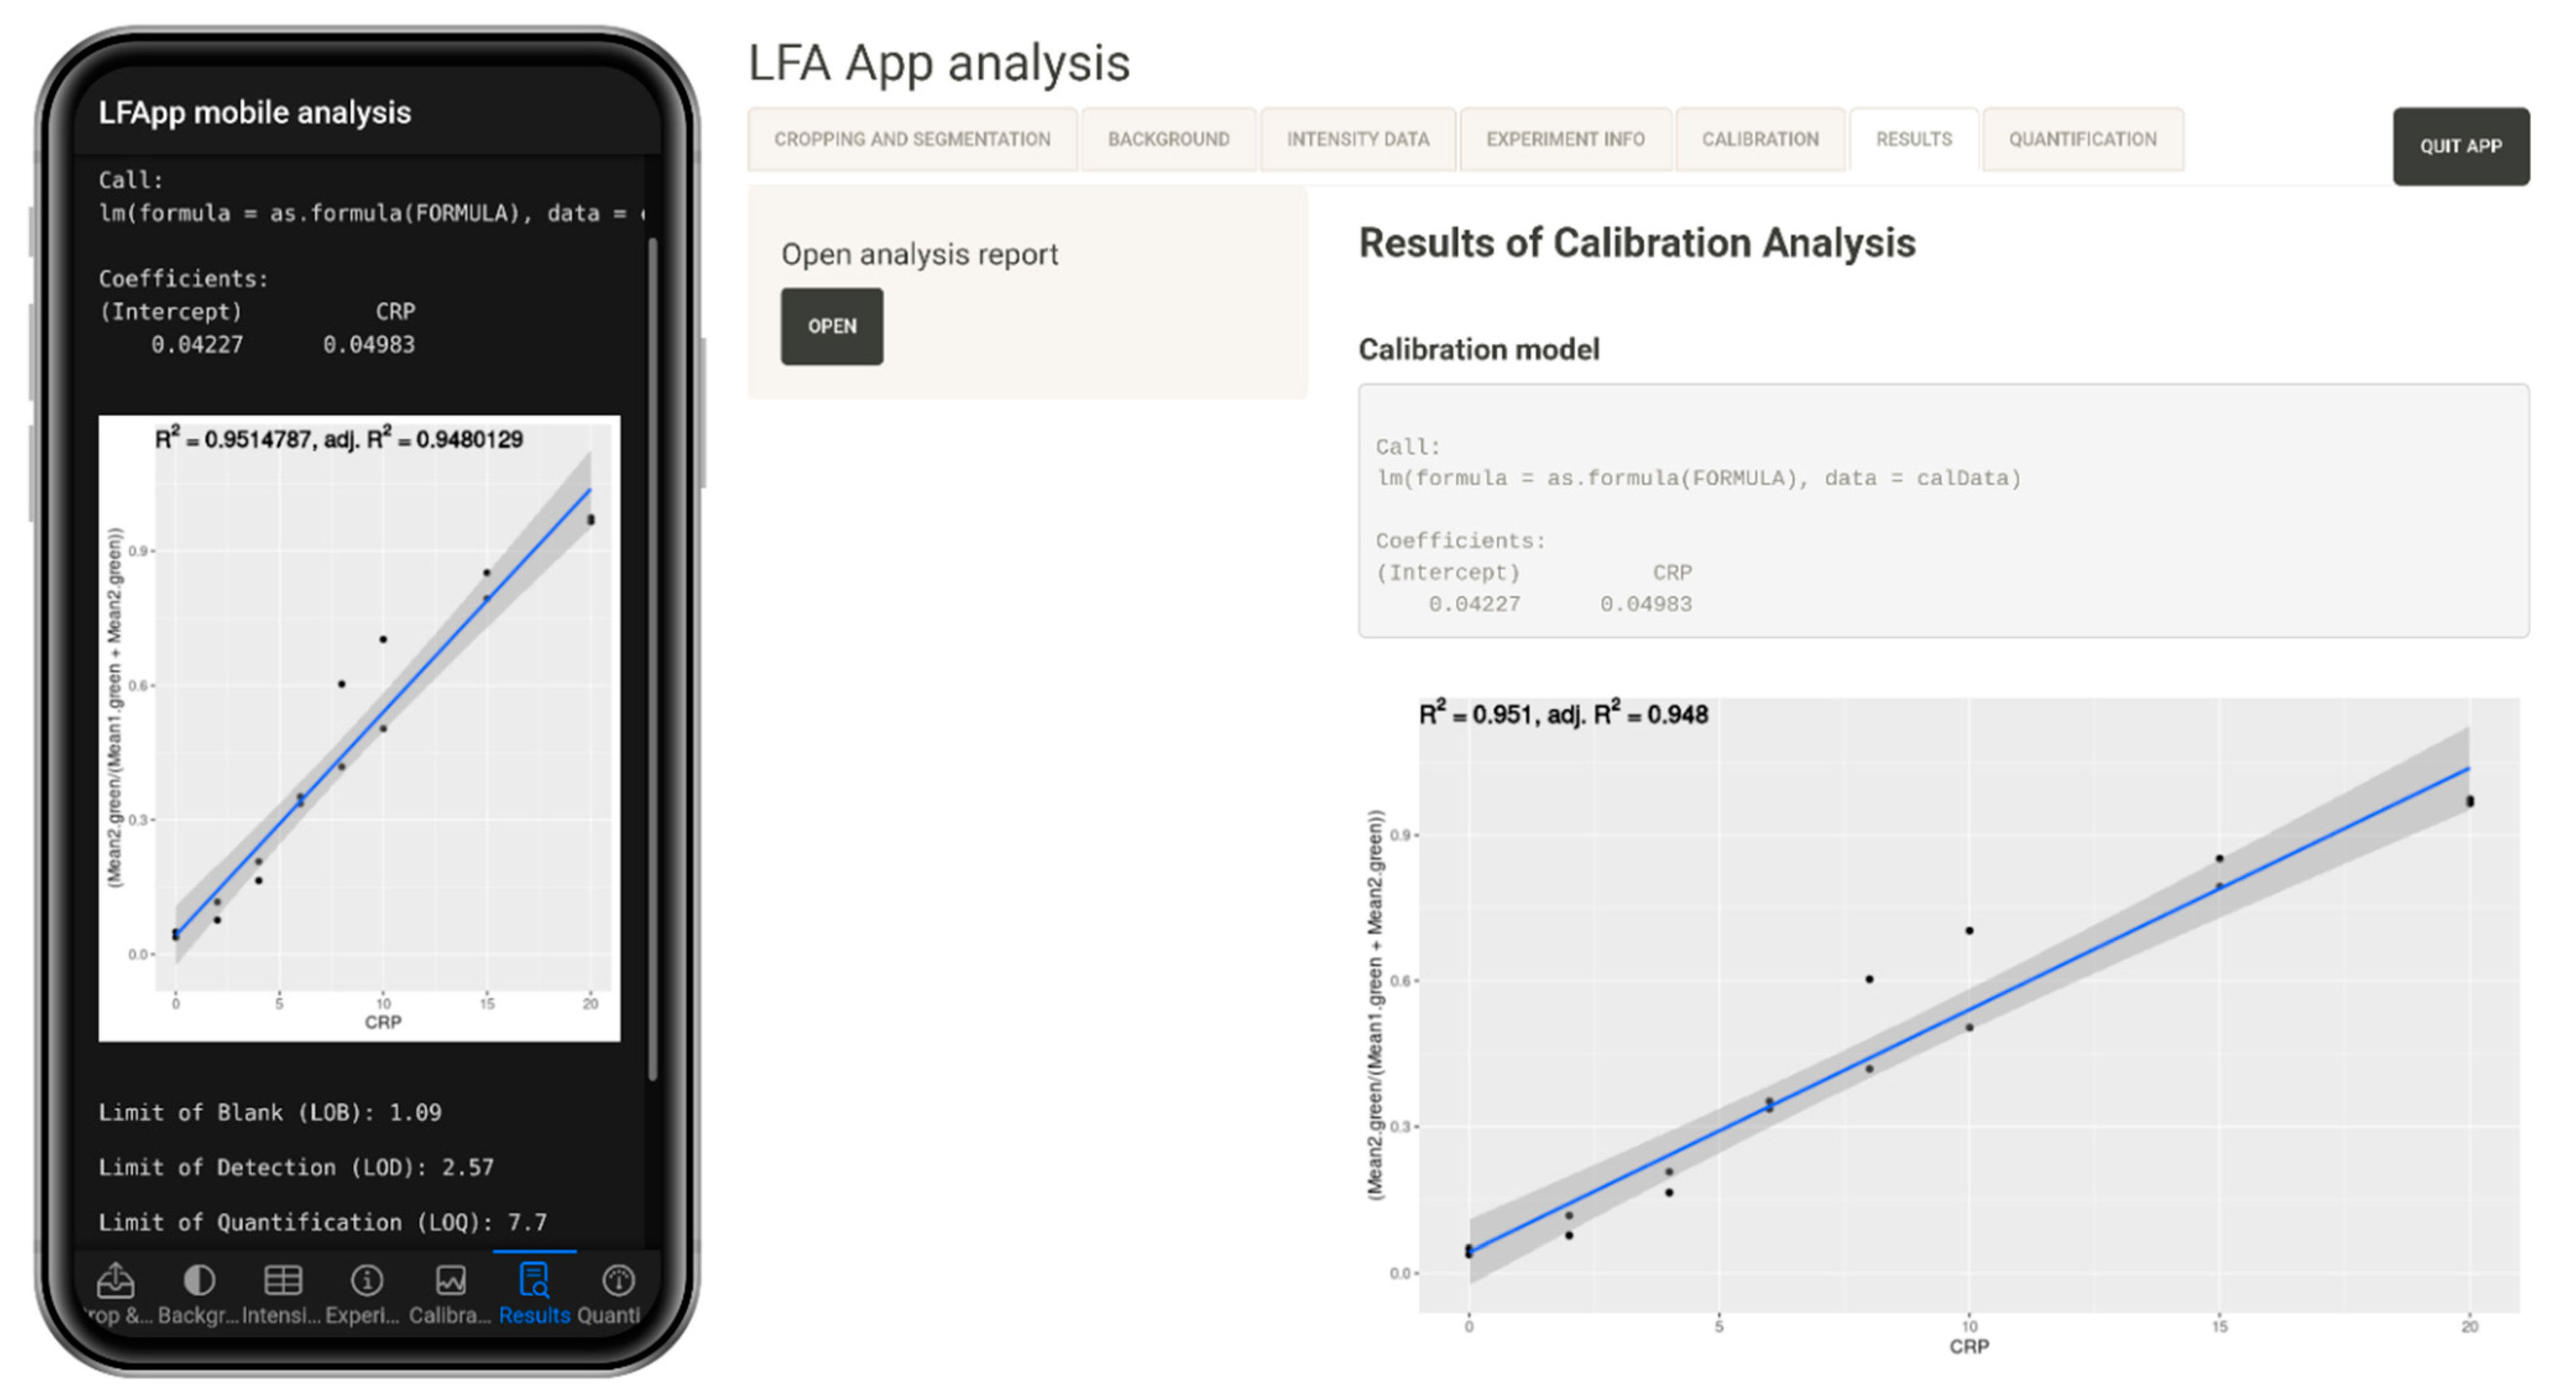
- LFA App calibration, which also includes tools for data processing, adding additional information and calibration functionality;
- (3)
- LFA App quantification, which enables quantification of the extracted intensity values via loading existing calibration models;
- (4)
- LFA App analysis, which includes all the modules mentioned above and enables full analysis in one application.
4. Discussion
Supplementary Materials
Author Contributions
Funding
Institutional Review Board Statement
Informed Consent Statement
Data Availability Statement
Conflicts of Interest
References
- Caliendo, A.M.; Gilbert, D.N.; Ginocchio, C.C.; Hanson, K.E.; May, L.; Quinn, T.C.; Tenover, F.C.; Alland, D.; Blaschke, A.J.; Bonomo, R.A.; et al. Better Tests, Better Care: Improved Diagnostics for Infectious Diseases. Clin. Infect. Dis. 2013, 57, S139–S170. [Google Scholar] [CrossRef] [Green Version]
- Afshari, A.; Schrenzel, J.; Ieven, M.; Harbarth, S. Bench-to-Bedside Review: Rapid Molecular Diagnostics for Bloodstream Infection-a New Frontier. Crit. Care 2012, 16, 222. [Google Scholar] [CrossRef] [Green Version]
- Bissonnette, L.; Bergeron, M.G. Infectious Disease Management through Point-of-Care Personalized Medicine Molecular Diagnostic Technologies. J. Pers. Med. 2012, 2, 50. [Google Scholar] [CrossRef] [PubMed] [Green Version]
- Vandenberg, O.; Martiny, D.; Rochas, O.; van Belkum, A.; Kozlakidis, Z. Considerations for Diagnostic COVID-19 Tests. Nat. Rev. Microbiol. 2021, 19, 1. [Google Scholar] [CrossRef] [PubMed]
- Peeling, R.W.; Mabey, D. Point-of-Care Tests for Diagnosing Infections in the Developing World. Clin. Microbiol. Infect. 2010, 16, 1062–1069. [Google Scholar] [CrossRef] [Green Version]
- Zhu, H.; Isikman, S.O.; Mudanyali, O.; Greenbaum, A.; Ozcan, A. Optical Imaging Techniques for Point-of-Care Diagnostics. Lab Chip 2013, 13, 51. [Google Scholar] [CrossRef] [PubMed]
- Yager, P.; Domingo, G.J.; Gerdes, J. Point-of-Care Diagnostics for Global Health. Annu. Rev. Biomed. Eng. 2008, 10, 107–144. [Google Scholar] [CrossRef]
- Drain, P.K.; Hyle, E.P.; Noubary, F.; Freedberg, K.A.; Wilson, D.; Bishai, W.; Rodriguez, W.; Bassett, I.V. Evaluating Diagnostic Point-of-Care Tests in Resource-Limited Settings. Lancet Infect. Dis. 2014, 14, 239. [Google Scholar] [CrossRef] [Green Version]
- Kaushik, A.; Mujawar, M.A. Point of Care Sensing Devices: Better Care for Everyone. Sensors 2018, 18, 4303. [Google Scholar] [CrossRef] [Green Version]
- Jain, S.; Nehra, M.; Kumar, R.; Dilbaghi, N.; Hu, T.Y.; Kumar, S.; Kaushik, A.; Li, C.-z. Internet of Medical Things (IoMT)-Integrated Biosensors for Point-of-Care Testing of Infectious Diseases. Biosens. Bioelectron. 2021, 179, 113074. [Google Scholar] [CrossRef]
- Posthuma-Trumpie, G.A.; Korf, J.; van Amerongen, A. Lateral Flow (Immuno)Assay: Its Strengths, Weaknesses, Opportunities and Threats. A Literature Survey. Anal. Bioanal. Chem. 2008, 393, 569–582. [Google Scholar] [CrossRef] [PubMed] [Green Version]
- Sajid, M.; Kawde, A.N.; Daud, M. Designs, Formats and Applications of Lateral Flow Assay: A Literature Review. J. Saudi Chem. Soc. 2015, 19, 689–705. [Google Scholar] [CrossRef] [Green Version]
- Kaushik, A.K.; Dhau, J.S.; Gohel, H.; Mishra, Y.K.; Kateb, B.; Kim, N.-Y.; Goswami, D.Y. Electrochemical SARS-CoV-2 Sensing at Point-of-Care and Artificial Intelligence for Intelligent COVID-19 Management. ACS Appl. Biol. Mater. 2020, 3, 7306–7325. [Google Scholar] [CrossRef] [PubMed]
- Ding, X.; Mauk, M.G.; Yin, K.; Kadimisetty, K.; Liu, C. Interfacing Pathogen Detection with Smartphones for Point-of-Care Applications. Anal. Chem. 2019, 91, 655. [Google Scholar] [CrossRef]
- McCracken, K.E.; Yoon, J.-Y. Recent Approaches for Optical Smartphone Sensing in Resource-Limited Settings: A Brief Review. Anal. Methods 2016, 8, 6591–6601. [Google Scholar] [CrossRef] [Green Version]
- Roda, A.; Michelini, E.; Zangheri, M.; di Fusco, M.; Calabria, D.; Simoni, P. Smartphone-Based Biosensors: A Critical Review and Perspectives. TrAC Trends Anal. Chem. 2016, 79, 317–325. [Google Scholar] [CrossRef]
- R Core Team. R: The R Project for Statistical Computing. Available online: https://www.r-project.org/ (accessed on 13 July 2021).
- Chang, W.; Cheng, J.; Allaire, J.J.; Sievert, C.; Schloerke, B.; Xie, Y.; Allen, J.; McPherson, J.; Dipert, A.; Borges, B. Web Application Framework for R [R Package Shiny Version 1.7.1]. 2021. Available online: https://cran.r-project.org/package=shiny (accessed on 21 February 2022).
- Allaire, J.J.; Xie, Y.; McPherson, J.; Lurashi, J.; Ushey, K.; Atkins, A.; Wickham, H.; Cheng, J.; Chang, W.; Iannone, R. Dynamic Documents for R [R Package Rmarkdown Version 2.11]. 2021. Available online: https://cran.r-project.org/package=rmarkdown (accessed on 21 February 2022).
- Gentleman, R.; Temple Lang, D. Statistical Analyses and Reproducible Research. J. Comput. Graph. Stat. 2007, 16, 1–23. [Google Scholar] [CrossRef] [Green Version]
- Ioannidis, J.P.A. How to Make More Published Research True. PLoS Med. 2014, 11, e1001747. [Google Scholar] [CrossRef] [Green Version]
- Alawsi, T.; Al-Bawi, Z. A Review of Smartphone Point-of-Care Adapter Design. Eng. Rep. 2019, 1, e12039. [Google Scholar] [CrossRef]
- Liu, J.; Geng, Z.; Fan, Z.; Liu, J.; Chen, H. Point-of-Care Testing Based on Smartphone: The Current State-of-the-Art (2017–2018). Biosens. Bioelectron. 2019, 132, 17–37. [Google Scholar] [CrossRef]
- Nguyen, V.T.; Song, S.; Park, S.; Joo, C. Recent Advances in High-Sensitivity Detection Methods for Paper-Based Lateral-Flow Assay. Biosens. Bioelectron. 2020, 152, 112015. [Google Scholar] [CrossRef] [PubMed]
- Mahmoud, M.; Ruppert, C.; Rentschler, S.; Laufer, S.; Deigner, H.P. Combining Aptamers and Antibodies: Lateral Flow Quantification for Thrombin and Interleukin-6 with Smartphone Readout. Sens. Actuators B Chem. 2021, 333, 129246. [Google Scholar] [CrossRef]
- Ruppert, C.; Kaiser, L.; Jacob, L.J.; Laufer, S.; Kohl, M.; Deigner, H.-P. Duplex Shiny App Quantification of the Sepsis Biomarkers C-Reactive Protein and Interleukin-6 in a Fast Quantum Dot Labeled Lateral Flow Assay. J. Nanobiotechnol. 2020, 18, 1–11. [Google Scholar] [CrossRef] [PubMed]
- Pau, G.; Fuchs, F.; Sklyar, O.; Boutros, M.; Huber, W. EBImage—an R Package for Image Processing with Applications to Cellular Phenotypes. Bioinformatics 2010, 26, 979. [Google Scholar] [CrossRef] [PubMed]
- Wickham, H.; Chang, W.; Henry, L.; Pedersen, T.L.; Takahashi, K.; Wilke, C.; Woo, K.; Yutani, H.; Dunnington, D. Create Elegant Data Visualisations Using the Grammar of Graphics [R Package Ggplot2 Version 3.3.5]. 2021. Available online: https://cran.r-project.org/package=ggplot2 (accessed on 21 February 2022).
- Xie, Y.; Cheng, J.; Tan, X. A Wrapper of the JavaScript Library “DataTables” [R Package DT Version 0.20]. 2021. Available online: https://cran.r-project.org/package=DT (accessed on 21 February 2022).
- Attali, D. Easily Improve the User Experience of Your Shiny Apps in Seconds [R Package Shinyjs Version 2.1.0]. 2021. Available online: https://cran.r-project.org/package=shinyjs (accessed on 21 February 2022).
- Wood, S.N. Generalized Additive Models: An Introduction with R, 2nd ed.; Chapman and Hall/CRC: New York, NY, USA, 2017; pp. 1–476. [Google Scholar] [CrossRef]
- Pedersen, T.L.; Nijs, V.; Schaffner, T.; Nantz, E. A Server-Side File System Viewer for Shiny [R Package ShinyFiles Version 0.9.1]. 2021. Available online: https://cran.r-project.org/package=shinyFiles (accessed on 21 February 2022).
- Hester, J.; Wickham, H. Cross-Platform File System Operations Based on “libuv” [R Package Fs Version 1.5.2]. 2021. Available online: https://cran.r-project.org/package=fs (accessed on 21 February 2022).
- Chang, W. Themes for Shiny [R Package Shinythemes Version 1.2.0]. 2021. Available online: https://cran.r-project.org/package=shinythemes (accessed on 21 February 2022).
- Granjon, D.; Perrier, V.; Coene, J.; Rudolf, I. Mobile Ready “shiny” Apps with Standalone Capabilities [R Package ShinyMobile Version 0.9.1]. 2021. Available online: https://cran.r-project.org/package=shinyMobile (accessed on 21 February 2022).
- Otsu, N. Threshold Selection Method from Gray-Level Histograms. IEEE Trans. Syst. Man Cybern. 1979, 9, 62–66. [Google Scholar] [CrossRef] [Green Version]
- Liu, D.; Yu, J. Otsu Method and K-Means. In Proceedings of the 2009 9th International Conference on Hybrid Intelligent Systems, HIS, Shenyang, China, 12–14 August 2009; IEEE: Piscataway, NJ, USA, 2009; Volume 1, pp. 344–349. [Google Scholar] [CrossRef]
- Li, C.H.; Lee, C.K. Minimum Cross Entropy Thresholding. Pattern Recognit. 1993, 26, 617–625. [Google Scholar] [CrossRef]
- Li, C.H.; Tam, P.K.S. An Iterative Algorithm for Minimum Cross Entropy Thresholding. Pattern Recognit. Lett. 1998, 19, 771–776. [Google Scholar] [CrossRef]
- Zack, G.W.; Rogers, W.E.; Latt, S.A. Automatic Measurement of Sister Chromatid Exchange Frequency. J. Histochem. Cytochem. 2017, 25, 741–753. [Google Scholar] [CrossRef]
- Armbruster, D.A.; Pry, T. Limit of Blank, Limit of Detection and Limit of Quantitation. Clin. Biochem. Rev. 2008, 29, S49. [Google Scholar]
- Little, T.A. Method Validation Essentials, Limit of Blank, Limit of Detection and Limit of Quantitation. BioPharm Int. 2015, 28, 48–51. [Google Scholar]
- Wagner, G.E.; Föderl-Höbenreich, E.; Assig, K.; Lipp, M.; Berner, A.; Kohler, C.; Lichtenegger, S.; Stiehler, J.; Karoonboonyanan, W.; Thanapattarapairoj, N.; et al. Melioidosis DS Rapid Test: A Standardized Serological Dipstick Assay with Increased Sensitivity and Reliability Due to Multiplex Detection. PLoS Negl. Trop. Dis. 2020, 14, e0008452. [Google Scholar] [CrossRef] [PubMed]
- Ruppert, C.; Phogat, N.; Laufer, S.; Kohl, M.; Deigner, H.-P. A Smartphone Readout System for Gold Nanoparticle-Based Lateral Flow Assays: Application to Monitoring of Digoxigenin. Microchim. Acta 2019, 186, 1–9. [Google Scholar] [CrossRef] [PubMed] [Green Version]
- Burggraaff, O.; Schmidt, N.; Zamorano, J.; Pauly, K.; Pascual, S.; Tapia, C.; Spyrakos, E.; Snik, F. Standardized Spectral and Radiometric Calibration of Consumer Cameras. Opt. Express 2019, 27, 19075–19101. [Google Scholar] [CrossRef] [PubMed] [Green Version]


| Study | Response (y-Axis) | R2 (Study) | R2 (LFApp) |
|---|---|---|---|
| Digoxigenin calibration (Iphone 5S), Ruppert et al., 2019 [44] | cl/tl | 0.96 | 0.97 |
| Digoxigenin serum (Iphone 5S), Ruppert et al., 2019 [44] | cl/tl | 0.93 | 0.97 |
| Digoxigenin calibration (Bioimager),Ruppert et al., 2019 [44] | cl/tl | 0.96 | 0.99 |
| Digoxigenin serum (Bioimager),Ruppert et al., 2019 [44] | cl/tl | 0.97 | 0.99 |
| Thrombin (Huawei P30 Pro), Mahmoud et al., 2020 [25] | tl | 0.99 * | 0.95 |
| IL-6 (Huawei P30 Pro), Mahmoud et al., 2020 [25] | tl/cl | 0.95 | 0.95 |
| CRP (Bioimager), Ruppert et al., 2020 [26] | tl/(tl + cl) | 0.95 | 0.95 |
| IL-6 (Bioimager) Ruppert et al., 2020 [26] | tl/(tl + cl) | 0.97 | 0.97 |
Publisher’s Note: MDPI stays neutral with regard to jurisdictional claims in published maps and institutional affiliations. |
© 2022 by the authors. Licensee MDPI, Basel, Switzerland. This article is an open access article distributed under the terms and conditions of the Creative Commons Attribution (CC BY) license (https://creativecommons.org/licenses/by/4.0/).
Share and Cite
Schary, W.; Paskali, F.; Rentschler, S.; Ruppert, C.; Wagner, G.E.; Steinmetz, I.; Deigner, H.-P.; Kohl, M. Open-Source, Adaptable, All-in-One Smartphone-Based System for Quantitative Analysis of Point-of-Care Diagnostics. Diagnostics 2022, 12, 589. https://doi.org/10.3390/diagnostics12030589
Schary W, Paskali F, Rentschler S, Ruppert C, Wagner GE, Steinmetz I, Deigner H-P, Kohl M. Open-Source, Adaptable, All-in-One Smartphone-Based System for Quantitative Analysis of Point-of-Care Diagnostics. Diagnostics. 2022; 12(3):589. https://doi.org/10.3390/diagnostics12030589
Chicago/Turabian StyleSchary, Weronika, Filip Paskali, Simone Rentschler, Christoph Ruppert, Gabriel E. Wagner, Ivo Steinmetz, Hans-Peter Deigner, and Matthias Kohl. 2022. "Open-Source, Adaptable, All-in-One Smartphone-Based System for Quantitative Analysis of Point-of-Care Diagnostics" Diagnostics 12, no. 3: 589. https://doi.org/10.3390/diagnostics12030589
APA StyleSchary, W., Paskali, F., Rentschler, S., Ruppert, C., Wagner, G. E., Steinmetz, I., Deigner, H.-P., & Kohl, M. (2022). Open-Source, Adaptable, All-in-One Smartphone-Based System for Quantitative Analysis of Point-of-Care Diagnostics. Diagnostics, 12(3), 589. https://doi.org/10.3390/diagnostics12030589