
Magnetic Resonance Imaging as a Prognostic Disability Marker in Clinically Isolated Syndrome and Multiple Sclerosis: A Systematic Review and Meta-Analysis

 ,
,  ,
,
Abstract
1. Introduction
2. Materials and Methods
2.1. Study Registration
2.2. Sources, Search Strategy, and Screening
2.3. Study Selection (Inclusion and Exclusion Criteria)
2.4. Data Extraction
2.5. Outcome Measures
2.6. Quality Assessment
2.7. Statistical Analysis
3. Results
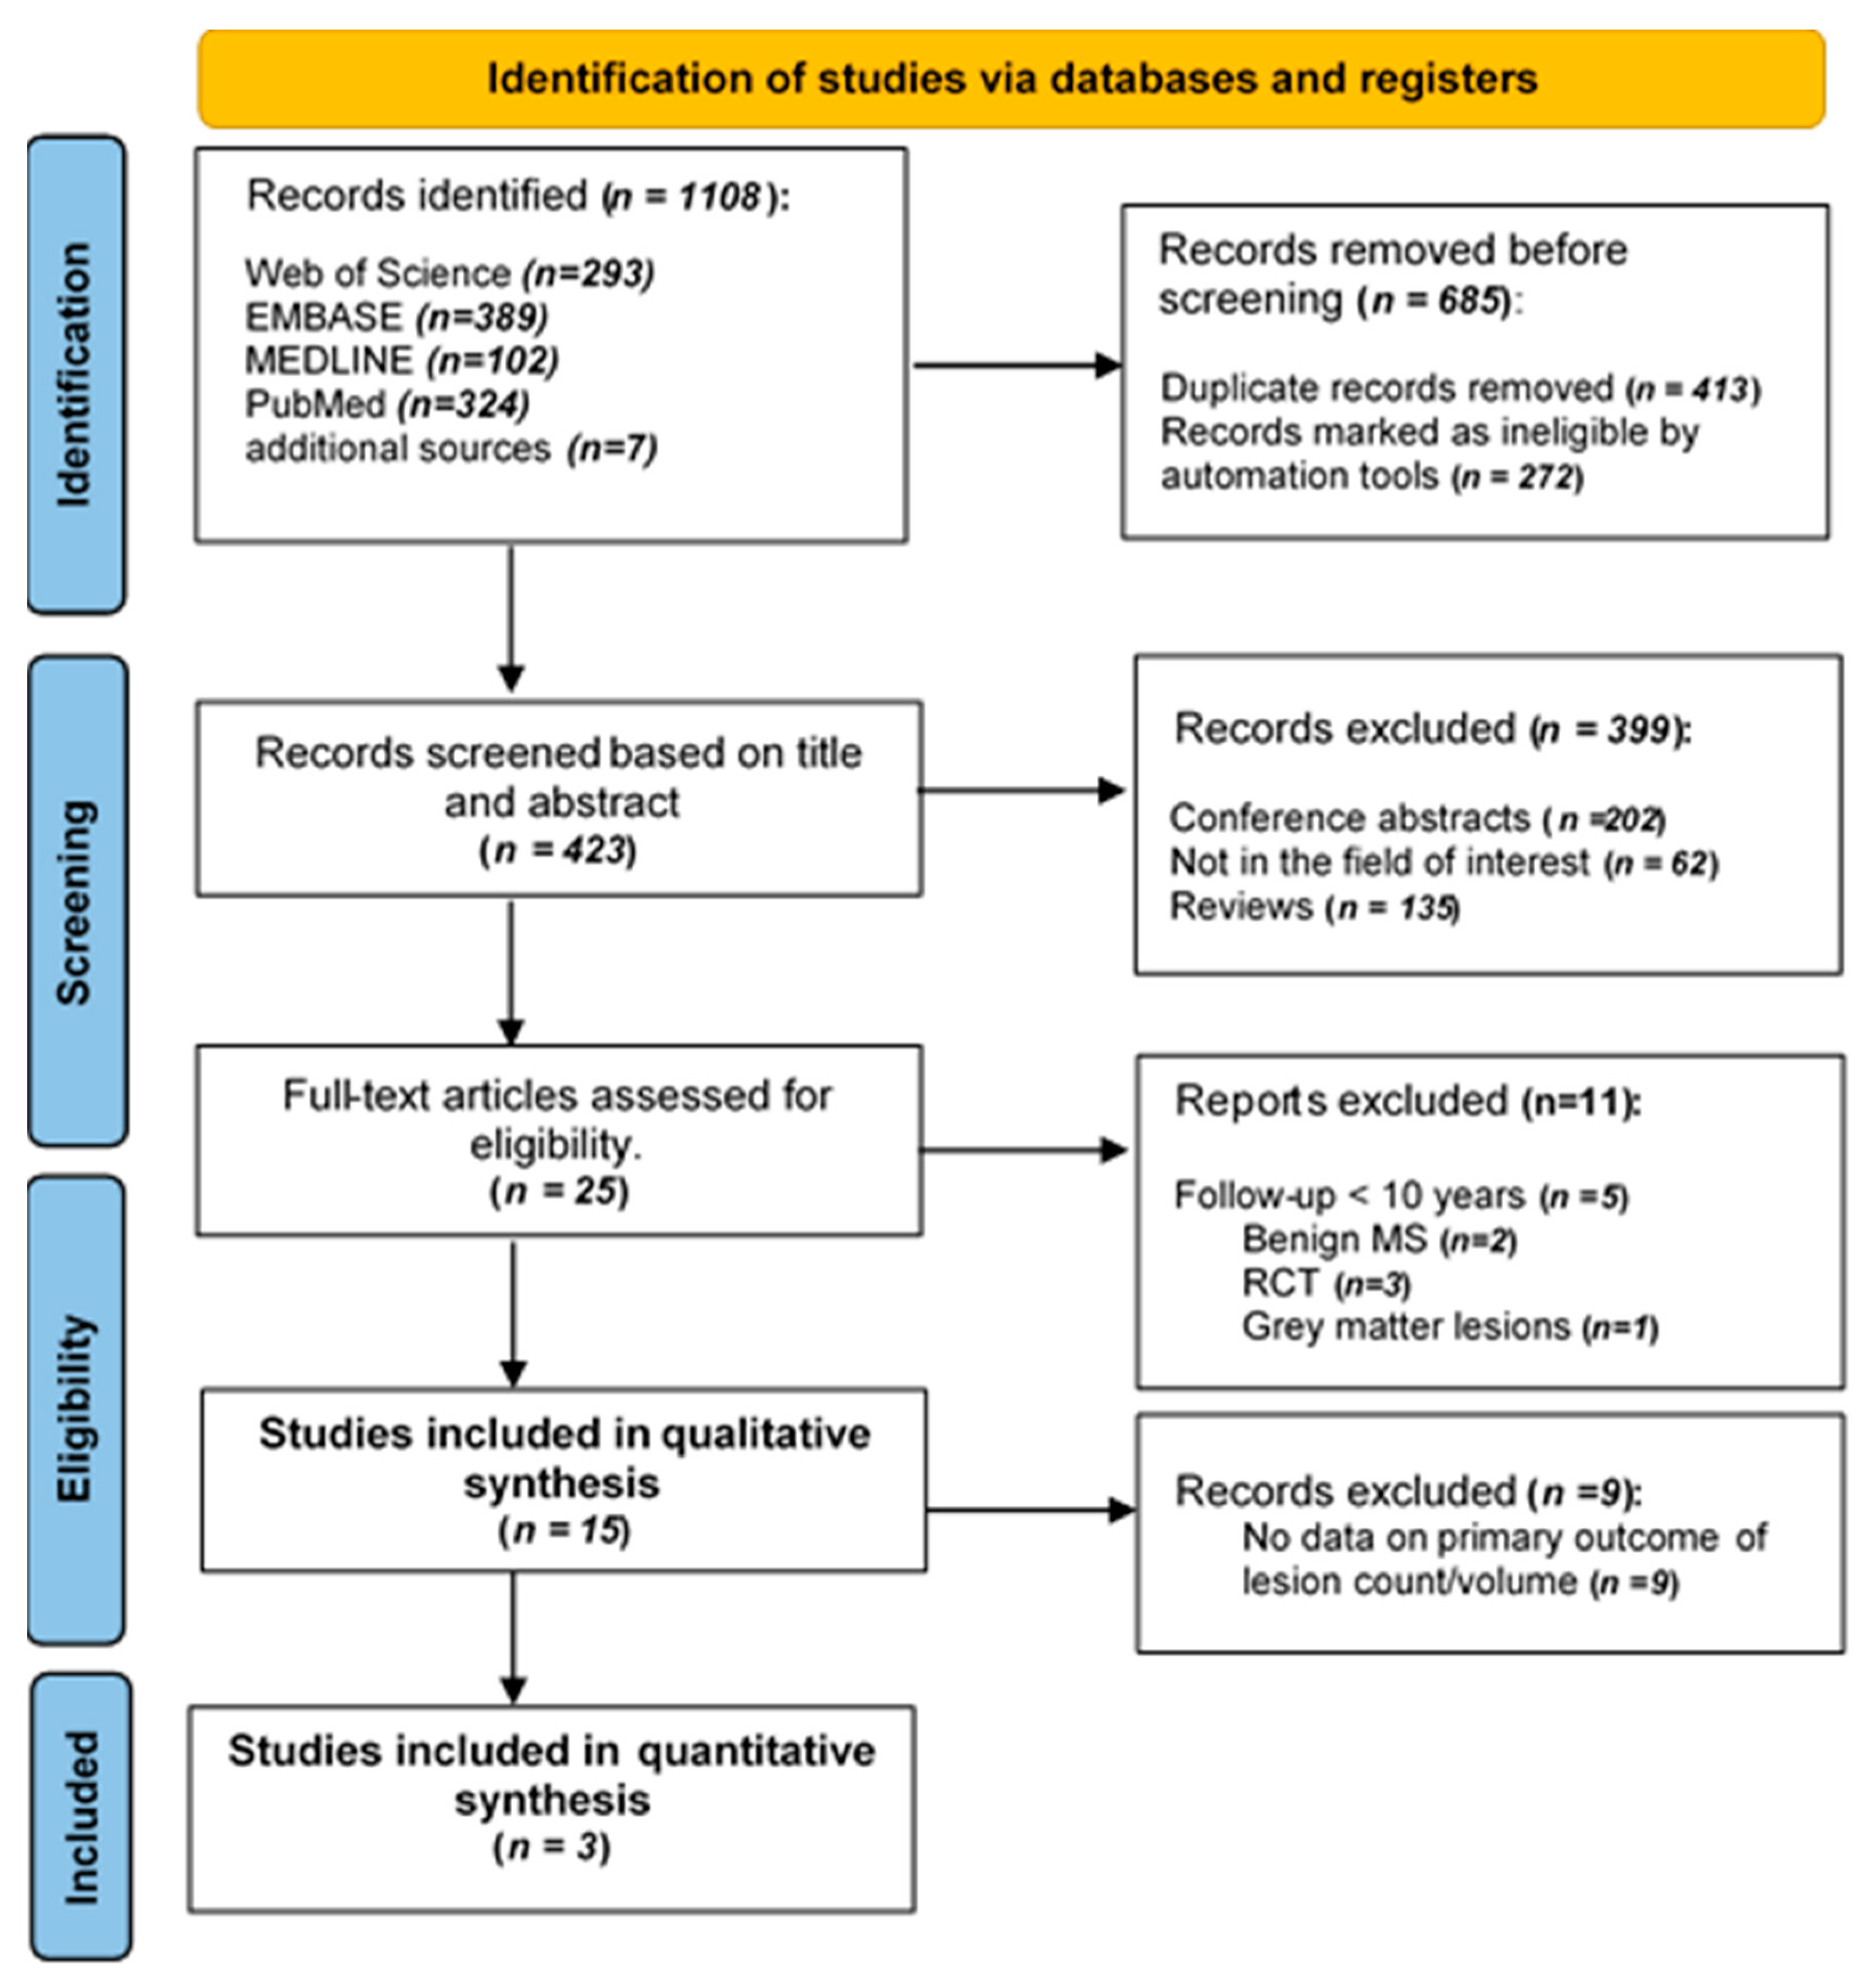
3.1. Literature Search and Study Characteristics
3.2. Cohort Description
3.3. Quality Assessment

 , Partly:
  , Yes:
  .
.| Potential Bias (QUIPS) tool | ||||||
|---|---|---|---|---|---|---|
| Study, y | Study Participation | Study Attrition | Prognostic Factor | Outcome Measurement | Confounding Measurement and Account | Analysis |
| Tintore, 2020 [24] | ||||||
| Chung, 2020 [12] | ||||||
| Brownlee, 2019 [26] | ||||||
| Tintore, 2015 [11] | ||||||
| Jacobsen, 2014 [38] | ||||||
| Kearney, 2014 [27] | ||||||
| Giorgio, 2014 [29] | ||||||
| Popescu, 2013 [30] | ||||||
| Rovaris, 2011 [31] | ||||||
| Renard, 2010 [20] | ||||||
| Fisniku, 2008 [10] | ||||||
| Chard, 2003 [21] | ||||||
| Brex, 2002 [25] | ||||||
| Sailer, 1998 [23] | ||||||
| O’Riordan, 1998 [22] | ||||||
3.4. Study Results
3.4.1. Baseline MRI Lesions
- Ten to fourteen years
- Fifteen to twenty years
3.4.2. MS Progression
3.5. Meta-Analysis Results
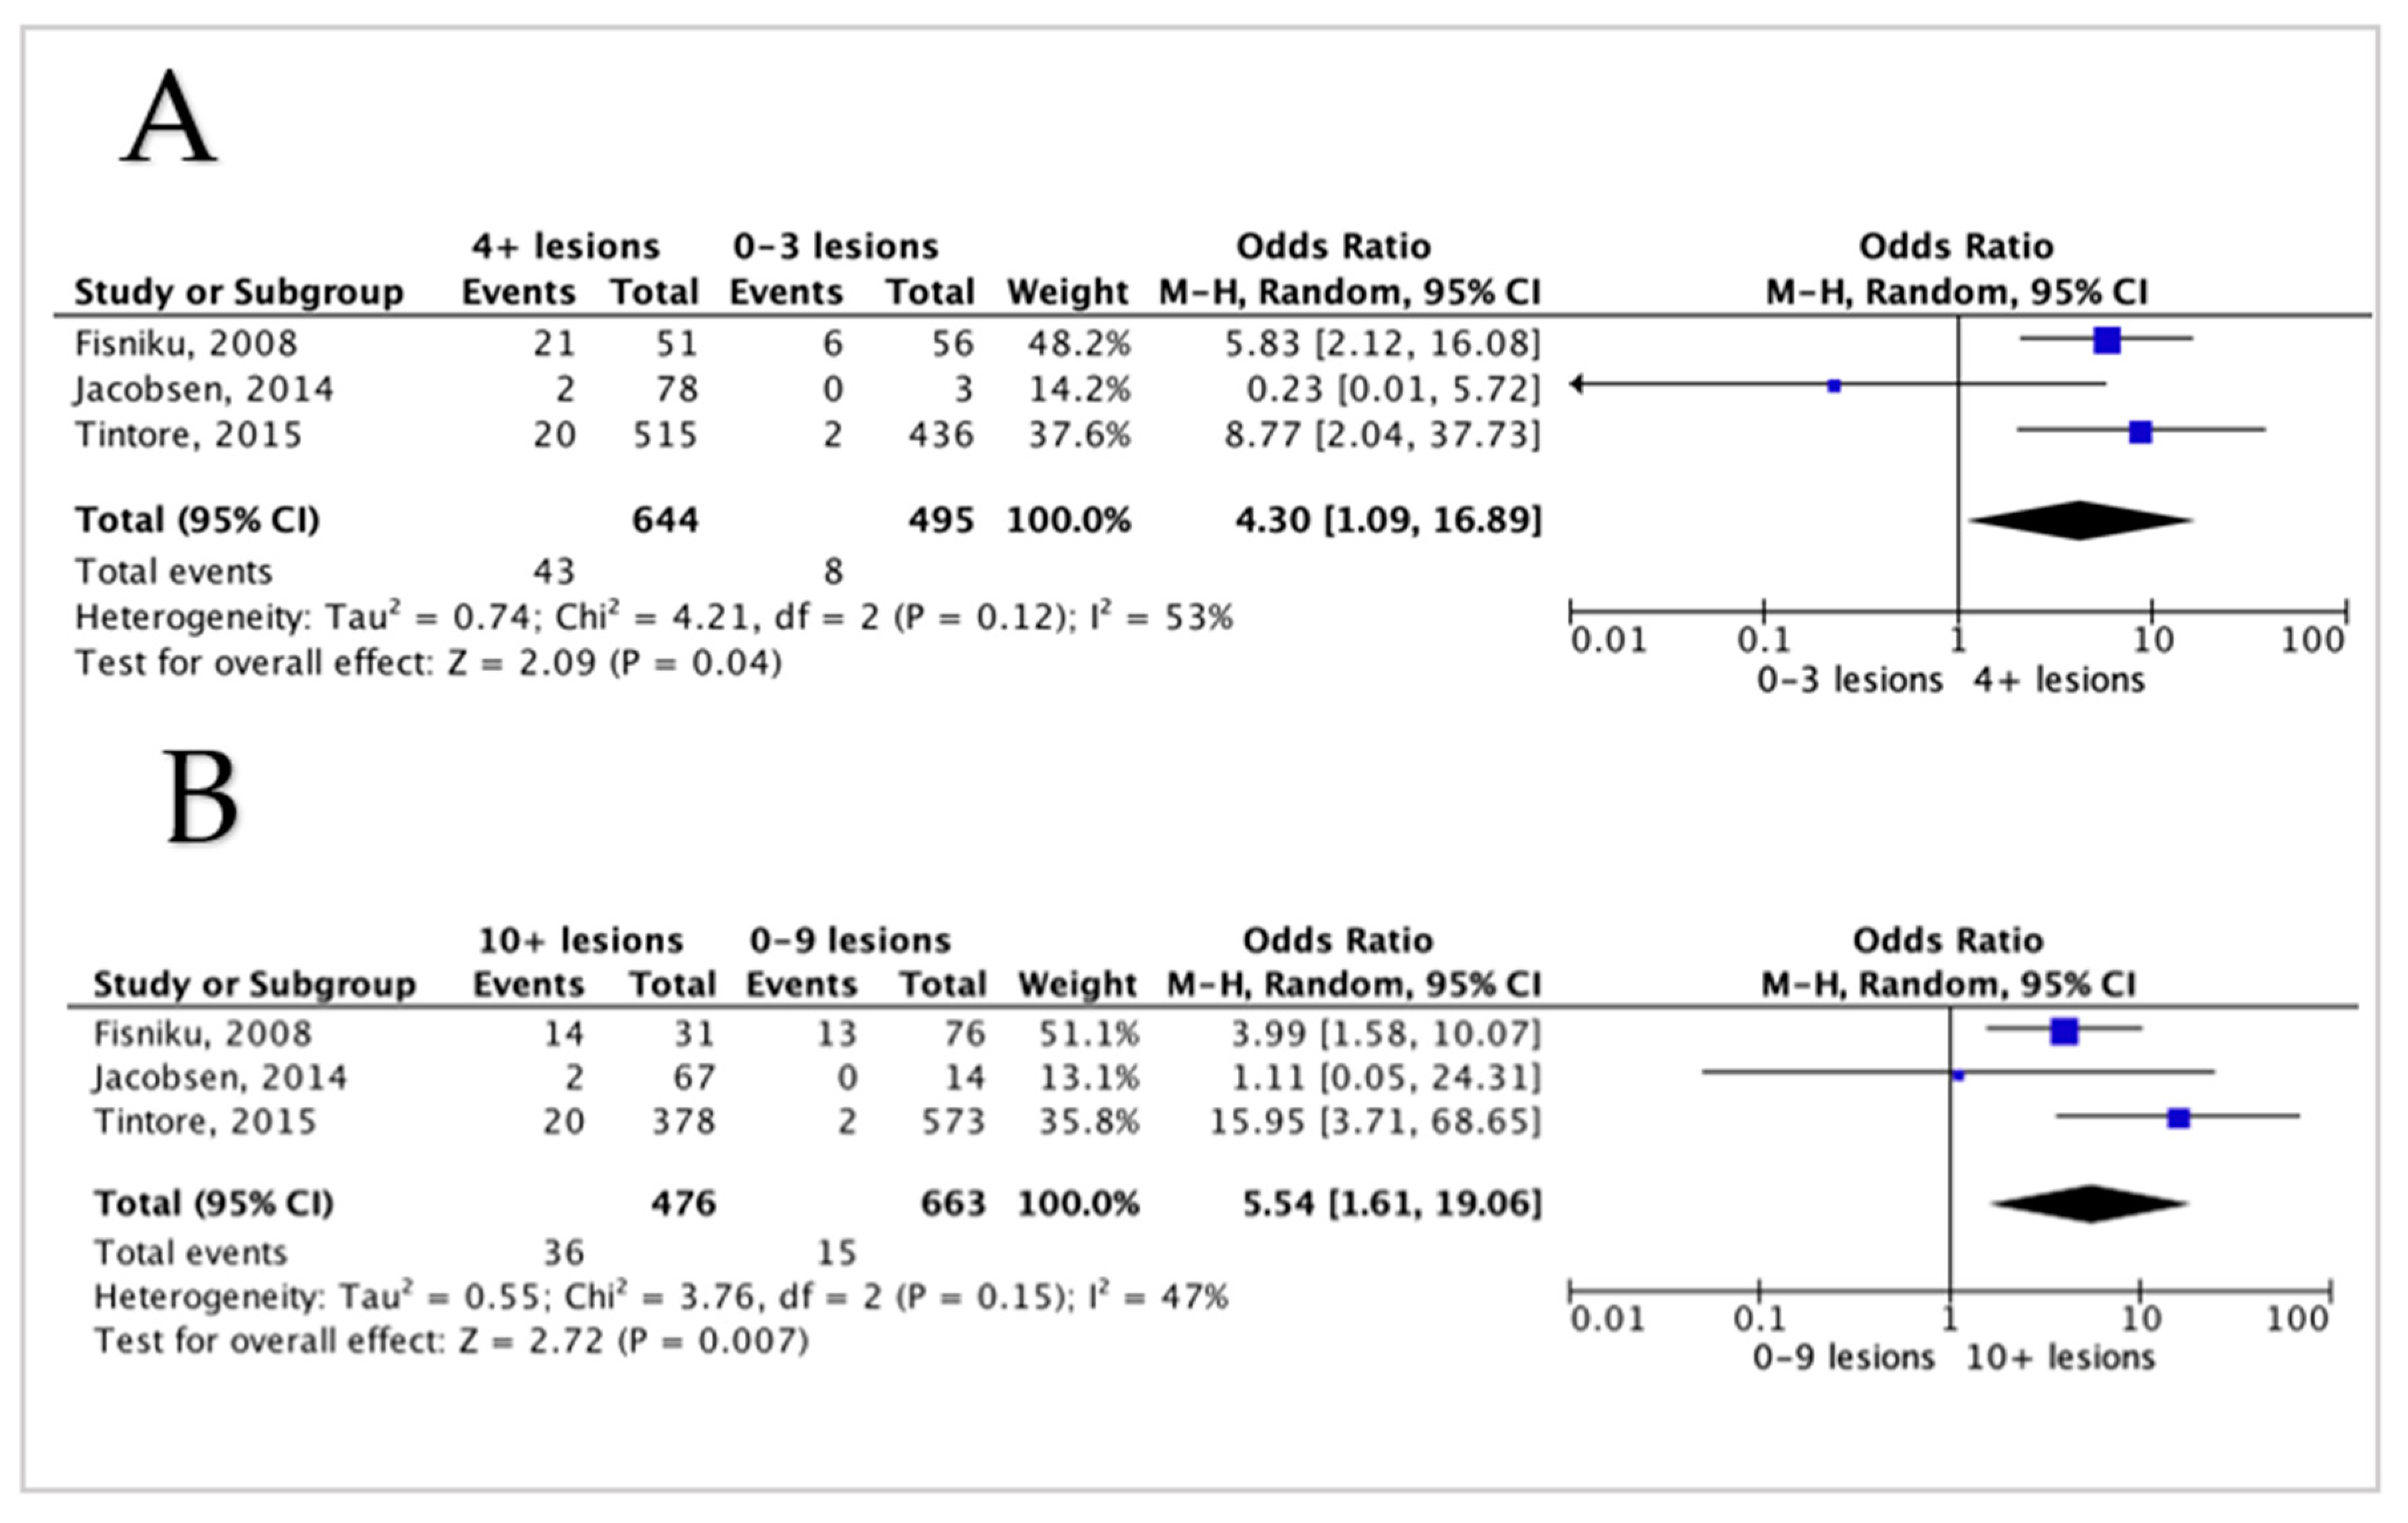
3.5.1. Lesions Count and Disability in MS Patients
3.5.2. Lesion Volume and Disability in MS Patients
4. Discussion
Limitations
5. Conclusions
Supplementary Materials
Author Contributions
Funding
Institutional Review Board Statement
Informed Consent Statement
Data Availability Statement
Acknowledgments
Conflicts of Interest
References
- Polman, C.H.; Reingold, S.C.; Banwell, B.; Clanet, M.; Cohen, J.A.; Filippi, M.; Fujihara, K.; Havrdova, E.; Hutchinson, M.; Kappos, L.; et al. Diagnostic criteria for multiple sclerosis: 2010 revisions to the McDonald criteria. Ann. Neurol. 2011, 69, 292–302. [Google Scholar] [CrossRef] [PubMed]
- MAGNIMS consensus guidelines on the use of MRI in multiple sclerosis—Establishing disease prognosis and monitoring patients. Nat. Rev. Neurol. 2015, 11, 597–606. [CrossRef]
- Heesen, C.; Kasper, J.; Segal, J.; Köpke, S.; Mühlhauser, I. Decisional role preferences, risk knowledge and information interests in patients with multiple sclerosis. Mult. Scler. 2004, 10, 643–650. [Google Scholar] [CrossRef] [PubMed]
- Brand, J.; Köpke, S.; Kasper, J.; Rahn, A.; Backhus, I.; Poettgen, J.; Stellmann, J.-P.; Siemonsen, S.; Heesen, C. Magnetic Resonance Imaging in Multiple Sclerosis—Patients’ Experiences, Information Interests and Responses to an Education Programme. PLoS ONE 2014, 9, e113252. [Google Scholar] [CrossRef]
- Ramsaransing, G.S.M.; De Keyser, J. Benign course in multiple sclerosis: A review. Acta Neurol. Scand. 2006, 113, 359–369. [Google Scholar] [CrossRef]
- Hawkins, S.A.; McDonnell, G.V. Benign multiple sclerosis? Clinical course, long term follow up, and assessment of prognostic factors. J. Neurol. Neurosurg. Psychiatry 1999, 67, 148–152. [Google Scholar] [CrossRef]
- Soelberg Sorensen, P. Safety concerns and risk management of multiple sclerosis therapies. Acta Neurol. Scand. 2017, 136, 168–186. [Google Scholar] [CrossRef]
- Danchaivijitr, N.; Waldman, A.D.; Tozer, D.J.; Benton, C.E.; Caseiras, G.B.; Tofts, P.S.; Rees, J.H.; Jäger, H.R. Low-Grade Gliomas: Do Changes in rCBV Measurements at Longitudinal Perfusion-weighted MR Imaging Predict Malignant Transformation? Radiology 2008, 247, 170–178. [Google Scholar] [CrossRef] [PubMed]
- Miller, D.H.; Chard, D.T.; Ciccarelli, O. Clinically isolated syndromes. Lancet. Neurol. 2012, 11, 157–169. [Google Scholar] [CrossRef]
- Fisniku, L.K.; Brex, P.A.; Altmann, D.R.; Miszkiel, K.A.; Benton, C.E.; Lanyon, R.; Thompson, A.J.; Miller, D.H.; Fisniku, L.K. Disability and T2 MRI lesions: A 20-year follow-up of patients with relapse onset of multiple sclerosis. Brain 2008, 131, 808–817. [Google Scholar] [CrossRef]
- Tintore, M.; Rovira, À.; Río, J.; Otero-Romero, S.; Arrambide, G.; Tur, C.; Comabella, M.; Nos, C.; Arévalo, M.J.; Negrotto, L.; et al. Defining high, medium and low impact prognostic factors for developing multiple sclerosis. Brain 2015, 138, 1863–1874. [Google Scholar] [CrossRef] [PubMed]
- Chung, K.K.; Altmann, D.; Barkhof, F.; Miszkiel, K.; Brex, P.A.; O’Riordan, J.; Ebner, M.; Prados, F.; Cardoso, M.J.; Vercauteren, T.; et al. A 30-Year Clinical and Magnetic Resonance Imaging Observational Study of Multiple Sclerosis and Clinically Isolated Syndromes. Ann. Neurol. 2020, 87, 63–74. [Google Scholar] [CrossRef] [PubMed]
- Odenthal, C.; Coulthard, A. The prognostic utility of MRI in clinically isolated syndrome: A literature review. AJNR. Am. J. Neuroradiol. 2015, 36, 425–431. [Google Scholar] [CrossRef]
- Zhang, W.; Hou, Y. Prognostic value of magnetic resonance imaging in patients with clinically isolated syndrome conversion to multiple sclerosis: A meta-analysis. Neurol. India 2013, 61, 231–238. [Google Scholar] [CrossRef] [PubMed]
- Moher, D.; Liberati, A.; Tetzlaff, J.; Altman, D.G. Preferred reporting items for systematic reviews and meta-analyses: The PRISMA statement. BMJ 2009, 339, 332–336. [Google Scholar] [CrossRef]
- Page, M.J.; Mckenzie, J.E.; Bossuyt, P.M.; Boutron, I.; Hoffmann, T.C.; Mulrow, C.D.; Shamseer, L.; Tetzlaff, J.M.; Akl, E.A.; Brennan, S.E.; et al. The PRISMA 2020 statement: An updated guideline for reporting systematic reviews. BMJ 2021, 372, n71. [Google Scholar] [CrossRef]
- Higgins, J.; Altman, D. Assessing Risk of Bias in Included Studies. Cochrane Handbook for Systematic Reviews of Interventions; John Wiley & Sons, Ltd.: Chichester, UK, 2011. [Google Scholar]
- Hayden, J.A.; Côté, P.; Bombardier, C. Evaluation of the quality of prognosis studies in systematic reviews. Ann. Intern. Med. 2006, 144, 427–437. [Google Scholar] [CrossRef]
- Hayden, J.A.; van der Windt, D.A.; Cartwright, J.L.; Côté, P.; Bombardier, C. Assessing bias in studies of prognostic factors. Ann. Intern. Med. 2013, 158, 280–286. [Google Scholar] [CrossRef]
- Renard, D.; Castelnovo, G.; Bousquet, P.-J.J.; de Champfleur, N.; De Seze, J.J.J.J.; Vermersch, P.; Labauge, P. Brain MRI findings in long-standing and disabling multiple sclerosis in 84 patients. Clin. Neurol. Neurosurg. 2010, 112, 286–290. [Google Scholar] [CrossRef]
- Chard, D.T.; Brex, P.A.; Ciccarelli, O.; Griffin, C.M.; Parker, G.J.M.M.; Dalton, C.; Altmann, D.R.; Thompson, A.J.; Miller, D.H. The longitudinal relation between brain lesion load and atrophy in multiple sclerosis: A 14 year follow up study. J. Neurol. Neurosurg. Psychiatry 2003, 74, 1551–1554. [Google Scholar] [CrossRef]
- O’Riordan, J.I.; Thompson, A.J.; Kingsley, D.P.; MacManus, D.G.; Kendall, B.E.; Rudge, P.; McDonald, W.I.; Miller, D.H. The prognostic value of brain MRI in clinically isolated syndromes of the CNS. A 10-year follow-up. Brain 1998, 121 Pt 3, 495–503. [Google Scholar] [CrossRef]
- Sailer, M.; O’Riordan, J.I.; Thompson, A.J.; Kingsley, D.P.; MacManus, D.G.; McDonald, W.I.; Miller, D.H. Quantitative MRI in patients with clinically isolated syndromes suggestive of demyelination. Neurology 1999, 52, 599–606. [Google Scholar] [CrossRef]
- Tintore, M.; Arrambide, G.; Otero-Romero, S.; Carbonell-Mirabent, P.; Rio, J.; Tur, C.; Comabella, M.; Nos, C.; Arevalo, M.J.; Anglada, E.; et al. The long-term outcomes of CIS patients in the Barcelona inception cohort: Looking back to recognize aggressive MS. Mult. Scler. J. 2020, 26, 1658–1669. [Google Scholar] [CrossRef]
- Brex, P.A.; Ciccarelli, O.; O’Riordan, J.I.; Sailer, M.; Thompson, A.J.; Miller, D.H. A longitudinal study of abnormalities on MRI and disability from multiple sclerosis. N. Engl. J. Med. 2002, 346, 158–164. [Google Scholar] [CrossRef]
- Brownlee, W.J.; Altmann, D.R.; Prados, F.; Miszkiel, K.A.; Eshaghi, A.; Gandini Wheeler-Kingshott, C.A.M.M.; Barkhof, F.; Ciccarelli, O. Early imaging predictors of long-term outcomes in relapse-onset multiple sclerosis. Brain 2019, 142, 2276–2287. [Google Scholar] [CrossRef] [PubMed]
- Kearney, H.; Rocca, M.A.; Valsasina, P.; Balk, L.; Sastre-Garriga, J.; Reinhardt, J.; Ruggieri, S.; Rovira, A.; Stippich, C.; Kappos, L.; et al. Magnetic resonance imaging correlates of physical disability in relapse onset multiple sclerosis of long disease duration. Mult. Scler. 2014, 20, 72–80. [Google Scholar] [CrossRef] [PubMed]
- Jacobsen, C.; Hagemeier, J.; Myhr, K.-M.M.; Nyland, H.; Lode, K.; Bergsland, N.; Ramasamy, D.P.; Dalaker, T.O.; Larsen, J.P.; Farbu, E.; et al. Brain atrophy and disability progression in multiple sclerosis patients: A 10-year follow-up study. J. Neurol. Neurosurg. Psychiatry 2014, 85, 1109–1115. [Google Scholar] [CrossRef]
- Giorgio, A.; Stromillo, M.L.; Bartolozzi, M.L.; Rossi, F.; Battaglini, M.; De Leucio, A.; Guidi, L.; Maritato, P.; Portaccio, E.; Sormani, M.P.; et al. Relevance of hypointense brain MRI lesions for long-term worsening of clinical disability in relapsing multiple sclerosis. Mult. Scler. J. 2014, 20, 214–219. [Google Scholar] [CrossRef] [PubMed]
- Popescu, V.; Agosta, F.; Hulst, H.E.; Sluimer, I.C.; Knol, D.L.; Sormani, M.P.; Enzinger, C.; Ropele, S.; Alonso, J.; Sastre-Garriga, J.; et al. Brain atrophy and lesion load predict long term disability in multiple sclerosis. J. Neurol. Neurosurg. Psychiatry 2013, 84, 1082–1091. [Google Scholar] [CrossRef] [PubMed]
- Rovaris, M.; Rocca, M.A.; Barkhof, F.; Calabrese, M.; De Stefano, N.; Khalil, M.; Fazekas, F.; Fisniku, L.; Gallo, P.; Miller, D.H.; et al. Relationship between brain MRI lesion load and short-term disease evolution in non-disabling MS: A large-scale, multicentre study. Mult. Scler. J. 2011, 17, 319–326. [Google Scholar] [CrossRef] [PubMed]
- Morrissey, S.P.; Miller, D.H.; Kendall, B.E.; Kingsley, D.P.E.; Kelly, M.A.; Francis, D.A.; MacManus, D.G.; Mcdonald, W.I. The significance of brain magnetic resonance imaging abnormalities at presentation with clinically isolated syndromes suggestive of multiple sclerosis. A 5-year follow-up study. Brain 1993, 116, 135–146. [Google Scholar] [CrossRef]
- Filippi, M.; Horsfield, M.A.; Morrissey, S.P.; MacManus, D.G.; Rudge, P.; McDonald, W.I.; Miller, D.H. Quantitative brain MRI lesion load predicts the course of clinically isolated syndromes suggestive of multiple sclerosis. Neurology 1994, 44, 635–641. [Google Scholar] [CrossRef]
- Tintore, M.; Rovira, A.; Arrambide, G.; Mitjana, R.; Río, J.; Auger, C.; Nos, C.; Edo, M.C.; Castilló, J.; Horga, A.; et al. Brainstem lesions in clinically isolated syndromes. Neurology 2010, 75, 1933–1938. [Google Scholar] [CrossRef] [PubMed]
- Tintoré, M.; Rovira, A.; Río, J.; Nos, C.; Grivé, E.; Téllez, N.; Pelayo, R.; Comabella, M.; Sastre-Garriga, J.; Montalban, X. Baseline MRI predicts future attacks and disability in clinically isolated syndromes. Neurology 2006, 67, 968–972. [Google Scholar] [CrossRef] [PubMed]
- Gawne-Cain, M.L.; O’Riordan, J.I.; Coles, A.; Newell, B.; Thompson, A.J.; Miller, D.H. MRI lesion volume measurement in multiple sclerosis and its correlation with disability: A comparison of fast fluid attenuated inversion recovery (fFLAIR) and spin echo sequences. J. Neurol. Neurosurg. Psychiatry 1998, 64, 197–203. [Google Scholar] [CrossRef] [PubMed]
- Brownlee, W.J.; Solanky, B.; Prados, F.; Yiannakas, M.; Da Mota, P.; Riemer, F.; Cardoso, M.J.; Ourselin, S.; Golay, X.; Gandini Wheeler-Kingshott, C.; et al. Cortical grey matter sodium accumulation is associated with disability and secondary progressive disease course in relapse-onset multiple sclerosis. J. Neurol. Neurosurg. Psychiatry 2019, 90, 755–760. [Google Scholar] [CrossRef]
- Jacobsen, C.O.; Farbu, E. MRI evaluation of grey matter atrophy and disease course in multiple sclerosis: An overview of current knowledge. Acta Neurol. Scand. 2014, 129, 32–36. [Google Scholar] [CrossRef] [PubMed]
- Swanton, J.K.; Fernando, K.T.; Dalton, C.M.; Miszkiel, K.A.; Altmann, D.R.; Plant, G.T.; Thompson, A.J.; Miller, D.H. Early MRI in optic neuritis: The risk for clinically definite multiple sclerosis. Mult. Scler. 2009, 16, 156–165. [Google Scholar] [CrossRef]
- Forooshani, P.M.; Biparva, M.; Ntiri, E.E.; Ramirez, J.; Boone, L.; Holmes, M.F.; Adamo, S.; Gao, F.; Ozzoude, M.; Scott, C.J.M.; et al. Deep Bayesian networks for uncertainty estimation and adversarial resistance of white matter hyperintensity segmentation. bioRxiv 2021. [Google Scholar] [CrossRef]
- Rosati, G. The prevalence of multiple sclerosis in the world: An update. Neurol. Sci. 2001, 22, 117–139. [Google Scholar] [CrossRef]
- Compston, A.; Coles, A. Multiple sclerosis. Lancet 2002, 359, 1221–1231. [Google Scholar] [CrossRef]
- Von Gumberz, J.; Mahmoudi, M.; Young, K.; Schippling, S.; Martin, R.; Heesen, C.; Siemonsen, S.; Stellmann, J.-P. Short-term MRI measurements as predictors of EDSS progression in relapsing-remitting multiple sclerosis: Grey matter atrophy but not lesions are predictive in a real-life setting. PeerJ 2016, 4, e2442. [Google Scholar] [CrossRef] [PubMed]
- Vidal-Jordana, A.; Sastre-Garriga, J.; Pareto, D.; Tur, C.; Arrambide, G.; Otero-Romero, S.; Huerga, E.; Mitjana, R.; Auger, C.; Tintoré, M.; et al. Brain atrophy 15 years after CIS: Baseline and follow-up clinico-radiological correlations. Mult. Scler. 2018, 24, 721–727. [Google Scholar] [CrossRef] [PubMed]


| Author, y | Centre and Design |
Clinical Features | Study Length | Sample Size | T2 Lesion Count | Lesion Volume | EDSS |
|---|---|---|---|---|---|---|---|
| Tintore et al. (2020) [24] | Barcelona centre-based prospective cohort 1995–2016 | CIS | 21 y | 401 analysed | 0: 80 (20%) 1–3: 67 (17%) 4–9: 56 (14%) ≥10: 188 (48%) | ⦸ | DMT after CDMS: EDSS = 3 (74 of 156 (47%)) EDSS = 6 (11 of 156 (7%)) DMT before CDMS: EDSS = 3 (11 of 55 (20%)) EDSS = 6 (4 of 55 (7%)) |
| Chung et al. (2020) [12] | UCL, London prospective cohort 1984–1987 | CIS | 30 y | 132 120 analysed | 0–16 (86%) 17–20+ (17%) | ⦸ | ⦸ |
| Brownlee et al. (2019) [37] | UCL, London prospective cohort 1995–2004 | CIS | 15 y | 178 164 analysed | ⦸ | ⦸ | BL: EDSS = 5 (15.25) FU = 0 (range 0–1) in CIS FU = 2 (range 0–10) in MS |
| Tintore et al. (2015) [11] * | Barcelona centre-based prospective cohort 1995–2013 | CIS | 18 y | 1058 1015 analysed | 0: 299 (31%) 1–3: 137 (14%) 4–9: 137 (14%) ≥10: 378 (40%) | ⦸ | EDSS > 3 12 of 299 (4%) with 0 les, 10 of 137 (7%) with 1–3 les, 13 of 137 (10%) with 4–9 les, 83 of 378 (22%) with ≥10 les EDSS ≥ 6 2 of 299 (0.7%) with 0 les, 0 (0%) of 137 with 1–3 les, 0 (0%) of 137 with 4–9 les, 20 of 378 (5.3%) with ≥10 les |
| Jacobsen et al. (2014) [28] * | 2 centres in Norway, prospective cohort 1998–2000 | MS | 10 y | 81 analysed | BL: (16.0 ± 12.3) | ⦸ | EDSS > 3 (50/81) 0 of 50 (0%) with 0 les, 0 of 50 (0%) with 1–3 les, 6 of 50 (12%) with 4–9 les, 44 of 50 (88%), with ≥10 les EDSS ≥ 6 (3/81) 0 of 0 (0%) with 0 les, 0 of 0 (0%) with 1–3 les, 1 of 3 (33.33 %) with 4–9 les, 2 of 3 (6.06 %) with ≥10 les |
| Kearney et al. (2014) [27] | MAGNIMS (7 centres), retrospective | MS subtypes (CIS, RRMS, SPMS) | 26 y | 159 analysed | ⦸ | ⦸ | EDSS BL:4 (range 0–8) |
| Giorgio et al. (2014) [29] | Siena, Italy prospective cohort 2000–2001 | RRMS | 10 y | 73 57 analysed | BL: (22.4 ± 18.5) 17 (2–80) New/enlarge: (+1.5 ± 1), 1.3 (0.01 to 4.3) | BL: (5.8 ± 6.4) cm3 FU: (8.3 ± 8.1) cm3 Annualised 10 y rate of T2 lesion growth (LV change/y) of: (0.25 ± 0.5) cm3 | EDSS BL: (1.8 ± 1.1) 10 y FU: (2.5 ± 1.7) |
| Popescu et al. (2013) [30] | MAGNIMS (8 centres), retrospective (before January 2000). | MS subtypes (CIS, RRMS, SPMS, PPMS) | 10 y | 261 analysed | ⦸ | BL: 5.91 (2.07–13.82) 1 y FU: 9 (4.2–19) Difference/y 2 (0.5–3.9) | EDSS for the whole group (median (IQR)) BL: (4 (2–6)), 10 y FU: (6 (4–7.5)) EDSS for CIS BL: (0 (0–1)), 10 y FU: (1.5 (1–3)) EDSS for RRMS BL: (2 (1–3)) 10 y, 10 y FU: (3.5 (2–5.5)) EDSS for SPMS BL: (5.5 (4–6)), 10 y FU: (7 (6–7.5)) EDSS for PPMS BL: (5.5 (3.5–6.5)), 10 y FU: (7(6–8)) |
| Rovaris et al. (2011) [31] | MAGNIMS (7centers), retrospective | MS | 15 y | 369 analysed | ⦸ | 12.4 (0.4–61.1) | EDSS BL: 2 (0–3) |
| Renard et al. (2010) [20] | 3 centres in France, retrospective | RRMS, PPMS | 10 y | 84 analysed | 1–8: 8% 9–20: 12% ≥20: 80% | ⦸ | EDSS > 6 Of our 84 included patients: 3 had (1–3) les, 4 (4–9) les and 77 had (310) les |
| Fisniku et al. (2008) [10] * | London centre-based prospective cohort 1984–1987 | CIS | 20 y | 140 107 analysed | ⦸ | 0.43 cm3 (median) | EDSS > 3 9 of 34 (26%) with 0 les, 8 of 22 (36%) with 1–3 les, 10 of 20 (50%) with 4–9 les, 20 of 31(65%), with ≥10 les EDSS ≥ 6 2 of 34 (6%) with 0 les, 4 (18%) of 22 with 1–3 les, 7 (35%) of 20, with 4–9 les, 14 (45%) of 31 with ≥10 les |
| Chard et al., (2003) [21] | London centre-based (1984–1987) | CIS | 14 y | 28 analysed | ⦸ | BL: 1 (0.1–3.7) 5 y FU: 2.8 (0–36.6) 10 y FU: 5.8 (0.6–46.1) 14 y FU: 9.4 (1–46.8) | EDSS BL: 2.5 (0–9.5) |
| Brex et al. (2002) [25] | London centre-based prospective cohort 1984–1987 | CIS | 14 y | 81 71 analysed | ⦸ | 0.43 cm3 (median) | EDSS > 3 0 of 21 (0%) with 0 les, 5 of 18 (28%) with 1–3 les, 7 of 15 (47%), with 4–10 les, 12 of 17 (71%) with >10 lesion. EDSS ≥ 6 0 of 21 (0%) with 0 les, 2 of 18 (11%) with 1–3 les, 4 of 15 (27%) with 4–10 les, 9 of 17 (53%) with >10 lesions T2-LV EDSS >3 0 of 21 (0%) with 0 cm3, 5 of 18 (28%) with 0.6 cm3, 7 of 15 (47%) with 0.9 cm3, 12 of 17 (71%) with 5.6 cm3 EDSS ≥ 6 0 of 21 (0%) with 0 cm3, 2 of 18 (11%) with 0.6 cm3, 4 of 15 (27%) with 0.9 cm3, 9 of 17 (53%) with 5.6 cm3 |
| Sailer et al. (1998) [23] | UCL, London centre-based prospective cohort 1984–1987 | CIS | 10 y | 71 58 analysed | BL: 2.0 (0–74.0) 5 y FU: 7.5 (0–103) 10 y FU: 10.5 (0–105) | BL: 0.43 (0–13.7) 5 y FU:1.84 (0–36.5) 10 y FU: 3.39 (0–88.6) | EDSS > 3 (0–5 y = 1.5 (0–8.5)) EDSS >3 (5–10 y = 0.5 (−1.0–5.0)) (0–10 y = 2 (01–10)) |
| O’Riordan et al. (1998) [22] | UCL, London centre-based prospective cohort 1984–1987 | CIS | 10 y | 129 81 analysed | ⦸ | ⦸ | 10 y FU EDSS >3 0 of 27 (0%) with 0 les, 0 of 3 (0%) with 1 les, 5 of 16 (31%) with 2–3 les, 4 of 15 (27%) with 4–10 les, 14 of 20 (75%) with >10 les EDSS > 5.5 1 of 27 (4%) with 0 les, 0 of 3 (0%) with 1 les, 2 of 16 (13%) with 2–3 les, 3 of 15 (20%) with 4–10 les, 7 of 20 (35%) with >10 les |
Publisher’s Note: MDPI stays neutral with regard to jurisdictional claims in published maps and institutional affiliations. |
© 2022 by the authors. Licensee MDPI, Basel, Switzerland. This article is an open access article distributed under the terms and conditions of the Creative Commons Attribution (CC BY) license (https://creativecommons.org/licenses/by/4.0/).
Share and Cite
AlTokhis, A.I.; AlAmrani, A.; Alotaibi, A.; Podlasek, A.; Constantinescu, C.S. Magnetic Resonance Imaging as a Prognostic Disability Marker in Clinically Isolated Syndrome and Multiple Sclerosis: A Systematic Review and Meta-Analysis. Diagnostics 2022, 12, 270. https://doi.org/10.3390/diagnostics12020270
AlTokhis AI, AlAmrani A, Alotaibi A, Podlasek A, Constantinescu CS. Magnetic Resonance Imaging as a Prognostic Disability Marker in Clinically Isolated Syndrome and Multiple Sclerosis: A Systematic Review and Meta-Analysis. Diagnostics. 2022; 12(2):270. https://doi.org/10.3390/diagnostics12020270
Chicago/Turabian StyleAlTokhis, Amjad I., Abrar AlAmrani, Abdulmajeed Alotaibi, Anna Podlasek, and Cris S. Constantinescu. 2022. "Magnetic Resonance Imaging as a Prognostic Disability Marker in Clinically Isolated Syndrome and Multiple Sclerosis: A Systematic Review and Meta-Analysis" Diagnostics 12, no. 2: 270. https://doi.org/10.3390/diagnostics12020270
APA StyleAlTokhis, A. I., AlAmrani, A., Alotaibi, A., Podlasek, A., & Constantinescu, C. S. (2022). Magnetic Resonance Imaging as a Prognostic Disability Marker in Clinically Isolated Syndrome and Multiple Sclerosis: A Systematic Review and Meta-Analysis. Diagnostics, 12(2), 270. https://doi.org/10.3390/diagnostics12020270