
Diagnosis of Acute Myocarditis Using Texture-Based Cardiac Magnetic Resonance, with CINE Imaging as a Novel Tissue Characterization Technique

 , , and
Abstract
:1. Introduction
2. Materials and Methods
2.1. Study Population
2.2. Cardiac MR
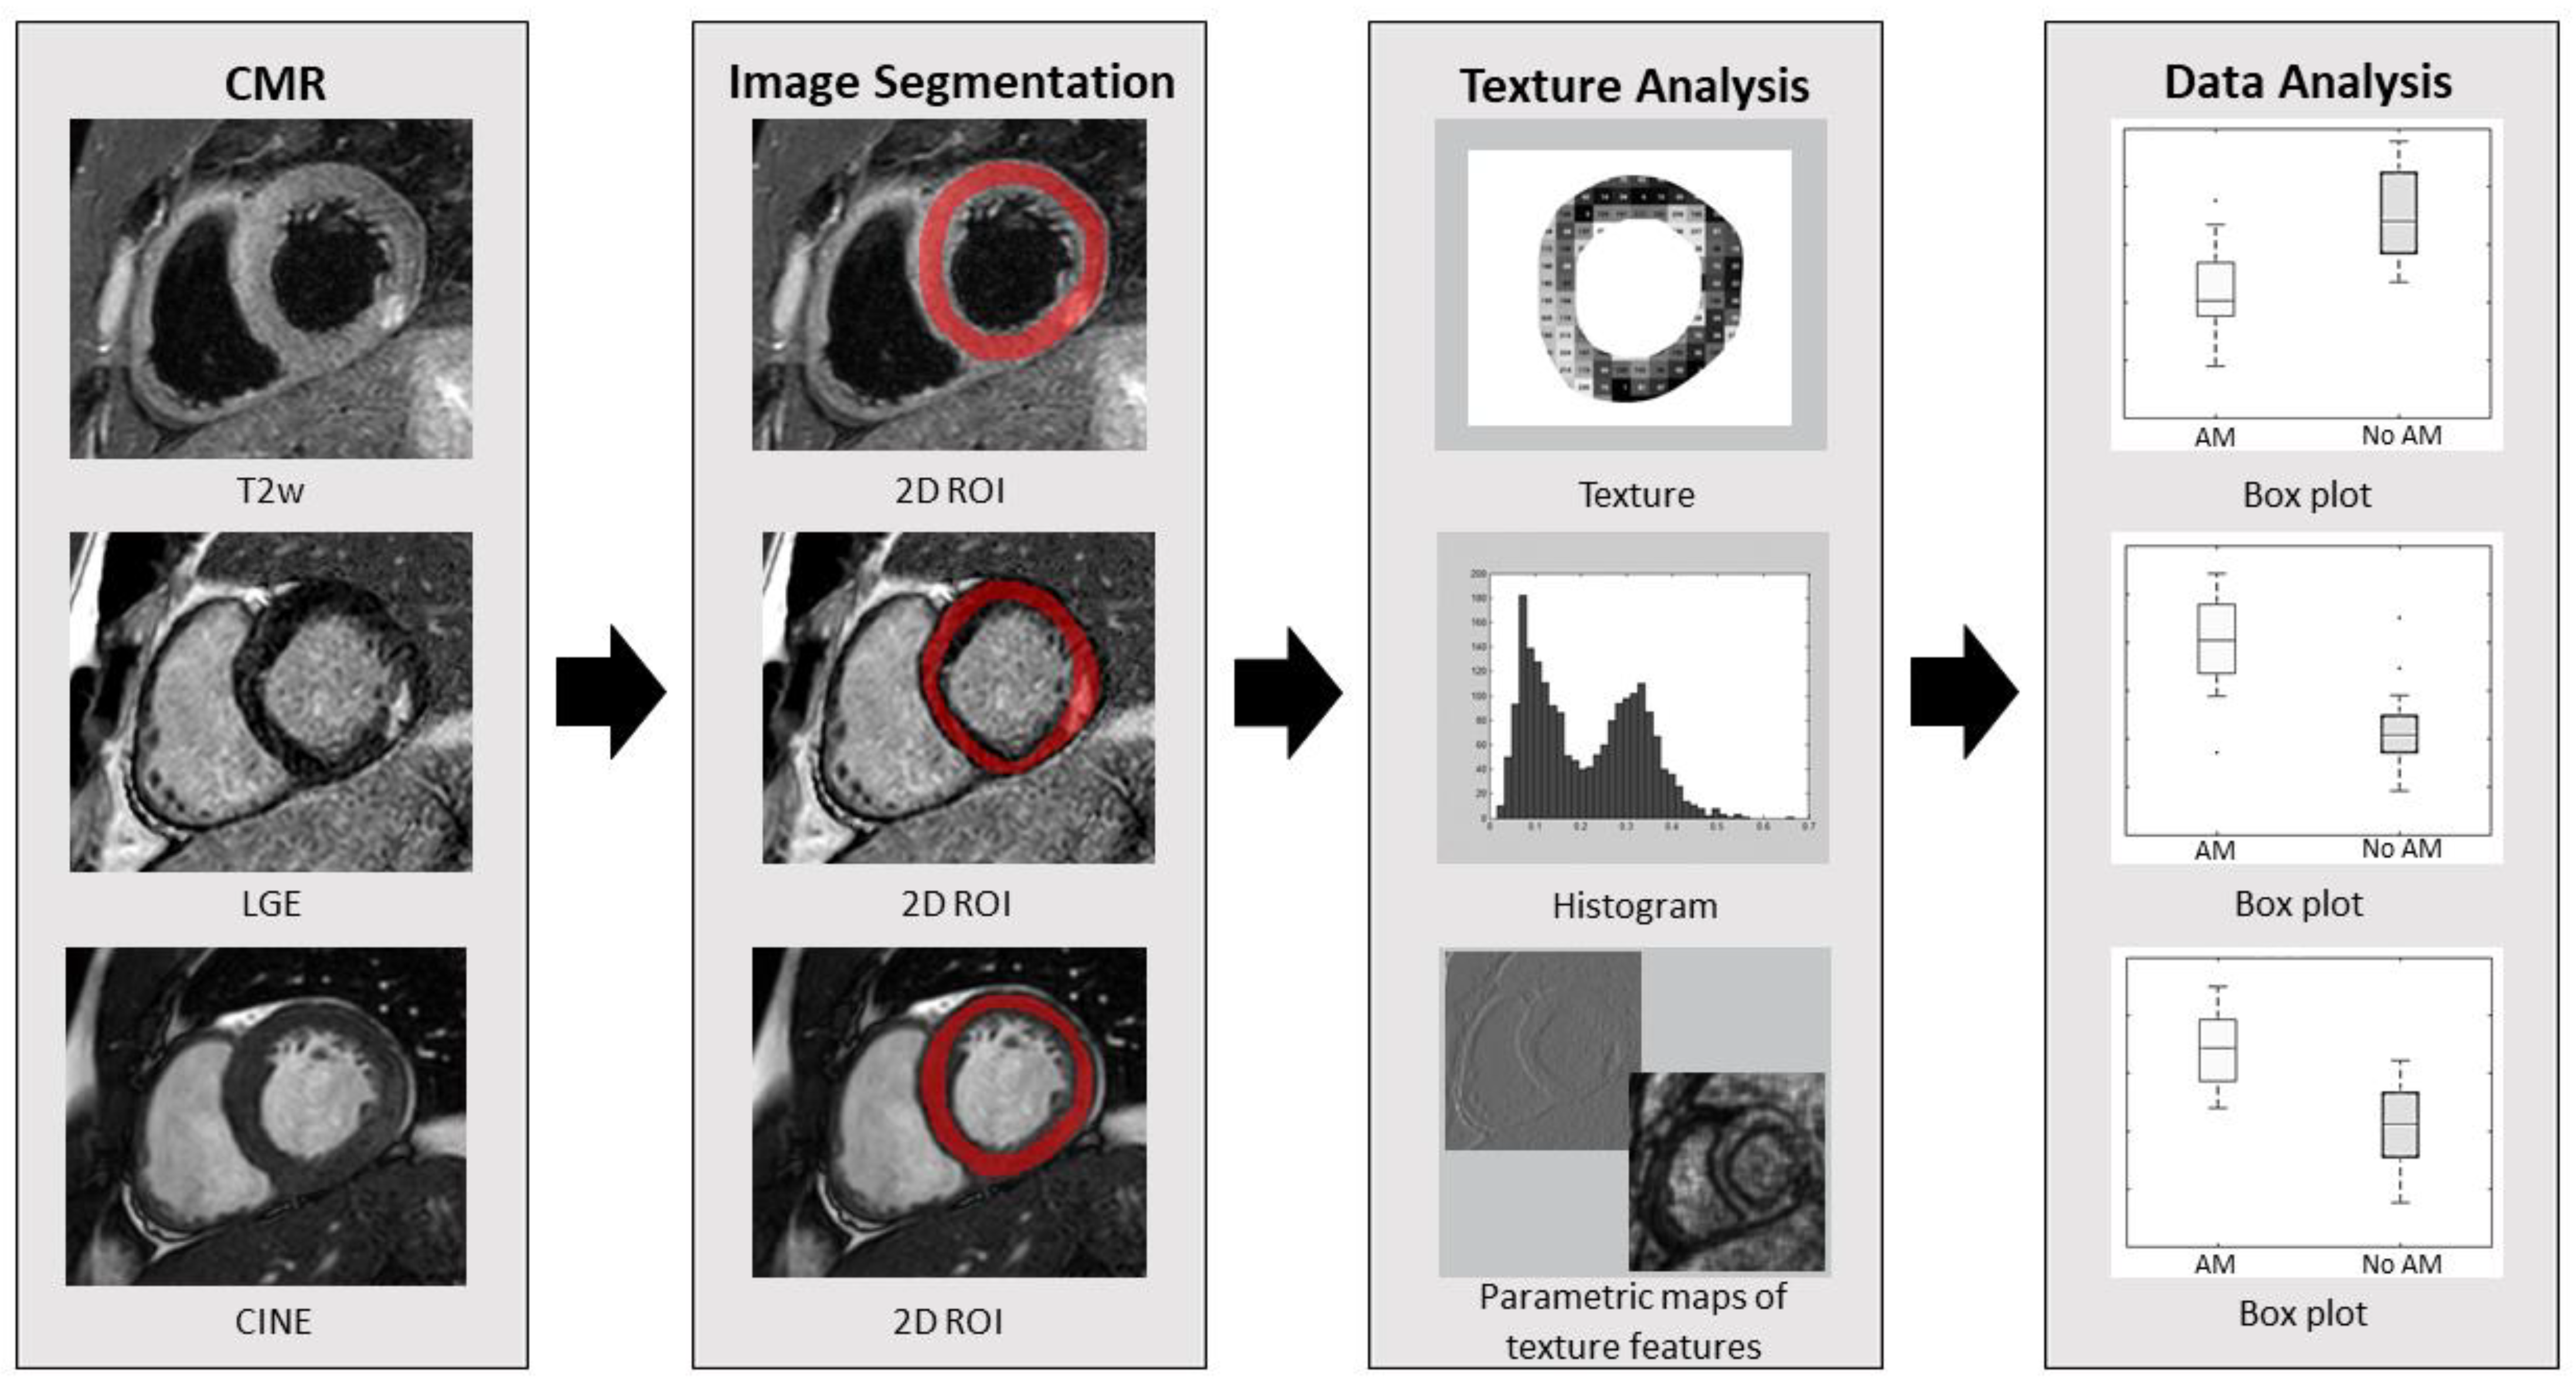
2.3. Image Segmentation and Texture Analysis
2.4. Statistical Analysis
3. Results
3.1. Reproducibility Measurements
3.2. Group Comparisons and Correlation Analysis
4. Discussion
5. Conclusions
Supplementary Materials
Author Contributions
Funding
Institutional Review Board Statement
Informed Consent Statement
Data Availability Statement
Conflicts of Interest
References
- Tschöpe, C.; Ammirati, E.; Bozkurt, B.; Caforio, A.L.P.; Cooper, L.T.; Felix, S.B.; Hare, J.M.; Heidecker, B.; Heymans, S.; Hübner, N.; et al. Myocarditis and inflammatory cardiomyopathy: Current evidence and future directions. Nat. Rev. Cardiol. 2021, 18, 169–193. [Google Scholar] [CrossRef] [PubMed]
- Ferreira, V.M.; Schulz-Menger, J.; Holmvang, G.; Kramer, C.M.; Carbone, I.; Sechtem, U.; Kindermann, I.; Gutberlet, M.; Cooper, L.T.; Liu, P.; et al. Cardiovascular Magnetic Resonance in Nonischemic Myocardial Inflammation: Expert Recommendations. JACC Cardiol. Oncol. 2018, 72, 3158–3176. [Google Scholar] [CrossRef]
- Baessler, B.; Schaarschmidt, F.; Stehning, C.; Schnackenburg, B.; Maintz, D.; Bunck, A.C. A systematic evaluation of three different cardiac T2-mapping sequences at 1.5 and 3T in healthy volunteers. Eur. J. Radiol. 2015, 84, 2161–2170. [Google Scholar] [CrossRef]
- Baessler, B.; Schaarschmidt, F.; Dick, A.; Stehning, C.; Schnackenburg, B.; Michels, G.; Maintz, D.; Bunck, A.C. Mapping tissue inhomogeneity in acute myocarditis: A novel analytical approach to quantitative myocardial edema imaging by T2-mapping. J. Cardiovasc. Magn. Reason. 2015, 17, 115. [Google Scholar] [CrossRef] [Green Version]
- Wassmuth, R.; Prothmann, M.; Utz, W.; Dieringer, M.; von Knobelsdorff-Brenkenhoff, F.; Greiser, A.; Schulz-Menger, J. Variability and homogeneity of cardiovascular magnetic resonance myocardial T2-mapping in volunteers compared to patients with edema. J. Cardiovasc. Magn. Reason. 2013, 15, 27. [Google Scholar] [CrossRef] [Green Version]
- Von Knobelsdorff-Brenkenhoff, F.; Prothmann, M.; Dieringer, M.A.; Wassmuth, R.; Greiser, A.; Schwenke, C.; Niendorf, T.; Schulz-Menger, J. Myocardial T1 and T2 mapping at 3 T: Reference values, influencing factors and implications. J. Cardiovasc. Magn. Reason. 2013, 15, 53. [Google Scholar] [CrossRef] [PubMed] [Green Version]
- Castellano, G.; Bonilha, L.; Cendes, F. Texture analysis of medical images. Clin. Radiol. 2004, 59, 1061–1069. [Google Scholar] [CrossRef]
- Eriksson, S.; Waldenberg, C.; Torén, L.; Grimby-Ekman, A.; Brisby, H.; Hebelka, H.; Lagerstrand, K. Texture Analysis of Magnetic Resonance Images Enables Phenotyping of Potentially Painful Annular Fissures. Spine 2022, 4, 430–437. [Google Scholar] [CrossRef]
- Di Noto, T.; von Spiczak, J.; Mannil, M.; Gantert, E.; Soda, P.; Manka, R.; Alkadhi, H. Radiomics for Distinguishing Myocardial Infarction from Myocarditis at Late Gadolinium Enhancement at MRI: Comparison with Subjective Visual Analysis. Radiol. Cardiothorac. Imaging 2019, 1, e180026. [Google Scholar] [CrossRef]
- Baessler, B.; Luecke, C.; Lurz, J.; Klingel, K.; von Roeder, M.; de Waha, S.; Besler, C.; Maintz, D.; Gutberlet, M.; Thiele, H.; et al. Cardiac MRI Texture Analysis of T1 and T2 Maps in Patients with Infarctlike Acute Myocarditis. Radiology 2018, 289, 357–365. [Google Scholar] [CrossRef]
- Bieri, O.; Scheffler, K. Fundamentals of Balanced Steady State Free Precession MRI. J. Magn. Reason. Imaging 2013, 38, 2–11. [Google Scholar] [CrossRef] [PubMed]
- Collidge, T.A.; Thomson, P.C.; Mark, P.B.; Traynor, J.P.; Jardine, A.G.; Morris, S.T.W.; Simpson, K.; Roditi, G.H. Gadolinium-enhanced MR imaging and nephrogenic systemic fibrosis: Retrospective study of a renal replacement therapy cohort. Radiology 2007, 245, 168–175. [Google Scholar] [CrossRef] [PubMed]
- Friedrich, M.G.; Sechtem, U.; Schulz-Menger, J.; Holmvang, G.; Alakija, P.; Cooper, L.T.; White, J.A.; Abdel-Aty, H.; Gutberlet, M.; Prasad, S.; et al. Cardiovascular magnetic resonance in myocarditis: A JACC White Paper. J. Am. Coll. Cardiol. 2009, 53, 1475–1487. [Google Scholar] [CrossRef] [PubMed] [Green Version]
- Caforio, A.L.; Pankuweit, S.; Arbustini, E.; Basso, C.; Gimeno-Blanes, J.; Felix, S.B.; Fu, M.; Heliö, T.; Heymans, S.; Jahns, R.; et al. Current state of knowledge on aetiology, diagnosis, management, and therapy of myocarditis: A position statement of the European Society of Cardiology Working Group on Myocardial and Pericardial Diseases. Eur. Heart J. 2013, 34, 2636–2648. [Google Scholar] [CrossRef]
- Szczypinski, P.M.; Strzelecki, M.; Materka, A.; Klepaczko, A. MaZda-A software package for image texture analysis. Comput Methods Programs Biomed. 2009, 94, 66–76. [Google Scholar] [CrossRef]
- Szczypinski, P.M.; Strzelecki, M.; Materka, A. MaZda—A Software for Texture Analysis. In Proceedings of the ISITC 2007 International Symposium on Information Technology Convergence, Jeonju, Republic of Korea, 23–24 November 2007; pp. 245–249. [Google Scholar] [CrossRef]
- Collewet, G.; Strzelecki, M.; Mariette, F. Influence of MRI acquisition protocols and image intensity normalization methods on texture classification. Magn. Reason. Imaging 2004, 22, 81–91. [Google Scholar] [CrossRef]
- Koo, T.K.; Li, M.Y. A Guideline of Selecting and Reporting Intraclass Correlation Coefficients for Reliability Research. J. Chiropr. Med. 2016, 15, 155–163. [Google Scholar] [CrossRef] [Green Version]
- Akoglu, H. User’s guide to correlation coefficients. Turk. J. Emerg. Med. 2018, 18, 91–93. [Google Scholar] [CrossRef]
- Hahn, L.; Kligerman, S. Cardiac MRI Evaluation of Myocarditis. Curr. Treat. Options Cardiovasc. Med. 2019, 21, 69. [Google Scholar] [CrossRef]
- Kellman, P.; Aletras, A.H.; Mancini, C.; McVeigh, E.R.; Arai, A.E. T2-prepared SSFP improves diagnostic confidence in edema imaging in acute myocardial infarction compared to turbo spin echo. Magn. Reason. Med. 2007, 57, 891–897. [Google Scholar] [CrossRef]
- Keegan, J.; Gatehouse, P.D.; Prasad, S.K.; Firmin, D.N. Improved turbo spin-echo imaging of the heart with motion-tracking. J. Magn. Reason. Imaging 2006, 24, 563–570. [Google Scholar] [CrossRef] [PubMed]

| Characteristic | Clinically Suspected AM (n = 20) | CMR-Verified AM (n = 10) | Non CMR-Verified AM (n = 10) | p-Value |
|---|---|---|---|---|
| Age (years) | 28 (28) | 25 (10) | 49 (24) | 0.001 ‡ |
| No. of men | 18 | 9 | 9 | 1 |
| Height (cm) | 180 (8) | 177 (19) | 181 (4) | 0.44 |
| Weight (kg) | 81 (22) | 78 (34) | 86 (18) | 0.33 |
| Symptom † | ||||
| Fever | 5 | 4 | 1 | - |
| Fatigue | 3 | 1 | 2 | - |
| Chest pain | 19 | 10 | 9 | - |
| Dyspnea | 3 | 1 | 2 | - |
| Recent infection | 14 | 10 | 4 | - |
| No. of diagnostic criteria for clinically suspected AM ¶ | 3.0 (1.8) | 3.5 (1.0) | 3.0 (1.0) | 0.29 |
| Pathologic ECG finding † | ||||
| Sinus rhythm | 20 | 10 | 10 | - |
| AV conduction abnormality | 1 | 0 | 1 | - |
| ST-segment elevation | 7 | 4 | 3 | - |
| ST-segment depression | 3 | 1 | 2 | - |
| T-wave inversion | 6 | 3 | 3 | - |
| Pathologic blood result † | ||||
| TNT/TNI | 30 (538) | 606 (1407) § | 24 (40) | 0.001 ‡ |
| NT-proBNP | 278 (487) | 424 (314) § | 17 (140) § | 0.003 ‡ |
| CRP | 16 (35) | 34 (60) § | 7 (16) | 0.07 |
| Cardiovascular risk factor † | ||||
| Hypertension | 2 | 1 | 1 | - |
| Hyperlipidaemia | 0 | 0 | 0 | - |
| Diabetes | 0 | 0 | 0 | - |
| Smoker | 0 | 0 | 0 | - |
| Obesity | 1 | 0 | 1 | - |
| CMR findings | ||||
| LV iEDV (mL) | 91 (19) | 91 (13) | 86 (37) | 0.10 |
| LV iESV (mL) | 37 (13) | 38 (10) | 35 (23) | 0.17 |
| LV iSV (mL) | 50 (12) | 53 (10) | 46 (16) | 0.08 |
| LV EF (%) | 59 (6) | 59 (5) | 59 (8) | 0.39 |
| T2w findings † | 10 | 10 * | 0 | - |
| LGE findings † | 10 | 10 | 0 | - |
| Texture Category | Texture Feature | Number of Features |
|---|---|---|
| Histogram | Mean, variance, skewness, kurtosis, percentiles (1%, 10%, 50%, 90%, 99%). | 9 |
| Absolute gradient (4 bits/pixel) | Gradient mean, variance, skewness, kurtosis, non-zeros. | 5 |
| Run-length matrix (computed for four angles (vertical, horizontal, 45°, and 135°); 6 bits/pixel) | Run-length non-uniformity, gray-level non-uniformity, long run emphasis, short run emphasis, fraction of image in runs. | 20 |
| Co-occurrence matrix (computed for four directions ((x,0), (0,x), (x,x), (x,−x)) at five interpixel distances (x = 1–5); 6 bits/pixel) | Angular second moment, contrast, correlation, entropy, sum entropy, sum of squares, sum average, sum variance, inverse different moment, difference entropy, difference variance. | 220 |
| Autoregressive model | Teta 1 to 4, sigma. | 5 |
| Wavelet transform (calculated for four subsampling factors (n = 1–4); 8 bits/pixel) | Energy of wavelet coefficients in low-frequency sub-bands, horizontal high-frequency sub-bands, vertical high-frequency sub-bands, and diagonal high-frequency sub-bands. | 16 |
| CMR | Texture Feature | CMR-Verified AM | Non CMR-Verified AM | ICC | p-Value | R |
|---|---|---|---|---|---|---|
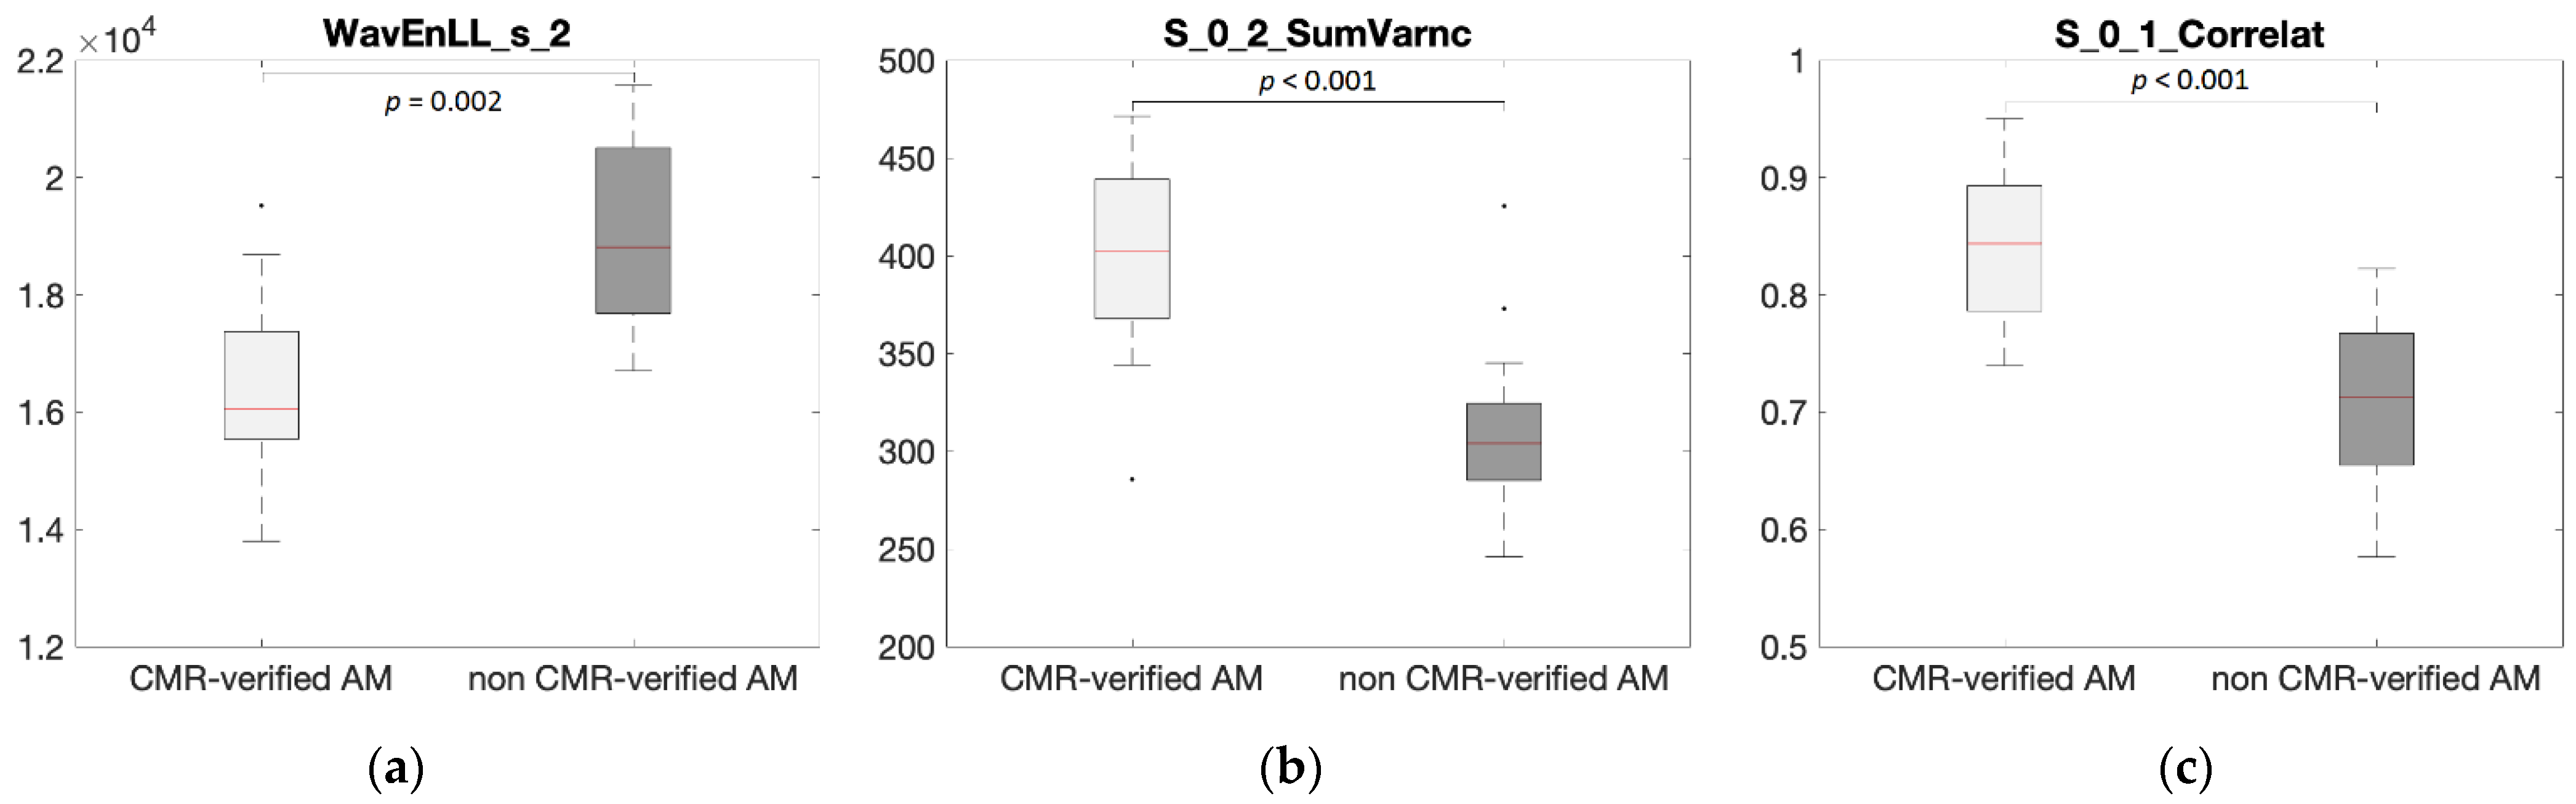
| T2w | WavEnLL_s_2 | 16,400 ± 1360 | 19,100 ± 1600 | 0.85 | 0.002 | −0.67 |
| WavEnLL_s_3 | 12,500 ± 1690 | 16,900 ± 3570 | 0.88 | 0.008 | −0.62 | |
| S_3__3_SumOfSqs | 113 ± 8 | 103 ± 5 | 0.88 | 0.012 | 0.59 | |
| S_2__2_SumOfSqs | 111 ± 6 | 104 ± 4 | 0.81 | 0.012 | 0.59 | |
| WavEnLL_s_4 | 8050 ± 1920 | 12,200 ± 3600 | 0.94 | 0.012 | −0.58 | |
| S_1_1_SumAverg | 64.7 ± 0.8 | 63.8 ± 0.6 | 0.77 | 0.012 | 0.56 | |
| S_2_2_SumAverg | 65.2 ± 1.2 | 63.8 ± 0.9 | 0.89 | 0.019 | 0.54 | |
| S_4__4_SumOfSqs | 113 ± 9 | 102 ± 10 | 0.81 | 0.019 | 0.50 | |
| Skewness | 0.37 ± 0.38 | −0.01 ± 0.3 | 0.89 | 0.031 | 0.49 | |
| S_0_2_SumOfSqs | 110 ± 5 | 106 ± 4 | 0.81 | 0.021 | 0.48 | |
| LGE | S_0_2_SumVarnc | 401 ± 46 | 306 ± 42 | 0.98 | <0.001 | 0.73 |
| S_0_4_SumVarnc | 376 ± 73 | 233 ± 65 | 0.96 | <0.001 | 0.72 | |
| S_0_5_SumVarnc | 372 ± 82 | 228 ± 66 | 0.97 | <0.001 | 0.69 | |
| S_1__1_SumVarnc | 411 ± 28 | 258 ± 29 | 0.95 | <0.001 | 0.69 | |
| S_0_1_SumVarnc | 424 ± 24 | 379 ± 23 | 0.98 | <0.001 | 0.68 | |
| S_2_0_SumAverg | 65.6 ± 0.9 | 63.6 ± 1.3 | 0.78 | <0.001 | 0.68 | |
| S_0_2_SumAverg | 65.9 ± 1.1 | 63.6 ± 1.4 | 0.77 | <0.001 | 0.68 | |
| S_0_2_SumOfSqs | 114 ± 6 | 102 ± 7 | 0.89 | <0.001 | 0.66 | |
| WavEnLL_s_2 | 17,700 ± 1540 | 21,200 ± 2320 | 0.91 | <0.001 | −0.66 | |
| S_0_4_Correlat | 0.57 ± 0.21 | 0.18 ± 0.23 | 0.98 | <0.001 | 0.66 | |
| CINE | S_0_1_Correlat | 0.84 ± 0.06 | 0.72 ± 0.07 | 0.98 | <0.001 | 0.70 |
| S_0_2_Correlat | 0.61 ± 0.15 | 0.32 ± 0.15 | 0.99 | <0.001 | 0.70 | |
| S_0_2_SumVarnc | 359 ± 50 | 274 ± 39 | 0.98 | <0.001 | 0.69 | |
| S_0_1_Contrast | 34.0 ± 13.2 | 59.9 ± 13.9 | 0.97 | <0.001 | −0.68 | |
| S_0_2_Contrast | 85.3 ± 31.8 | 141 ± 28 | 0.97 | <0.001 | −0.68 | |
| S_1__1_Correlat | 0.73 ± 0.10 | 0.54 ± 0.11 | 0.98 | <0.001 | 0.67 | |
| S_1__1_Contrast | 57.8 ± 20.3 | 94.9 ± 21.5 | 0.98 | <0.001 | −0.66 | |
| S_0_1_SumVarnc | 405 ± 25 | 362 ± 25 | 0.89 | <0.001 | 0.66 | |
| S_0_3_Correlat | 0.51 ± 0.19 | 0.20 ± 0.17 | <1.00 | <0.001 | 0.66 | |
| Sigma | 0.35 ± 0.08 | 0.48 ± 0.08 | 0.98 | <0.001 | −0.65 |
Publisher’s Note: MDPI stays neutral with regard to jurisdictional claims in published maps and institutional affiliations. |
© 2022 by the authors. Licensee MDPI, Basel, Switzerland. This article is an open access article distributed under the terms and conditions of the Creative Commons Attribution (CC BY) license (https://creativecommons.org/licenses/by/4.0/).
Share and Cite
Papalini, E.I.; Polte, C.L.; Bobbio, E.; Lagerstrand, K.M. Diagnosis of Acute Myocarditis Using Texture-Based Cardiac Magnetic Resonance, with CINE Imaging as a Novel Tissue Characterization Technique. Diagnostics 2022, 12, 3187. https://doi.org/10.3390/diagnostics12123187
Papalini EI, Polte CL, Bobbio E, Lagerstrand KM. Diagnosis of Acute Myocarditis Using Texture-Based Cardiac Magnetic Resonance, with CINE Imaging as a Novel Tissue Characterization Technique. Diagnostics. 2022; 12(12):3187. https://doi.org/10.3390/diagnostics12123187
Chicago/Turabian StylePapalini, Evin I., Christian L. Polte, Emanuele Bobbio, and Kerstin M. Lagerstrand. 2022. "Diagnosis of Acute Myocarditis Using Texture-Based Cardiac Magnetic Resonance, with CINE Imaging as a Novel Tissue Characterization Technique" Diagnostics 12, no. 12: 3187. https://doi.org/10.3390/diagnostics12123187
APA StylePapalini, E. I., Polte, C. L., Bobbio, E., & Lagerstrand, K. M. (2022). Diagnosis of Acute Myocarditis Using Texture-Based Cardiac Magnetic Resonance, with CINE Imaging as a Novel Tissue Characterization Technique. Diagnostics, 12(12), 3187. https://doi.org/10.3390/diagnostics12123187