
Thyroid Cancer and Psoriasis: A Nested Case–Control Study


Abstract
1. Introduction
2. Materials and Methods
3. Results
4. Discussion
5. Conclusions
Author Contributions
Funding
Institutional Review Board Statement
Informed Consent Statement
Data Availability Statement
Conflicts of Interest
References
- Seib, C.D.; Sosa, J.A. Evolving Understanding of the Epidemiology of Thyroid Cancer. Endocrinol. Metab. Clin. 2019, 48, 23–35. [Google Scholar] [CrossRef] [PubMed]
- Won, H.-R.; Koo, B.S. Active Surveillance or Surgery in Papillary Thyroid Microcarcinoma: An Ongoing Controversy. Clin. Exp. Otorhinolaryngol. 2022, 15, 123–124. [Google Scholar] [CrossRef] [PubMed]
- Takano, T. Natural history of thyroid cancer. Endocr. J. 2017, 64, 237–244. [Google Scholar] [CrossRef]
- Myung, S.-K.; Lee, C.W.; Lee, J.; Kim, J.; Kim, H.S. Risk Factors for Thyroid Cancer: A Hospital-Based Case-Control Study in Korean Adults. Cancer Res. Treat. 2017, 49, 70–78. [Google Scholar] [CrossRef]
- Crnčić, T.B.; Tomaš, M.I.; Girotto, N.; Ivanković, S.G. Risk Factors for Thyroid Cancer: What Do We Know So Far? Acta Clin. Croat. 2020, 59, 66–72. [Google Scholar] [CrossRef]
- Guarino, V.; Castellone, M.D.; Avilla, E.; Melillo, R.M. Thyroid cancer and inflammation. Mol. Cell. Endocrinol. 2010, 321, 94–102. [Google Scholar] [CrossRef]
- Li, H.; Qian, J. Association of diabetes mellitus with thyroid cancer risk: A meta-analysis of cohort studies. Medicine 2017, 96, e8230. [Google Scholar] [CrossRef]
- Fussey, J.M.; Beaumont, R.N.; Wood, A.R.; Vaidya, B.; Smith, J.; Tyrrell, J. Does Obesity Cause Thyroid Cancer? A Mendelian Randomization Study. J. Clin. Endocrinol. Metab. 2020, 105, e2398–e2407. [Google Scholar] [CrossRef]
- Lee, J.; Jung, K.J.; Kim, T.-G.; Lee, M.-G.; Oh, J.; Jee, S.H. Risk of malignancy in patients with psoriasis: A 15-year nationwide population-based prospective cohort study in Korea. J. Eur. Acad. Dermatol. Venereol. 2019, 33, 2296–2304. [Google Scholar] [CrossRef]
- Nestle, F.O.; Kaplan, D.H.; Barker, J. Psoriasis. N. Engl. J. Med. 2009, 361, 496–509. [Google Scholar] [CrossRef]
- Jensen, P.; Skov, L. Psoriasis and Obesity. Dermatology 2016, 232, 633–639. [Google Scholar] [CrossRef] [PubMed]
- Pezzolo, E.; Naldi, L. The relationship between smoking, psoriasis and psoriatic arthritis. Expert Rev. Clin. Immunol. 2019, 15, 41–48. [Google Scholar] [CrossRef] [PubMed]
- Svanström, C.; Lonne-Rahm, S.-B.; Nordlind, K. Psoriasis and alcohol. Psoriasis Targets Ther. 2019, 9, 75–79. [Google Scholar] [CrossRef] [PubMed]
- Loft, N.D.; Vaengebjerg, S.; Skov, L. Cancer risk in patients with psoriasis: Should we be paying more attention? Expert Rev. Clin. Immunol. 2020, 16, 479–492. [Google Scholar] [CrossRef] [PubMed]
- Vaengebjerg, S.; Skov, L.; Egeberg, A.; Loft, N.D. Prevalence, Incidence, and Risk of Cancer in Patients with Psoriasis and Psoriatic Arthritis: A Systematic Review and Meta-analysis. JAMA Dermatol. 2020, 156, 421–429. [Google Scholar] [CrossRef]
- Lee, J.H.; Kim, H.; Han, K.D.; Kim, H.-N.; Park, Y.M.; Lee, J.Y.; Park, Y.-G.; Lee, Y.B. Cancer risk in 892 089 patients with psoriasis in Korea: A nationwide population-based cohort study. J. Dermatol. 2019, 46, 95–102. [Google Scholar] [CrossRef]
- Seong, S.C.; Kim, Y.-Y.; Park, S.K.; Khang, Y.-H.; Kim, H.C.; Park, J.H.; Kang, H.-J.; Do, C.-H.; Song, J.-S.; Lee, E.-J.; et al. Cohort profile: The National Health Insurance Service-National Health Screening Cohort (NHIS-HEALS) in Korea. BMJ Open 2017, 7, e016640. [Google Scholar] [CrossRef]
- Kim, S.Y.; Min, C.; Yoo, D.M.; Chang, J.; Lee, H.-J.; Park, B.; Choi, H.G. Hearing Impairment Increases Economic Inequality. Clin. Exp. Otorhinolaryngol. 2021, 14, 278–286. [Google Scholar] [CrossRef]
- Quan, H.; Li, B.; Couris, C.M.; Fushimi, K.; Graham, P.; Hider, P.; Januel, J.-M.; Sundararajan, V. Updating and Validating the Charlson Comorbidity Index and Score for Risk Adjustment in Hospital Discharge Abstracts Using Data From 6 Countries. Am. J. Epidemiol. 2011, 173, 676–682. [Google Scholar] [CrossRef]
- Li, F.; Thomas, L.E. Addressing Extreme Propensity Scores via the Overlap Weights. Am. J. Epidemiol. 2019, 188, 250–257. [Google Scholar] [CrossRef]
- Thomas, L.E.; Li, F.; Pencina, M.J. Overlap Weighting: A Propensity Score Method That Mimics Attributes of a Randomized Clinical Trial. JAMA 2020, 323, 2417. [Google Scholar] [CrossRef] [PubMed]
- Zhu, Y.; Schonbach, M.; Coffman, D.L.; Williams, J.S. Variable Selection for Propensity Score Estimation via Balancing Covariates. Epidemiology 2015, 26, e14–e15. [Google Scholar] [CrossRef] [PubMed]
- Derwahl, M.; Nicula, D. Estrogen and its role in thyroid cancer. Endocr. Relat. Cancer 2014, 21, T273–T283. [Google Scholar] [CrossRef]
- Boffetta, P.; Gridley, G.; Lindelöf, B. Cancer Risk in a Population-Based Cohort of Patients Hospitalized for Psoriasis in Sweden. J. Investig. Dermatol. 2001, 117, 1531–1537. [Google Scholar] [CrossRef]
- Guttman-Yassky, E.; Krueger, J.G.; Lebwohl, M.G. Systemic immune mechanisms in atopic dermatitis and psoriasis with implications for treatment. Exp. Dermatol. 2018, 27, 409–417. [Google Scholar] [CrossRef] [PubMed]
- Felicetti, F.; Catalano, M.G.; Fortunati, N. Thyroid Autoimmunity and Cancer. Front. Horm. Res. 2017, 48, 97–109. [Google Scholar] [CrossRef]
- Baldini, E.; Odorisio, T.; Sorrenti, S.; Catania, A.; Tartaglia, F.; Carbotta, G.; Pironi, D.; Rendina, R.; D’Armiento, E.; Persechino, S.; et al. Vitiligo and Autoimmune Thyroid Disorders. Front. Endocrinol. 2017, 8, 290. [Google Scholar] [CrossRef]
- Baldini, E.; Odorisio, T.; Tuccilli, C.; Persechino, S.; Sorrenti, S.; Catania, A.; Pironi, D.; Carbotta, G.; Giacomelli, L.; Arcieri, S.; et al. Thyroid diseases and skin autoimmunity. Rev. Endocr. Metab. Disord. 2018, 19, 311–323. [Google Scholar] [CrossRef]
- Kano, Y.; Chiba, M.; Yagita, A.; Shiohara, T. Complete resolution of psoriasis vulgaris after excision of thyroid cancer. Int. J. Dermatol. 2008, 36, 280–282. [Google Scholar] [CrossRef]
- Hung, S.-H.; Chung, S.-D.; Lin, H.-C. Thyroxin Use Is Associated With Increased Risk of Thyroid Cancer in Patients With Hypothyroidism. J. Clin. Pharmacol. 2018, 58, 29–33. [Google Scholar] [CrossRef]


| Characteristics | After Overlap Weighting Adjustment | Before Overlap Weighting Adjustment | ||||
|---|---|---|---|---|---|---|
| Thyroid Cancer | Control | Standardized Difference | Thyroid Cancer | Control | Standardized Difference | |
| Age (n, %) | 0.00 | 0.00 | ||||
| 40–44 | 63 (1.79) | 63 (1.79) | 128 (1.88) | 512 (1.88) | ||
| 45–49 | 417 (11.83) | 417 (11.83) | 837 (12.27) | 3348 (12.27) | ||
| 50–54 | 842 (23.86) | 842 (23.86) | 1623 (23.79) | 6492 (23.79) | ||
| 55–59 | 875 (24.80) | 875 (24.80) | 1672 (24.51) | 6688 (24.51) | ||
| 60–64 | 645 (18.26) | 645 (18.26) | 1194 (17.50) | 4776 (17.50) | ||
| 65–69 | 373 (10.57) | 373 (10.57) | 746 (10.94) | 2984 (10.94) | ||
| 70–74 | 218 (6.18) | 218 (6.18) | 433 (6.35) | 1732 (6.35) | ||
| 75–79 | 70 (1.97) | 70 (1.97) | 144 (2.11) | 576 (2.11) | ||
| 80–84 | 25 (0.69) | 25 (0.69) | 43 (0.63) | 172 (0.63 | ||
| 85+ | 2 (0.05) | 2 (0.05) | 2 (0.03) | 8 (0.03) | ||
| Sex (n, %) | 0.00 | 0.00 | ||||
| Male | 726 (20.57) | 726 (20.57) | 1513 (22.18) | 6052 (22.18) | ||
| Female | 2803 (79.43) | 2804 (79.43) | 5309 (77.82) | 21,236 (77.82) | ||
| Income (n, %) | 0.00 | 0.00 | ||||
| 1 (lowest) | 446 (12.63) | 446 (12.63) | 852 (12.49) | 3408 (12.49) | ||
| 2 | 418 (11.85) | 418 (11.85) | 803 (11.77) | 3212 (11.77) | ||
| 3 | 537 (15.22) | 537 (15.22) | 1040 (15.24) | 4160 (15.24) | ||
| 4 | 745 (21.10) | 745 (21.10) | 1433 (21.01) | 5732 (21.01) | ||
| 5 (highest) | 1383 (39.20) | 1383 (39.20) | 2694 (39.49) | 10,776 (39.49) | ||
| Region of residence (n, %) | 0.00 | 0.00 | ||||
| Urban | 1697 (48.07) | 1697 (48.07) | 3221 (47.21) | 12,884 (47.21) | ||
| Rural | 1833 (51.93) | 1833 (51.93) | 3601 (52.79) | 14,404 (52.79) | ||
| Obesity † (n, %) | 0.00 | 0.13 | ||||
| Underweight | 56 (1.58) | 56 (1.58) | 93 (1.36) | 578 (2.12) | ||
| Normal | 1212 (34.35) | 1212 (34.35) | 2210 (32.40) | 10,107 (37.04) | ||
| Overweight | 984 (27.89) | 984 (27.89) | 1936 (28.38) | 7453 (27.31) | ||
| Obese I | 1141 (32.32) | 1141 (32.32) | 2301 (33.73) | 8248 (30.23) | ||
| Obese II | 136 (3.86) | 136 (3.86) | 282 (4.13) | 902 (3.31) | ||
| Smoking status (n, %) | 0.00 | 0.08 | ||||
| Nonsmoker | 3069 (86.95) | 3069 (86.95) | 5904 (86.54) | 23,182 (84.95) | ||
| Past smoker | 252 (7.15) | 252 (7.15) | 520 (7.62) | 1945 (7.13) | ||
| Current smoker | 208 (5.90) | 208 (5.90) | 398 (5.83) | 2161 (7.92) | ||
| Alcohol consumption (n, %) | 0.00 | 0.04 | ||||
| <1 time a week | 2660 (75.37) | 2660 (75.37) | 5158 (75.61) | 20,176 (73.94) | ||
| ≥1 time a week | 869 (24.63) | 869 (24.63) | 1664 (24.39) | 7112 (26.06) | ||
| SBP (Mean, SD) | 124.14 (11.29) | 124.14 (5.74) | 0.00 | 124.59 (15.74) | 123.89 (16.17) | 0.04 |
| DBP (Mean, SD) | 77.04 (7.38) | 77.04 (3.76) | 0.00 | 77.41 (10.32) | 76.77 (10.48) | 0.06 |
| FBG (Mean, SD) | 98.14 (16.35) | 98.14 (8.51) | 0.00 | 98.00 (23.09) | 98.67 (26.09) | 0.03 |
| Total cholesterol (Mean, SD) | 199.61 (27.40) | 199.61 (13.55) | 0.00 | 198.76 (38.05) | 201.47 (37.94) | 0.07 |
| CCI score (Mean, SD) | 0.46 (0.61) | 0.46 (0.34) | 0.00 | 0.48 (0.87) | 0.42 (0.89) | 0.44 |
| Hypothyroidism (n, %) | 1233 (34.93) | 1233 (34.93) | 0.00 | 3813 (55.89) | 2289 (8.39) | 1.18 |
| Goiter (n, %) | 1375 (38.97) | 1375 (38.97) | 0.00 | 3832 (56.17) | 3062 (11.22) | 1.08 |
| Thyrotoxicosis (n, %) | 315 (8.92) | 315 (8.92) | 0.00 | 697 (10.22) | 1294 (4.74) | 0.21 |
| Thyroiditis (n, %) | 340 (9.62) | 340 (9.62) | 0.00 | 619 (9.07) | 1230 (4.51) | 0.18 |
| Psoriasis (n, %) | 0.01 | 0.00 | ||||
| No | 3479 (98.58) | 3480 (98.59) | 6730 (98.65) | 26,924 (98.67) | ||
| Yes | 50 (1.42) | 50 (1.41) | 92 (1.35) | 364 (1.33) | ||
| Characteristics | N of Thyroid Cancer | N of Control | Odd Ratios for Thyroid Cancer (95% Confidence Interval) | |||
|---|---|---|---|---|---|---|
| (Exposure/Total, %) | (Exposure/Total, %) | Crude † | p Value | Overlap Weighted Model † | p Value | |
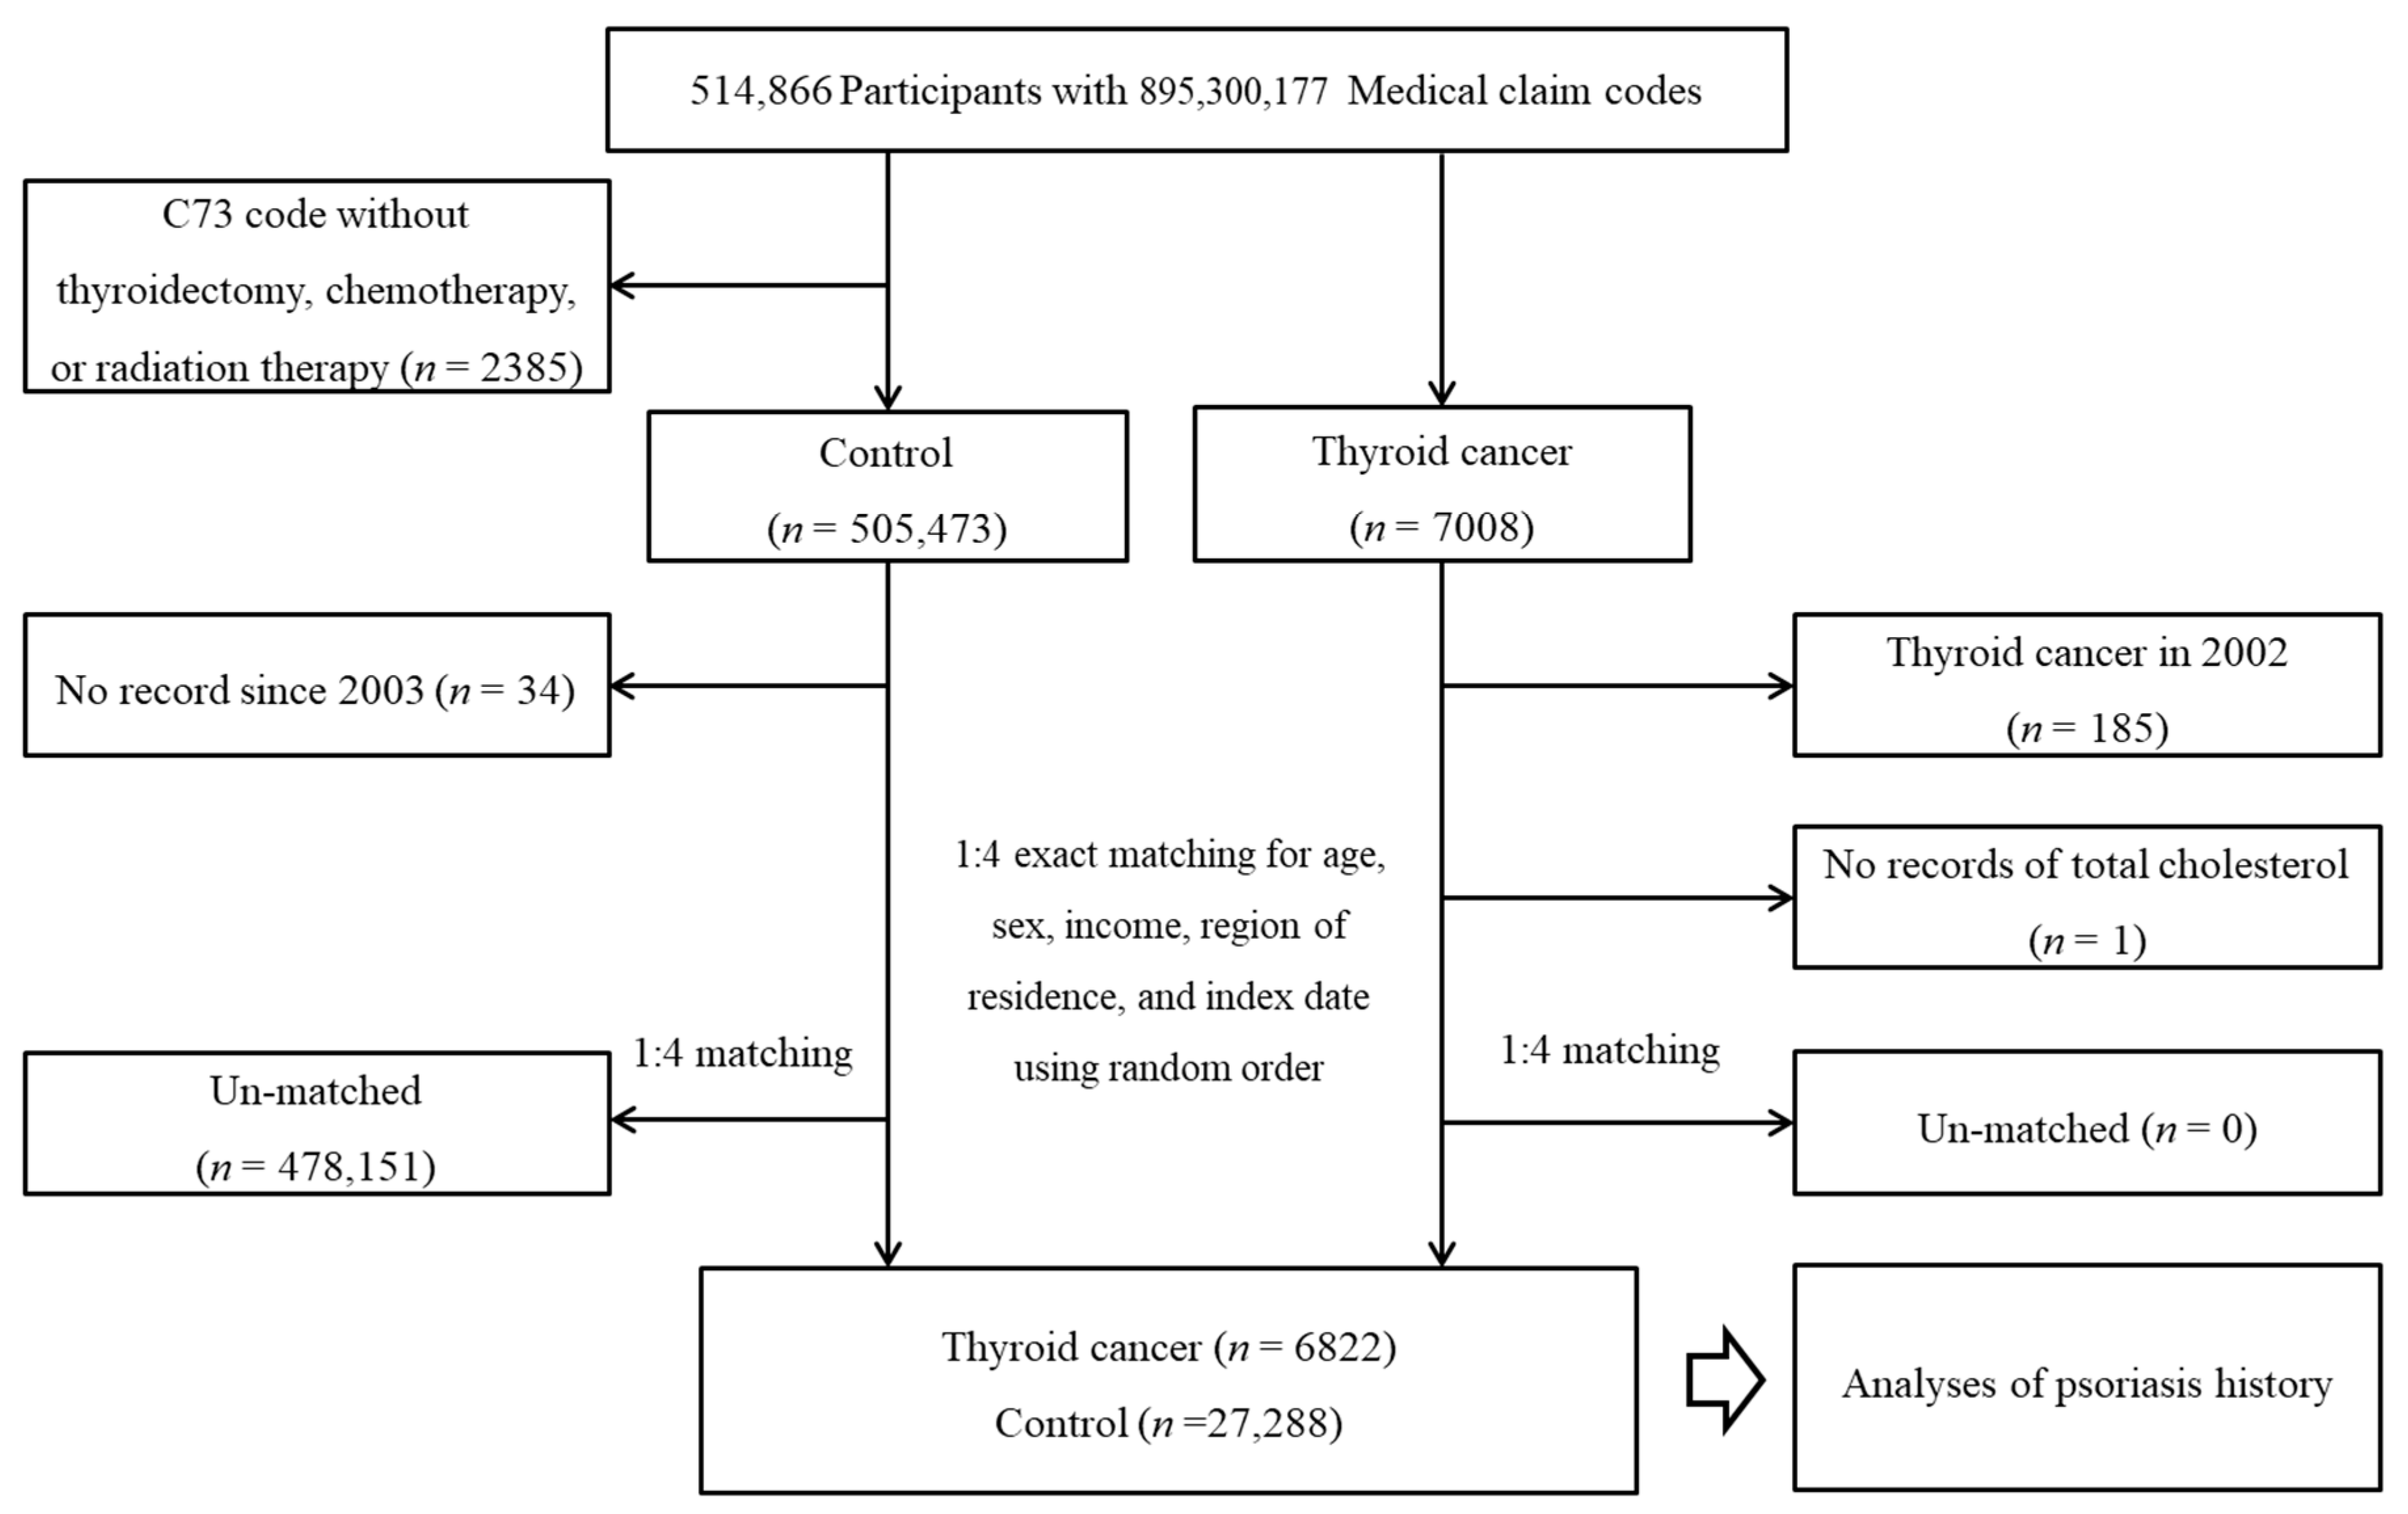
| Total participants (n = 34,110) | ||||||
| Control | 6730/6822 (98.7) | 26,924/27,288 (98.7) | 1 | 1 | ||
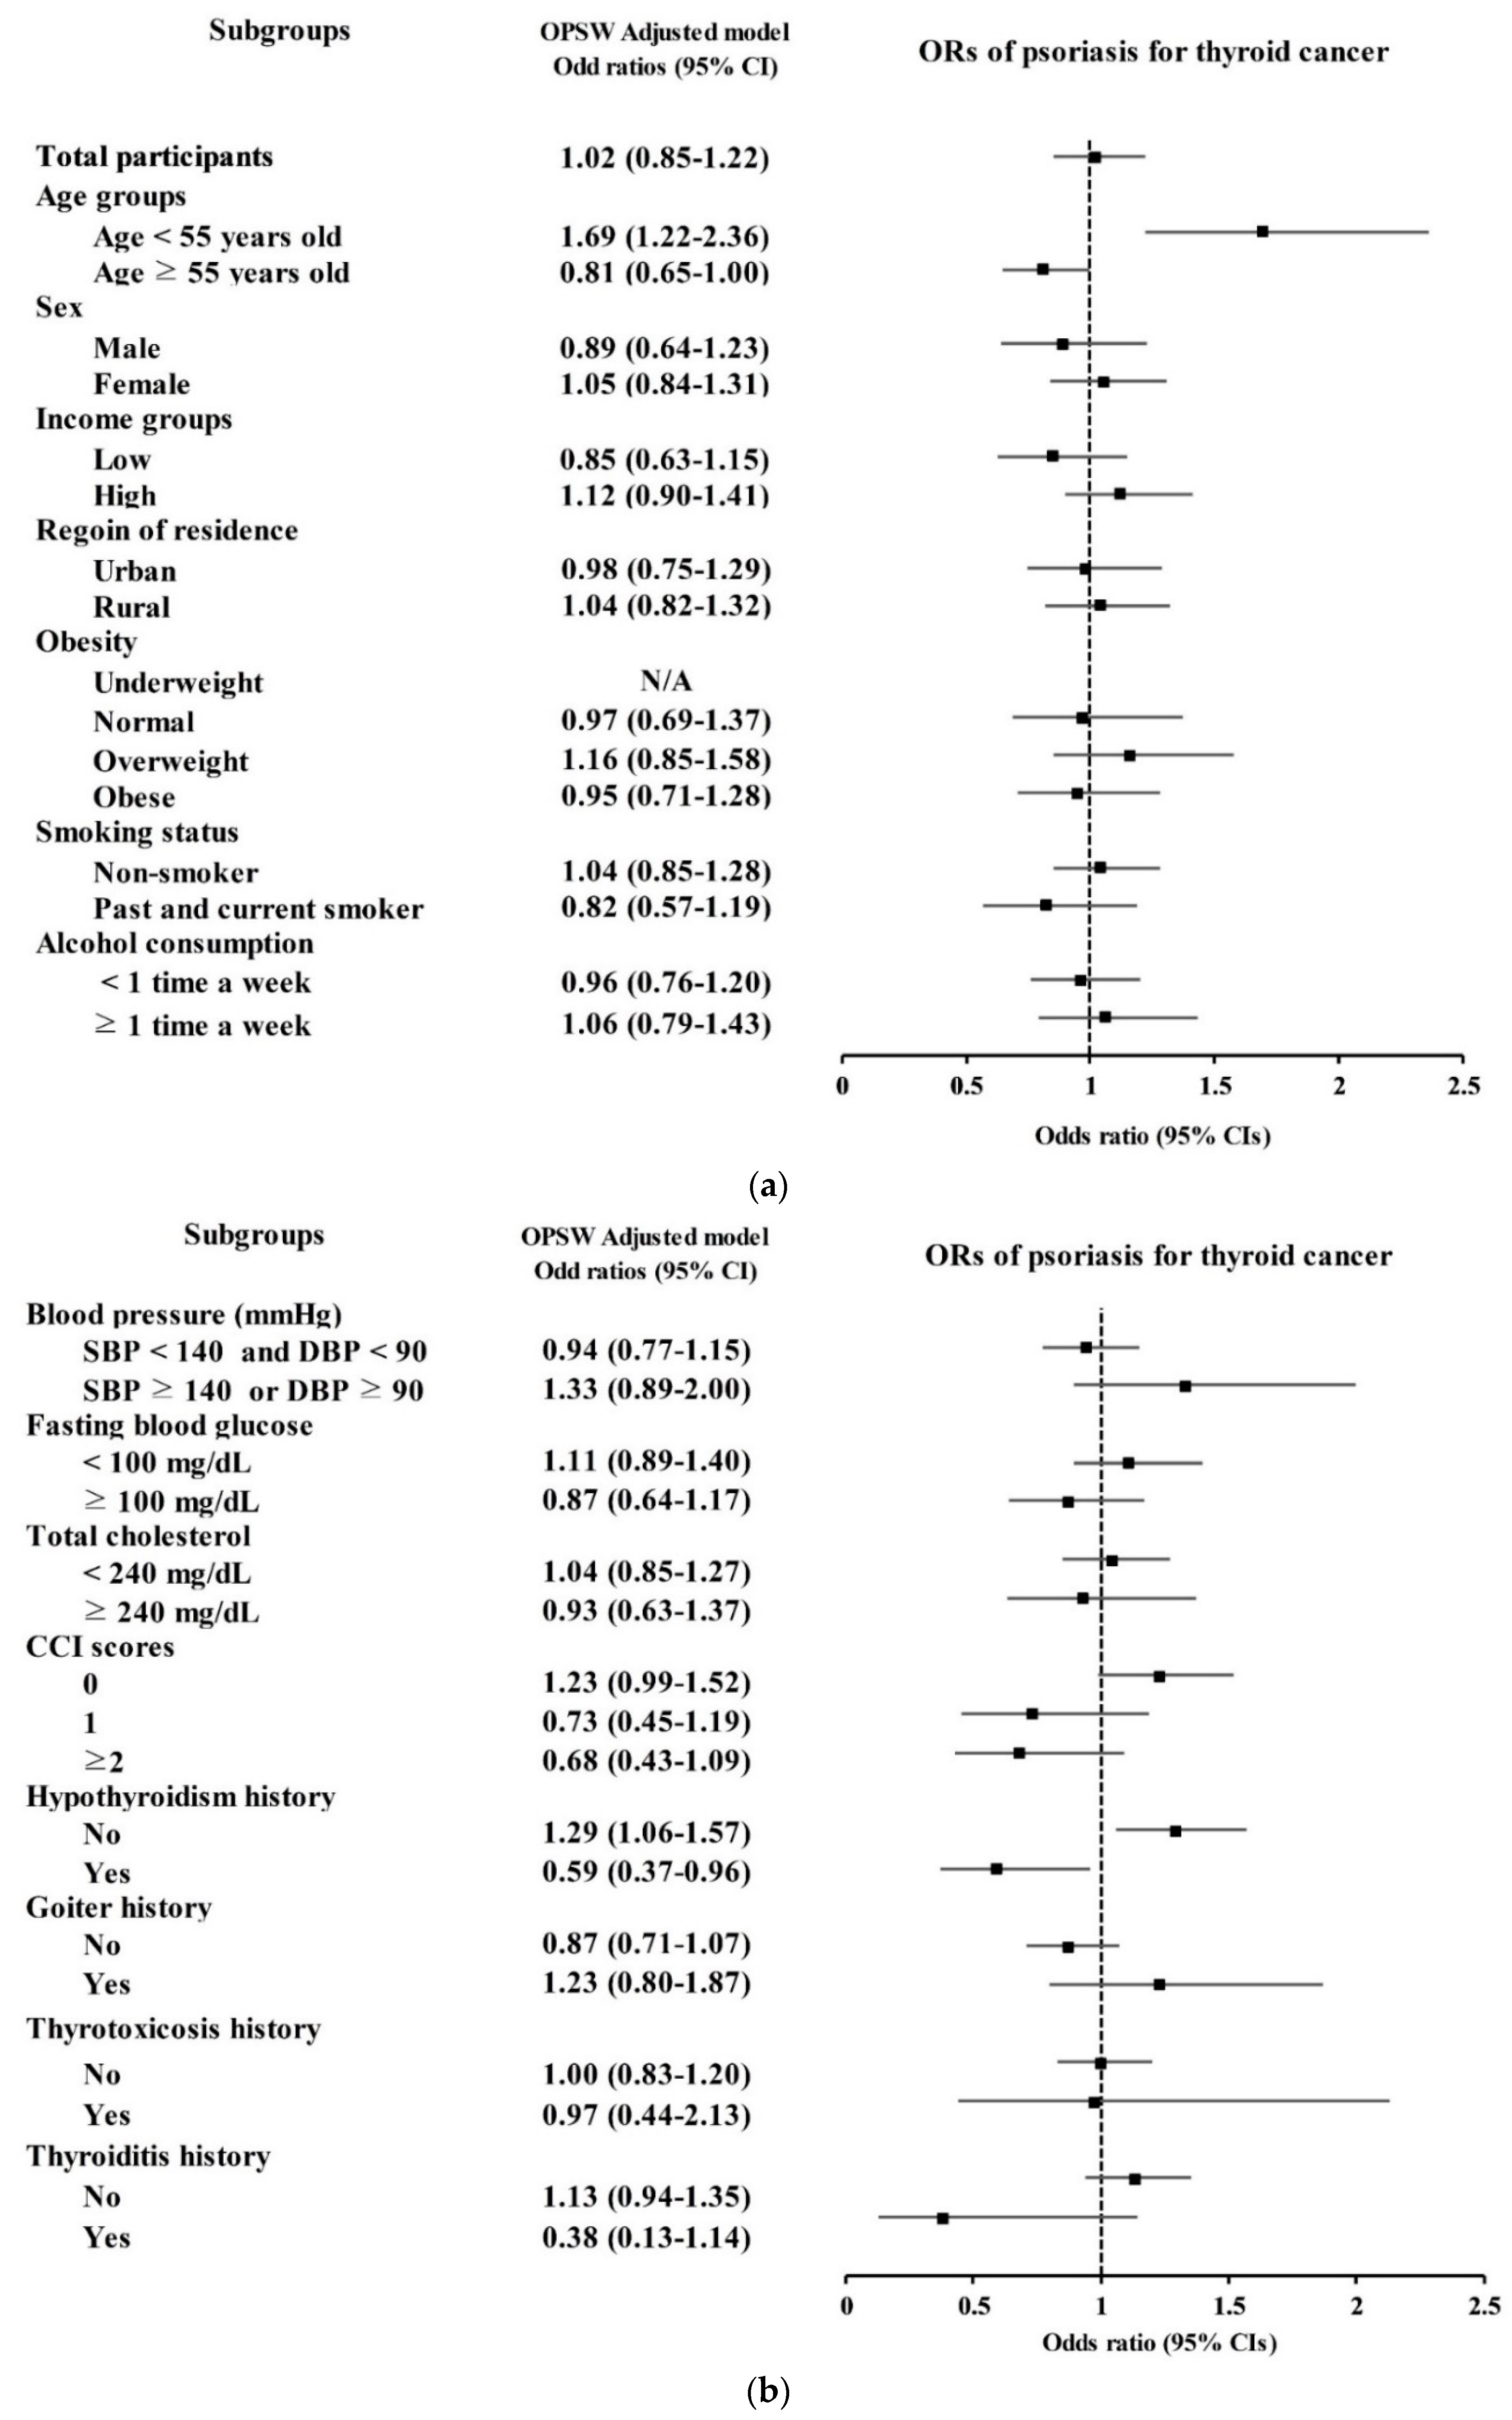
| Psoriasis | 92/6822 (1.3) | 364/27,288 (1.3) | 1.01 (0.80–1.27) | 0.925 | 1.02 (0.85–1.22) | 0.865 |
| Age < 55 years old (n = 12,940) | ||||||
| Control | 2552/2588 (98.6) | 10,250/10,352 (99.0) | 1 | 1 | ||
| Psoriasis | 36/2588 (1.4) | 102/10,352 (1.0) | 1.42 (0.97–2.08) | 0.073 | 1.69 (1.22–2.36) | 0.002 * |
| Age ≥ 55 years old (n = 21,170) | ||||||
| Control | 4178/4234 (98.7) | 16,674/16,936 (98.5) | 1 | 1 | ||
| Psoriasis | 56/4234 (1.3) | 262/16,936 (1.5) | 0.85 (0.64–1.14) | 0.284 | 0.81 (0.65–1.00) | 0.054 |
| Male (n = 7565) | ||||||
| Control | 1482/1513 (98.0) | 5925/6052 (97.9) | 1 | 1 | ||
| Psoriasis | 31/1513 (2.0) | 127/6052 (2.1) | 0.98 (0.66–1.45) | 0.905 | 0.89 (0.64–1.23) | 0.486 |
| Female (n = 26,545) | ||||||
| Control | 5248/5309 (98.9) | 20,999/21,236 (98.9) | 1 | 1 | ||
| Psoriasis | 61/5309 (1.1) | 237/21,236 (1.1) | 1.03 (0.78–1.37) | 0.837 | 1.05 (0.84–1.31) | 0.653 |
| Low-income group (n = 13,475) | ||||||
| Control | 2663/2695 (98.8) | 10,626/10,780 (98.6) | 1 | 1 | ||
| Psoriasis | 32/2695 (1.2) | 154/10,780 (1.4) | 0.83 (0.57–1.22) | 0.338 | 0.85 (0.63–1.15) | 0.286 |
| High-income group (n = 20,635) | ||||||
| Control | 4067/4127 (98.5) | 16,298/16,508 (98.7) | 1 | 1 | ||
| Psoriasis | 60/4127 (1.5) | 210/16,508 (1.3) | 1.14 (0.86–1.53) | 0.358 | 1.12 (0.90–1.41) | 0.318 |
| Urban resident (n = 16,105) | ||||||
| Control | 3182/3221 (98.8) | 12,717/12,884 (98.7) | 1 | 1 | ||
| Psoriasis | 39/3221 (1.2) | 167/12,884 (1.3) | 0.93 (0.66–1.33) | 0.705 | 0.98 (0.75–1.29) | 0.892 |
| Rural resident (n = 18,005) | ||||||
| Control | 3548/3601 (98.5) | 14,207/14,404 (98.6) | 1 | 1 | ||
| Psoriasis | 53/3601 (1.5) | 197/14,404 (1.4) | 1.08 (0.79–1.46) | 0.633 | 1.04 (0.82–1.32) | 0.737 |
| Characteristics | N of Thyroid Cancer | N of Control | Odd Ratios for Thyroid Cancer (95% Confidence Interval) | |||
|---|---|---|---|---|---|---|
| (Exposure/Total, %) | (Exposure/Total, %) | Crude † | p Value | Overlap Weighted Model † | p Value | |
| Obesity | ||||||
| Underweight (n = 764) | 0/186 (0.0) | 8/578 (1.4) | N/A | N/A | ||
| Normal (n = 12,317) | 23/2210 (1.0) | 112/10,107 (1.1) | 0.94 (0.60–1.48) | 0.787 | 0.97 (0.69–1.37) | 0.883 |
| Overweight (n = 9389) | 33/1936 (1.7) | 104/7453 (1.4) | 1.23 (0.83–1.82) | 0.313 | 1.16 (0.85–1.58) | 0.353 |
| Obese (n = 11,733) | 36/2583 (1.4) | 140/9150 (1.5) | 0.91 (0.63–1.32) | 0.615 | 0.95 (0.71–1.28) | 0.745 |
| Smoking status | ||||||
| Nonsmoker (n = 29,086) | 68/5904 (1.2) | 270/23,182 (1.2) | 0.99 (0.76–1.29) | 0.934 | 1.04 (0.85–1.28) | 0.692 |
| Past and current smoker (n = 5024) | 24/918 (2.6) | 94/4106 (2.3) | 1.15 (0.73–1.80) | 0.557 | 0.82 (0.57–1.19) | 0.303 |
| Alcohol consumption | ||||||
| <1 time a week (n = 25,334) | 55/5158 (1.1) | 241/20,176 (1.2) | 0.89 (0.66–1.20) | 0.445 | 0.96 (0.76–1.20) | 0.696 |
| ≥1 time a week (n = 8776) | 37/1664 (2.2) | 123/7112 (1.7) | 1.29 (0.89–1.87) | 0.176 | 1.06 (0.79–1.43) | 0.690 |
| Blood pressure (mmHg) | ||||||
| SBP < 140 and DBP < 90 (n = 27,315) | 70/5455 (1.3) | 292/21,860 (1.3) | 0.96 (0.74–1.25) | 0.764 | 0.94 (0.77–1.15) | 0.56 |
| SBP ≥ 140 or DBP ≥ 90 (n = 6795) | 22/1367 (1.6) | 72/5428 (1.3) | 1.22 (0.75–1.97) | 0.424 | 1.33 (0.89–2.00) | 0.166 |
| Fasting blood glucose (mg/dL) | ||||||
| <100 (n = 22,864) | 62/4591 (1.4) | 233/18,273 (1.3) | 1.06 (0.80–1.41) | 0.681 | 1.11 (0.89–1.40) | 0.347 |
| ≥100 (n = 11,246) | 30/2231 (1.3) | 131/9015 (1.5) | 0.92 (0.62–1.38) | 0.700 | 0.87 (0.64–1.17) | 0.360 |
| Total cholesterol (mg/dL) | ||||||
| <240 (n = 29,100) | 76/5898 (1.3) | 311/23,202 (1.3) | 0.96 (0.75–1.24) | 0.759 | 1.04 (0.85–1.27) | 0.722 |
| ≥240 (n = 5010) | 16/924 (1.7) | 53/4086 (1.3) | 1.34 (0.76–2.36) | 0.307 | 0.93 (0.63–1.37) | 0.703 |
| CCI scores | ||||||
| 0 (n = 22,996) | 56/3760 (1.5) | 245/19,236 (1.3) | 1.17 (0.87–1.57) | 0.288 | 1.23 (0.99–1.52) | 0.063 |
| 1 (n = 5413) | 14/1234 (1.1) | 63/4179 (1.5) | 0.75 (0.42–1.34) | 0.333 | 0.73 (0.45–1.19) | 0.208 |
| ≥2 (n = 5701) | 22/1828 (1.2) | 56/3873 (1.4) | 0.83 (0.51–1.36) | 0.463 | 0.68 (0.43–1.09) | 0.111 |
| Hypothyroidism history | ||||||
| No (n = 28,008) | 53/3009 (1.8) | 327/24,999 (1.3) | 1.35 (1.01–1.81) | 0.043 * | 1.29 (1.06–1.57) | 0.012 * |
| Yes (n = 6102) | 39/3813 (1.0) | 37/2289 (1.6) | 0.63 (0.40–0.99) | 0.045 * | 0.59 (0.37–0.96) | 0.034 * |
| Goiter history | ||||||
| No (n = 27,216) | 37/2990 (1.2) | 330/24,226 (1.4) | 0.91 (0.64–1.28) | 0.577 | 0.87 (0.71–1.07) | 0.181 |
| Yes (n = 6894) | 55/3832 (1.4) | 34/3062 (1.1) | 1.30 (0.84–1.99) | 0.236 | 1.23 (0.80–1.87) | 0.340 |
| Thyrotoxicosis history | ||||||
| No (n = 32,119) | 84/6125 (1.4) | 347/25,994 (1.3) | 1.03 (0.81–1.31) | 0.822 | 1.00 (0.83–1.20) | 0.994 |
| Yes (n = 1991) | 8/697 (1.1) | 17/1294 (1.3) | 0.87 (0.37–2.03) | 0.751 | 0.97 (0.44–2.13) | 0.944 |
| Thyroiditis history | ||||||
| No (n = 32,261) | 86/6203 (1.4) | 345/26,058 (1.3) | 1.05 (0.83–1.33) | 0.696 | 1.13 (0.94–1.35) | 0.205 |
| Yes (n = 1849) | 6/619 (1.0) | 19/1230 (1.5) | 0.62 (0.25–1.57) | 0.317 | 0.38 (0.13–1.14) | 0.085 |
Publisher’s Note: MDPI stays neutral with regard to jurisdictional claims in published maps and institutional affiliations. |
© 2022 by the authors. Licensee MDPI, Basel, Switzerland. This article is an open access article distributed under the terms and conditions of the Creative Commons Attribution (CC BY) license (https://creativecommons.org/licenses/by/4.0/).
Share and Cite
Kim, S.Y.; Yoo, D.M.; Chung, J.; Choi, H.G. Thyroid Cancer and Psoriasis: A Nested Case–Control Study. Diagnostics 2022, 12, 2297. https://doi.org/10.3390/diagnostics12102297
Kim SY, Yoo DM, Chung J, Choi HG. Thyroid Cancer and Psoriasis: A Nested Case–Control Study. Diagnostics. 2022; 12(10):2297. https://doi.org/10.3390/diagnostics12102297
Chicago/Turabian StyleKim, So Young, Dae Myoung Yoo, Juyong Chung, and Hyo Geun Choi. 2022. "Thyroid Cancer and Psoriasis: A Nested Case–Control Study" Diagnostics 12, no. 10: 2297. https://doi.org/10.3390/diagnostics12102297
APA StyleKim, S. Y., Yoo, D. M., Chung, J., & Choi, H. G. (2022). Thyroid Cancer and Psoriasis: A Nested Case–Control Study. Diagnostics, 12(10), 2297. https://doi.org/10.3390/diagnostics12102297