
Noninvasive Diagnosis of Hepatocellular Carcinoma on Sonazoid-Enhanced US: Value of the Kupffer Phase

 , ,
, , 
Abstract
:1. Introduction
2. Materials and Methods
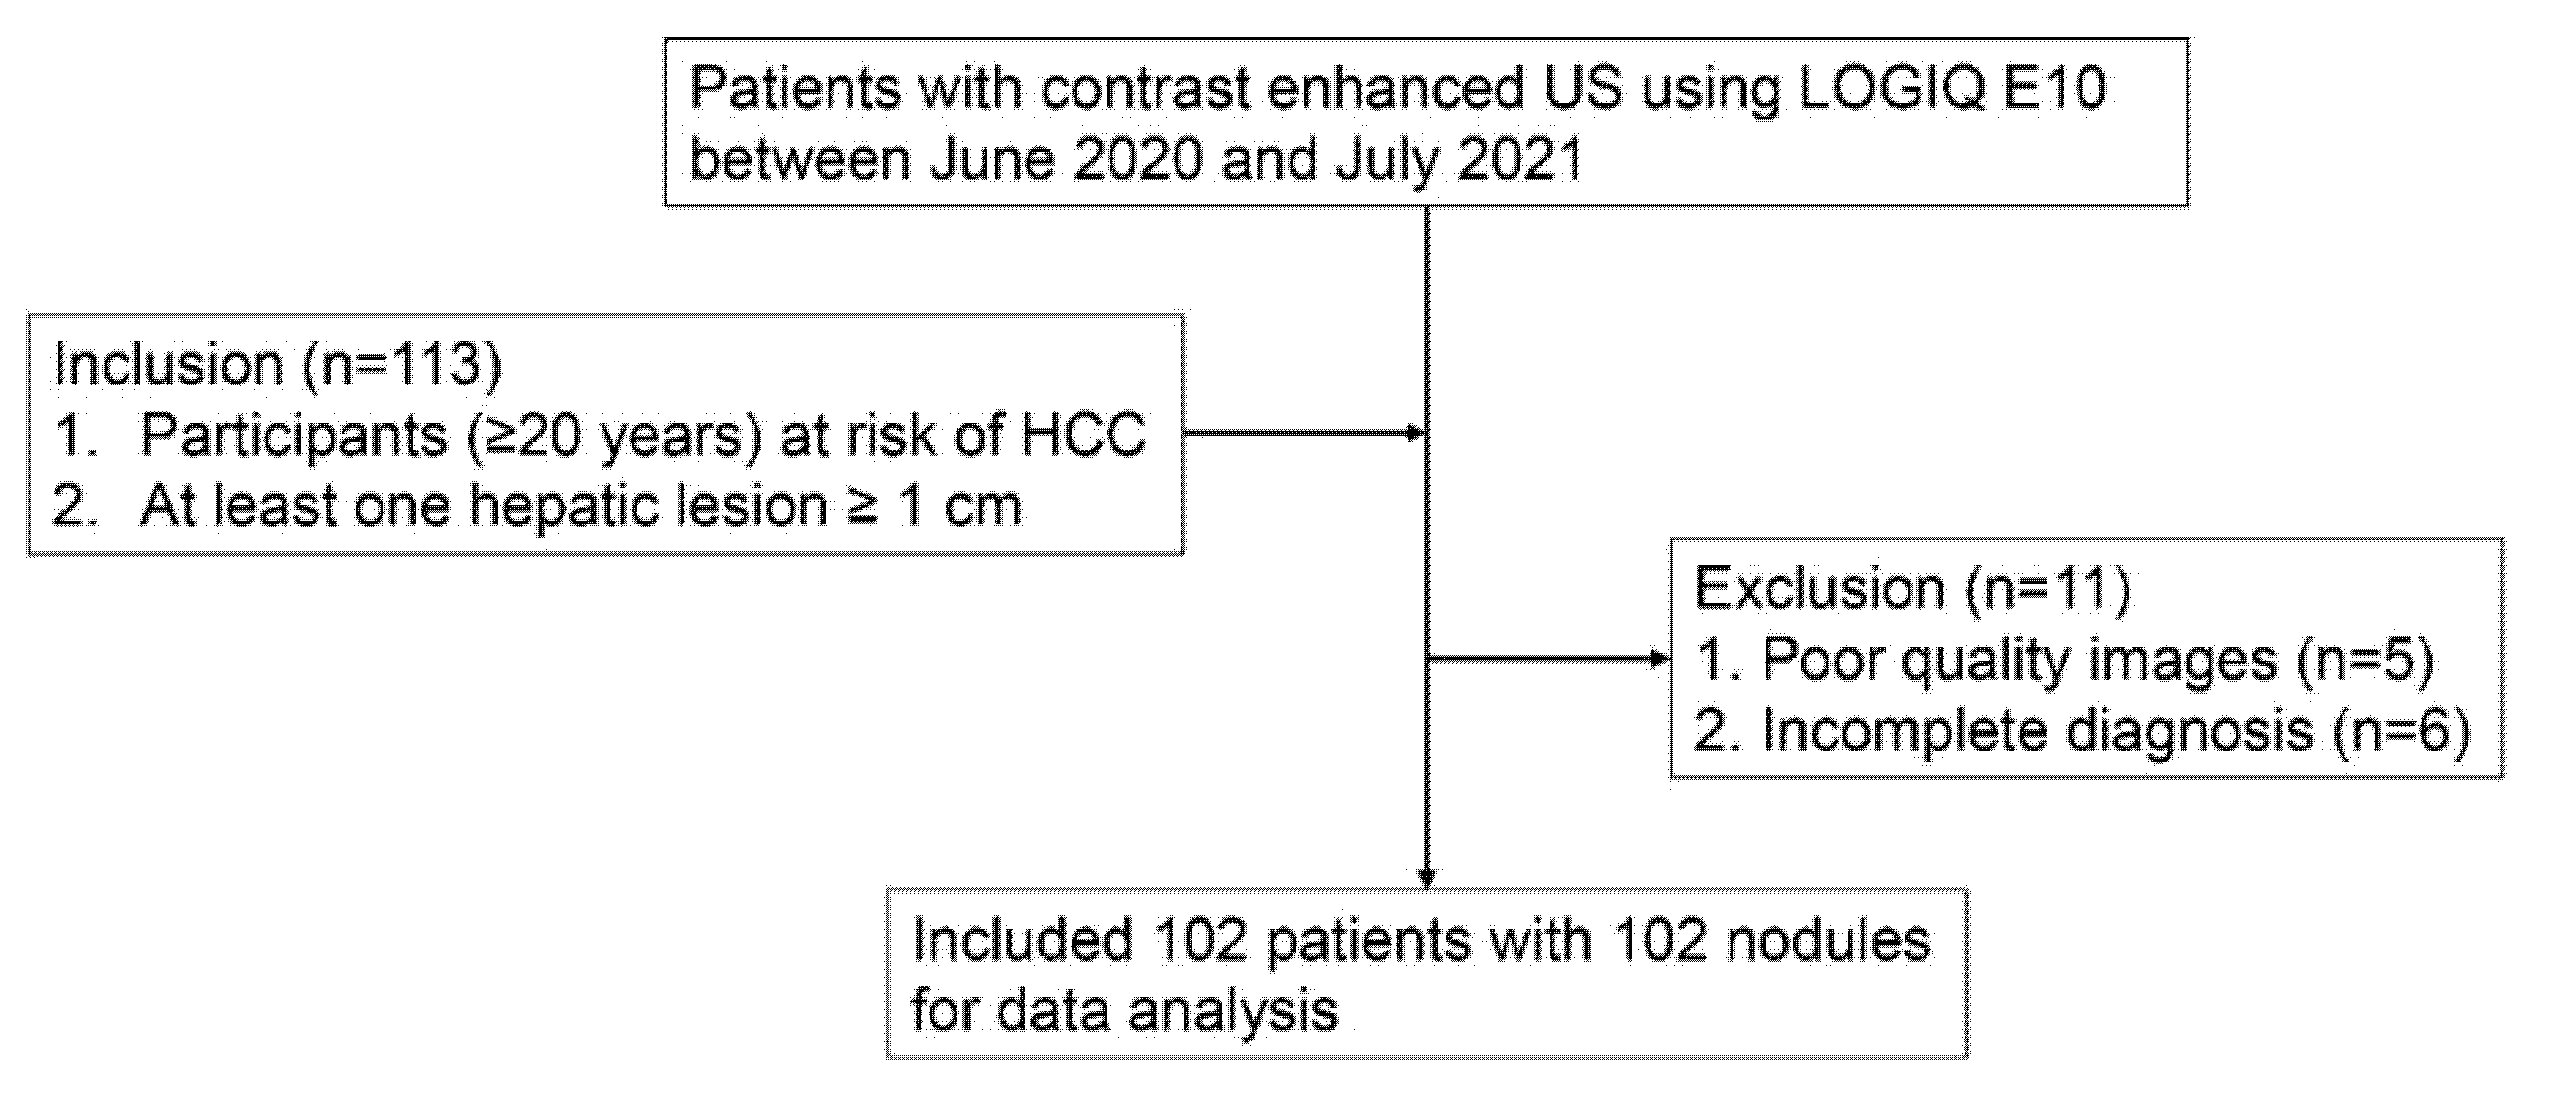
2.1. Patients
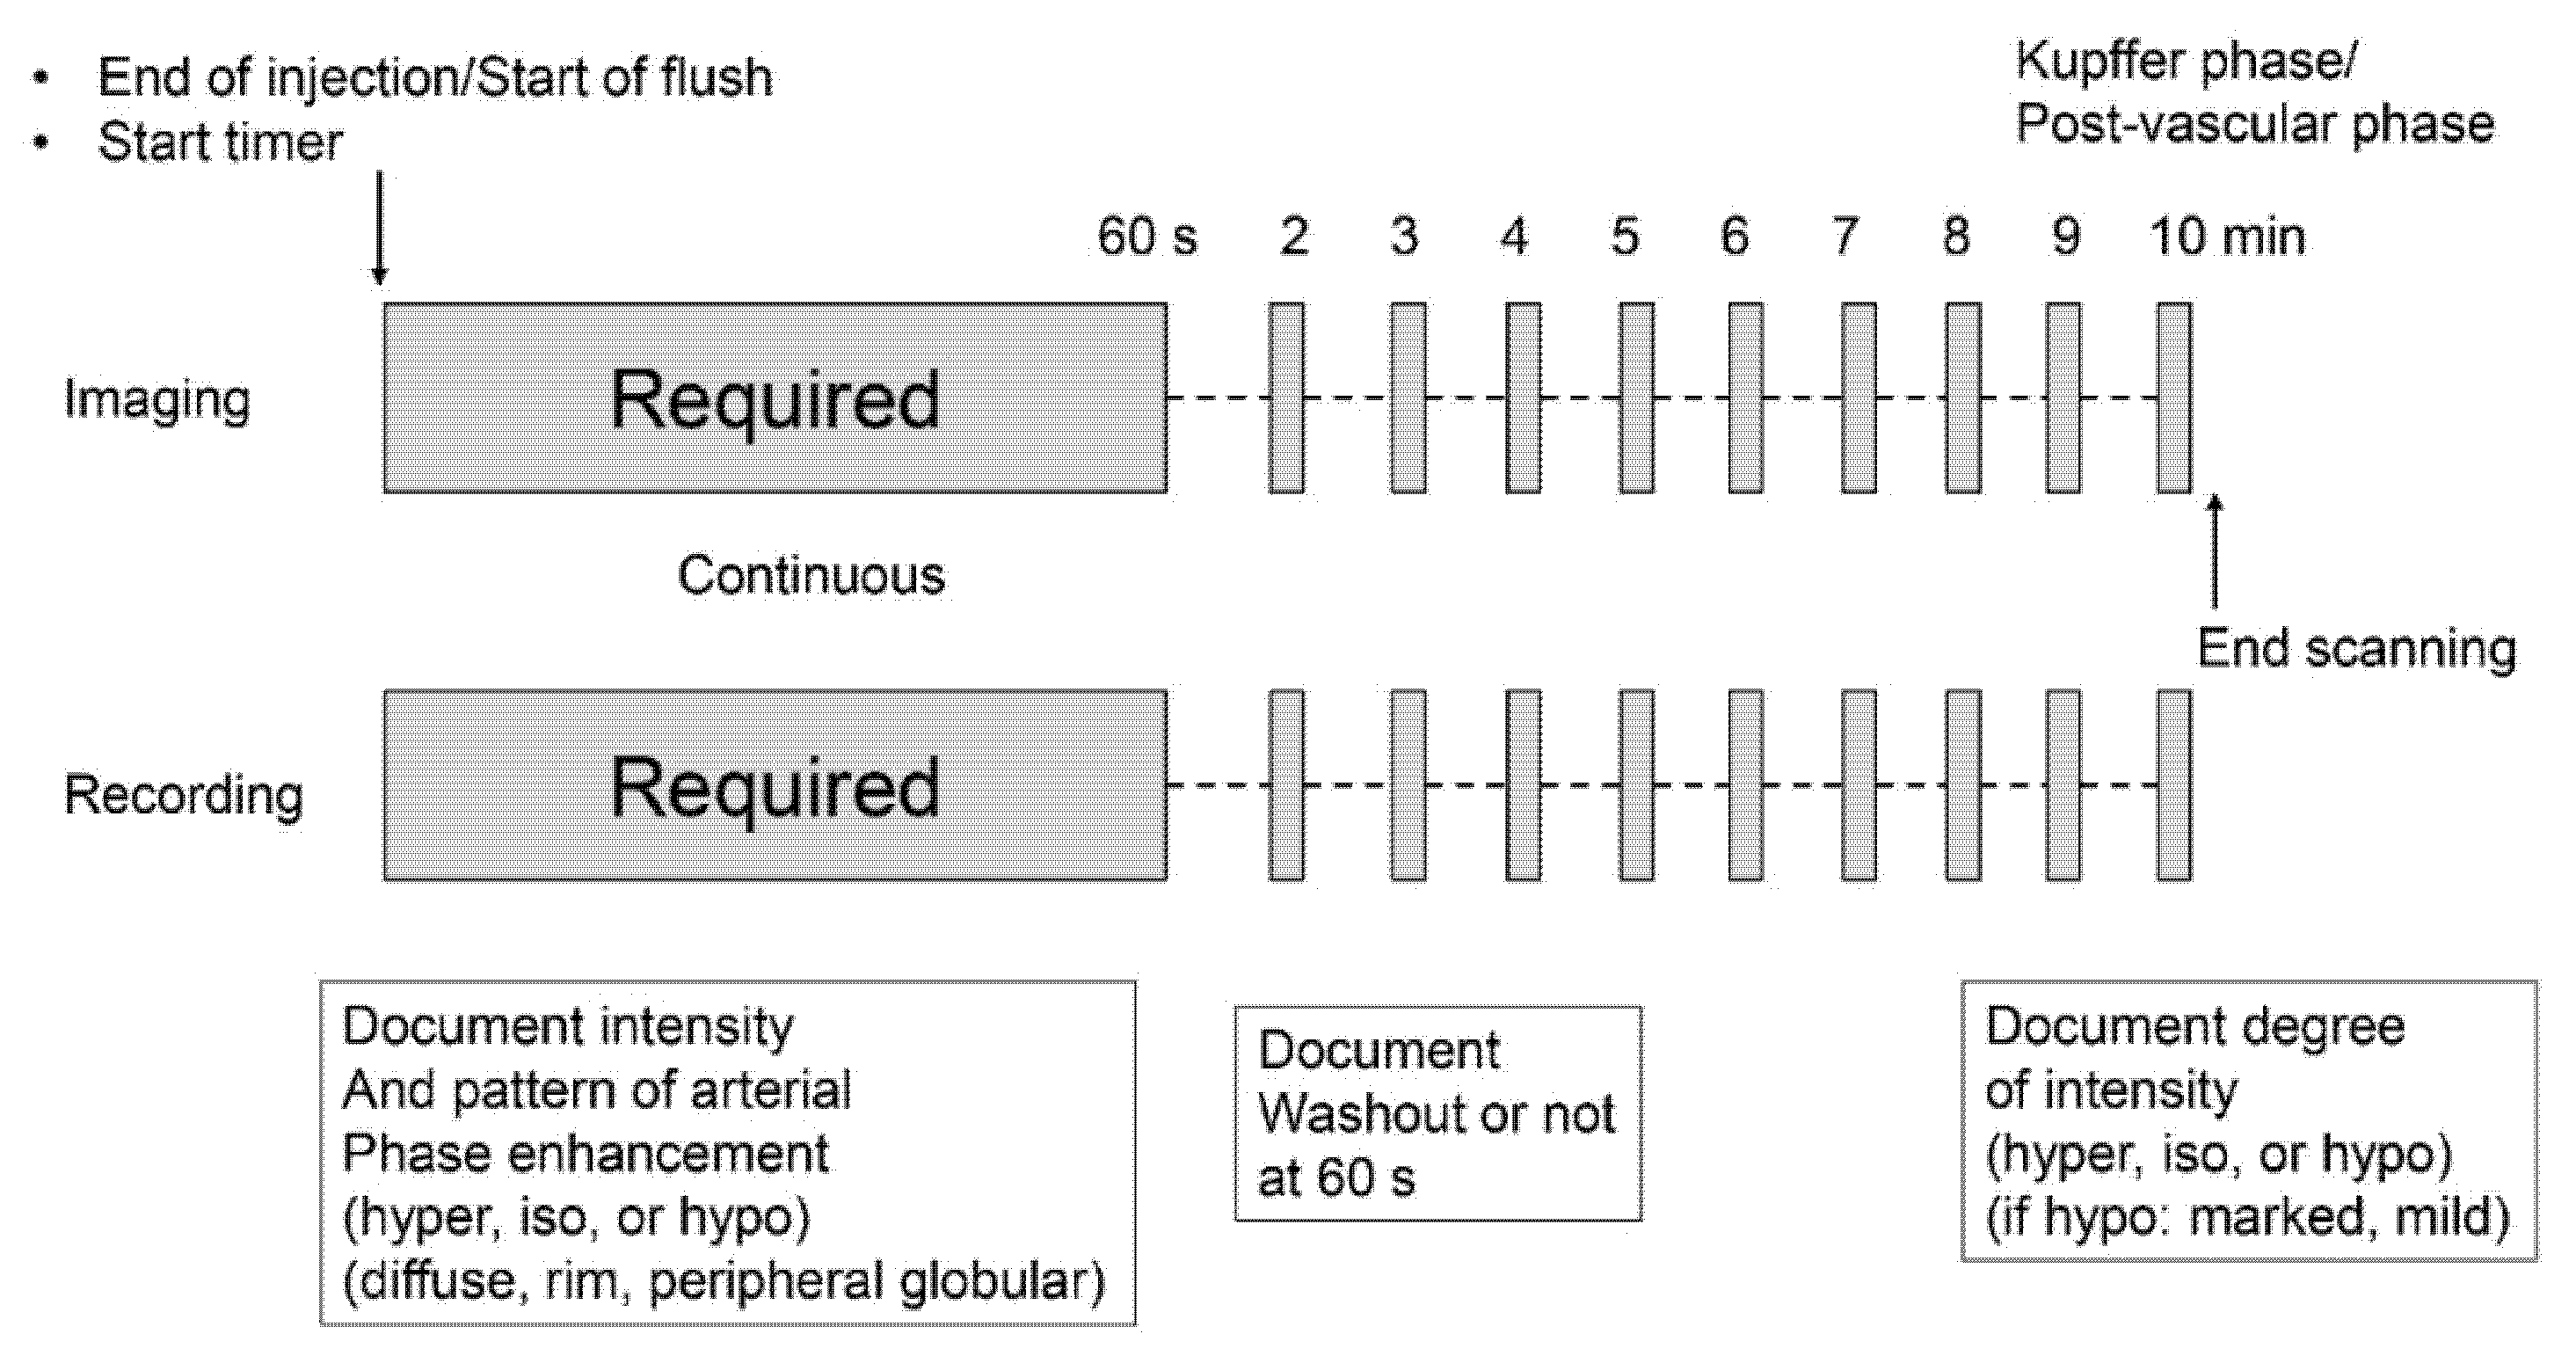
2.2. US Examination
2.3. Image Analysis
2.4. Reference Standard
2.5. Statistical Analysis
3. Results
3.1. Patients and Liver Nodule Characteristics
3.2. Major Imaging Features of Contrast-Enhanced US
3.2.1. Arterial Phase
3.2.2. Washout
3.3. Diagnostic Performance of Hepatocellular Carcinoma Diagnosis Based on Both CEUS LI-RADS and Modified CEUS LI-RADS Using Qualitative Washout Results
4. Discussion
Supplementary Materials
Author Contributions
Funding
Institutional Review Board Statement
Informed Consent Statement
Conflicts of Interest
References
- Chernyak, V.; Fowler, K.J.; Kamaya, A.; Kielar, A.Z.; Elsayes, K.M.; Bashir, M.R.; Kono, Y.; Do, R.K.; Mitchell, D.G.; Singal, A.G.; et al. T Liver Imaging Reporting and Data System (LI-RADS) Version 2018: Imaging of Hepatocellular Carcinoma in At-Risk Patients. Radiology 2018, 289, 816–830. [Google Scholar] [CrossRef] [PubMed]
- Schellhaas, B.; Bernatik, T.; Bohle, W.; Borowitzka, F.; Chang, J.; Dietrich, C.F.; Dirks, K.; Donoval, R.; Drube, K.; Friedrich-Rust, M.; et al. Contrast-Enhanced Ultrasound Algorithms (CEUS-LIRADS/ESCULAP) for the Noninvasive Diagnosis of Hepatocellular Carcinoma—A Prospective Multicenter DEGUM Study. Ultraschall Med. 2021, 42, 178–186. [Google Scholar] [PubMed]
- Lee, J.Y.; Minami, Y.; Choi, B.I.; Lee, W.J.; Chou, Y.H.; Jeong, W.K.; Park, M.S.; Kudo, N.; Lee, M.W.; Kamata, K.; et al. The AFSUMB Consensus Statements and Recommendations for the Clinical Practice of Contrast-Enhanced Ultrasound using Sonazoid. J. Med. Ultrasound 2020, 28, 59–82. [Google Scholar] [CrossRef] [PubMed] [Green Version]
- Kono, Y.; Lyshchik, A.; Cosgrove, D.; Dietrich, C.F.; Jang, H.J.; Kim, T.K.; Piscaglia, F.; Willmann, J.K.; Wilson, S.R.; Santillan, C.; et al. Contrast Enhanced Ultrasound (CEUS) Liver Imaging Reporting and Data System (LI-RADS®): The official version by the American College of Radiology (ACR). Ultraschall Med. 2017, 38, 85–86. [Google Scholar] [CrossRef] [PubMed] [Green Version]
- Terminology and Diagnostic Criteria Committee; Japan Society of Ultrasonics in Medicine. Ultrasound diagnostic criteria for hepatic tumors. J. Med. Ultrason. 2014, 41, 113–123. [Google Scholar] [CrossRef] [PubMed]
- Sugimoto, K.; Kakegawa, T.; Takahashi, H.; Tomita, Y.; Abe, M.; Yoshimasu, Y.; Takeuchi, H.; Kasai, Y.; Itoi, T. Usefulness of Modified CEUS LI-RADS for the Diagnosis of Hepatocellular Carcinoma Using Sonazoid. Diagnostics 2020, 10, 828. [Google Scholar] [CrossRef] [PubMed]
- Moriyasu, F.; Itoh, K. Efficacy of perflubutane microbubble-enhanced ultrasound in the characterization and detection of focal liver lesions: Phase 3 multicenter clinical trial. AJR Am. J. Roentgenol. 2009, 193, 86–95. [Google Scholar] [CrossRef] [PubMed]
- Barr, R.G.; Wilson, S.R.; Rubens, D.; Garcia-Tsao, G.; Ferraioli, G. Update to the Society of Radiologists in Ultrasound Liver Elastography Consensus Statement. Radiology 2020, 296, 263–274. [Google Scholar] [CrossRef] [PubMed]
- Joo, I.; Lee, J.M.; Lee, D.H.; Jeon, J.H.; Han, J.K.; Choi, B.I. Noninvasive diagnosis of hepatocellular carcinoma on gadoxetic acid-enhanced MRI: Can hypointensity on the hepatobiliary phase be used as an alternative to washout? Eur. Radiol. 2015, 25, 2859–2868. [Google Scholar] [CrossRef] [PubMed]
- Numata, K.; Fukuda, H.; Miwa, H.; Ishii, T.; Moriya, S.; Kondo, M.; Nozaki, A.; Morimoto, M.; Okada, M.; Takebayashi, S.; et al. Contrast-enhanced ultrasonography findings using a perflubutane-based contrast agent in patients with early hepatocellular carcinoma. Eur. J. Radiol. 2014, 83, 95–102. [Google Scholar] [CrossRef] [PubMed]
- Numata, K.; Luo, W.; Morimoto, M.; Kondo, M.; Kunishi, Y.; Sasaki, T.; Nozaki, A.; Tanaka, K. Contrast enhanced ultrasound of hepatocellular carcinoma. World J. Radiol. 2010, 2, 68–82. [Google Scholar] [CrossRef] [PubMed]
- Sugimoto, K.; Moriyasu, F.; Saito, K.; Taira, J.; Saguchi, T.; Yoshimura, N.; Oshiro, H.; Imai, Y.; Shiraishi, J. Comparison of Kupffer-phase Sonazoid-enhanced sonography and hepatobiliary-phase gadoxetic acid-enhanced magnetic resonance imaging of hepatocellular carcinoma and correlation with histologic grading. J. Ultrasound Med. 2012, 31, 529–538. [Google Scholar] [CrossRef] [PubMed]
- Jang, H.J.; Kim, T.K.; Burns, P.N.; Wilson, S.R. Enhancement patterns of hepatocellular carcinoma at contrast-enhanced US: Comparison with histologic differentiation. Radiology 2007, 244, 898–906. [Google Scholar] [CrossRef] [PubMed]
- Shen, J.; Liu, J.; Li, C.; Wen, T.; Yan, L.; Yang, J. The Impact of Tumor Differentiation on the Prognosis of HBV-Associated Solitary Hepatocellular Carcinoma Following Hepatectomy: A Propensity Score Matching Analysis. Dig. Dis. Sci. 2018, 63, 1962–1969. [Google Scholar] [CrossRef] [PubMed]
- Kang, H.J.; Lee, J.M.; Yoon, J.H.; Lee, K.; Kim, H.; Han, J.K. Contrast-enhanced US with Sulfur Hexafluoride and Perfluorobutane for the Diagnosis of Hepatocellular Carcinoma in Individuals with High Risk. Radiology 2020, 297, 108–116. [Google Scholar] [CrossRef] [PubMed]


| Characteristic | Result |
|---|---|
| Median age (year) * | 71 (63–78) |
| Sex | |
| Male | 64 (62.7) |
| Female | 38 (37.3) |
| Median nodule size (mm) * | 25.5 (16.8–44.3) |
| Liver disease etiology | |
| Alcohol | 41 (40.2) |
| HBV | 30 (29.4) |
| HCV | 18 (17.6) |
| NASH | 13 (12.7) |
| Presence of cirrhosis | 81 (79.4) |
| Histopathologic analysis | 80 (78.4) |
| HCC | 37 (36.3) |
| Well-differentiated | 9 (24.3) |
| Moderately differentiated | 23 (62.2) |
| Poorly differentiated | 5 (13.5) |
| Metastasis | 26 (25.5) |
| ICC | 10 (9.8) |
| FNH | 5 (4.9) |
| Dysplastic nodule | 1 (1.0) |
| AML | 1 (1.0) |
| No histopathologic analysis | 22 (21.6) |
| Contrast-enhanced CT or MRI | |
| HCC | 15 (14.7) |
| Hemangioma | 7 (6.9) |
| Characteristic | Result |
|---|---|
| Median age (year) * | 69 (61–74) |
| Sex | |
| Male | 15 (57.7) |
| Female | 11 (42.3) |
| Median nodule size (mm) * | 24.0 (14.8–65.8) |
| Liver disease etiology | |
| Alcohol | 17 (65.4) |
| HBV | 8 (30.8) |
| NASH | 1 (3.8) |
| HCV | 0 (0) |
| Presence of cirrhosis | 18 (69.2) |
| Origin or histopathologic types of the metastases | |
| Breast | 5 (19.5) |
| Pancreatic neuroendocrine tumor | 4 (15.4) |
| Stomach | 4 (15.4) |
| Diffuse large B-cell lymphoma | 3 (11.5) |
| Malignant melanoma | 2 (7.7) |
| Pancreas | 2 (7.7) |
| Adenoid cystic carcinoma | 1 (3.8) |
| Colon | 1 (3.8) |
| Ovary | 1 (3.8) |
| Kidney | 1 (3.8) |
| Sebaceous carcinoma of the eyelid | 1 (3.8) |
| Unknown | 1 (3.8) |
| No histopathologic analysis | 0 (0) |
| Characteristics of Arterial Phase | HCC (n = 52) | Non-HCC Malignancy | Benign Lesions | |||||
|---|---|---|---|---|---|---|---|---|
| Metastasis (n = 24) | ICC (n = 10) | Lymphoma (n = 2) | Hemangioma (n = 7) | FNH (n = 5) | DN (n = 1) | AML (n = 1) | ||
| Intensity | ||||||||
| Hyperenhancement | 48 | 13 | 2 | 0 | 3 | 5 | 0 | 1 |
| Isoenhancement | 4 | 9 | 4 | 2 | 0 | 0 | 1 | 0 |
| Hypoenhancement | 0 | 2 | 4 | 0 | 4 | 0 | 0 | 0 |
| Pattern | ||||||||
| Diffuse | 52 | 20 | 7 | 2 | 2 | 5 | 1 | 1 |
| Rim | 0 | 4 | 3 | 0 | 0 | 0 | 0 | 0 |
| Peripheral nodular | 0 | 0 | 0 | 0 | 5 | 0 | 0 | 0 |
| No. of Washout and Its Ratio According to Time | |||||||||||
|---|---|---|---|---|---|---|---|---|---|---|---|
| Diagnosis | No. of Target Lesions | 1 min or Early Washout | 2 min | 3 min | 4 min | 5 min | 6 min | 7 min | 8 min | 9 min | 10 min or Kupffer Phase |
| Qualitative analysis | |||||||||||
| HCCs | 52 | 9 (17.3) | 20 (38.5) | 29 (55.8) | 32 (61.5) | 38 (73.1) | 40 (76.9) | 42 (80.8) | 44 (84.6) | 45 (86.5) | 47 (90.4) |
| Non-HCC malignancies | 36 | 33 (91.7) | 34 (94.4) | 35 (97.2) | 36 (100) | 36 (100) | 36 (100) | 36 (100) | 36 (100) | 36 (100) | 36 (100) |
| Benign lesions | 14 | 0 (0) | 3 (21.4) | 3 (21.4) | 3 (21.4) | 2 (14.3) | 3 (21.4) | 3 (21.4) | 2 (14.3) | 3 (21.4) | 2 (14.3) |
| Variable | CEUS LI-RADS | Modified CEUS LI-RADS | p Value |
|---|---|---|---|
| Sensitivity | 0.519 (0.376–0.660) | 0.673 (0.529–0.797) | 0.0047 |
| Specificity | 0.920 (0.808–0.978) | 0.920 (0.808–0.978) | n.s. |
| Accuracy | 0.716 (0.618–0.801) | 0.794 (0.703–0.868) | 0.0047 |
| Kupffer-Phase Enhancement | Hyperechoic | Hypoechoic | Isoechoic | Total |
|---|---|---|---|---|
| Hypo | 16 (30.8) | 28 (53.8) | 3 (5.8) | 47 (90.4) |
| Iso | 5 (9.6) | 0 (0) | 0 (0) | 5 (9.6) |
| Total | 21 (40.4) | 28 (53.8) | 3 (5.8) | 52 (100) |
| Kupffer-Phase Enhancement | Well-Differentiated HCC | Moderately Differentiated HCC | Poorly Differentiated HCC | Total |
|---|---|---|---|---|
| Hypo | 6 (16.2) | 22 (59.5) | 5 (13.5) | 33 (89.2) |
| Iso | 3 (8.1) | 1 (2.7) | 0 (0) | 4 (10.8) |
| Total | 9 (24.3) | 23 (62.2) | 5 (13.5) | 37 (100) |
| Early Washout | Well-Differentiated HCC | Moderately Differentiated HCC | Poorly Differentiated HCC | Total |
|---|---|---|---|---|
| Yes | 0 (0) | 3 (8.1) | 5 (13.5) | 8 (21.6) |
| No | 9 (24.3) | 20 (54.1) | 0 (0) | 29 (78.4) |
| Total | 9 (24.3) | 23 (62.2) | 5 (13.5) | 37 (100) |
Publisher’s Note: MDPI stays neutral with regard to jurisdictional claims in published maps and institutional affiliations. |
© 2022 by the authors. Licensee MDPI, Basel, Switzerland. This article is an open access article distributed under the terms and conditions of the Creative Commons Attribution (CC BY) license (https://creativecommons.org/licenses/by/4.0/).
Share and Cite
Takahashi, H.; Sugimoto, K.; Kamiyama, N.; Sakamaki, K.; Kakegawa, T.; Wada, T.; Tomita, Y.; Abe, M.; Yoshimasu, Y.; Takeuchi, H.; et al. Noninvasive Diagnosis of Hepatocellular Carcinoma on Sonazoid-Enhanced US: Value of the Kupffer Phase. Diagnostics 2022, 12, 141. https://doi.org/10.3390/diagnostics12010141
Takahashi H, Sugimoto K, Kamiyama N, Sakamaki K, Kakegawa T, Wada T, Tomita Y, Abe M, Yoshimasu Y, Takeuchi H, et al. Noninvasive Diagnosis of Hepatocellular Carcinoma on Sonazoid-Enhanced US: Value of the Kupffer Phase. Diagnostics. 2022; 12(1):141. https://doi.org/10.3390/diagnostics12010141
Chicago/Turabian StyleTakahashi, Hiroshi, Katsutoshi Sugimoto, Naohisa Kamiyama, Kentaro Sakamaki, Tatsuya Kakegawa, Takuya Wada, Yusuke Tomita, Masakazu Abe, Yu Yoshimasu, Hirohito Takeuchi, and et al. 2022. "Noninvasive Diagnosis of Hepatocellular Carcinoma on Sonazoid-Enhanced US: Value of the Kupffer Phase" Diagnostics 12, no. 1: 141. https://doi.org/10.3390/diagnostics12010141
APA StyleTakahashi, H., Sugimoto, K., Kamiyama, N., Sakamaki, K., Kakegawa, T., Wada, T., Tomita, Y., Abe, M., Yoshimasu, Y., Takeuchi, H., & Itoi, T. (2022). Noninvasive Diagnosis of Hepatocellular Carcinoma on Sonazoid-Enhanced US: Value of the Kupffer Phase. Diagnostics, 12(1), 141. https://doi.org/10.3390/diagnostics12010141