
Experimental Diagnostics of the Emotional State of Individuals Using External Stimuli and a Model of Neurocognitive Brain Activity


Abstract
:1. Introduction
- (1)
- experienced and/or perceived feeling (state)-the phenomenology of emotions;
- (2)
- visceral processes accompanying emotions;
- (3)
- expressive characteristics of emotions (facial expression, intonation, gestures, and postures).
2. Experimental Approaches to Diagnosing Emotions
- Analysis of brain activity (EEG, brain mapping);
- Analysis of vegetative and somatic signs of emotional states (electromyography of the face-stimulation of facial muscles, electrical activity of the skin, body temperature, pupil dilation, eye-tracking-analysis of oculomotor movement, blinking on startle, posterior reflex, analysis of heart rate variability).
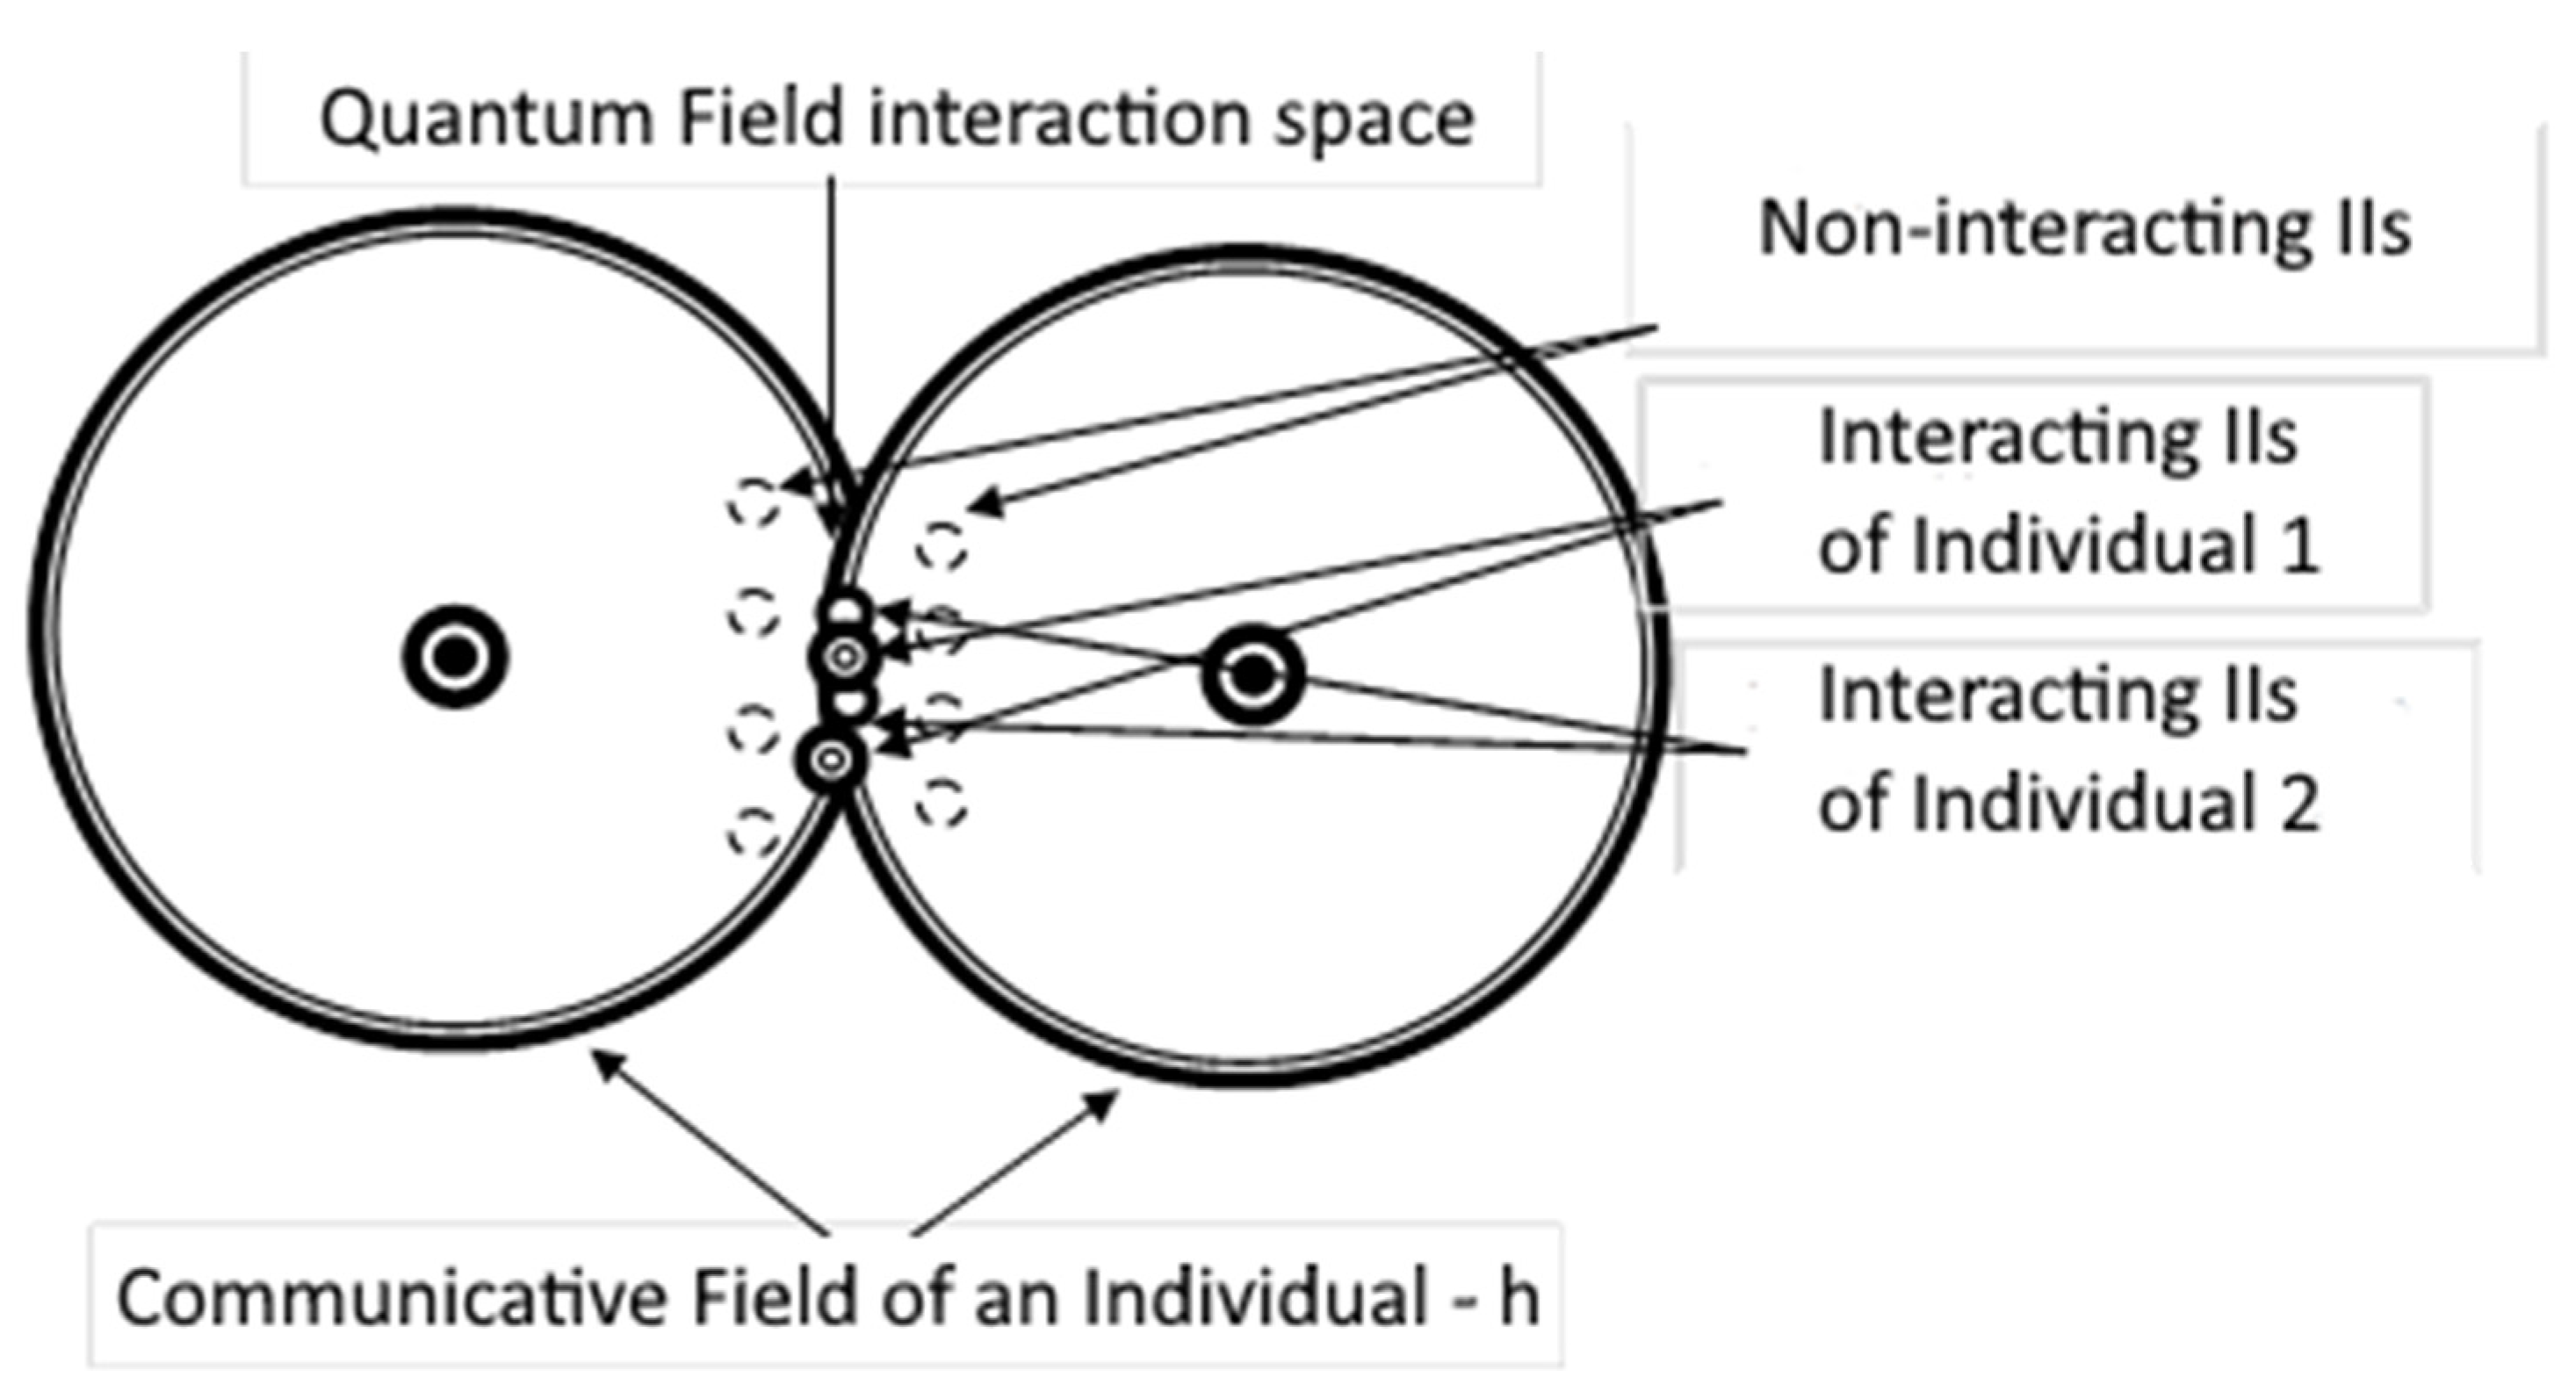
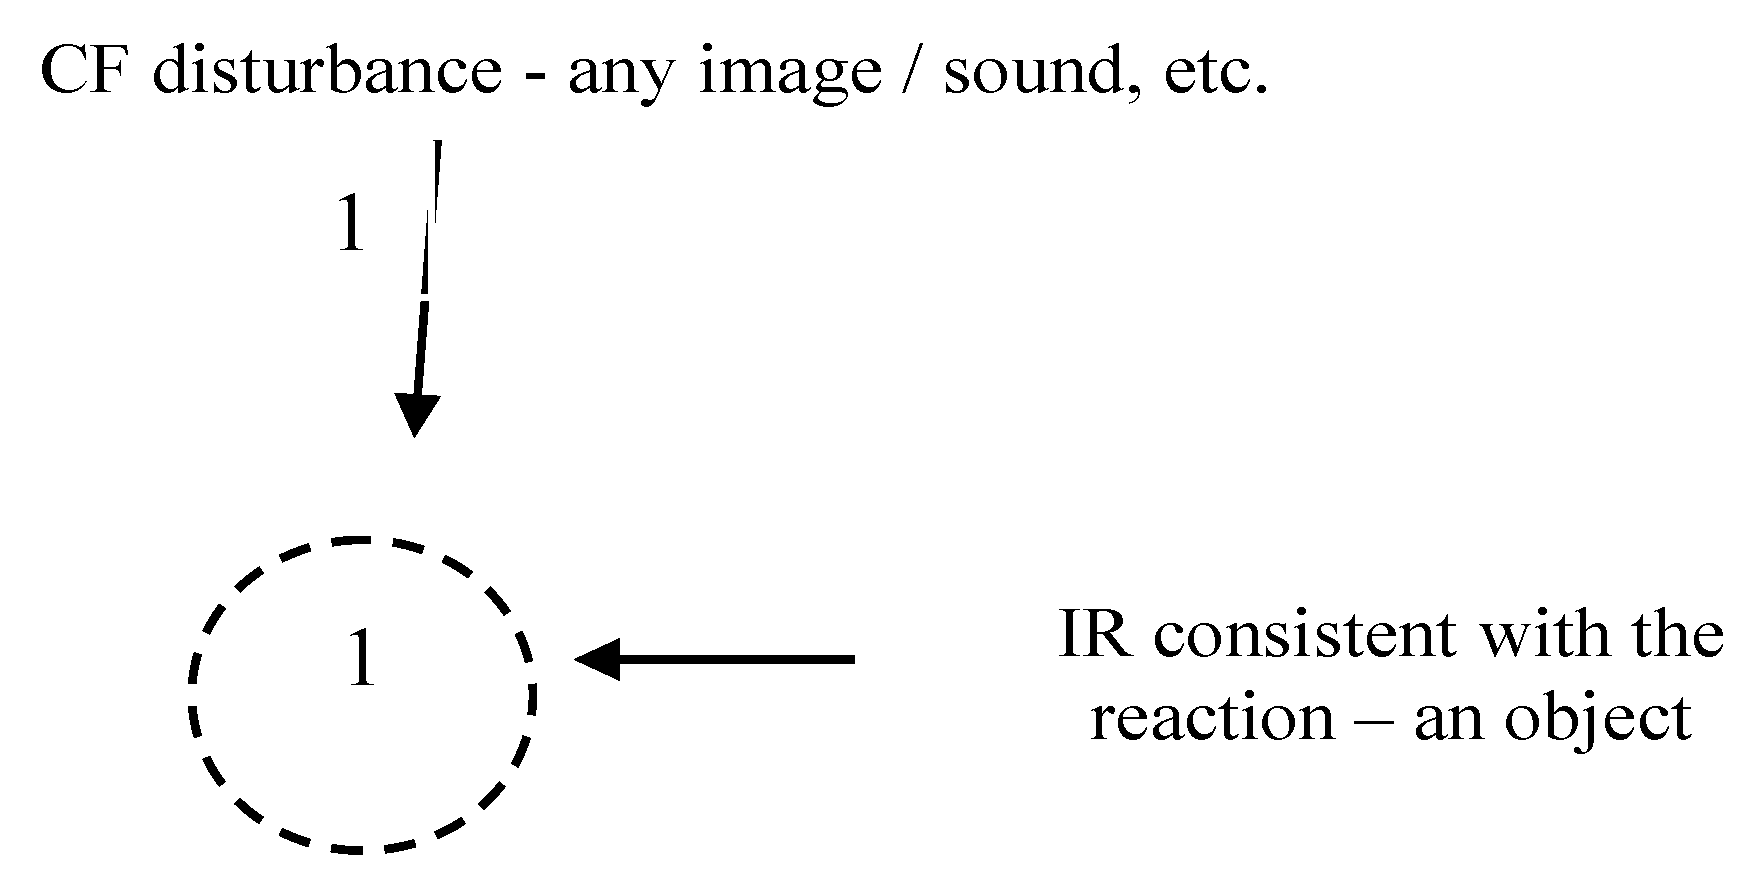
3. The Foundations of the Theory of Information Images/Representations and Its Model
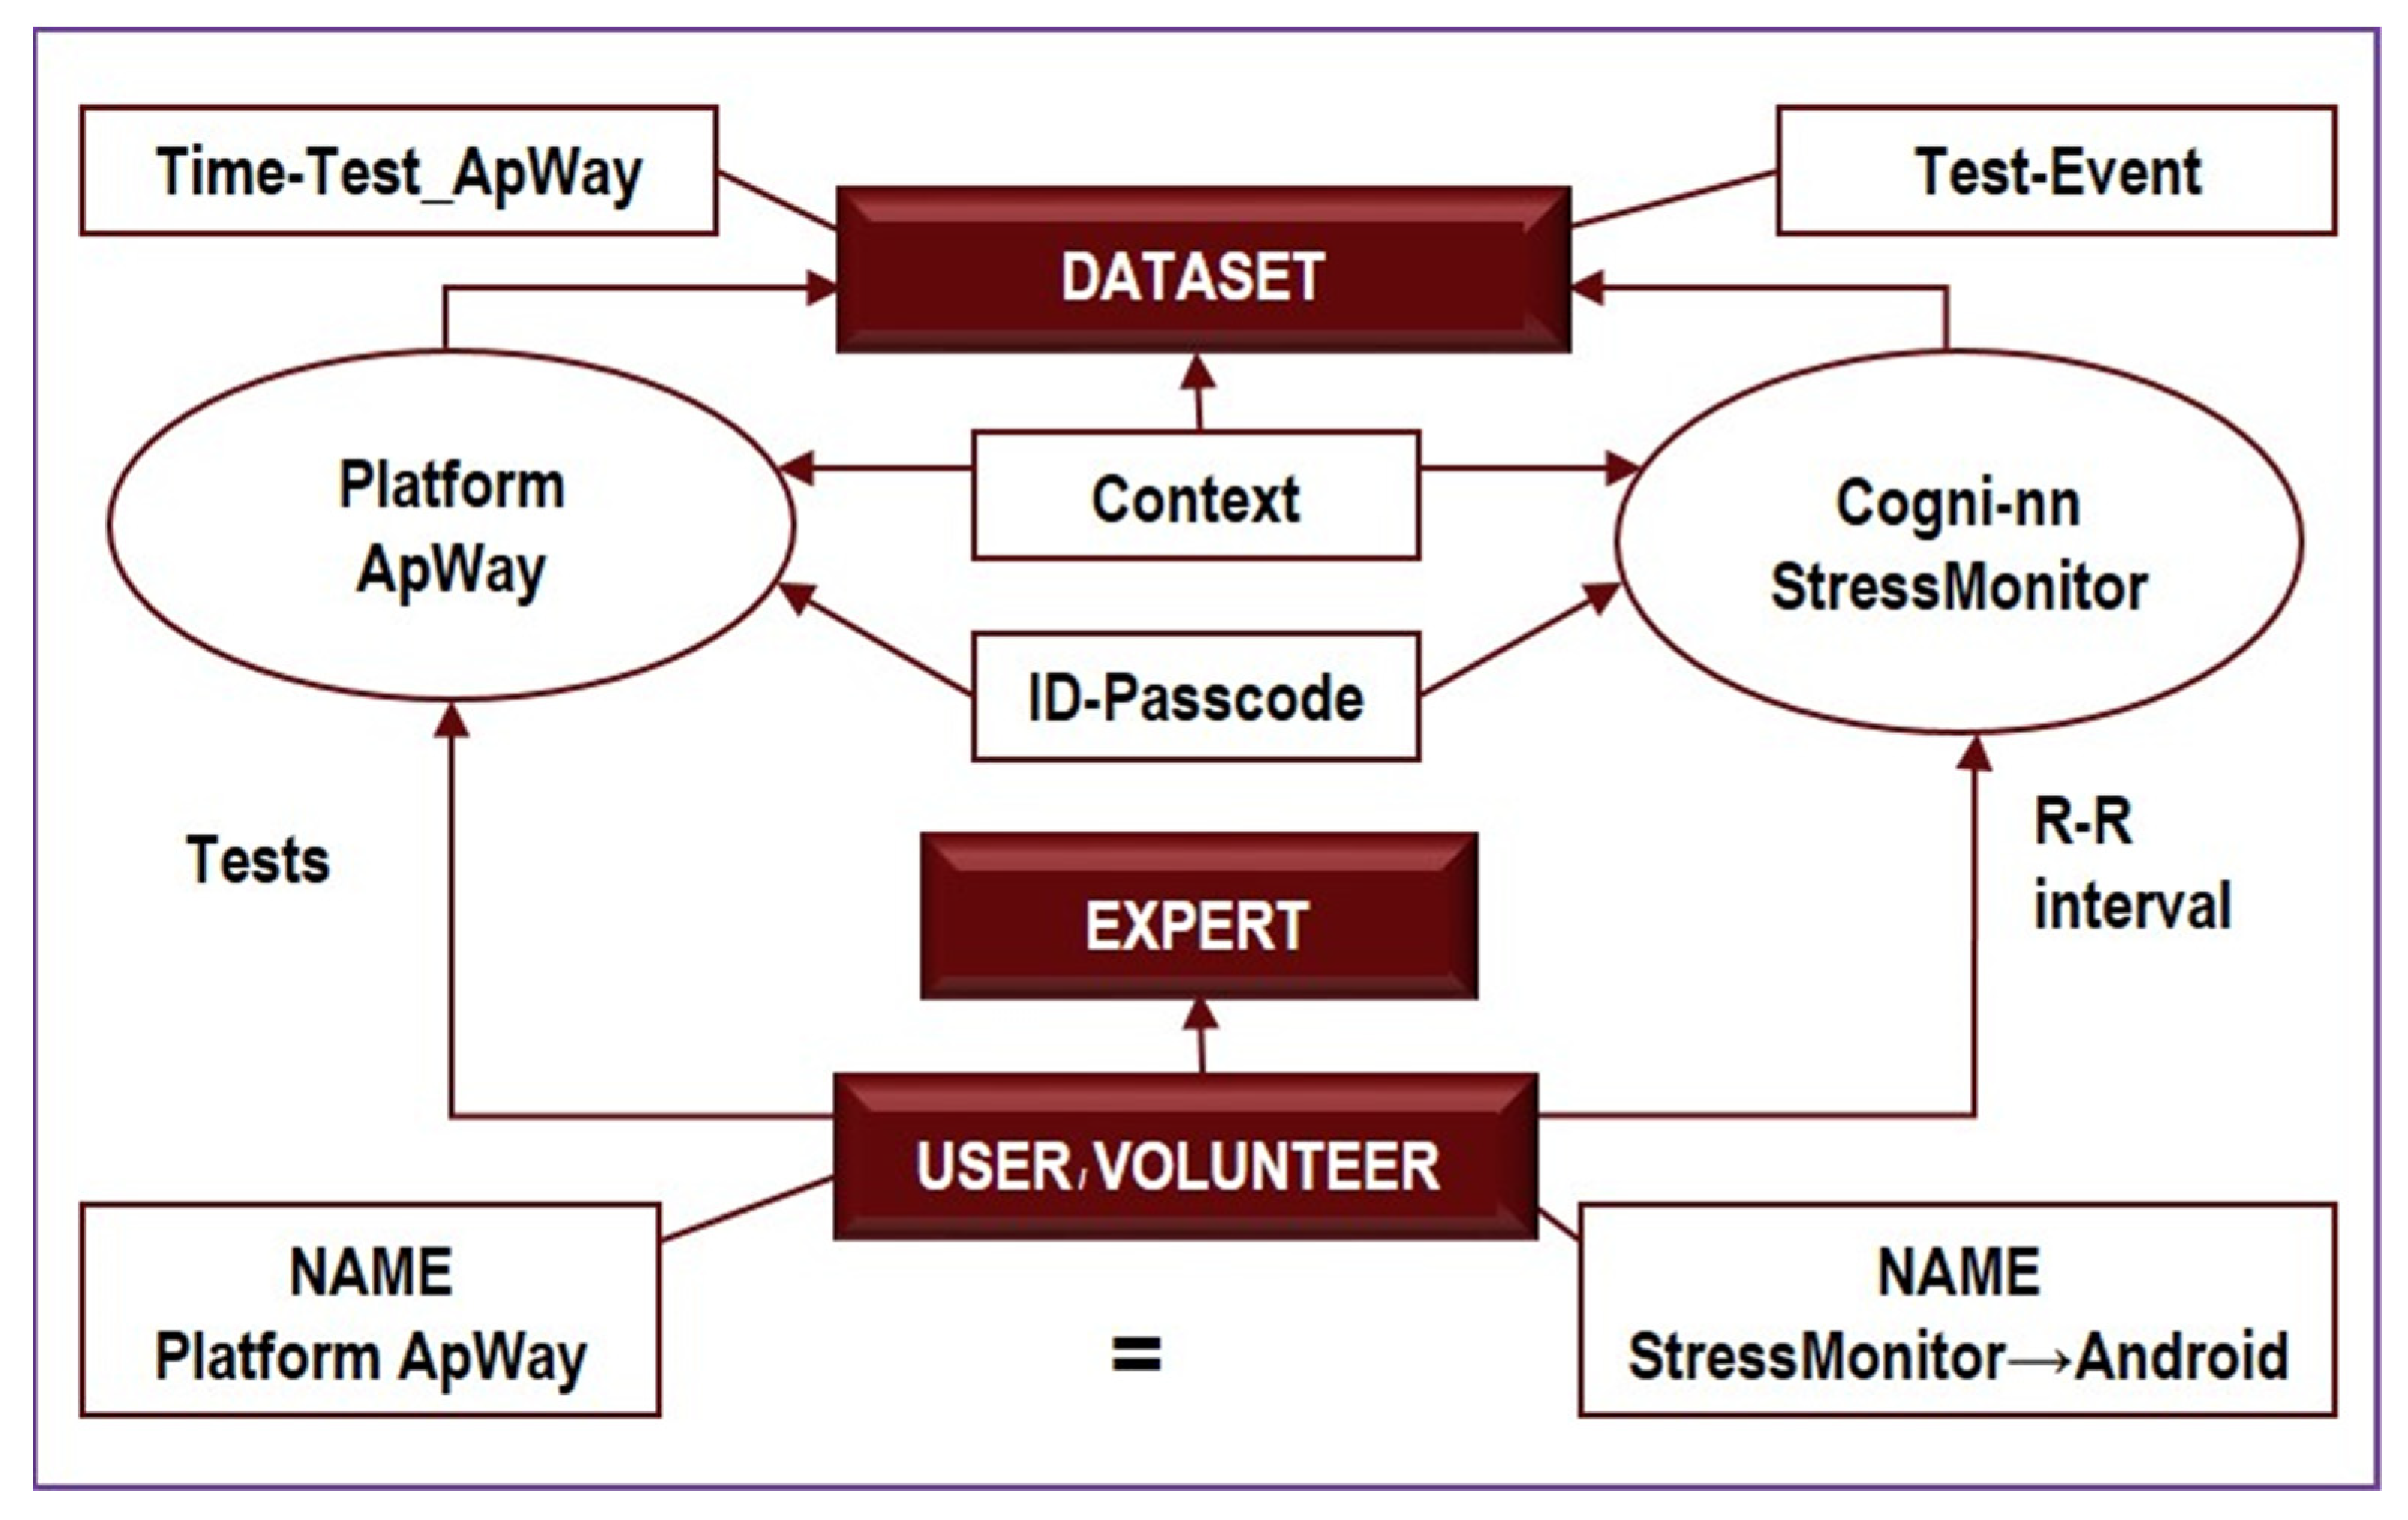
4. Experimental Methods
- (1)
- Average heart rate (HR);
- (2)
- Average RR-intervals;
- (3)
- Average power of the low-frequency band of the total HRV spectrum (LF);
- (4)
- Average power of the high-frequency band of the total HRV spectrum (HF);
- (5)
- Average ratio of slow and fast bands of the general HRV spectrum (a measure of sympathovagal balance) (LF / HF);
- (6)
- Average power of the HRV spectrum (TP);
- (7)
- Stress Index (SI);
- (8)
- Functional reserve (FR);
- (9)
- Stress Index (SN).
5. Experiment and Sampling
5.1. Preparatory Stage:
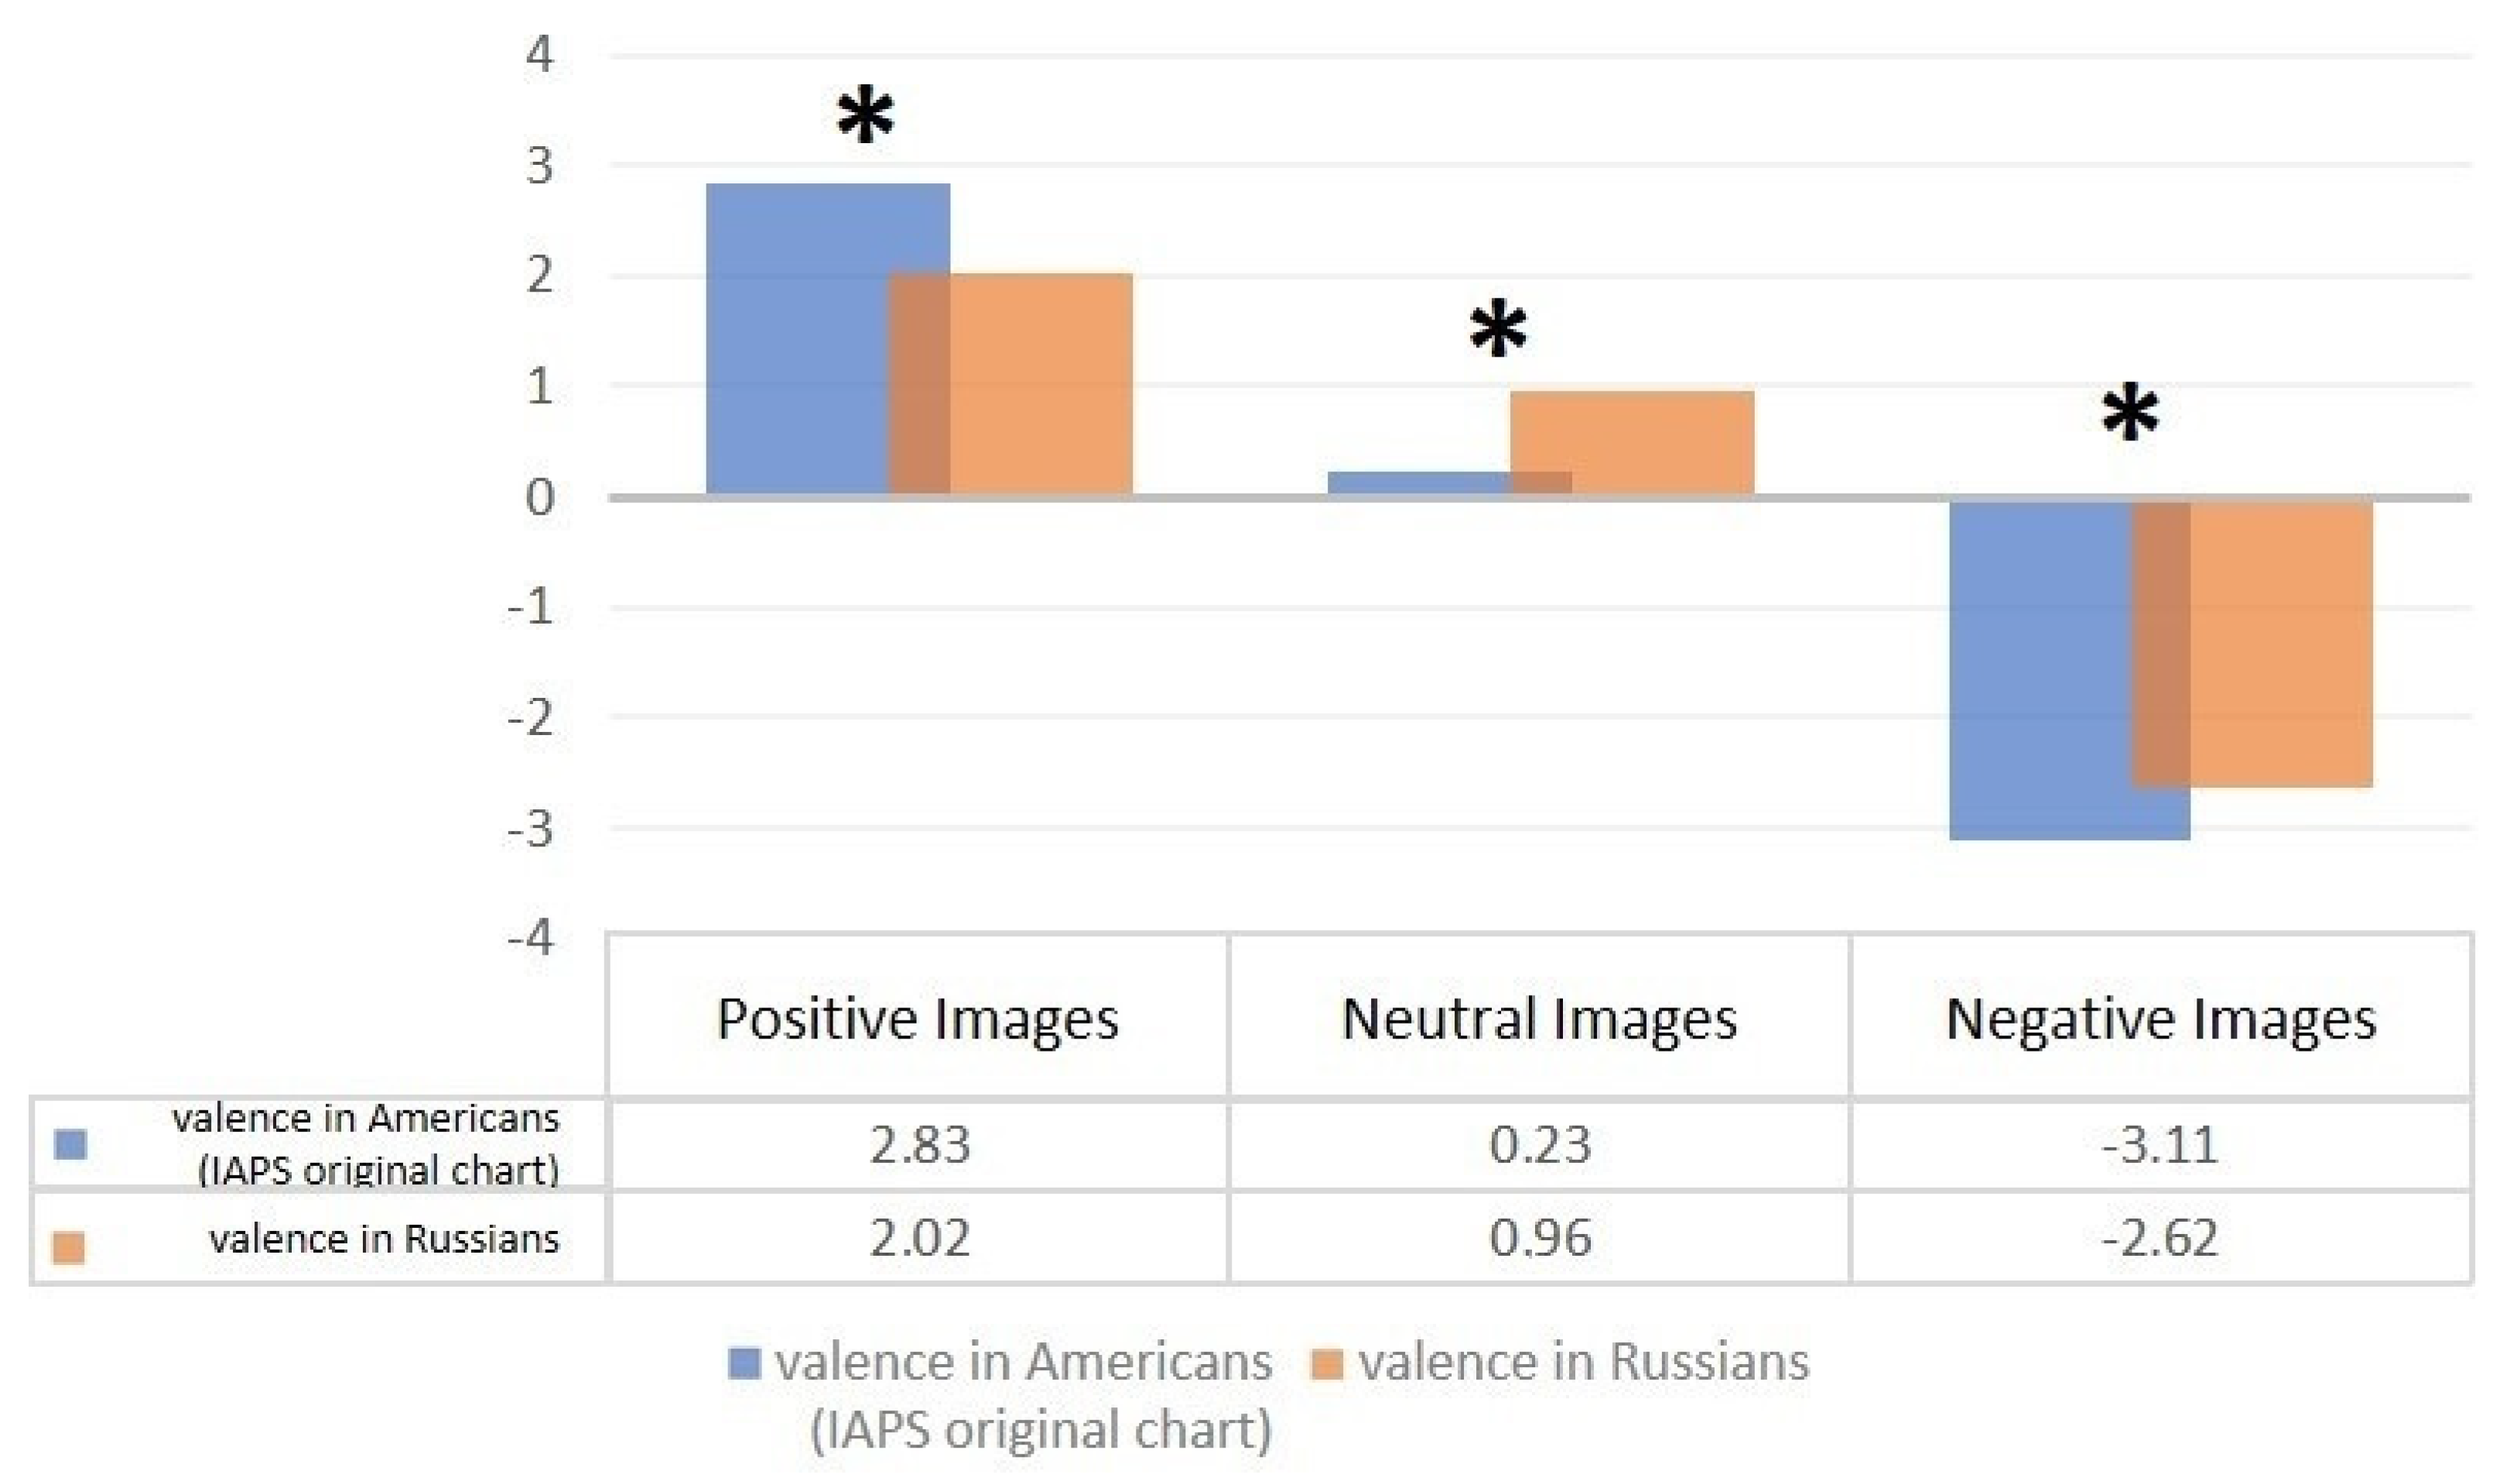
- 10 positive (with the highest average values-from 2.33 to 2.9),
- 10 neutral (with the values closest to zero-from −0.14 to 0.15).
- 10 negative (with the smallest values-from −3.43 to −2.96)
- 28 positive (with the highest mean values ranging from 2 to 4).
- 28 neutral (with values closest to zero-from −1 to 1).
- 28 negative (with the smallest-from −4 to −2)
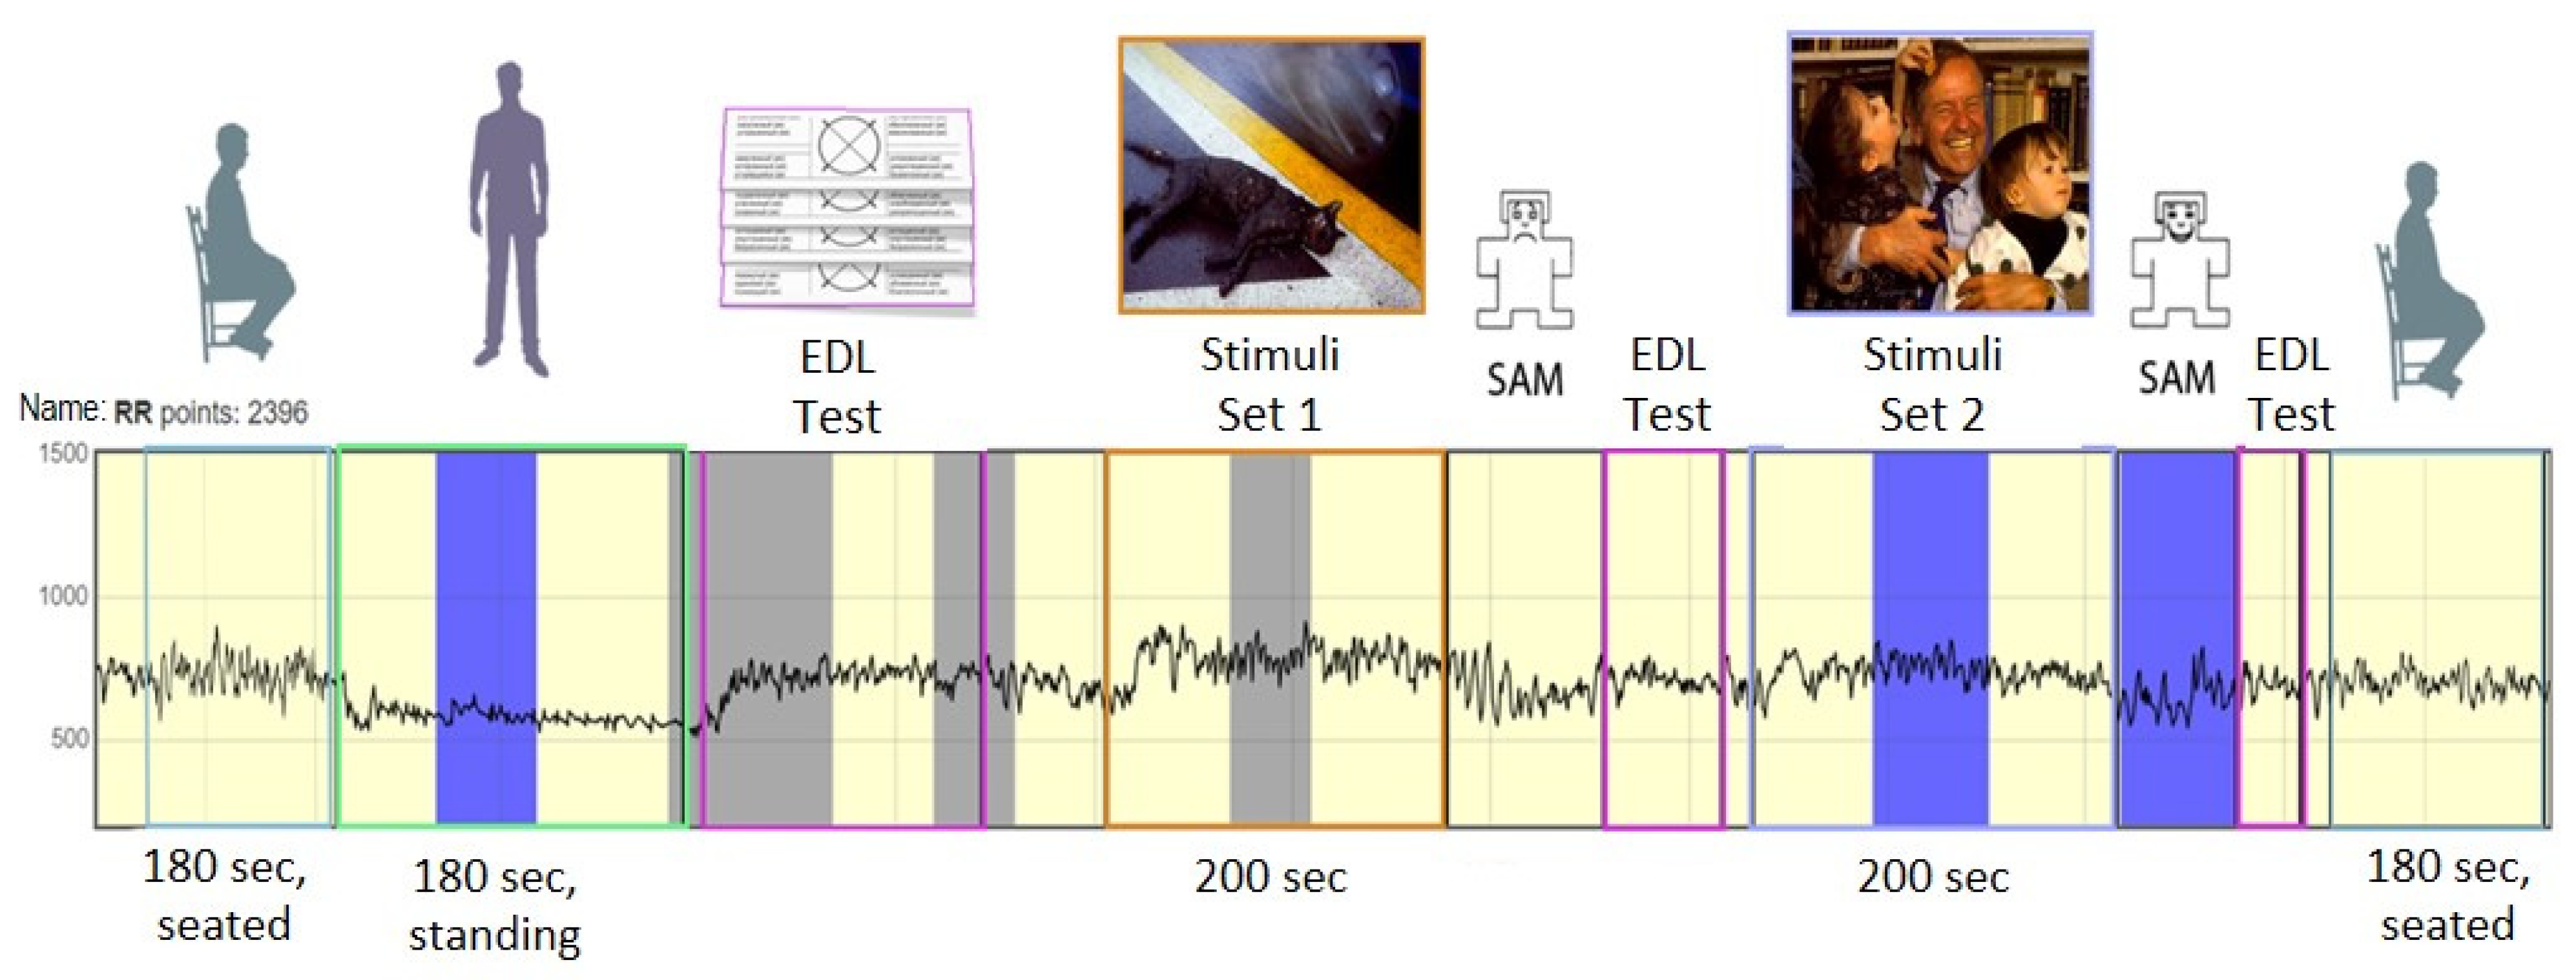
5.2. Principal Stage:
- 24 sound stimuli, 12 of which are extremely negative and 12 are extremely positive. The stimuli were selected based on responses according to the SAM method. Average indicators were taken from an experiment previously conducted on Russian subjects (See Appendix B)
- 24 images, 12 of which are very negative and 12 are very positive based on SAM responses. (See Appendix B).
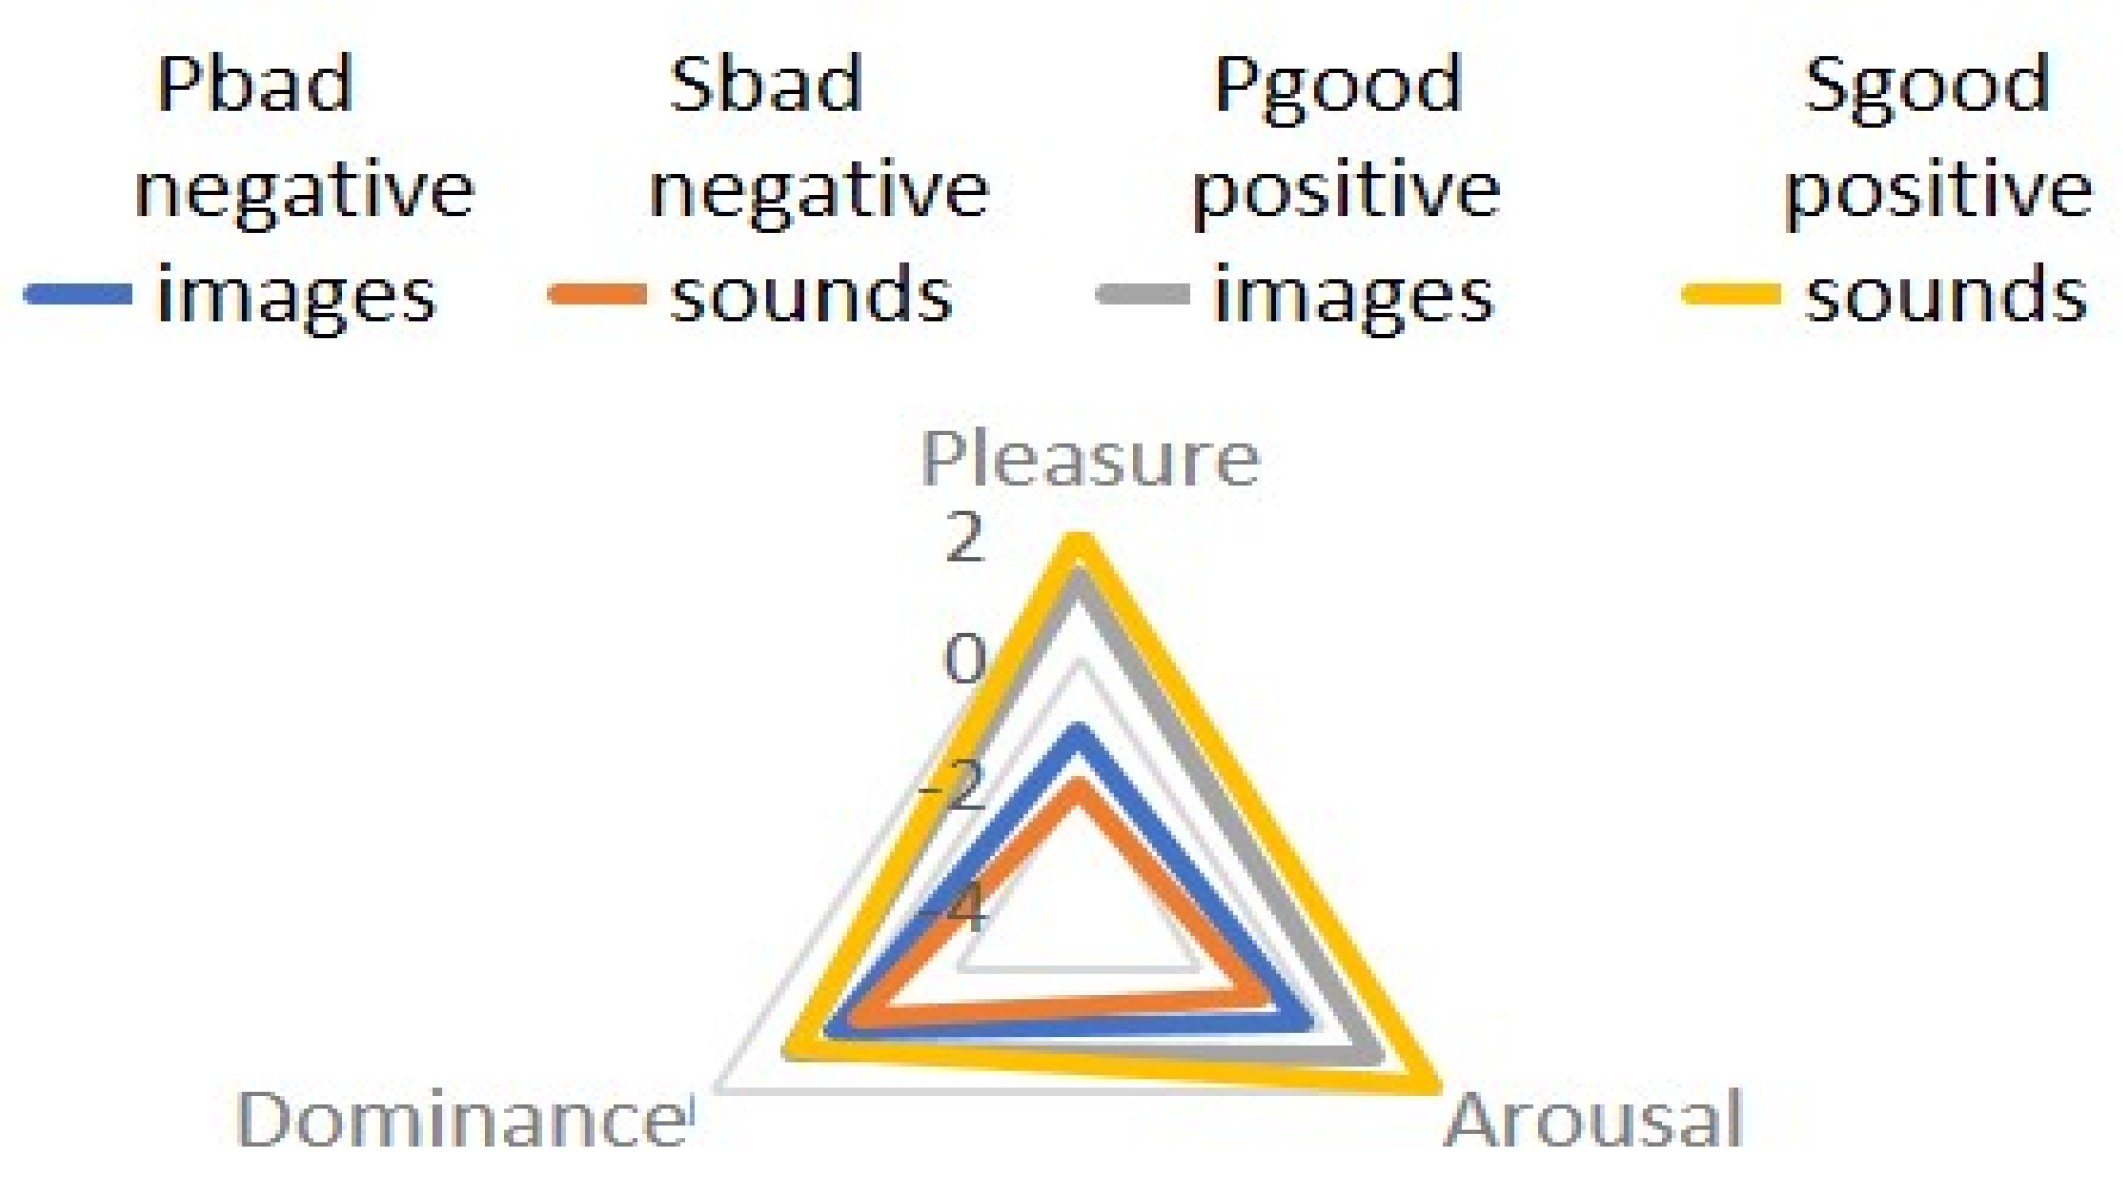
- Negative sound-with 12 negative sounds;
- Positive sound-with 12 positive sounds;
- Negative video sequence-with 12 negative images;
- Positive video sequence-with 12 positive images.
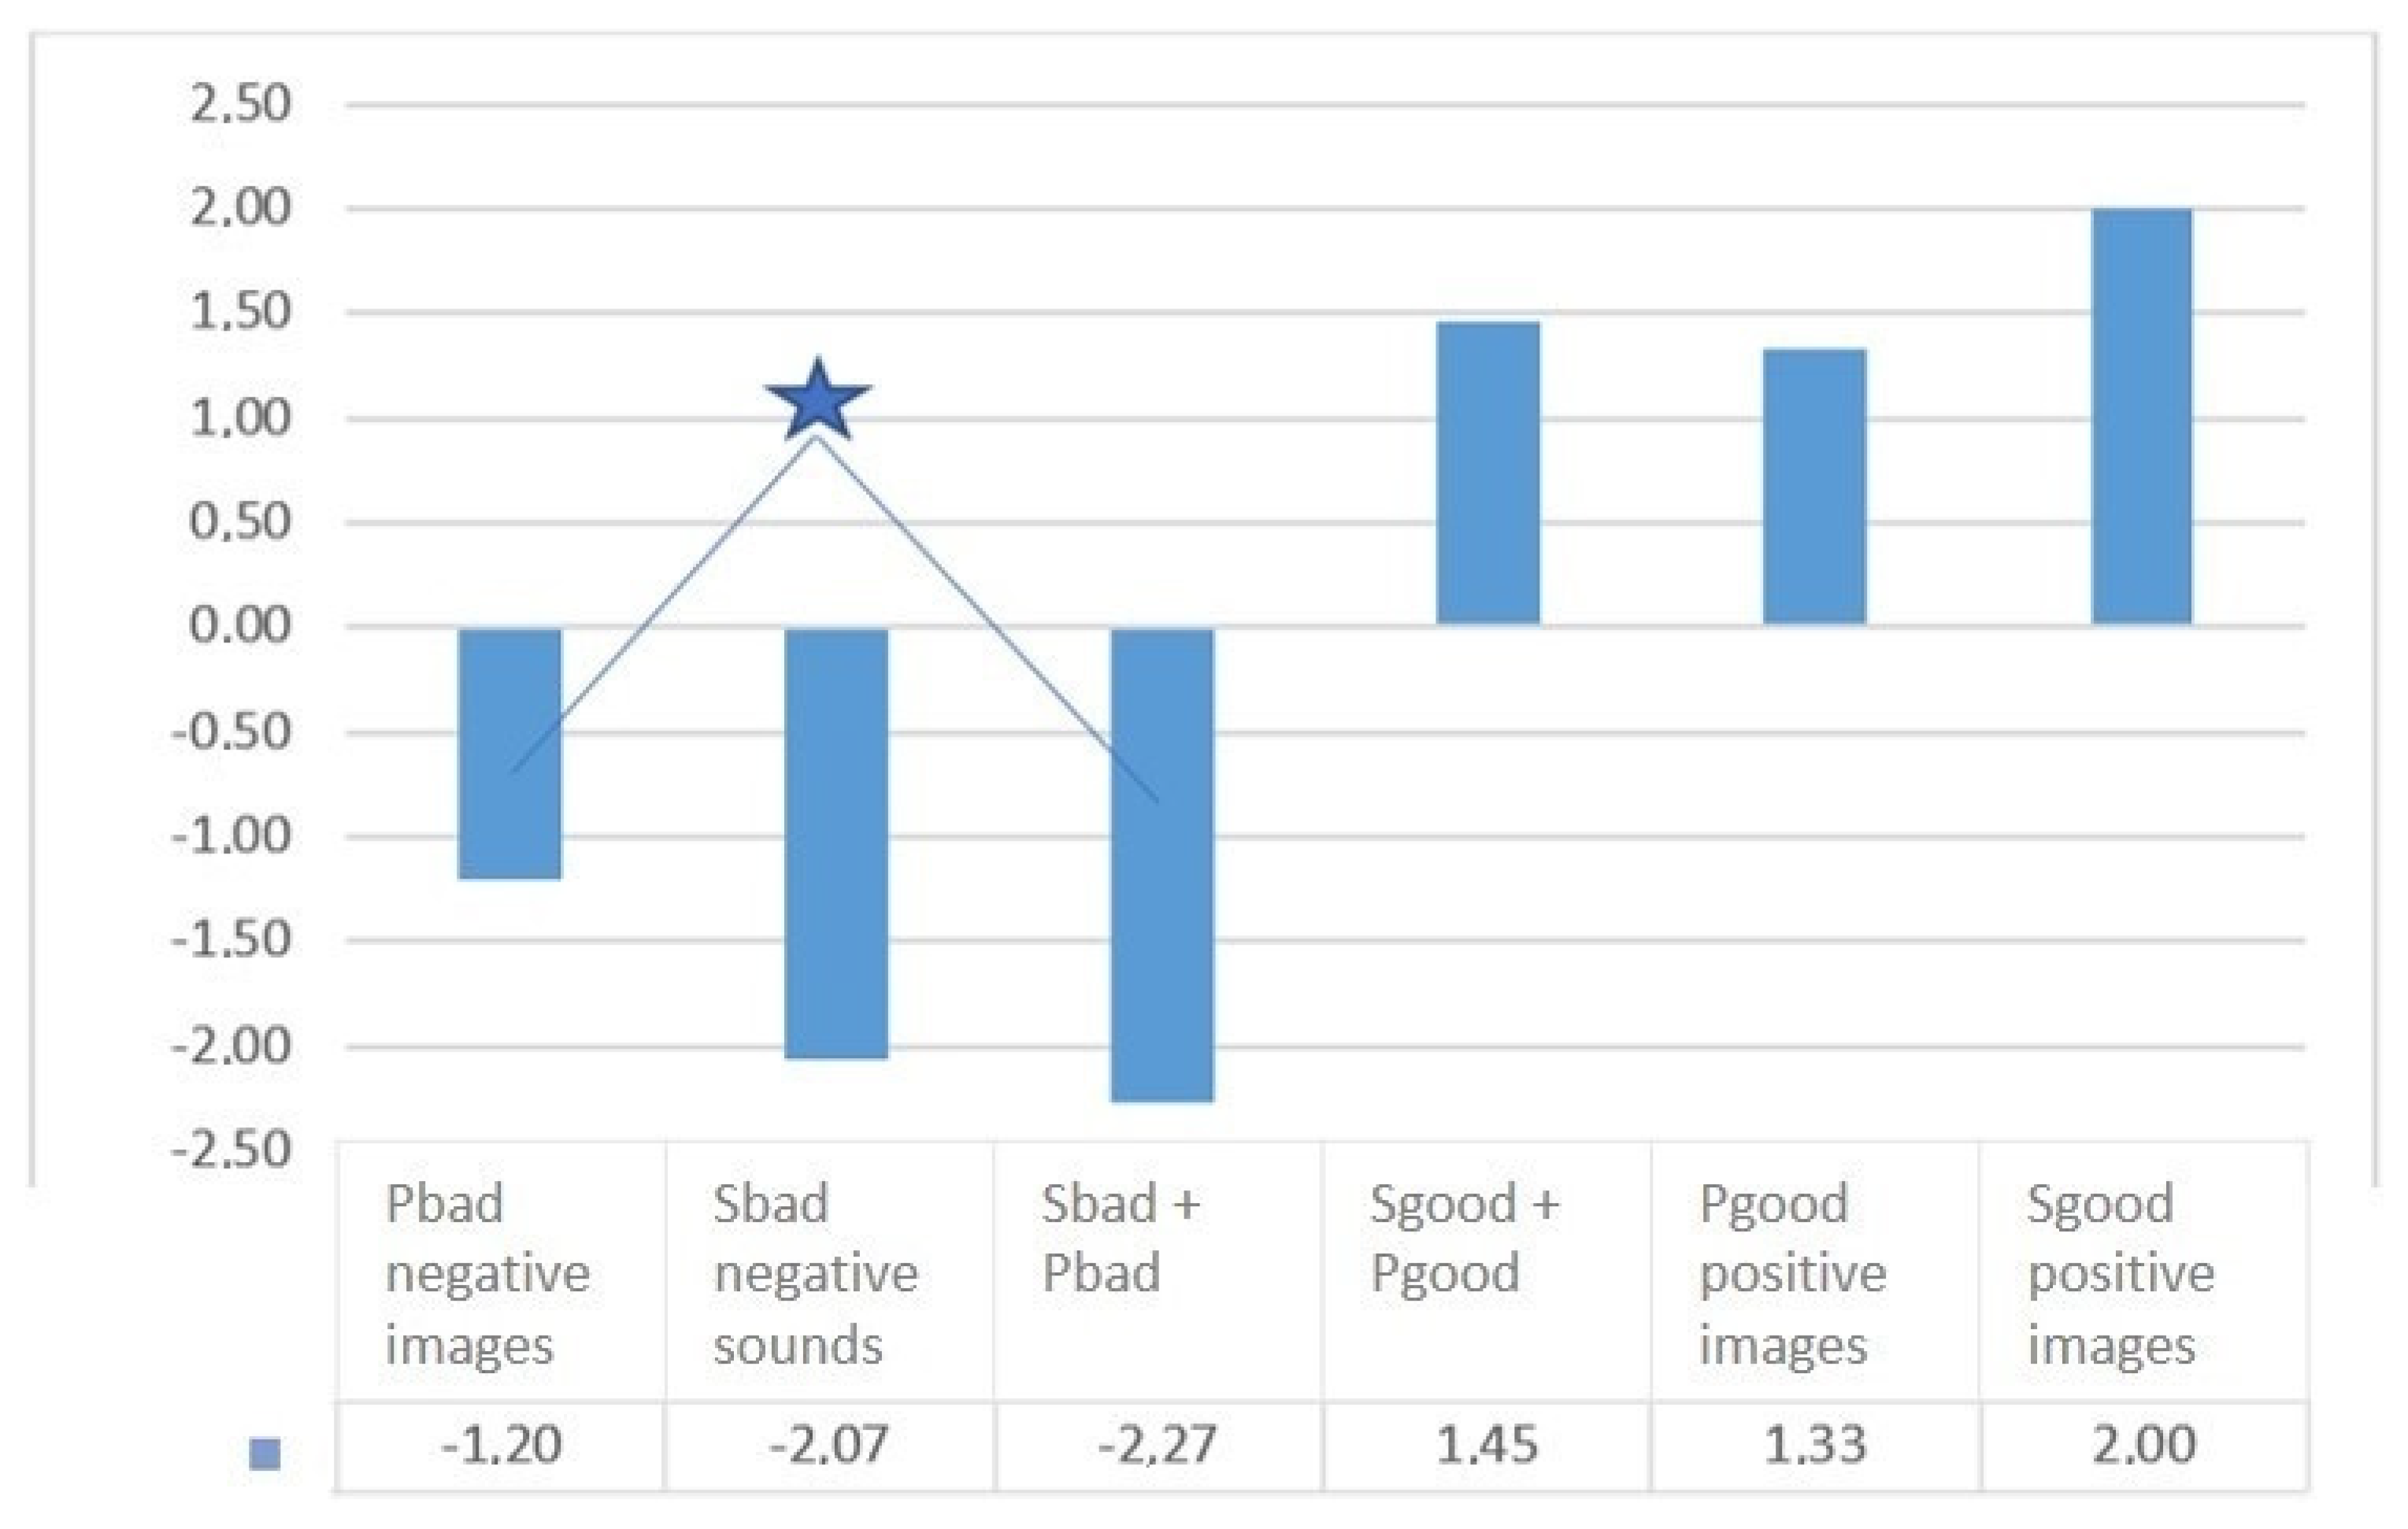
- Negative Video (PS-)-with 12 negative sounds and images;
- Positive Video (P + S +)-with 12 positive sounds and images;
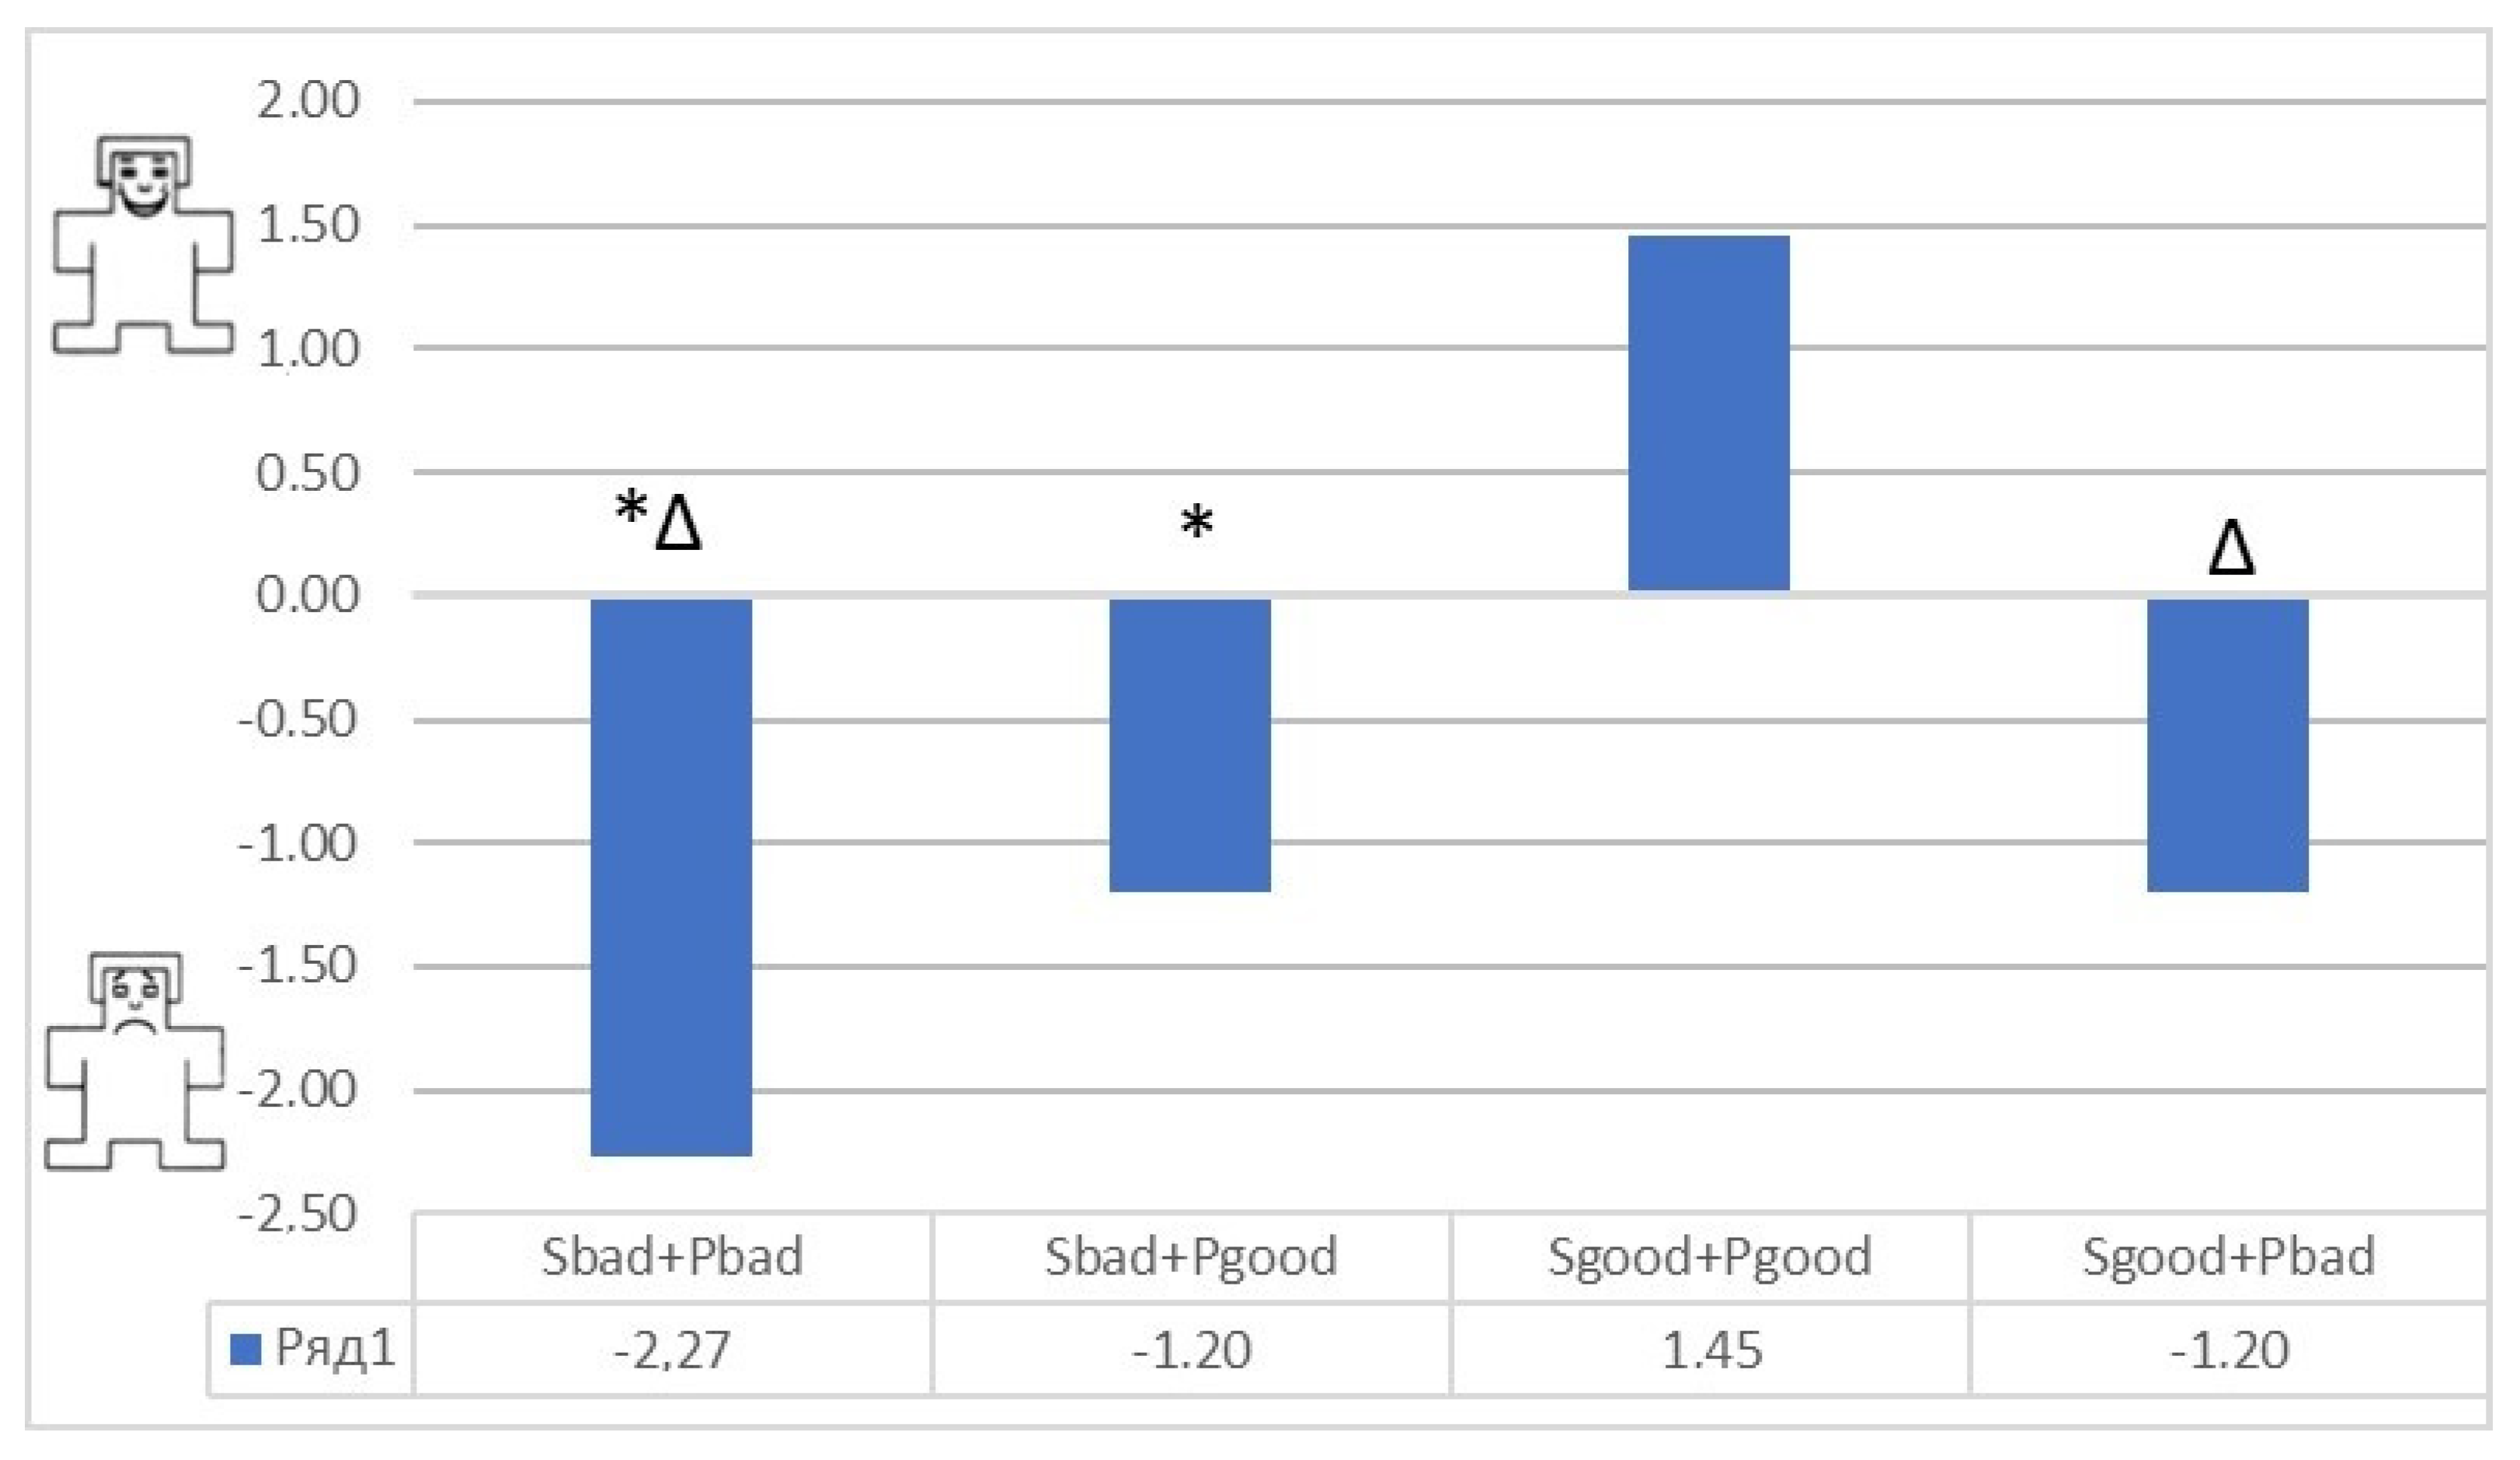
- Dissonant Video 1 (P-S +)-with 12 negative images and 12 positive sounds;
- Dissonant Video 2 (P + S-)-with 12 positive images and 12 negative sounds.
- Basic, with consistently lined up negative and positive videos
- Dissonance, With dissonant videos 1 and 2 sequentially lined up for presentation.
6. Results

6.1. Influence of the Interaction of Different-Modal Affective Stimuli on the Level of Emotional Maladjustment
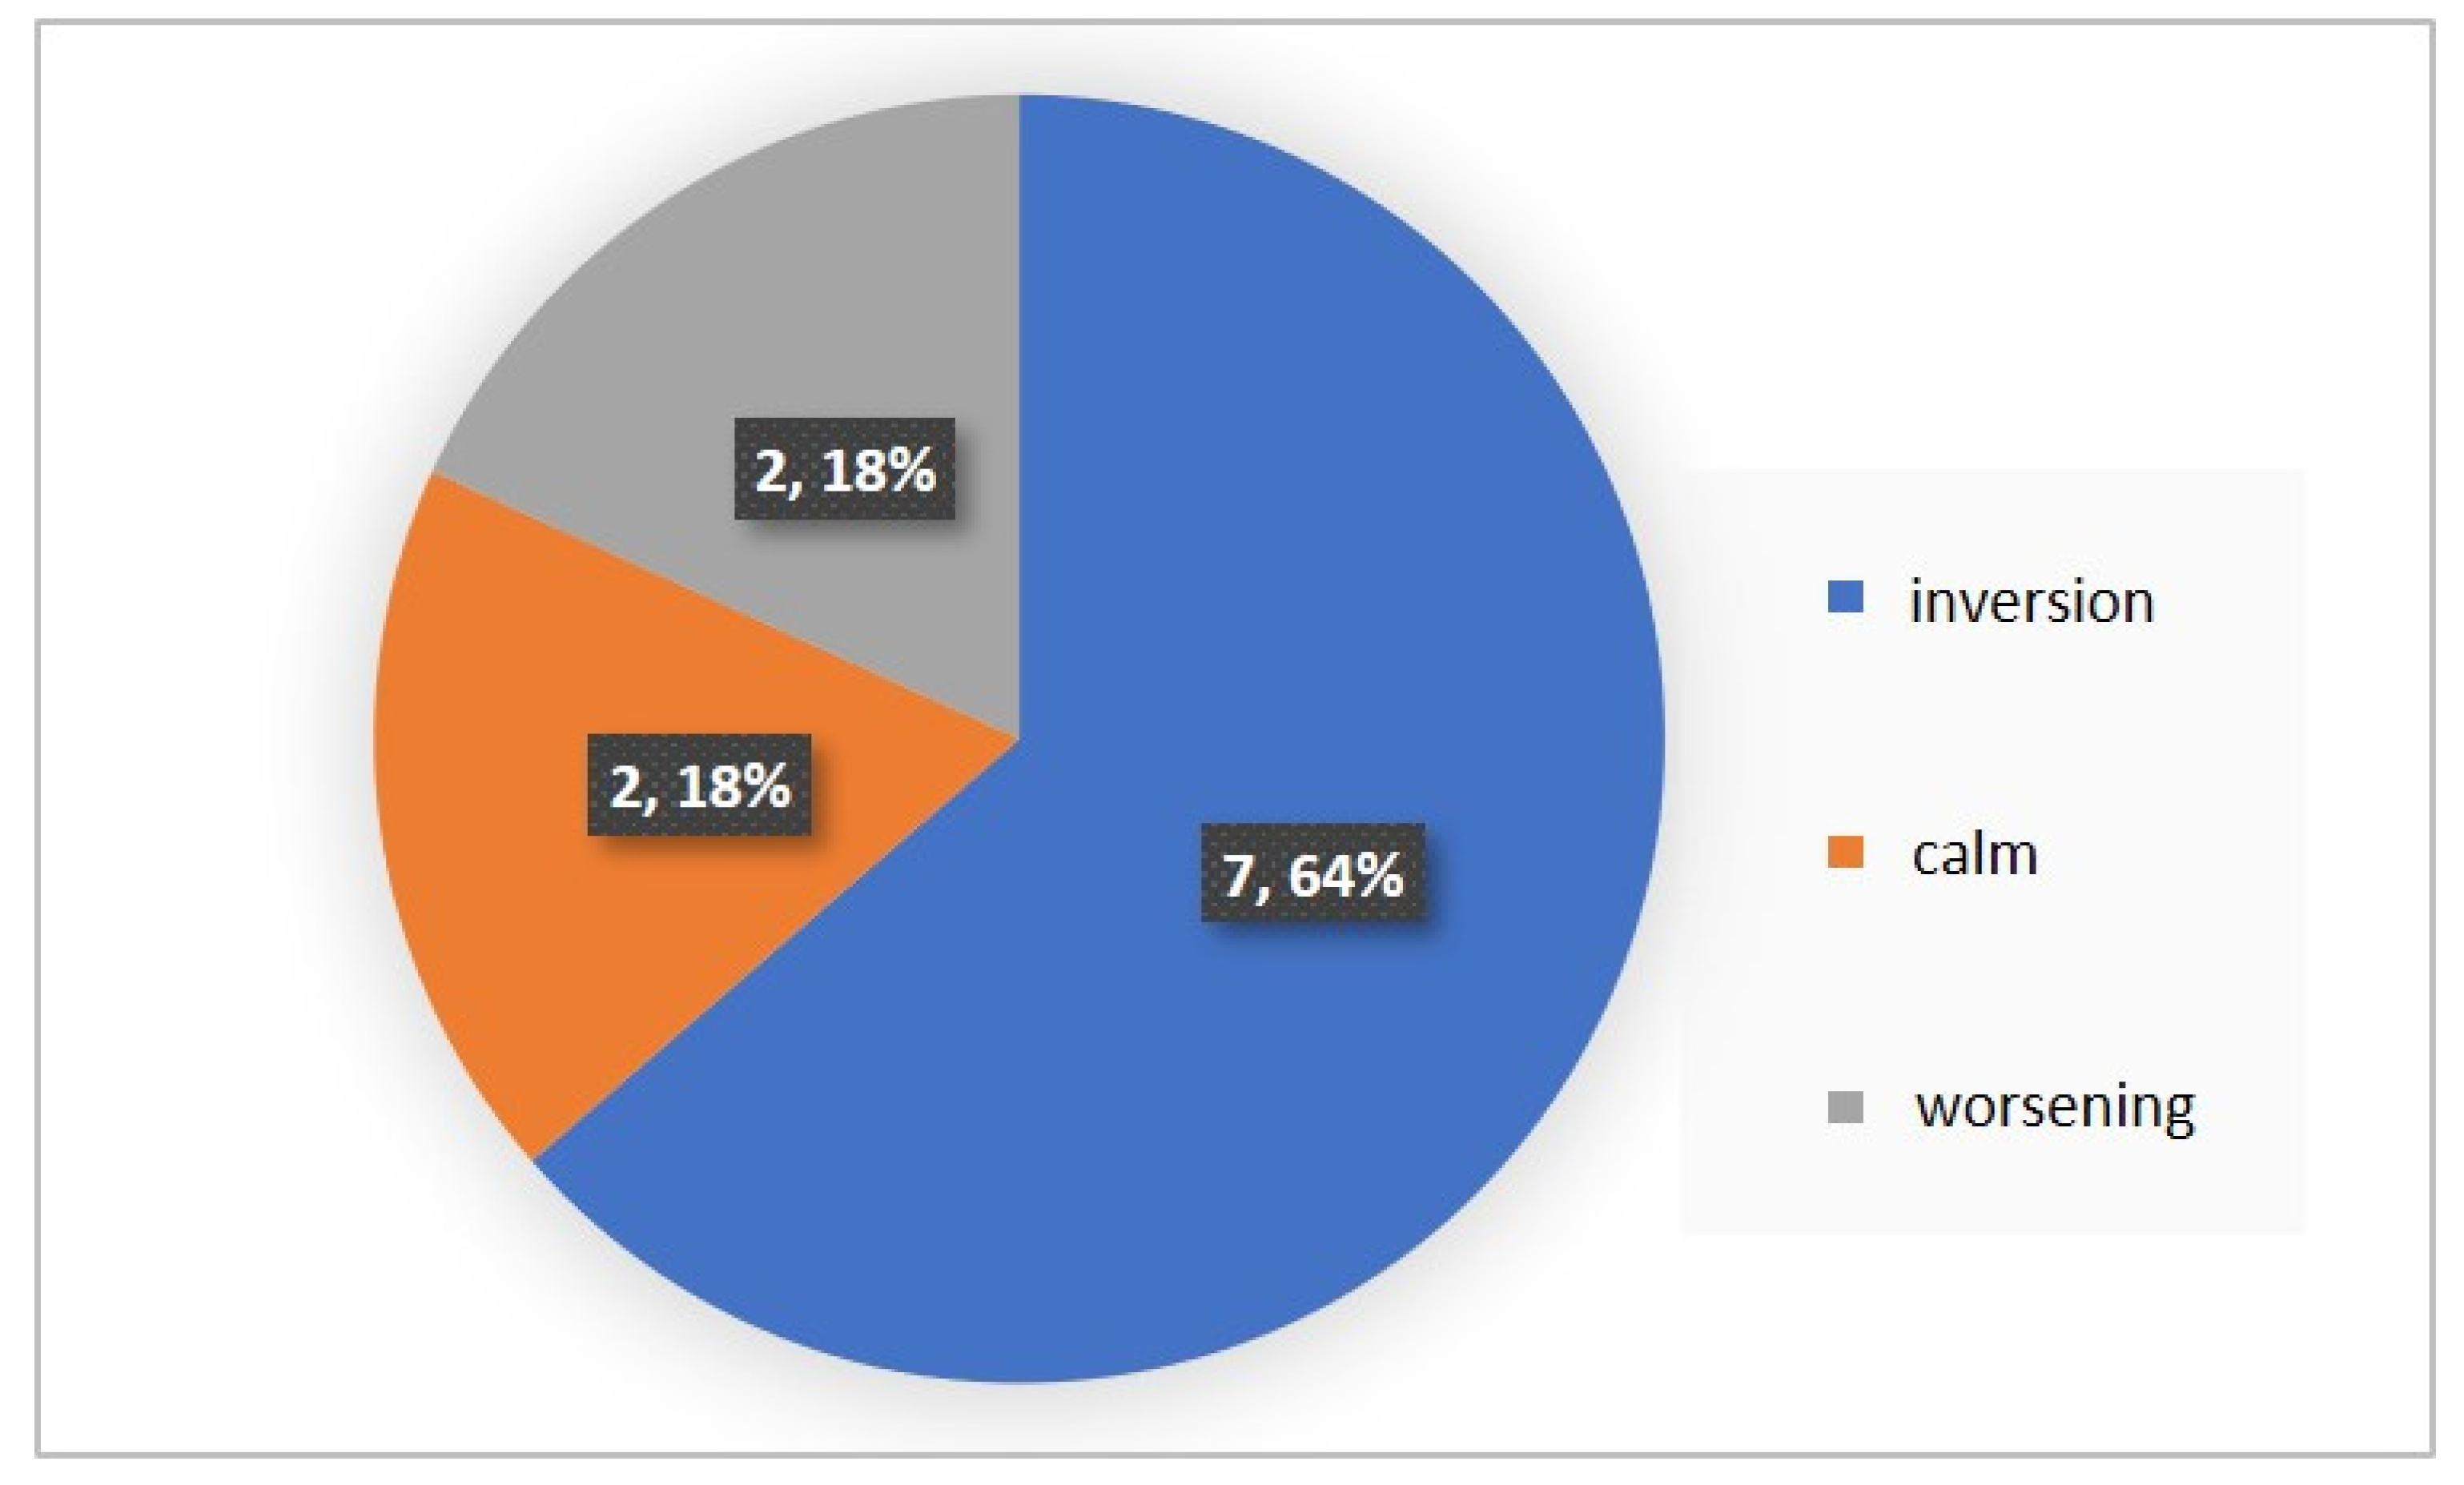
- During the experiment, the maladjustment was mild;
- After negative stimulation, there was an increase in EML;
- After the positive stimulation, the levels returned to their original state;
- People with high initial maladjustment are characterized by deviant reactions to monovalent audiovisual stimuli.
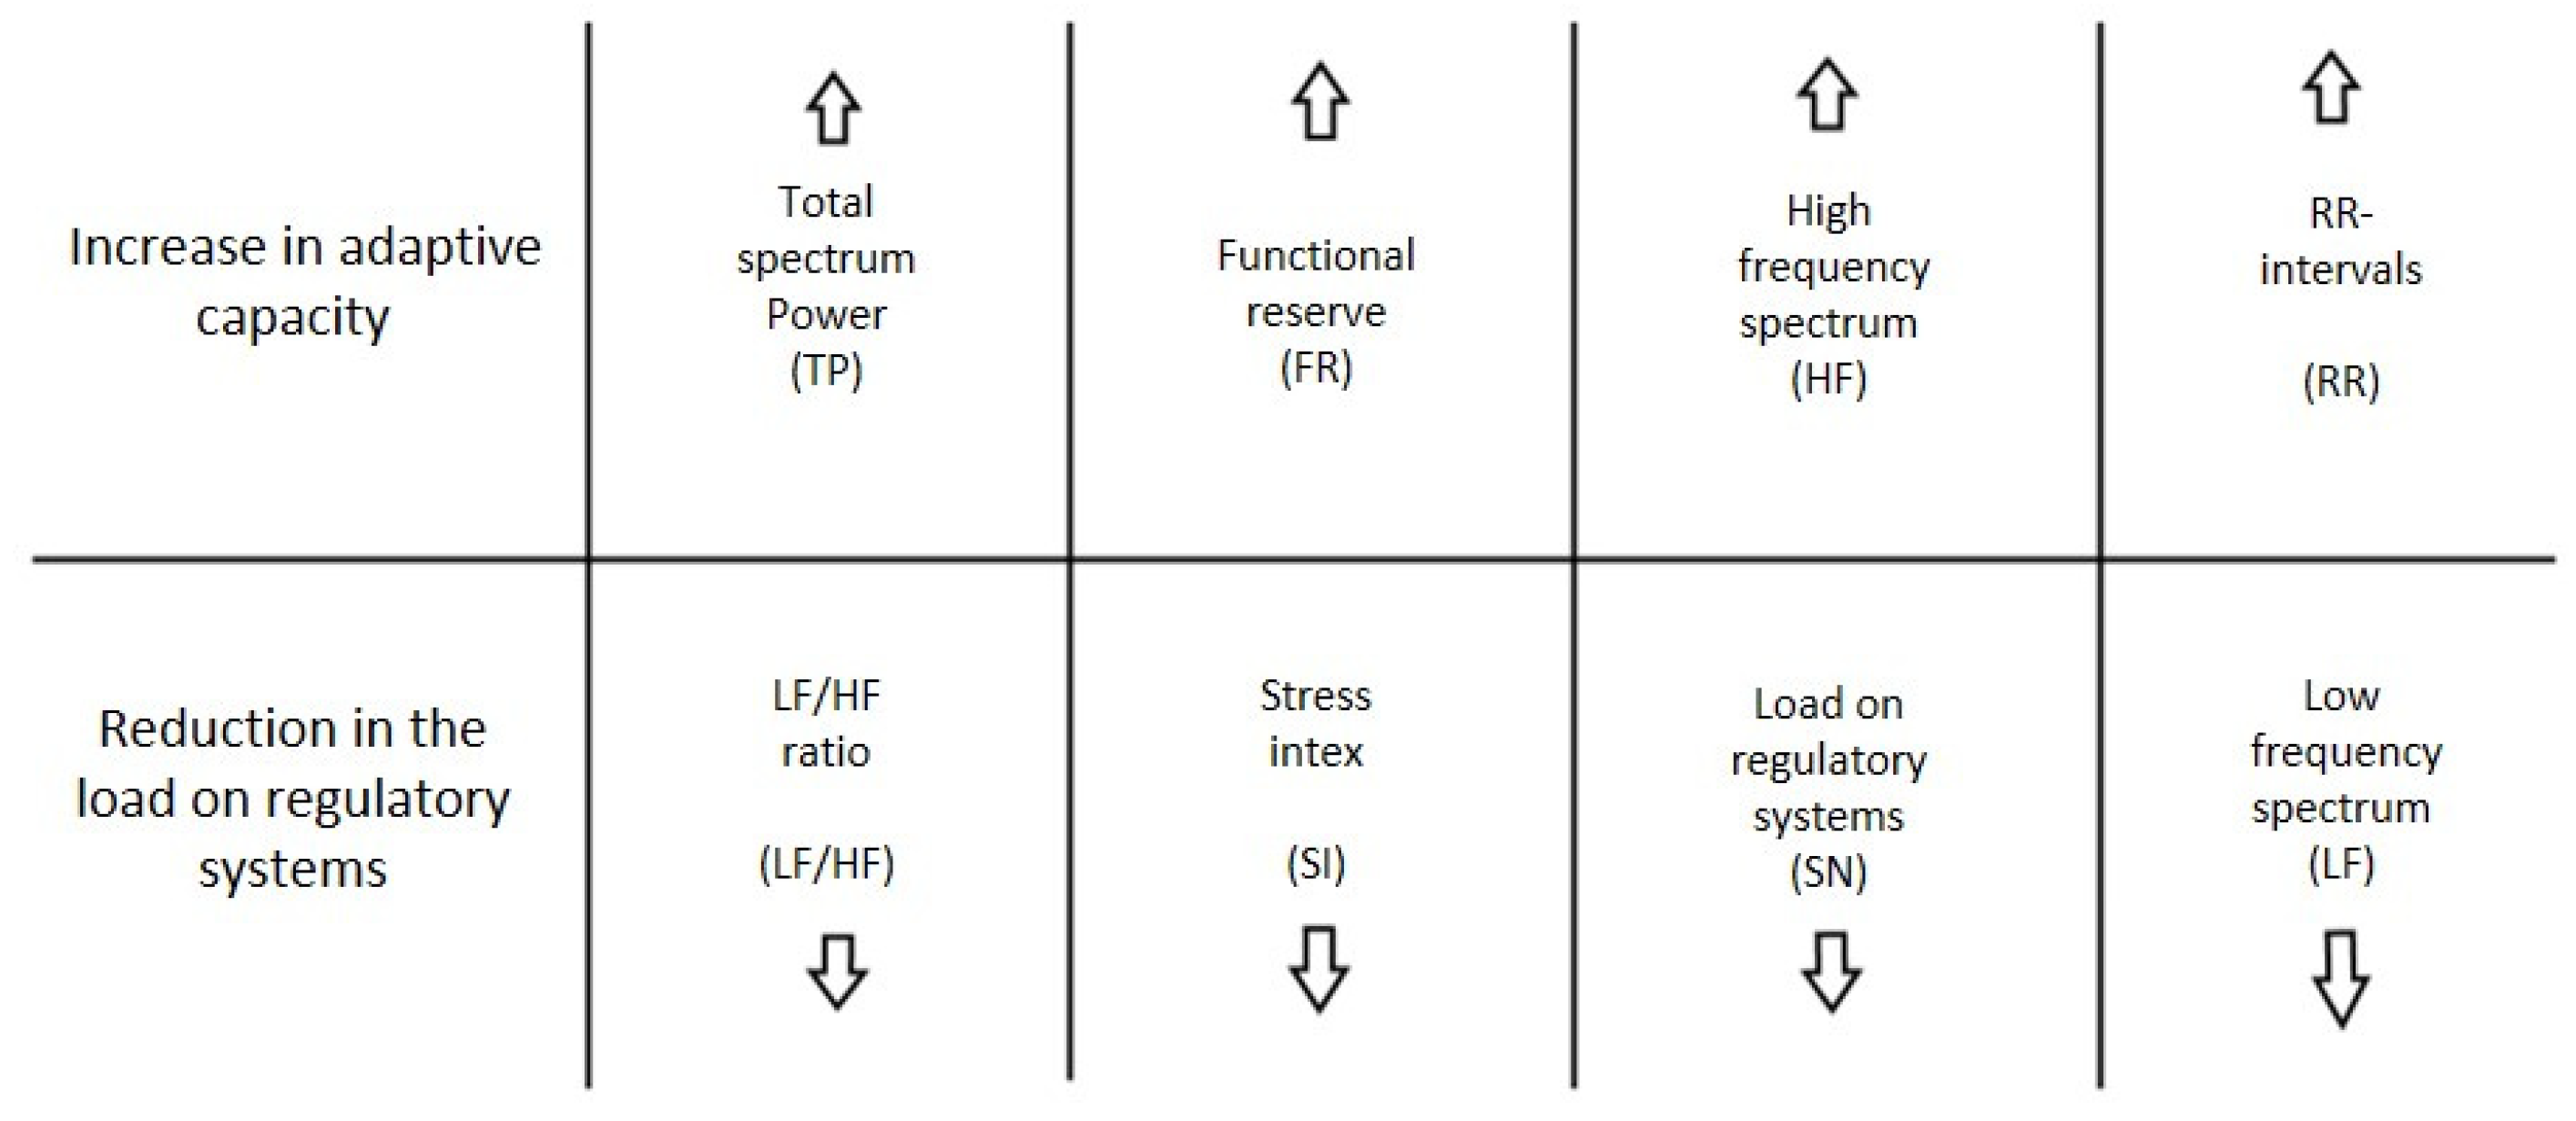
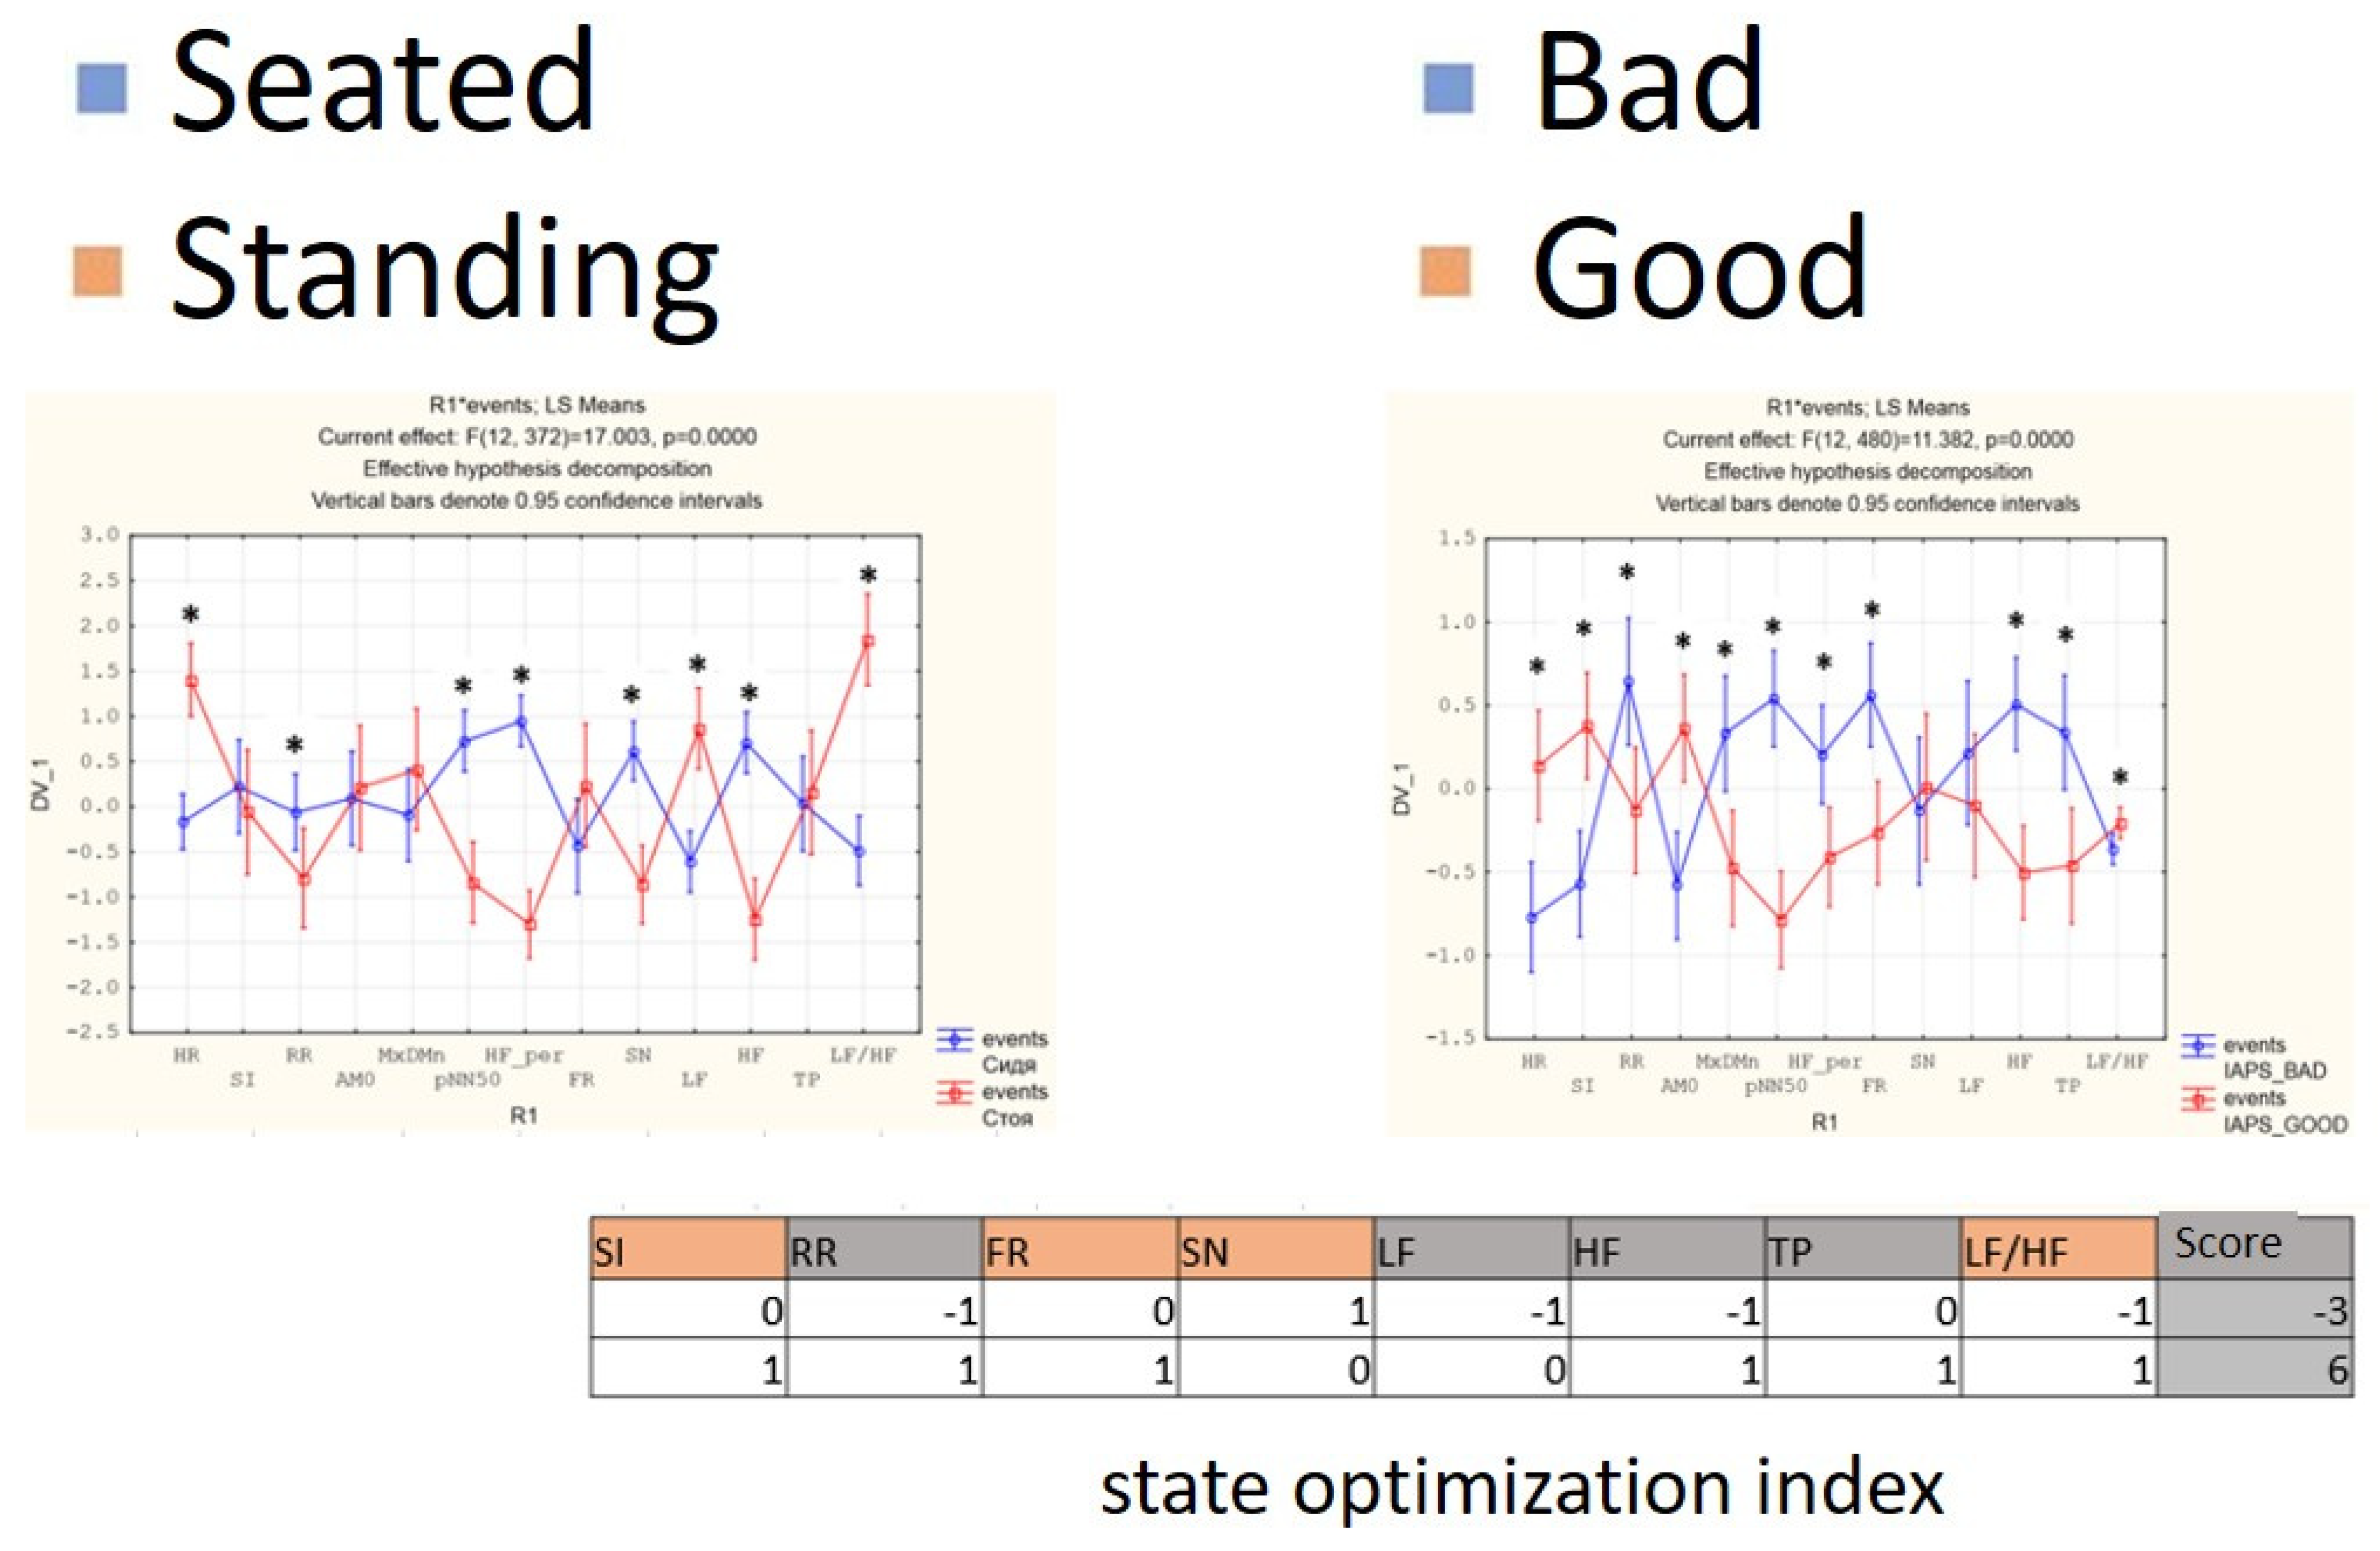
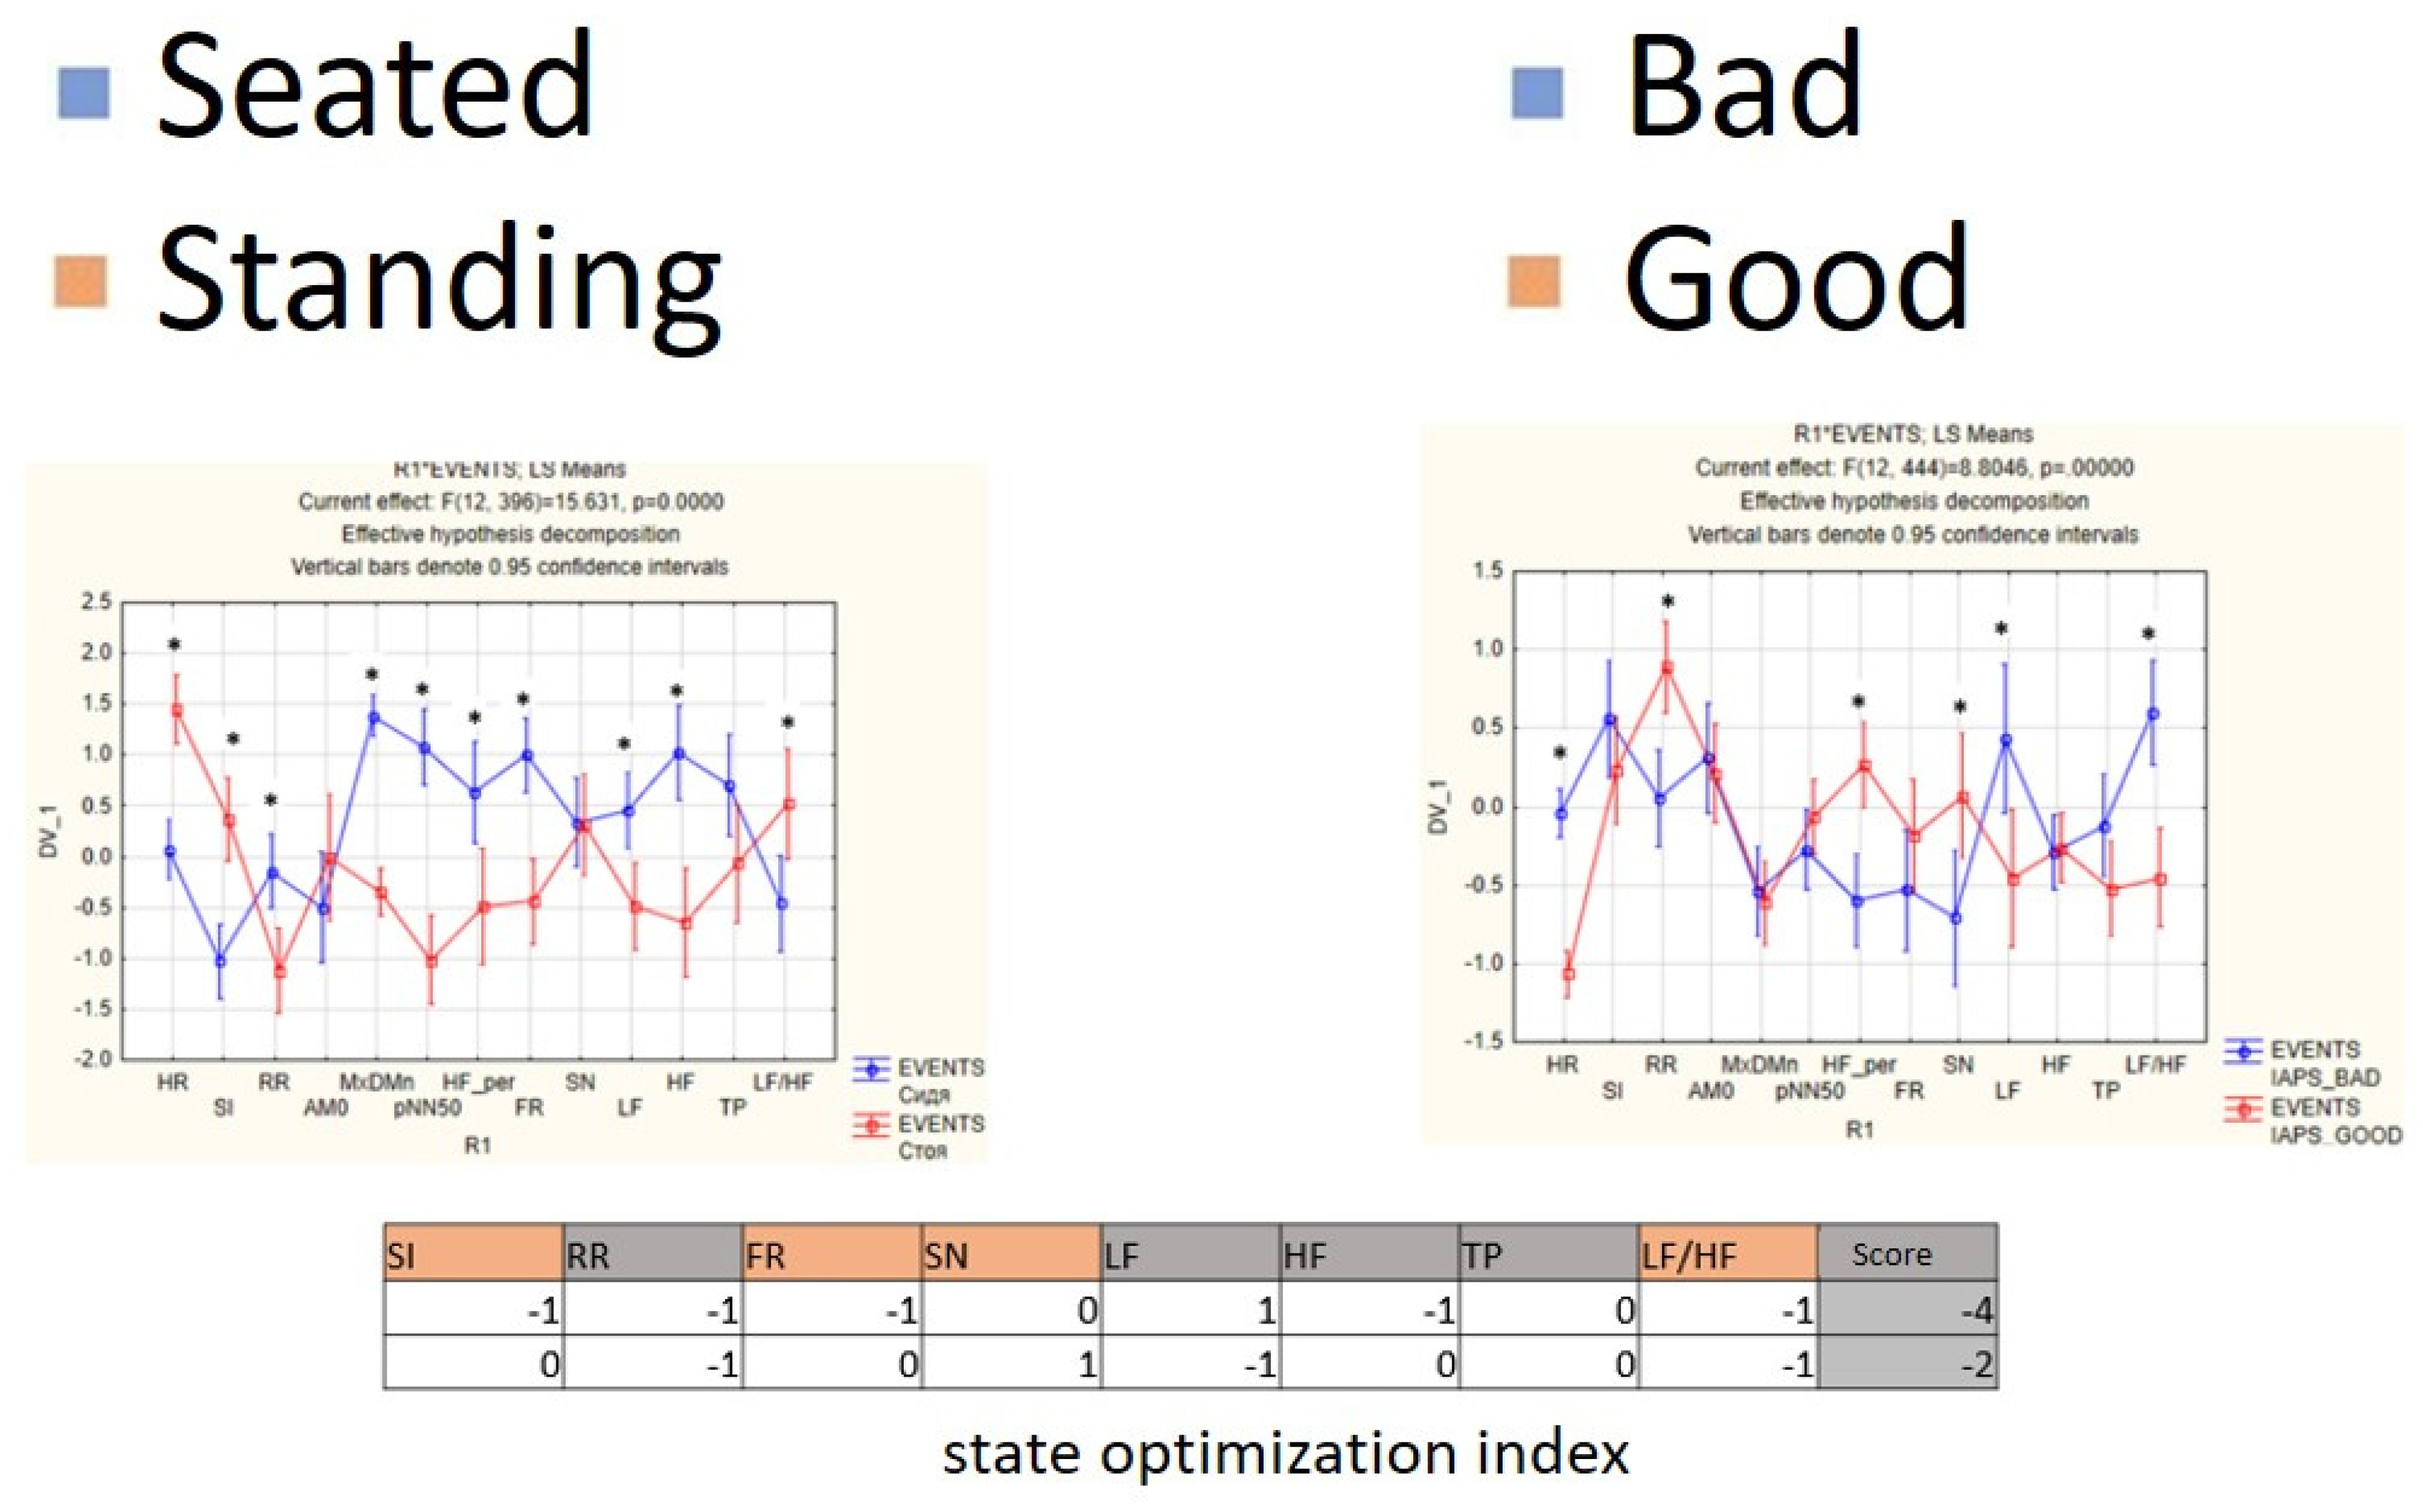
6.2. Influence of the Interaction of Multi-Modal Affective Stimuli on the Functional State
- (1)
- Average heart rate (HR);
- (2)
- Average RR-intervals;
- (3)
- Average power of the low-frequency band of the total HRV spectrum (LF);
- (4)
- Average power of the high-frequency band of the total HRV spectrum (HF);
- (5)
- Average ratio of the slow and fast band of the general HRV spectrum (a measure of sympathovagal balance) (LF / HF);
- (6)
- Average power of the HRV spectrum (TP);
- (7)
- Stress Index (SI);
- (8)
- Functional reserve (FR);
- (9)
- Stress Index (SN).
7. Discussion and Conclusions
- (1)
- self-diagnosis of the emotional state of the subject (SAM);
- (2)
- the level of emotional maladjustment (EML);
- (3)
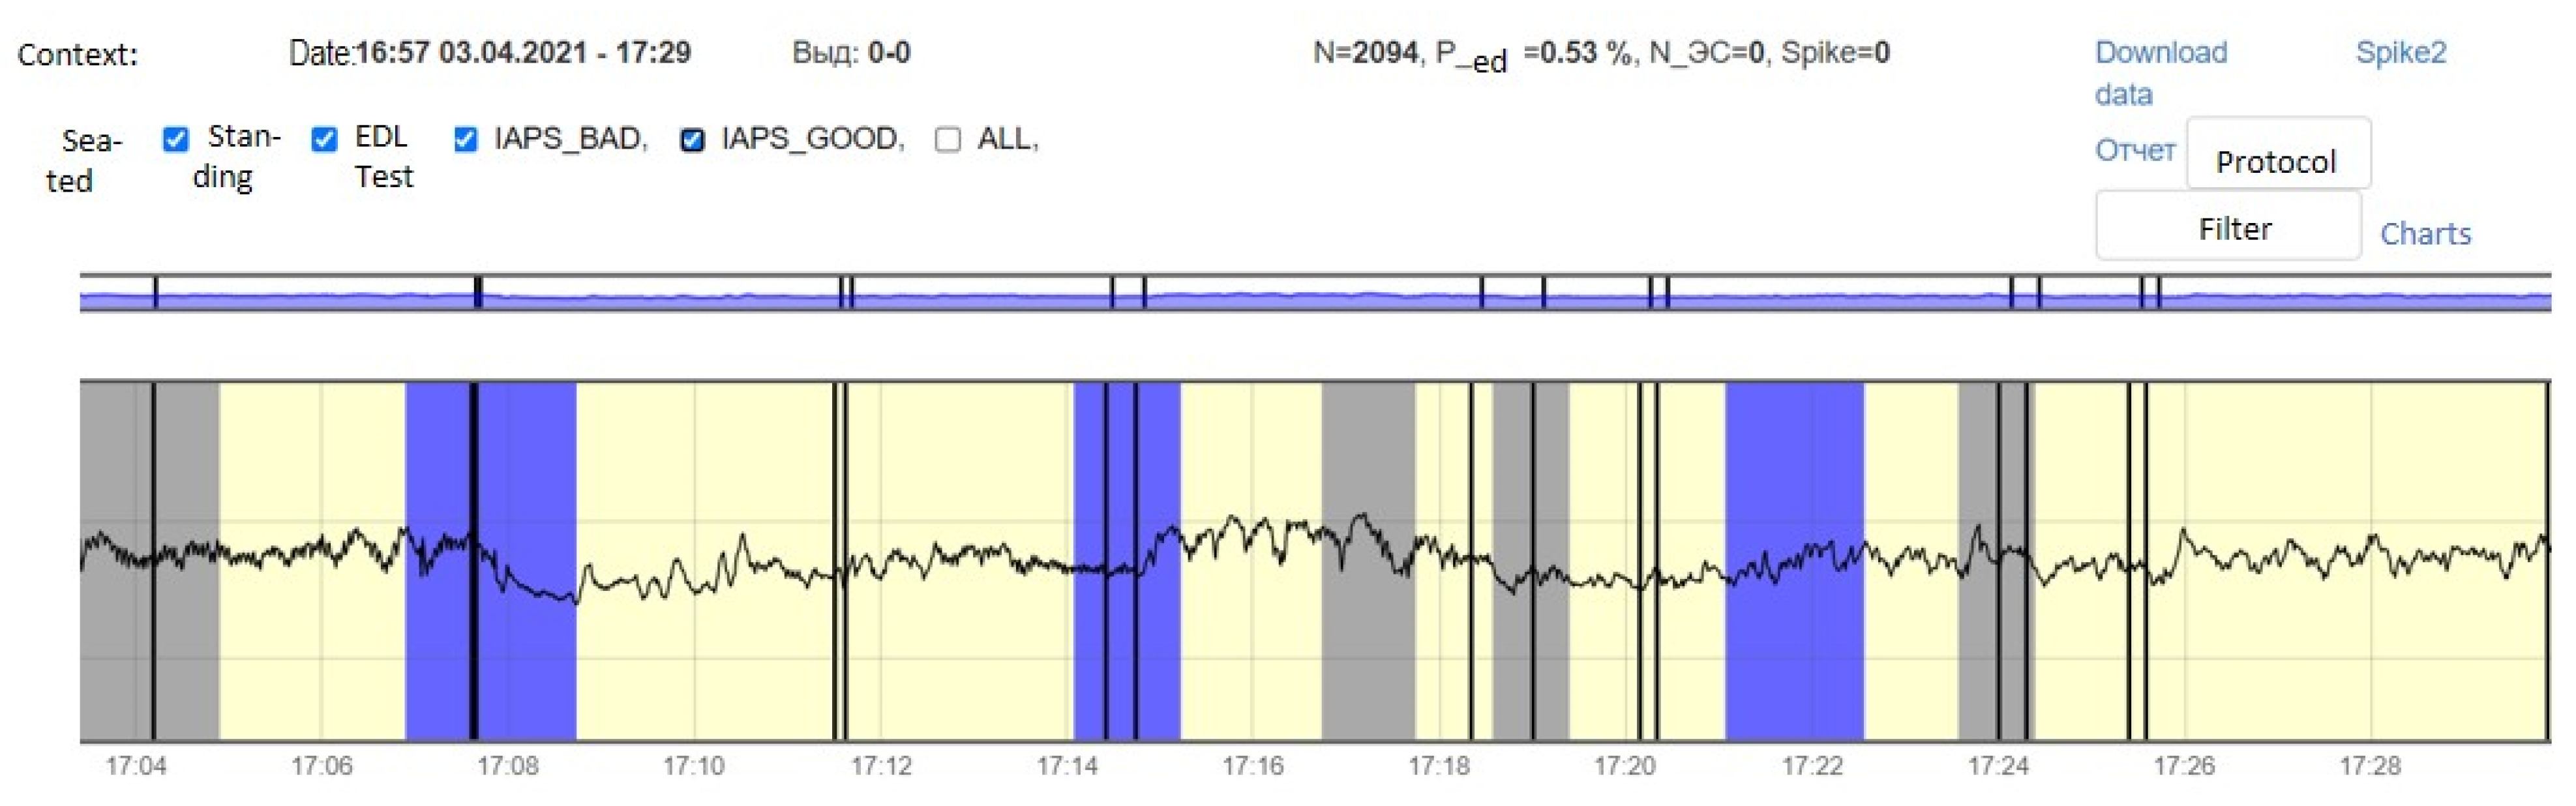
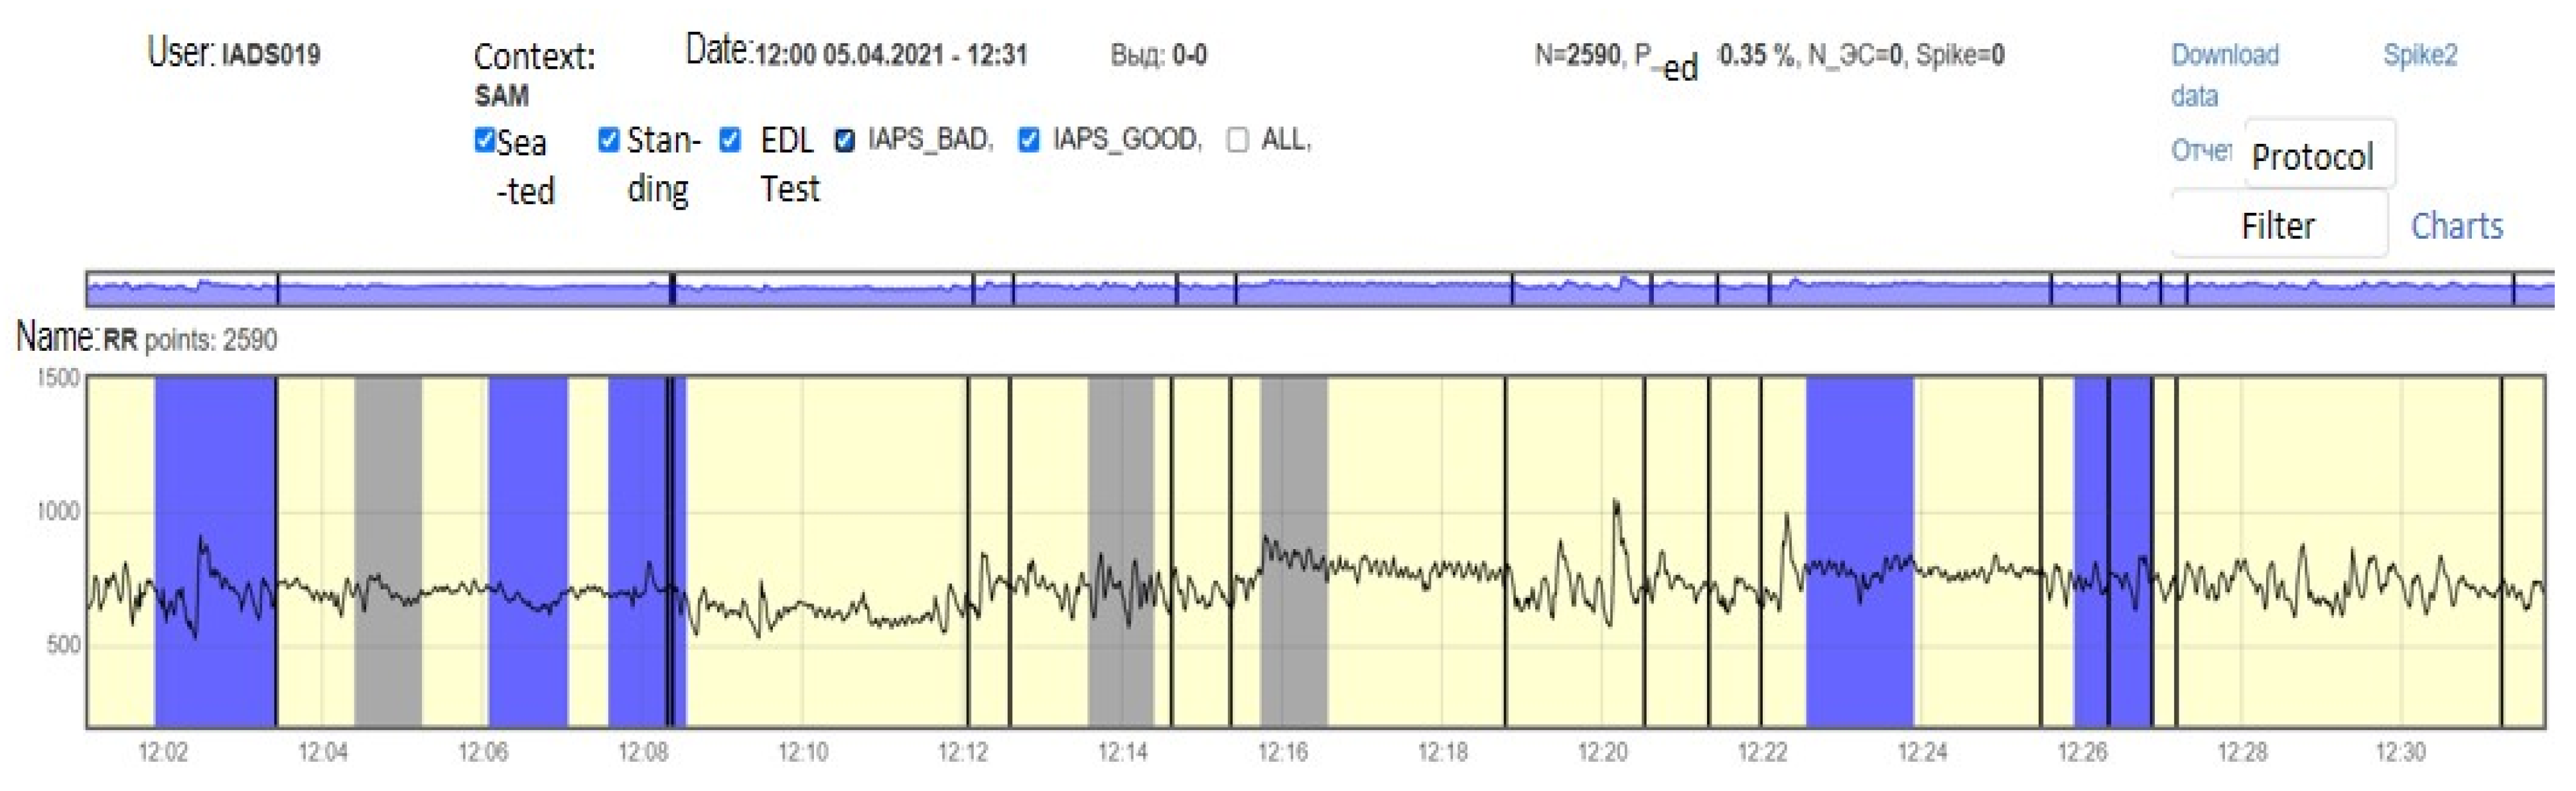
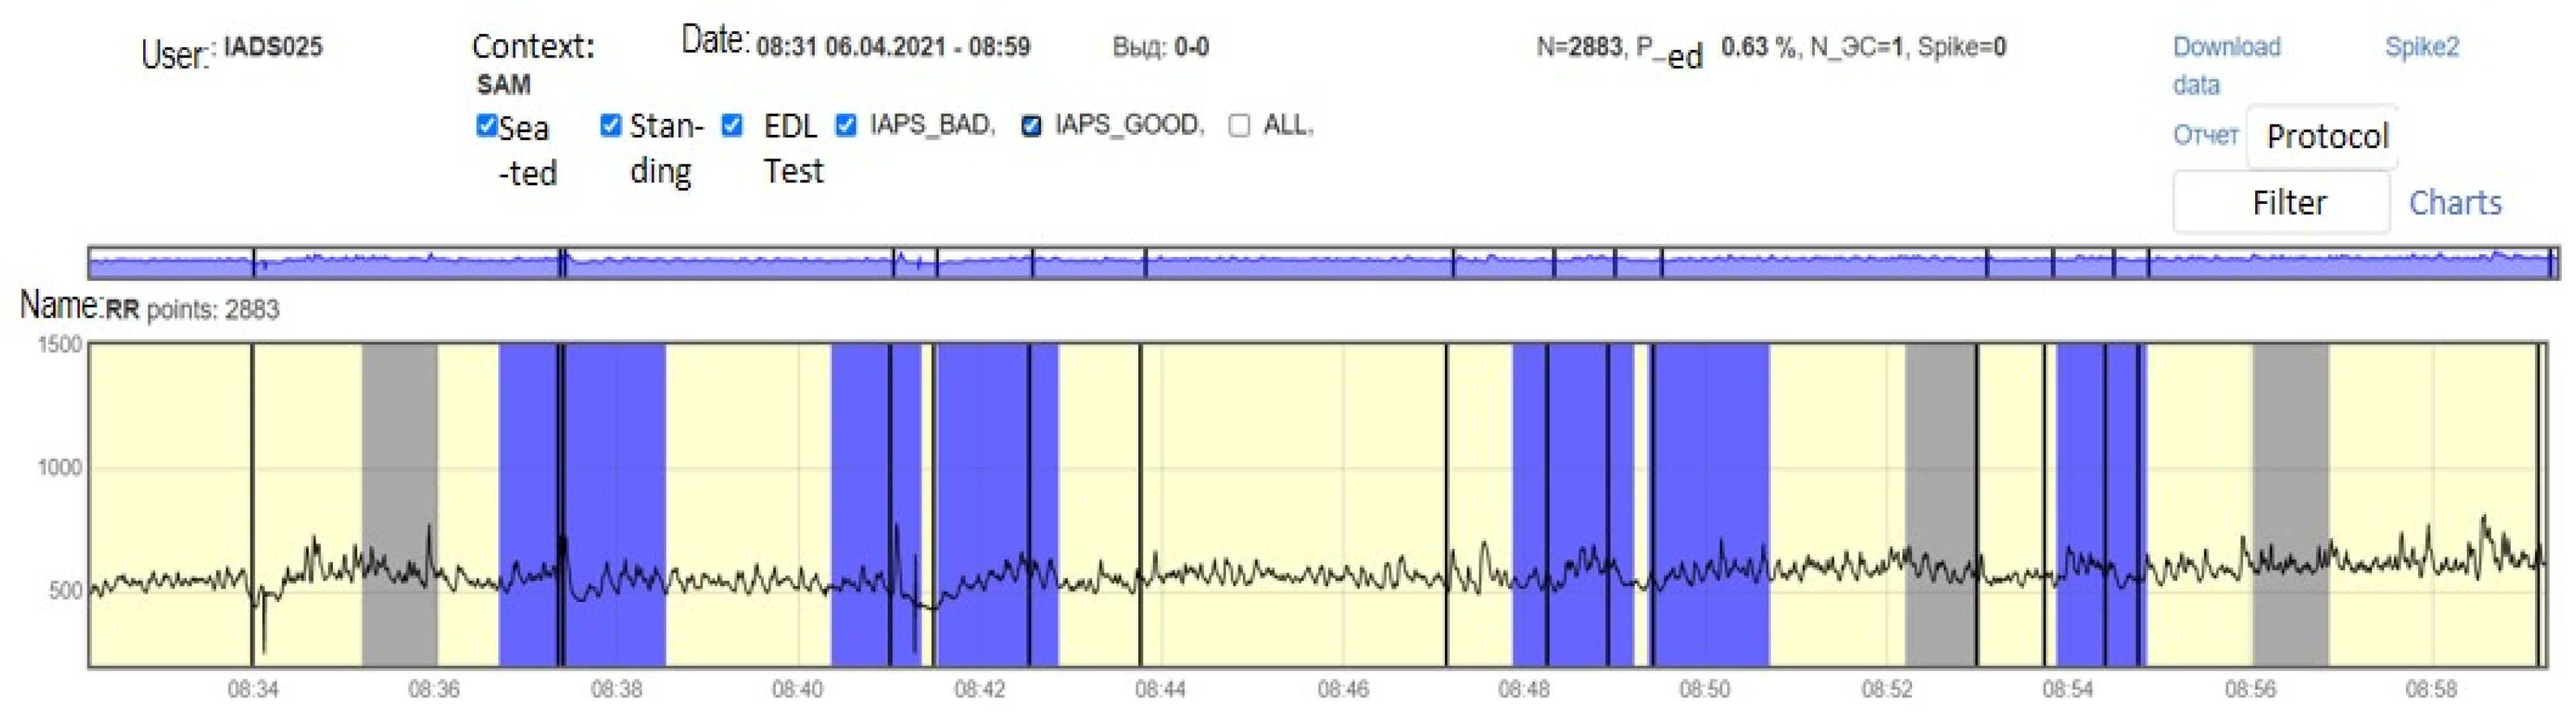
- telemetry of the heart rate.
- (a)
- This could be due to the specific mental characteristics of the population and the corresponding consequences in the perception of various information stimuli.
- (b)
- Also, the conditions of the experiment cannot be ideally reproduced, and the difference in the result can be explained by a slightly different (possibly more constraining) situation.
- (c)
- This could also be due to the peculiarities of the sample, its insufficient representativeness.
Author Contributions
Funding
Informed Consent Statement
Data Availability Statement
Conflicts of Interest
List of Abbreviations and Conventions
| Heart rate (HR) | heart rate |
| RR | RR-intervals |
| LF | the power of the spectrum at low frequencies |
| HF | power of the spectrum in the high-frequency region |
| LF/HF | ratio of spectrum powers in the region of low and high frequencies (vegetative balance index) |
| TP | the power of the HRV spectrum |
| SI | stress index |
| FR | functional reserve |
| SN | voltage degree (Amo/2Mo×mxDMn) |
| AM0 | the amplitude of the mode |
| MxDMn | variation range |
| pNN50 | the number in the percentage of pairs of the last normal intervals (without extrasystoles), differing by more than 50 MC |
| HF_per | the percentage of the spectrum in the high-frequency region |
| IAPS | International Affective Picture System (international system of affective pictures) |
| IADS | International Affective Digitized Sound system |
| SAM | Self-Assessment Manikin (model for self-assessment of emotions) |
| LEM | Monitoring the level of emotional maladjustment |
| IR/II | informational representations/images |
Appendix A

| IAPS, № | Name | Group | Valence | Arousal |
|---|---|---|---|---|
| 2209 | Bride | POS | 2.64 | 0.59 |
| 1710 | Puppies | POS | 3.34 | 0.41 |
| 2045 | Baby | POS | 2.87 | 0.47 |
| 2070 | Baby | POS | 3.17 | −0.49 |
| 2216 | Children | POS | 2.57 | 0.83 |
| 2340 | Family | POS | 3.03 | −0.1 |
| 2347 | Children | POS | 2.83 | 0.56 |
| 2550 | Couple | POS | 2.77 | −0.32 |
| 4220 | EroticFemale | POS | 3.02 | 2.17 |
| 4626 | Wedding | POS | 2.6 | 0.78 |
| 5480 | Fireworks | POS | 2.53 | 0.48 |
| 5825 | Sea | POS | 3.03 | 0.46 |
| 5830 | Sunset | POS | 3 | −0.08 |
| 5833 | Beach | POS | 3.22 | 0.71 |
| 5910 | Fireworks | POS | 2.8 | 0.59 |
| 7330 | IceCream | POS | 2.69 | 0.14 |
| 7502 | Castle | POS | 2.75 | 0.91 |
| 8170 | Sailboat | POS | 2.63 | 1.12 |
| 8190 | Skier | POS | 3.1 | 1.28 |
| 8200 | WaterSkier | POS | 2.54 | 1.35 |
| 8210 | Boat | POS | 2.53 | 0.94 |
| 8370 | Rafting | POS | 2.77 | 1.73 |
| 8420 | Tubing | POS | 2.76 | 0.56 |
| 8470 | Gymnast | POS | 2.74 | 1.14 |
| 8496 | WaterSlide | POS | 2.58 | 0.79 |
| 8499 | Rollercoaster | POS | 2.63 | 1.07 |
| 8501 | Money | POS | 2.91 | 1.44 |
| 8502 | Money | POS | 2.51 | 0.78 |
| 2095 | Toddler | NEG | −3.21 | 0.25 |
| 2205 | Hospital | NEG | −3.05 | −0.47 |
| 2345.1 | BlackEye | NEG | −2.74 | 0.5 |
| 2352.2 | BloodyKiss | NEG | −2.91 | 1.25 |
| 2375.1 | Woman | NEG | −2.8 | −0.12 |
| 3000 | Mutilation | NEG | −3.41 | 2.34 |
| 3001 | HeadlessBody | NEG | −3.38 | 1.64 |
| 3005.1 | OpenGrave | NEG | −3.37 | 1.2 |
| 3010 | Mutilation | NEG | −3.29 | 2.16 |
| 3100 | BurnVictim | NEG | −3.4 | 1.49 |
| 3103 | Injury | NEG | −2.93 | 1.06 |
| 3140 | DeadBody | NEG | −3.17 | 1.36 |
| 3195 | Stitches | NEG | −2.94 | 1.36 |
| 3261 | Tumor | NEG | −3.18 | 0.75 |
| 3266 | Injury | NEG | −3.44 | 1.79 |
| 3301 | InjuredChild | NEG | −3.2 | 0.21 |
| 3350 | Infant | NEG | −3.12 | 0.72 |
| 3530 | Attack | NEG | −3.2 | 1.82 |
| 9040 | StarvingChild | NEG | −3.33 | 0.82 |
| 9140 | Cow | NEG | −2.81 | 0.38 |
| 9183 | HurtDog | NEG | −3.31 | 1.58 |
| 9187 | InjuredDog | NEG | −3.19 | 1.45 |
| 9300 | Dirty | NEG | −2.74 | 1 |
| 9325 | Vomit | NEG | −3.11 | 1.01 |
| 9405 | SlicedHand | NEG | −3.17 | 1.08 |
| 9570 | Dog | NEG | −3.32 | 1.14 |
| 9571 | Cat | NEG | −3.04 | 0.64 |
| 9635.1 | ManOnFire | NEG | −3.1 | 1.54 |
| 1026 | Snake | NEUT | −0.91 | 0.61 |
| 1390 | Bees | NEUT | −0.5 | 0.29 |
| 1505 | DogRace | NEUT | −0.87 | −0.27 |
| 1560 | Hawk | NEUT | 0.97 | 0.51 |
| 1645 | Wolf | NEUT | −0.01 | 0.14 |
| 1820 | Crocodile | NEUT | 0.35 | 0.67 |
| 1908 | Jellyfish | NEUT | 0.28 | −0.12 |
| 1931 | Shark | NEUT | −1 | 1.8 |
| 2018 | VeiledWoman | NEUT | 0.56 | −0.08 |
| 2122 | TongueOut | NEUT | 0.15 | −0.41 |
| 2220 | MaleFace | NEUT | 0.03 | −0.07 |
| 2606 | Dance | NEUT | 0.92 | −0.22 |
| 4071 | AttractiveFem | NEUT | 0.97 | 0.14 |
| 4460 | EroticMale | NEUT | 0.6 | −0.06 |
| 5455 | Cockpit | NEUT | 0.79 | −0.44 |
| 5661 | Cave | NEUT | 0.96 | −0.85 |
| 5920 | Volcano | NEUT | 0.16 | 1.23 |
| 5940 | Lava | NEUT | −0.77 | 1.29 |
| 5950 | Lightning | NEUT | 0.99 | 1.79 |
| 6000 | Prison | NEUT | −0.96 | −0.09 |
| 6910 | Bomber | NEUT | 0.31 | 0.62 |
| 7240 | Gym | NEUT | 1.02 | 0.51 |
| 7402 | Pastry | NEUT | 0.98 | 0.05 |
| 7476 | Ramen | NEUT | −0.01 | −0.37 |
| 7497 | Crowd | NEUT | 0.19 | −0.03 |
| 7560 | Freeway | NEUT | −0.53 | 0.24 |
| 7600 | Dragon | NEUT | 0.9 | 0.5 |
| 7640 | Skyscraper | NEUT | 0 | 1.03 |
Appendix B
| IAPS, № | Name | Group | Valence (Rus) | Arousal (Rus) | Dominance (Rus) |
|---|---|---|---|---|---|
| 3266 | Injury | NEG | −3.44 | −0.88 | −0.23 |
| 3000 | Mutilation | NEG | −3.52 | 0.02 | −0.02 |
| 3100 | BurnVictim | NEG | −3.38 | −0.16 | 0.63 |
| 3001 | HeadlessBody | NEG | −2.55 | 0.09 | 0.08 |
| 3005.1 | OpenGrave | NEG | −3.53 | −0.23 | −0.01 |
| 9040 | StarvingChild | NEG | −2.26 | 0.14 | 0.67 |
| 9570 | Dog | NEG | −3.41 | −0.9 | −0.05 |
| 9183 | HurtDog | NEG | −2.91 | 0.19 | 0.04 |
| 2095 | Toddler | NEG | −1.54 | 1.73 | 1.46 |
| 3010 | Mutilation | NEG | −3.38 | −0.7 | 0.86 |
| 3530 | Attack | NEG | −1.88 | −0.28 | 1.58 |
| 3301 | InjuredChild | NEG | −2.11 | 0.47 | 1.22 |
| 9187 | InjuredDog | NEG | −2.89 | −1 | 0.23 |
| 3261 | Tumor | NEG | −3.48 | 0.56 | 0.02 |
| 9405 | SlicedHand | NEG | −2.26 | 0.4 | 0.69 |
| 3140 | DeadBody | NEG | −3.5 | 0.27 | 0.54 |
| 3350 | Infant | NEG | −1.13 | −0.64 | 0.7 |
| 9325 | Vomit | NEG | −1.68 | −0.71 | 0.76 |
| 9635.1 | ManOnFire | NEG | −2.19 | −0.02 | 1.51 |
| 2205 | Hospital | NEG | −2.77 | −0.21 | 0.93 |
| 9571 | Cat | NEG | −3.44 | −0.41 | 0.67 |
| 3195 | Stitches | NEG | −2.81 | 1.19 | 0.9 |
| 3103 | Injury | NEG | −2.89 | 1.19 | 1.3 |
| 2352.2 | BloodyKiss | NEG | −2.16 | −1.49 | 0.53 |
| 9140 | Cow | NEG | −3.24 | 0.18 | 0.58 |
| 2375.1 | Woman | NEG | −0.76 | 1.16 | 2.24 |
| 9300 | Dirty | NEG | −1.55 | −0.42 | 1.27 |
| 2345.1 | BlackEye | NEG | −2.84 | 1.61 | 1.27 |
| 7476 | Ramen | NEUT | 2.96 | −0.4 | 1.68 |
| 7402 | Pastry | NEUT | 2.79 | 0.74 | 2.25 |
| 4071 | AttractiveFem | NEUT | 2.56 | −0.02 | 2.15 |
| 5661 | Cave | NEUT | 2.55 | 0.49 | 2.89 |
| 7600 | Dragon | NEUT | 2.26 | 0.52 | 2.9 |
| 1560 | Hawk | NEUT | 1.89 | 0.53 | 2.87 |
| 1390 | Bees | NEUT | 1.83 | 0.34 | 2.45 |
| 1908 | Jellyfish | NEUT | 1.75 | −0.27 | 2.32 |
| 7560 | Freeway | NEUT | 1.71 | −0.24 | 2.61 |
| 5950 | Lightning | NEUT | 1.65 | 0.35 | 2.41 |
| 2018 | VeiledWoman | NEUT | 1.53 | 0.16 | 2.74 |
| 5455 | Cockpit | NEUT | 1.26 | 0.84 | 3.07 |
| 1026 | Snake | NEUT | 1.23 | 0.55 | 2.28 |
| 1505 | DogRace | NEUT | 1.18 | 0.79 | 2.39 |
| 1820 | Crocodile | NEUT | 1.05 | 0.03 | 2.52 |
| 2606 | Dance | NEUT | 1.03 | 0.86 | 2.83 |
| 1645 | Wolf | NEUT | 0.79 | −0.07 | 2.23 |
| 7497 | Crowd | NEUT | 0.61 | 0.21 | 2.71 |
| 7240 | Gym | NEUT | 0.58 | 1.02 | 2.98 |
| 1931 | Shark | NEUT | 0.57 | 0.15 | 2.32 |
| 6000 | Prison | NEUT | 0.49 | 0.1 | 2.86 |
| 2122 | TongueOut | NEUT | 0.33 | 0.66 | 2.88 |
| 5920 | Volcano | NEUT | 0.29 | 1.1 | 2.49 |
| 4460 | EroticMale | NEUT | −0.42 | 1.13 | 2.77 |
| 6910 | Bomber | NEUT | −0.46 | −0.14 | 2.61 |
| 2220 | MaleFace | NEUT | −0.56 | 0.18 | 2.77 |
| 7640 | Skyscraper | NEUT | −1.32 | 2.22 | 1.52 |
| 5940 | Lava | NEUT | −1.51 | 1.61 | 2.29 |
| 1710 | Puppies | POS | 3.46 | 0.11 | 1.61 |
| 7330 | IceCream | POS | 3.26 | 0.13 | 1.79 |
| 4220 | EroticFemale | POS | 3.1 | 0.59 | 2.21 |
| 5833 | Beach | POS | 3.1 | 0.06 | 1.75 |
| 5825 | Sea | POS | 2.58 | 1.84 | 2.12 |
| 8170 | Sailboat | POS | 2.41 | 1.2 | 2.41 |
| 2550 | Couple | POS | 2.36 | 2 | 2.32 |
| 8190 | Skier | POS | 2.31 | 0.37 | 2.85 |
| 7502 | Castle | POS | 2.25 | 1.64 | 2.62 |
| 2347 | Children | POS | 2.23 | 1.67 | 2.09 |
| 2045 | Baby | POS | 2.21 | 0.59 | 2.76 |
| 2340 | Family | POS | 2.2 | 0.16 | 1.93 |
| 2209 | Bride | POS | 2.16 | 1.38 | 2.55 |
| 8370 | Rafting | POS | 2.12 | 0.97 | 2.63 |
| 5830 | Sunset | POS | 2.09 | 0.54 | 1.57 |
| 8210 | Boat | POS | 2.08 | 1.18 | 2.29 |
| 2070 | Baby | POS | 1.86 | 0.78 | 1.97 |
| 5910 | Fireworks | POS | 1.85 | 0.85 | 2.72 |
| 4626 | Wedding | POS | 1.84 | 0.34 | 2.72 |
| 8420 | Tubing | POS | 1.5 | 0.06 | 2.34 |
| 5480 | Fireworks | POS | 1.43 | 1.05 | 3.05 |
| 8496 | WaterSlide | POS | 1.41 | 0.27 | 2.17 |
| 8470 | Gymnast | POS | 1.33 | 0.14 | 2.48 |
| 8499 | Rollercoaster | POS | 1.21 | 0.5 | 2.45 |
| 8501 | Money | POS | 1.21 | 0.42 | 2.26 |
| 2216 | Children | POS | 1.16 | 0.95 | 2.14 |
| 8502 | Money | POS | 0.88 | −0.06 | 1.97 |
| 8200 | WaterSkier | POS | 0.86 | 1.73 | 2.65 |
Appendix C
| IAPS, № | Name | Group | Valmn (Eng) | Aromn (Eng) | Arosd (Eng) | Valence (Rus) | Arousal (Rus) | Dominance (Rus) |
|---|---|---|---|---|---|---|---|---|
| 1710 | Puppies | POS | 3.34 | 0.41 | −2.66 | 3.46 | 0.11 | 1.61 |
| 7330 | IceCream | POS | 2.69 | 0.14 | −2.42 | 3.26 | 0.13 | 1.79 |
| 4220 | Erotic Female | POS | 3.02 | 2.17 | −2.31 | 3.1 | 0.59 | 2.21 |
| 5833 | Beach | POS | 3.22 | 0.71 | −2.34 | 3.1 | 0.06 | 1.75 |
| 8170 | Sailboat | POS | 2.63 | 1.12 | −2.7 | 2.41 | 1.2 | 2.41 |
| 2550 | Couple | POS | 2.77 | −0.32 | −2.57 | 2.36 | 2 | 2.32 |
| 8190 | Skier | POS | 3.1 | 1.28 | −2.43 | 2.31 | 0.37 | 2.85 |
| 7502 | Castle | POS | 2.75 | 0.91 | −2.69 | 2.25 | 1.64 | 2.62 |
| 2347 | Children | POS | 2.83 | 0.56 | −2.66 | 2.23 | 1.67 | 2.09 |
| 2340 | Family | POS | 3.03 | −0.1 | −2.8 | 2.2 | 0.16 | 1.93 |
| 2209 | Bride | POS | 2.64 | 0.59 | −2.63 | 2.16 | 1.38 | 2.55 |
| 8370 | Rafting | POS | 2.77 | 1.73 | −2.76 | 2.12 | 0.97 | 2.63 |
| 3005.1 | Open Grave | NEG | −3.37 | 1.2 | −2.46 | −3.53 | −0.23 | −0.01 |
| 3000 | Mutilation | NEG | −3.41 | 2.34 | −2.73 | −3.52 | 0.02 | −0.02 |
| 3140 | DeadBody | NEG | −3.17 | 1.36 | −3.03 | −3.5 | 0.27 | 0.54 |
| 3261 | Tumor | NEG | −3.18 | 0.75 | −2.36 | −3.48 | 0.56 | 0.02 |
| 3266 | Injury | NEG | −3.44 | 1.79 | −2.91 | −3.44 | −0.88 | −0.23 |
| 9571 | Cat | NEG | −3.04 | 0.64 | −2.5 | −3.44 | −0.41 | 0.67 |
| 9570 | Dog | NEG | −3.32 | 1.14 | −2.69 | −3.41 | −0.9 | −0.05 |
| 3010 | Mutilation | NEG | −3.21 | 2.26 | −3.14 | −3.38 | −0.7 | 0.86 |
| 3100 | Burn Victim | NEG | −3.4 | 1.49 | −2.77 | −3.38 | −0.16 | 0.63 |
| 9140 | Cow | NEG | −2.81 | 0.38 | −2.81 | −3.24 | 0.18 | 0.58 |
| 9183 | HurtDog | NEG | −3.31 | 1.58 | −2.88 | −2.91 | 0.19 | 0.04 |
| 3103 | Injury | NEG | −2.93 | 1.06 | −2.7 | −2.89 | 1.19 | 1.3 |
References
- Pavlov, S.V.; Reva, N.V.; Loktev, K.V.; Korenek, V.V.; Aftanas, L. Effect of meditation practice on cardiovascular response in the perception and cognitive reevaluation of emotiogenic stimuli of emotion. Russ. J. Physiol. 2015, 101, 360–373. [Google Scholar]
- Vasanov, A.Y.; Marchenko, O.P.; Sevostyanova, M.S. Selection of culturally specific emotionally colored photographs for experimental research. Exp. Psychol. 2013, 6, 105–114. [Google Scholar]
- Kandilarova, S.; Stoyanov, D.; Stoeva, M. Functional MRI in Depression—Multivariate Analysis of Emotional Task. J. Med. Biol. Eng. 2020, 40, 535–544. [Google Scholar] [CrossRef]
- Matokhina, A.A. Study of the influence of classical music on the functional state of people of various professions. Faces Knowl. 2013, 2, 69–72. [Google Scholar]
- Efremova, G.I.; Kovaleva, M.A.; Bochkovskaya, I.A.; Novikova, G.V. Possibility of using the method of analysis of thermographic images in the diagnosis of emotional and stressful states. Personal. Educ. 2016, 4, 181–187. [Google Scholar]
- Podladchikova, L.N.; Koltunova, T.I.; Shaposhnikov, D.G.; Lomakina, O.V. Individual characteristics of the examination of emotionally significant images. Russ. J. Physiol. 2016, 102, 618–627. [Google Scholar]
- Kwang-Ho, C.; Junbeom, K.O.; Sang, K.; Min, J.K.; Yeon, H.R.; Ji-Eun, P. Is heart rate variability (HRV) an adequate tool for evaluating human emotions? A focus on the use of the International Affective Picture System (IAPS). Psychiatry Res. 2017, 251, 192–196. [Google Scholar] [CrossRef]
- Smolyaninova, S.V. Investigation of the relationship between the degree of extraversion and the effectiveness of the use of various musical programs in the correction of the mental state of operators. Leningr. State Univ. Bull. 2017, 2, 126–134. [Google Scholar]
- Jafarova, O.A.; Danilenko, E.N. Neurobiocontrol in the correction of attention deficit hyperactivity disorder in schoolchildren. Open Educ. 2016, 2, 94–96. [Google Scholar]
- Moskalionov, P.P. Ecological and Physiological Assessment of the Influence of Acoustic Signals on Human Adaptation. Abstract of. Ph.D. Thesis, Peoples’ Friendship University of Russia, Moscow, Russia, 2008. [Google Scholar]
- Kosonogov, V.V.; Martinez-Selva, H.M.; Sanchez-Navarro, H.P. Review of modern methods for measuring the physiological signs of a sign and the strength of emotional states. Theor. Exp. Psychol. 2017, 10, 63–78. [Google Scholar]
- Baevsky, R.M.; Ivanov, G.G.; Chireikin, L.V.; Gavrilushkin, A.P.; Dovgalevsky, P.Y.; Kukushkin, Y.A.; Mironova, T.F.; Prilutsky, D.A.; Semenov, A.V.V.; Fedorov, V.F.; et al. Analysis of heart rate variability using various electrocardiographic systems. Anthropol. Bull. 2001, 24, 65–87. [Google Scholar]
- Izard, K.E. Psychology of Emotions; Publishing House “Piter”: Saint-Petersburg, Russia, 2000. [Google Scholar]
- Alexandrov, Y.I. Psychophysiology: Textbook for Universities, 4th ed.; Peter: St. Petersburg, FL, USA, 2017. [Google Scholar]
- Anokhin, K.V. Gene Probes for Mapping Neural Networks during Training. Principles and Mechanisms of Human Brain Activity; Nauka: Leningrad, USSR, 1989. [Google Scholar]
- Petukhov, A.Y.; Polevaya, S.A. Modeling of cognitive brain activity through the Information Images Theory in terms of the bilingual Stroop test. Int. J. Biomath. 2017, 10, 1750092. [Google Scholar] [CrossRef]
- Shcholkin, K.I. Physics of the Microworld; Nauka: Moscow, USSR, 1980. [Google Scholar]
- Petukhov, A.Y. Modeling the information activity of the human brain based on quantum field theory and virtual particles. In Proceedings of the Scientific School Dynamics of Complex Networks and their Applications (DCNA’2021), Kaliningrad, Russia, 6–9 September 2021; pp. 157–161. [Google Scholar]
- Edward, F.; Pace-Schott, E.F.; Amole, M.C.; Aue, T.; Balconi, M.; Bylsma, L.M.; Critchley, H.; Van Elzakker, M.B. Physiological feelings. Neurosci. Biobehav. Rev. 2019, 103, 267–304. [Google Scholar] [CrossRef]
- Kovaleva, A.V.; Panova, E.N.; Gorbacheva, A.K. Analysis of heart rate variability and the possibility of its application. Contemp. Foreign Psychol. 2013, 1, 35–50. [Google Scholar]
- Haeseon, Y.; Albrecht, F.; Niels, P.; Tom, B.; Fadi, M. A Pilot Study of Emotion Detection using Sensors in a Learning Context: Towards an Affective Learning Companion. In Proceedings of the DeLFI and GMW Workshops, Chemnitz, Germany, 5 September 2017; Volume 2092, pp. 54–65. [Google Scholar]
- Ferdinando, H.; Ye, L.; Seppanen, T.; Alasaarela, E. Emotion Recognition by Heart Rate Variability. Aust. J. Basic Appl. 2014, 14, 50–55. [Google Scholar]
- Koval, P.; Butler, E.A.; Hollenstein, T.; Lanteigne, D.; Kuppens, P. Emotion regulation and the temporal dynamics of emotions: Effects of cognitive reappraisal and expressive suppression on emotional inertia. Cogn. Emot. 2015, 29, 830–851. [Google Scholar] [CrossRef] [PubMed]
- Polevaya, S.A.; Parin, S.B.; Eremin, E.V.; Bulanov, N.A.; Chernova, M.A. Development of event-related telemetry technology for the study of cognitive functions. XVIII International Scientific and Technical Conference “Neuroinformatics—2016”: Collection of scientific papers. MEPhI 2016, 1, 34–44. [Google Scholar] [CrossRef]
- Bradley, M.M.; Lang, P.J. The International Affective Digitized Sounds IADS-2: Affective Ratings of Sounds and Instruction Manual, 2nd ed.; The Center for Research in Psychophysiology, University of Florida: Gainesville, FL, USA, 2007; pp. 29–46. [Google Scholar]
- Lang, P.J.; Bradley, M.M.; Cuthbert, B.N. International Affective Picture System (IAPS): Instruction Manual and Affective Ratings; Technical Report A-4; The Center for Research in Psychophysiology, University of Florida: Gainesville, FL, USA, 1999. [Google Scholar]
- Lang, P.J.; Bradley, M.M.; Cuthbert, B.N. International Affective Picture System (IAPS): Affective Ratings of Pictures and Instruction Manual; Technical Report A-8; University of Florida: Gainesville, FL, USA, 2008; pp. 1–14. [Google Scholar]
- Stevenson, R.A.; James, T.W. Affective auditory stimuli: Characterization of the International Affective Digitized Sounds (IADS) by discrete emotional categories. Behav. Res. Methods 2008, 40, 315–321. [Google Scholar] [CrossRef] [PubMed] [Green Version]
- Mauss, I.B. Measures of emotion. A review. Cogn. Emot. 2009, 23, 209–237. [Google Scholar] [CrossRef] [PubMed]
- Runova, E.V.; Grigorieva, V.N.; Bakhchina, A.V.; Parin, S.B.; Shishalov, I.S.; Kozhevnikov, V.V.; Nekrasova, M.M.; Karatushina, D.I.; Grigorieva, K.A.A.; Polevaya, S.A. Vegetative correlates of voluntary displays of emotional stress. STM 2013, 5, 69–77. [Google Scholar]


| Comparison Pairs | Valid | T | Z | p-Value |
|---|---|---|---|---|
| Sbad+Pbad & Sbad+Pgood | 11 | 3.00 | 2.67 | 0.01 |
| Sbad+Pbad & Sgood + Pbad | 21 | 9.00 | 3.70 | 0.00 |
| Sbad+Pbad & Sgood + Pgood | 13 | 9.00 | 2.55 | 0.01 |
| Sbad+Pbad & Pbad | 11 | 0.00 | 2.93 | 0.00 |
| Sbad+Pbad & Sbad | 12 | 10.50 | 2.24 | 0.03 |
| Sbad+Pbad & Pgood | 15 | 0.00 | 3.41 | 0.00 |
| Sbad+Pbad & Sgood | 15 | 0.00 | 3.41 | 0.00 |
| Sbad+Pgood & Sgood + Pbad | 15 | 4.00 | 3.18 | 0.00 |
| Sbad+Pgood & Pgood | 13 | 2.00 | 3.04 | 0.00 |
| Sbad+Pgood & Sgood | 14 | 1.50 | 3.20 | 0.00 |
| Sgood+Pbad & Sgood + Pgood | 14 | 4.50 | 3.01 | 0.00 |
| Sgood+Pbad & Pbad | 15 | 2.00 | 3.29 | 0.00 |
| Sgood+Pbad & Sbad | 15 | 1.00 | 3.35 | 0.00 |
| Sgood+Pgood & Pgood | 13 | 7.50 | 2.66 | 0.01 |
| Sgood+Pgood & Sgood | 13 | 0.00 | 3.18 | 0.00 |
| Pbad & Pgood | 14 | 2.00 | 3.17 | 0.00 |
| Pbad & Sgood | 15 | 3.00 | 3.24 | 0.00 |
| Sbad & Pgood | 15 | 0.00 | 3.41 | 0.00 |
| Sbad & Sgood | 14 | 0.00 | 3.30 | 0.00 |
Publisher’s Note: MDPI stays neutral with regard to jurisdictional claims in published maps and institutional affiliations. |
© 2022 by the authors. Licensee MDPI, Basel, Switzerland. This article is an open access article distributed under the terms and conditions of the Creative Commons Attribution (CC BY) license (https://creativecommons.org/licenses/by/4.0/).
Share and Cite
Petukhov, A.Y.; Polevaya, S.A.; Polevaya, A.V. Experimental Diagnostics of the Emotional State of Individuals Using External Stimuli and a Model of Neurocognitive Brain Activity. Diagnostics 2022, 12, 125. https://doi.org/10.3390/diagnostics12010125
Petukhov AY, Polevaya SA, Polevaya AV. Experimental Diagnostics of the Emotional State of Individuals Using External Stimuli and a Model of Neurocognitive Brain Activity. Diagnostics. 2022; 12(1):125. https://doi.org/10.3390/diagnostics12010125
Chicago/Turabian StylePetukhov, Alexandr Y., Sofia A. Polevaya, and Anna V. Polevaya. 2022. "Experimental Diagnostics of the Emotional State of Individuals Using External Stimuli and a Model of Neurocognitive Brain Activity" Diagnostics 12, no. 1: 125. https://doi.org/10.3390/diagnostics12010125
APA StylePetukhov, A. Y., Polevaya, S. A., & Polevaya, A. V. (2022). Experimental Diagnostics of the Emotional State of Individuals Using External Stimuli and a Model of Neurocognitive Brain Activity. Diagnostics, 12(1), 125. https://doi.org/10.3390/diagnostics12010125