
Left Ventricular Diastolic Function Studied with Magnetic Resonance Imaging: A Systematic Review of Techniques and Relation to Established Measures of Diastolic Function

 , and
, and
Abstract
1. Introduction
2. Materials and Methods
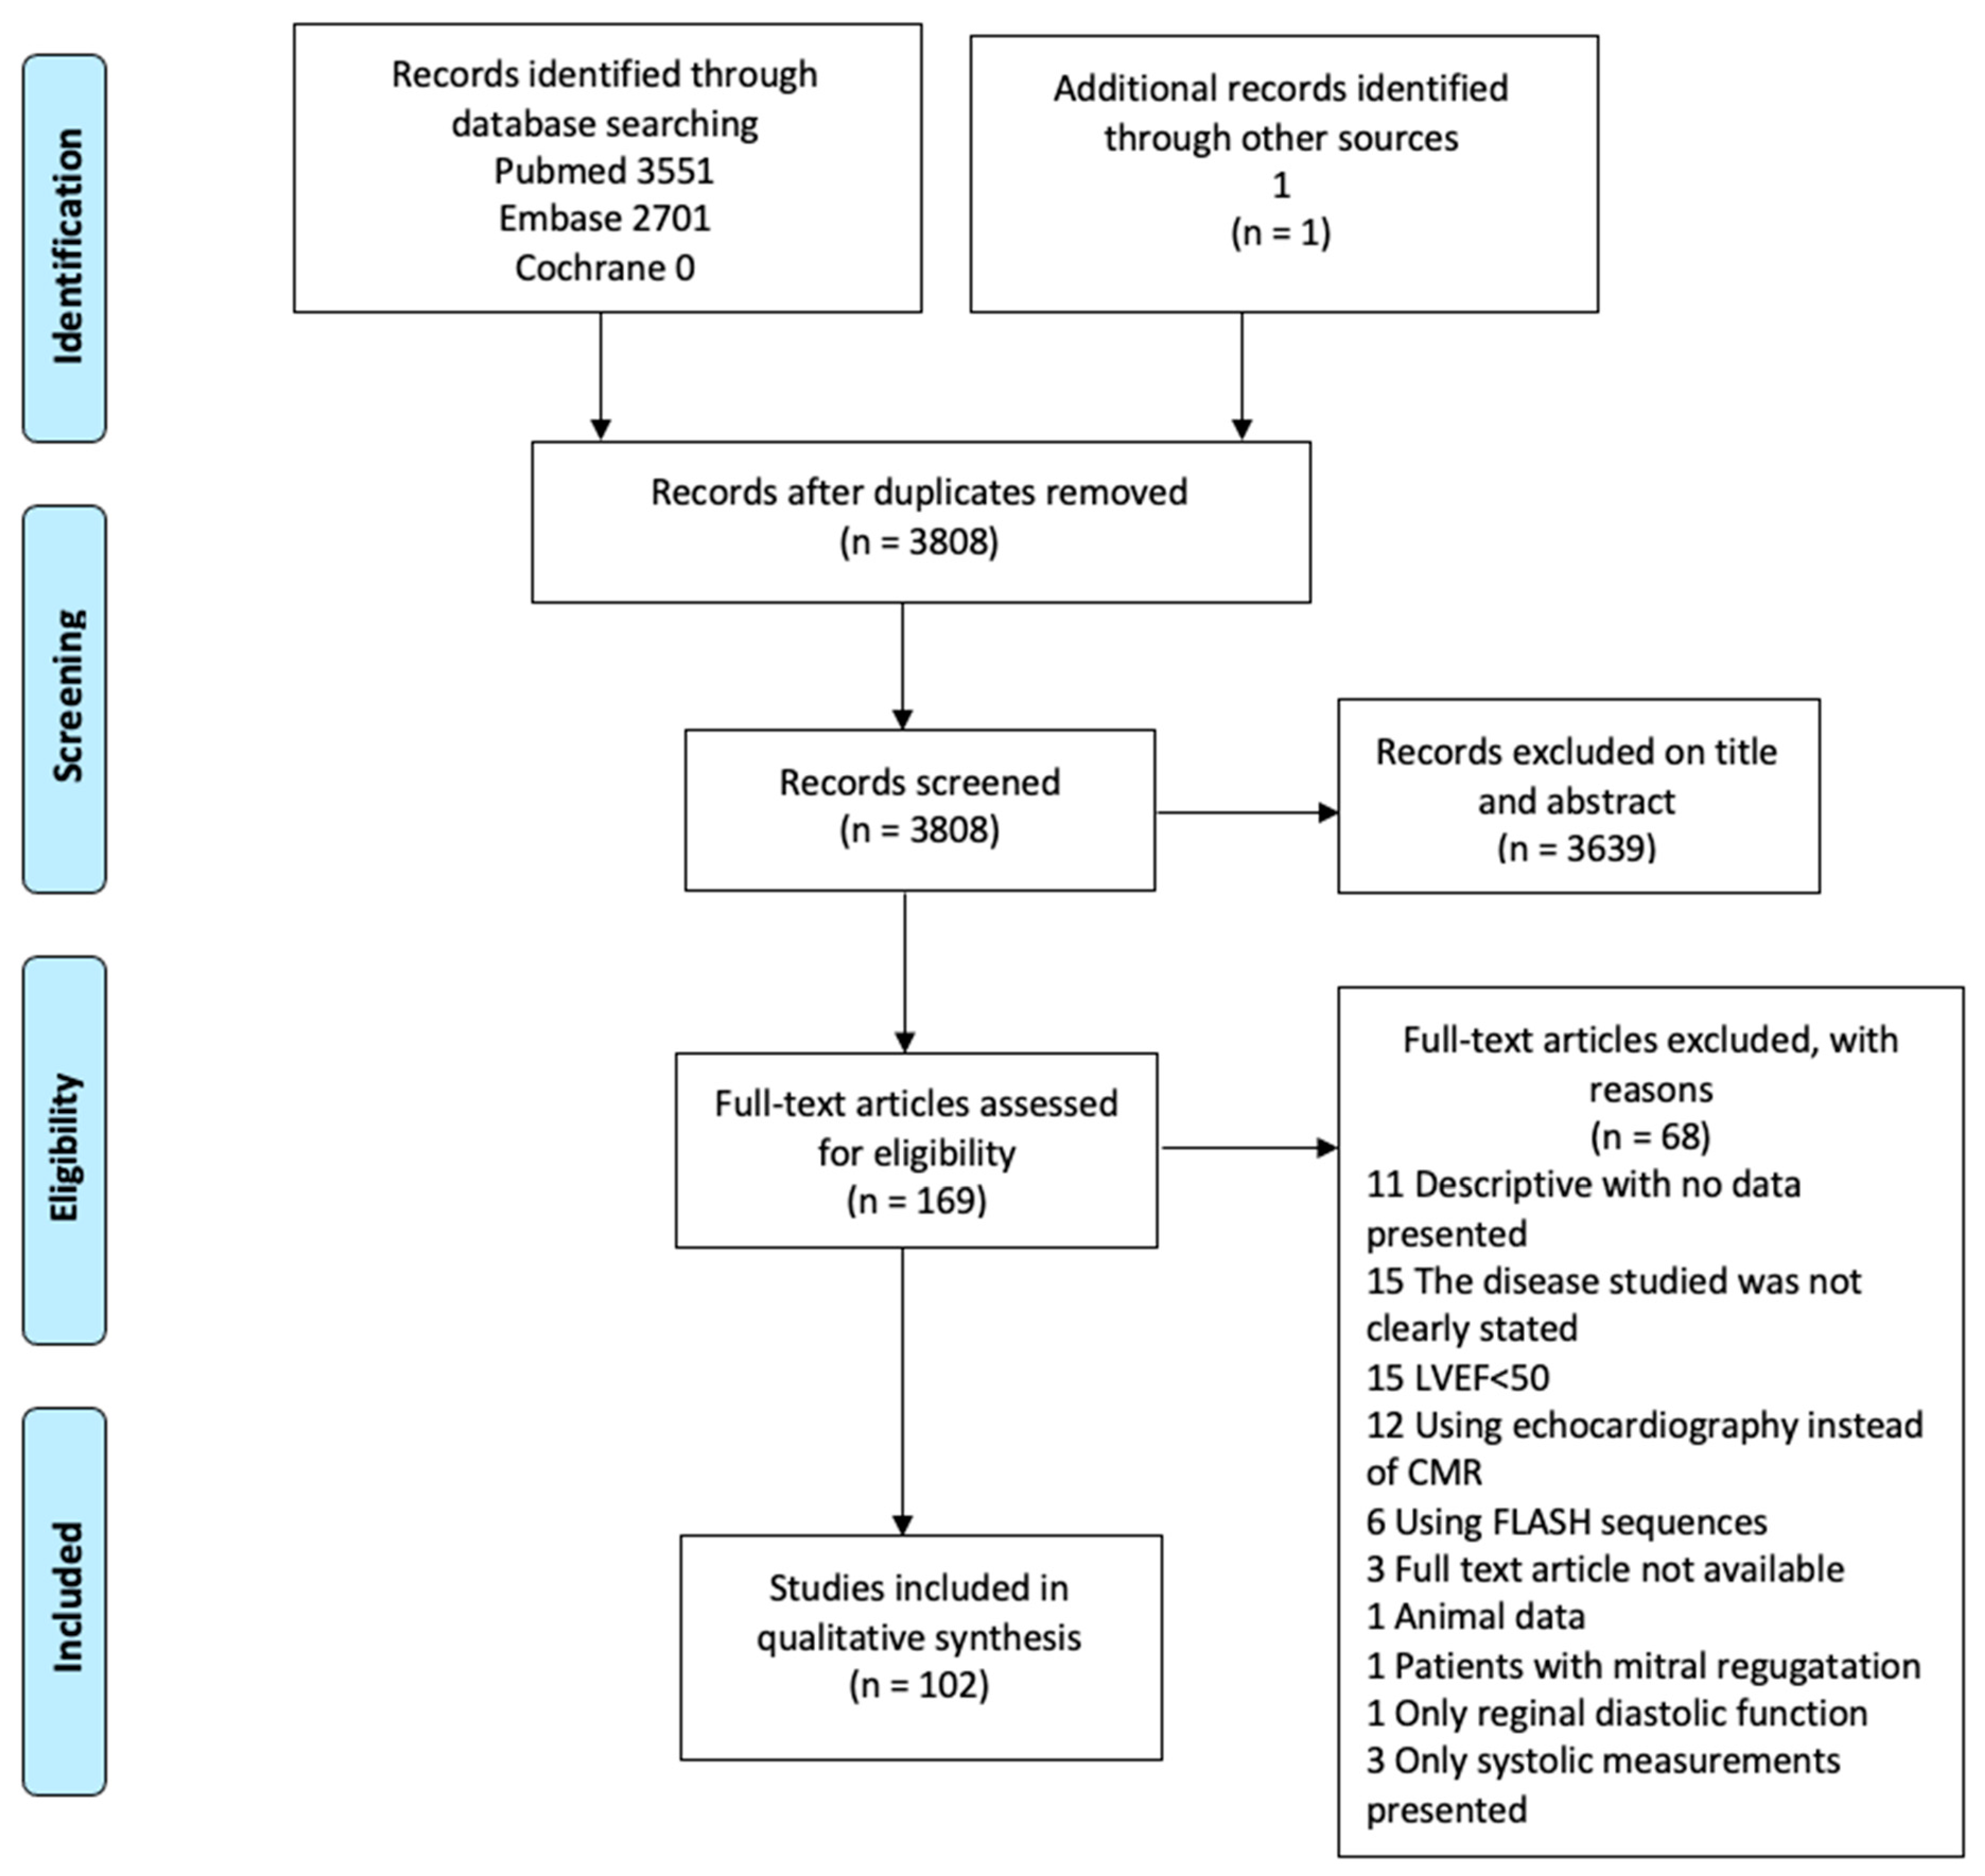
2.1. Systematic Search and Eligible Studies
2.2. Data Collection
3. Results and Discussion
3.1. CMR Tagging—Brief Description
3.2. CMR Tagging—Diastolic Rotation/Untwisting
3.3. CMR Tagging—Diastolic Strain Rates
3.4. CMR Tagging—Time to Peak Untwist
3.5. CMR Tagging—Peak Change of Torsion Shear Angle versus Volume Changes in Early Diastole (−dφ′/dV′)
3.6. CMR Tagging—Summarized
3.7. LV and LA Time/Volume Curves—Brief Description
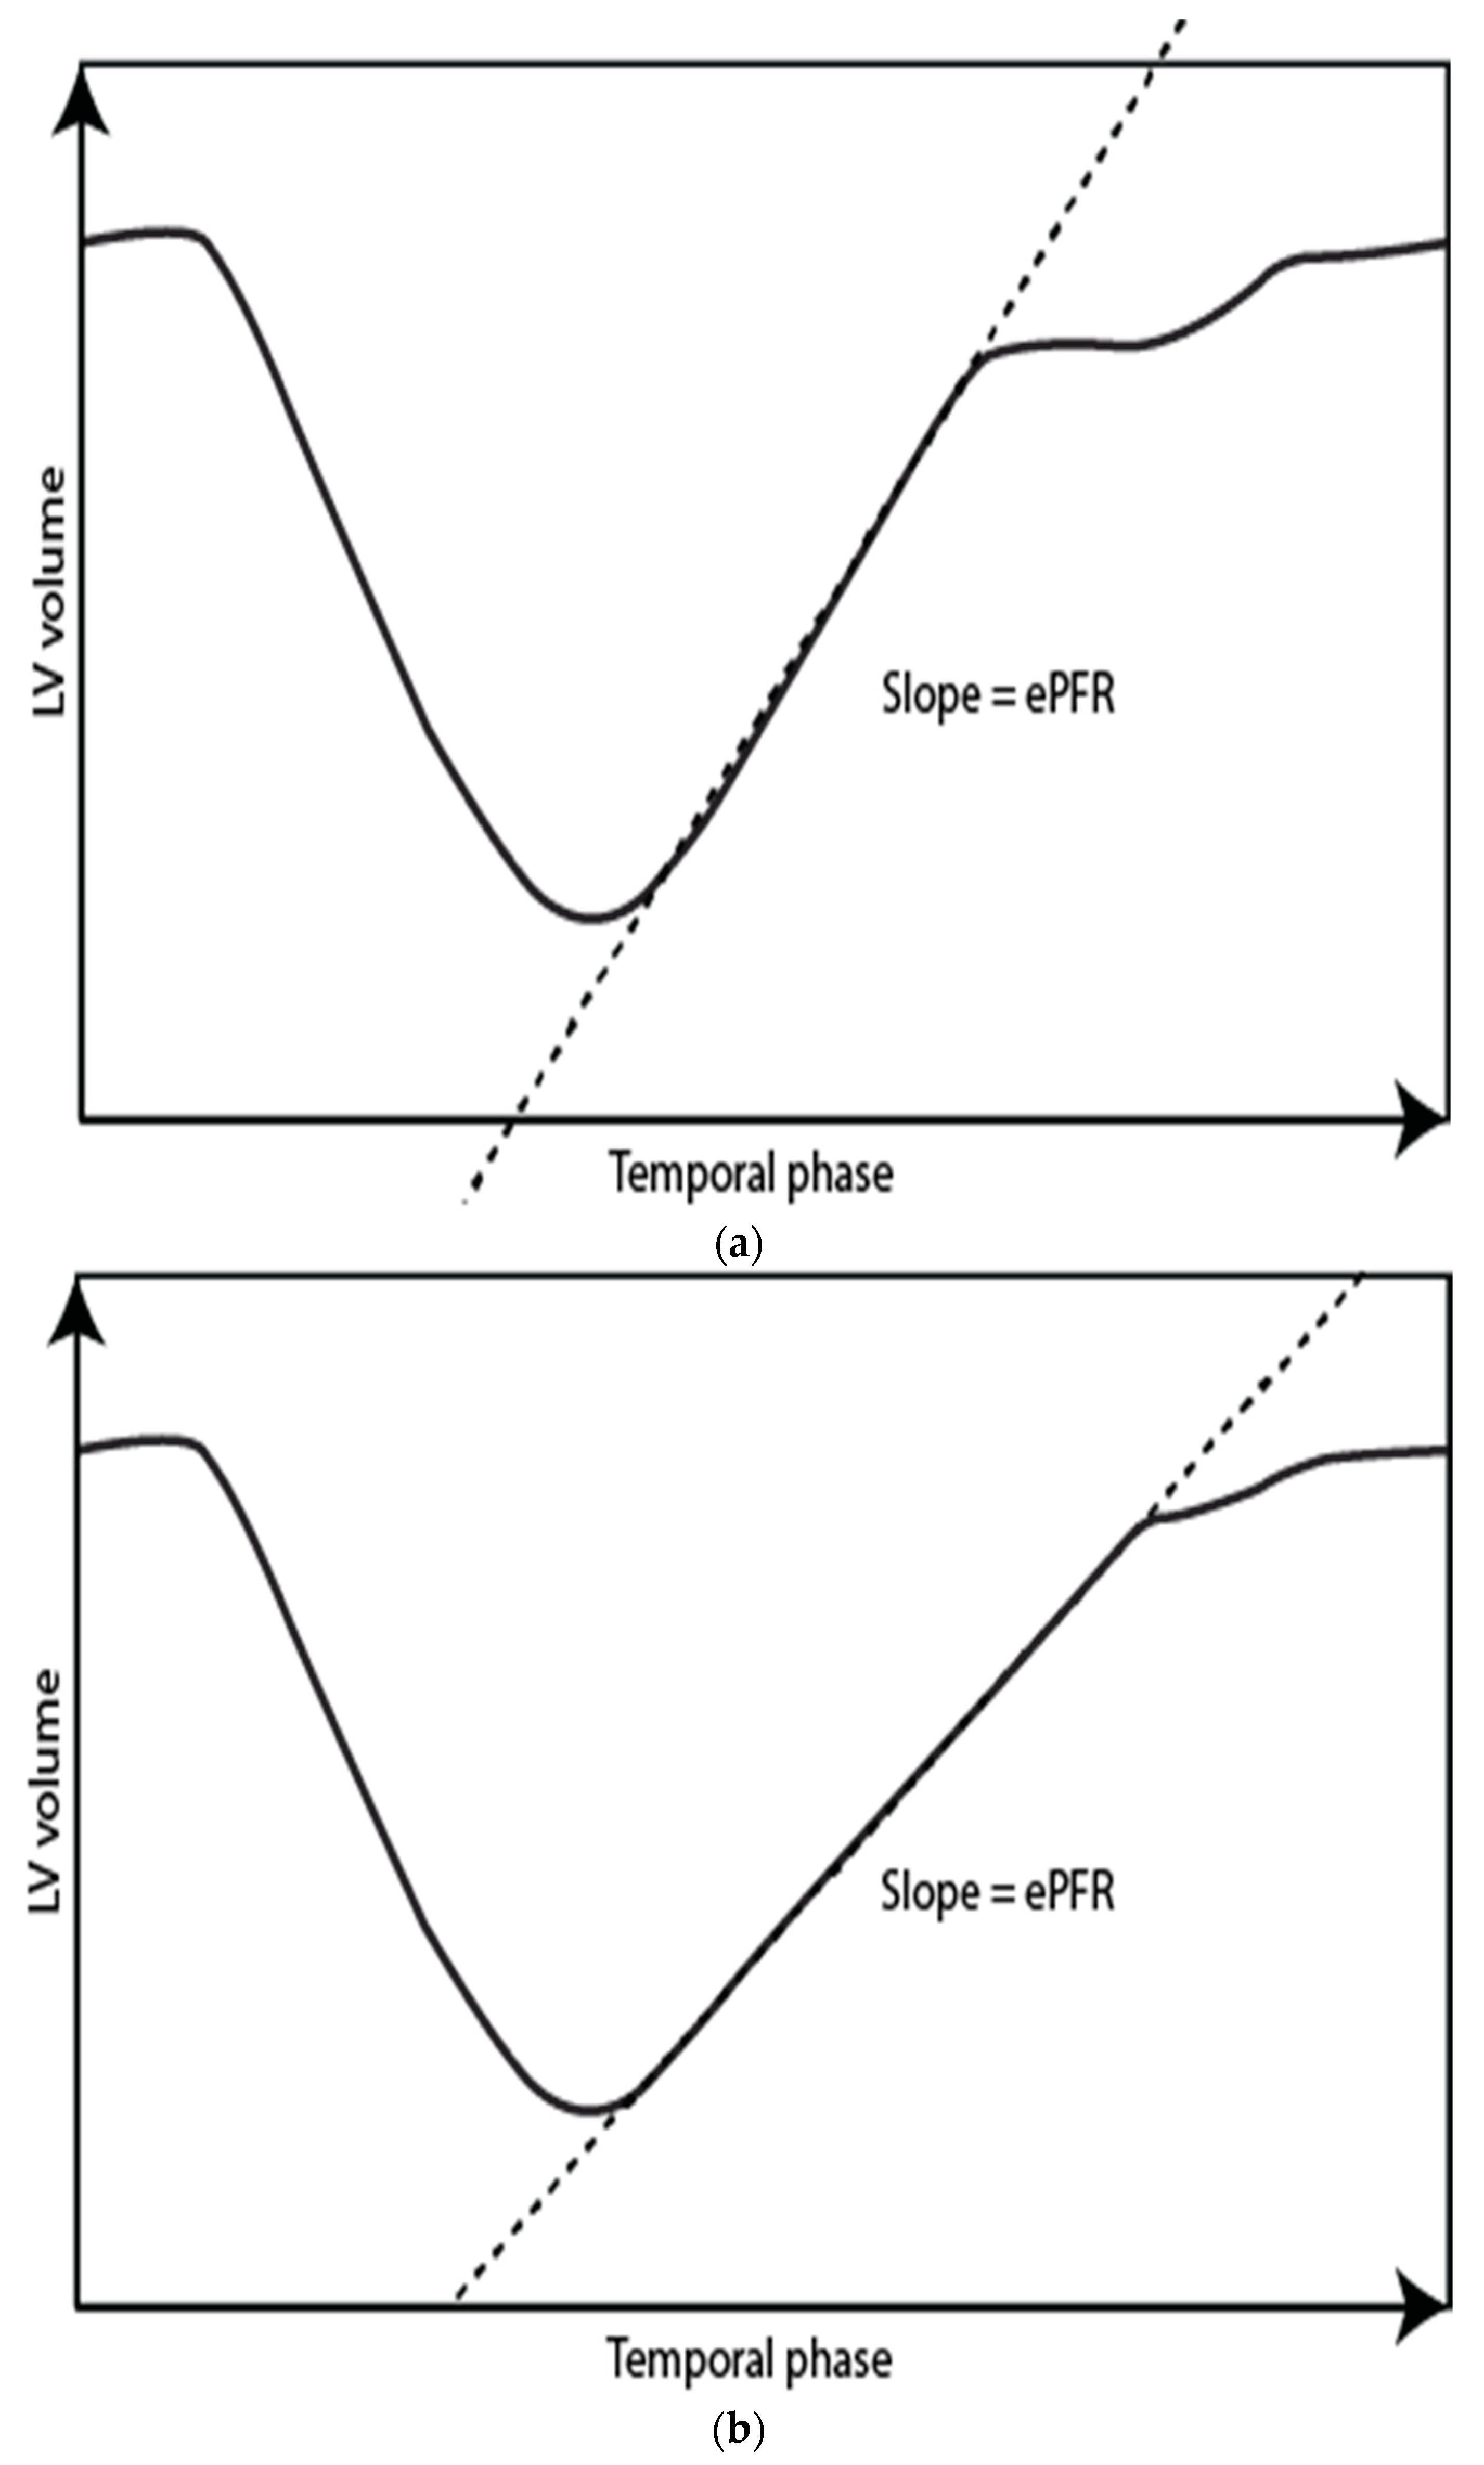
3.8. LV Time/Volume Curves—Early and Active Peak Filling Rate
3.9. LV Time/Volume Curve—Summarized
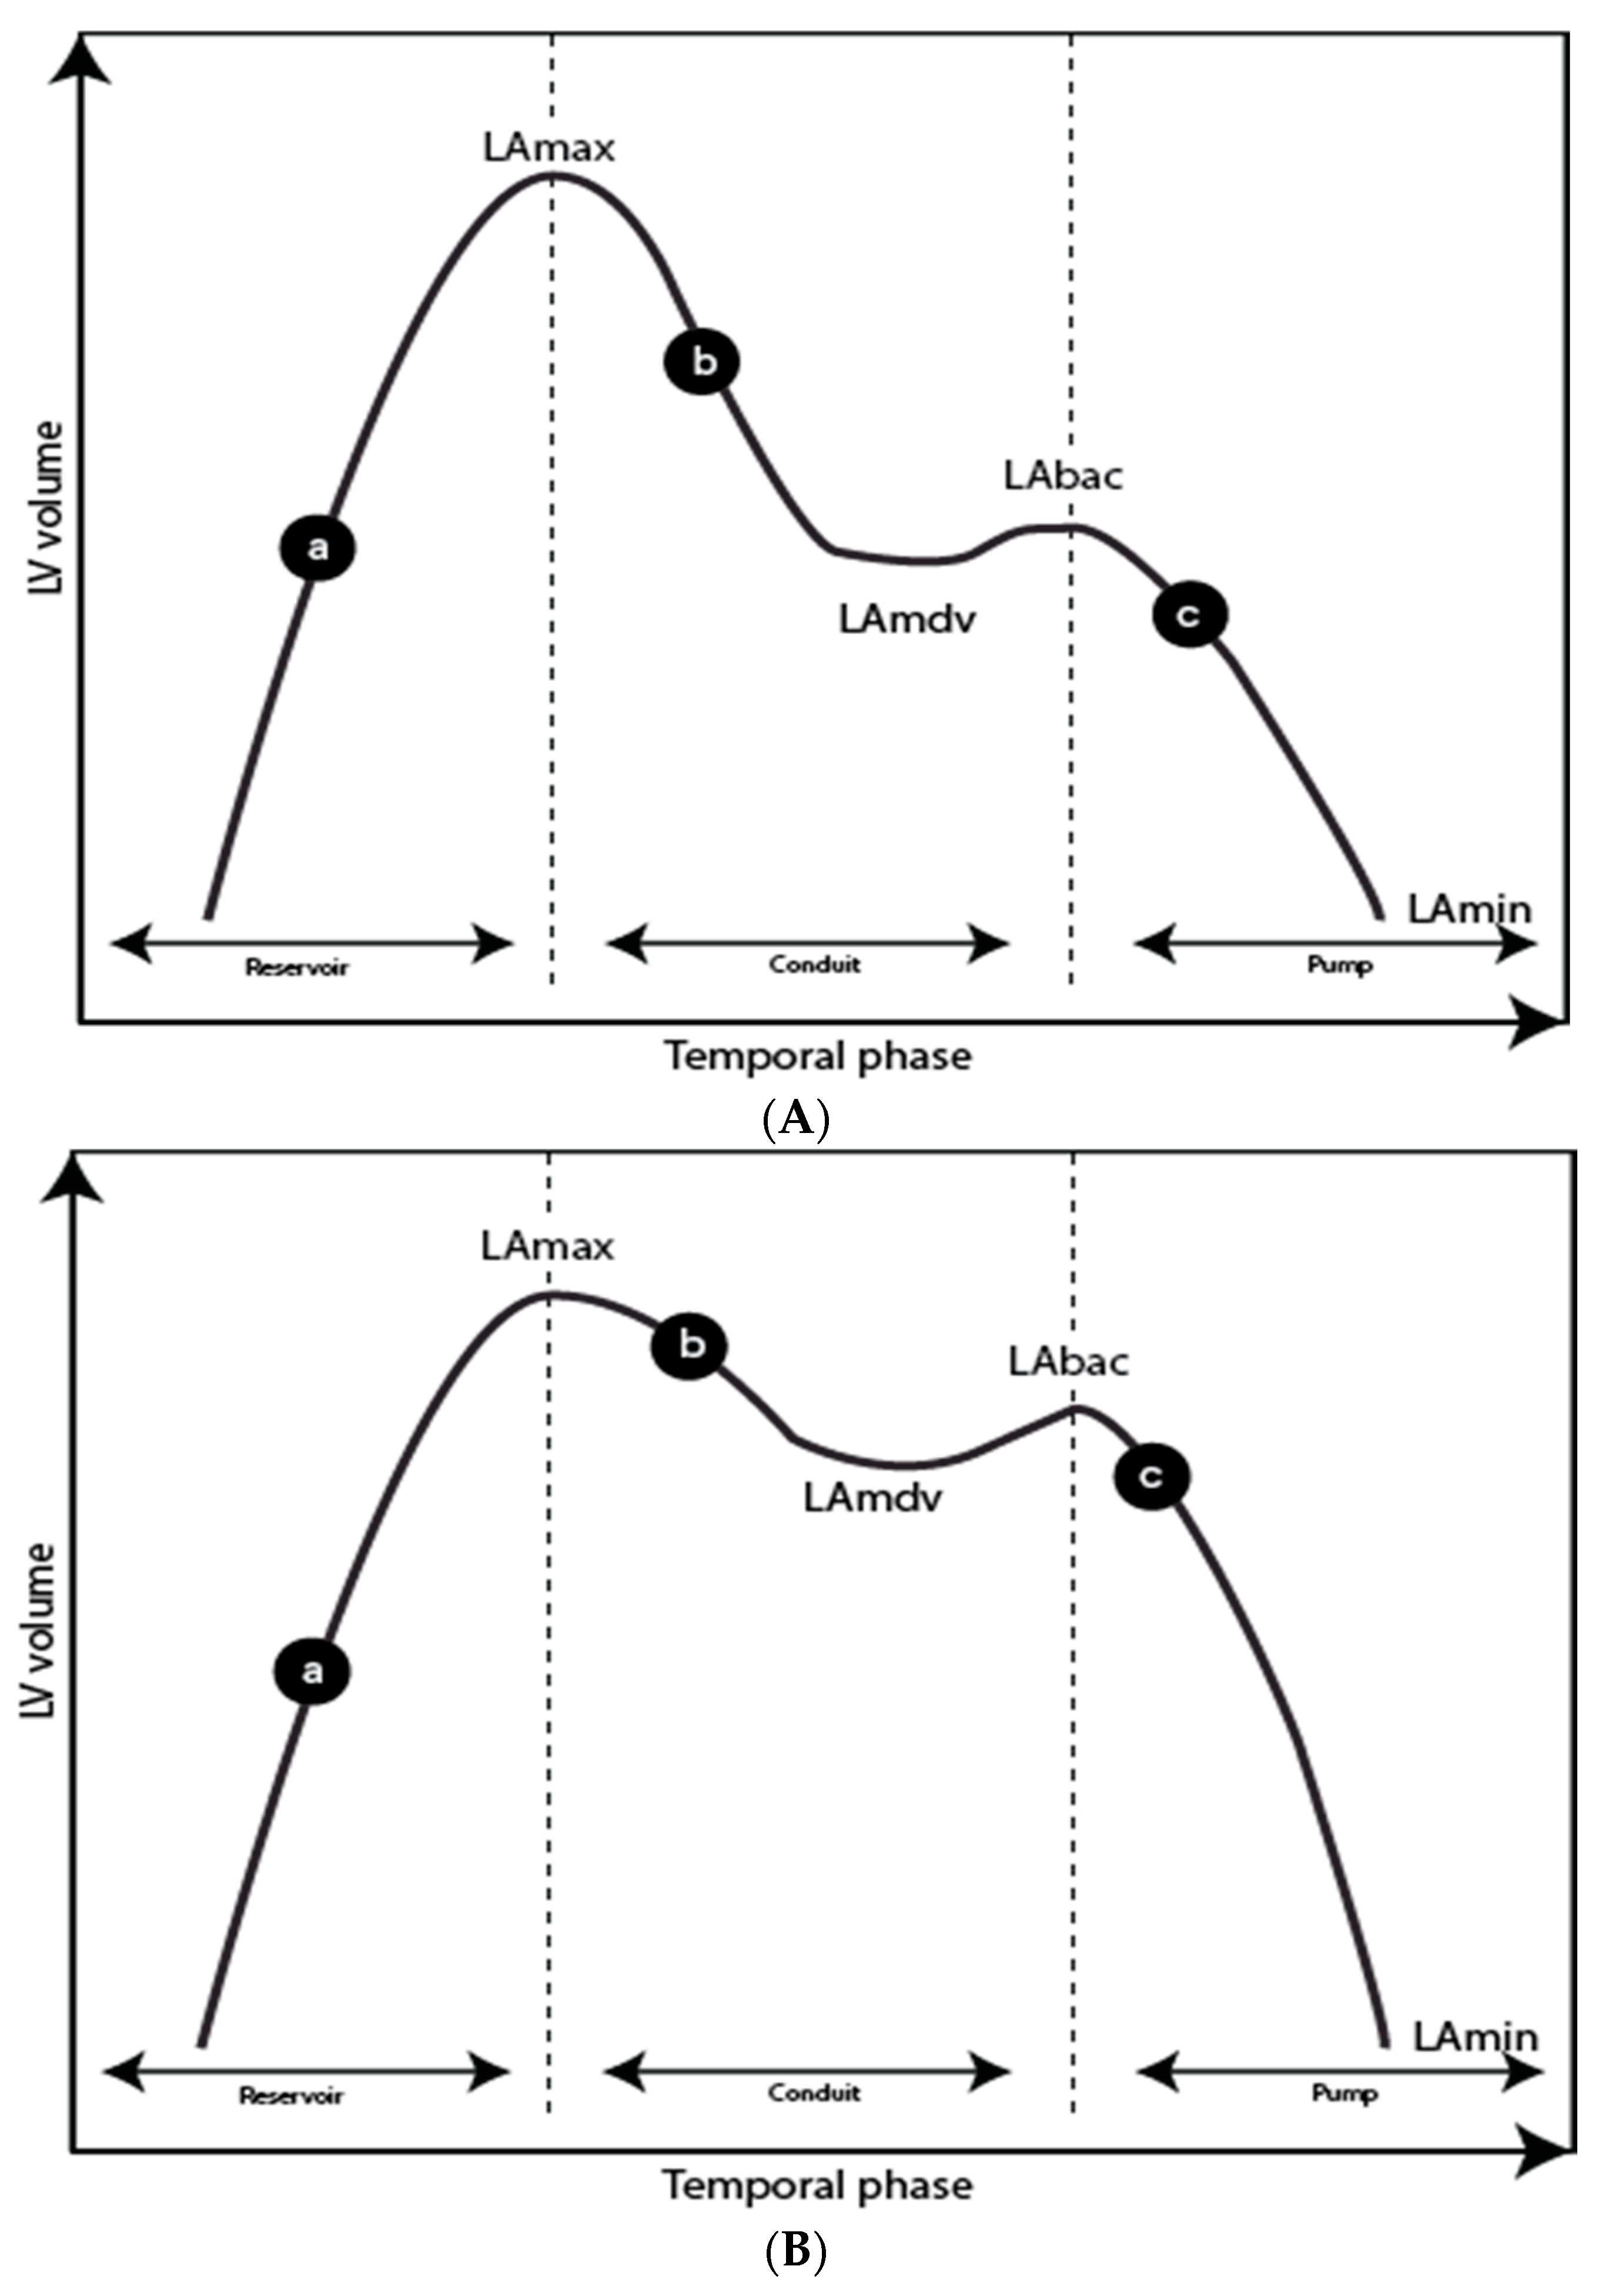
3.10. LA Time/Volume Curve—Reservoir, Conduit, and Pump Function
3.11. LA Time/Volume Curve—Summarized
3.12. Velocity-Encoded Phase-Contrast Sequences
3.13. Velocity-Encoded Phase-Contrast Sequences—Summarized
3.14. LV and LA Feature Tracking—Brief Description
3.15. LV Feature Tracking—Peak Diastolic Strain Rate
3.16. LV Feature Tracking—Summarized
3.17. LA Feature Tracking—Reservoir, Conduit, and Pump Function
3.18. LA Feature Tracking—Summarized
3.19. Other Novel Techniques
4. Conclusions
Author Contributions
Funding
Institutional Review Board Statement
Informed Consent Statement
Data Availability Statement
Conflicts of Interest
References
- Gaasch, W.H. Deliberations on Diastolic Heart Failure. Am. J. Cardiol. 2017, 119, 138–144. [Google Scholar] [CrossRef]
- Lewis, G.A.; Schelbert, E.B.; Williams, S.G.; Cunnington, C.; Ahmed, F.; McDonagh, T.A.; Miller, C.A. Biological Phenotypes of Heart Failure with Preserved Ejection Fraction. J. Am. Coll. Cardiol. 2017, 70, 2186–2200. [Google Scholar] [CrossRef]
- Ahmed, A.; Rich, M.W.; Fleg, J.L.; Zile, M.R.; Young, J.B.; Kitzman, D.W.; Love, T.E.; Aronow, W.S.; Adams, K.F., Jr.; Gheorghiade, M. Effects of digoxin on morbidity and mortality in diastolic heart failure: The ancillary digitalis investigation group trial. Circulation 2006, 114, 397–403. [Google Scholar] [CrossRef]
- Yusuf, S.; Pfeffer, M.A.; Swedberg, K.; Granger, C.B.; Held, P.; McMurray, J.J.; Michelson, E.L.; Olofsson, B.; Ostergren, J. Effects of candesartan in patients with chronic heart failure and preserved left-ventricular ejection fraction: The CHARM-Preserved Trial. Lancet 2003, 362, 777–781. [Google Scholar] [CrossRef]
- Massie, B.M.; Carson, P.E.; McMurray, J.J.; Komajda, M.; McKelvie, R.; Zile, M.R.; Anderson, S.; Donovan, M.; Iverson, E.; Staiger, C.; et al. Irbesartan in patients with heart failure and preserved ejection fraction. N. Engl. J. Med. 2008, 359, 2456–2467. [Google Scholar] [CrossRef]
- Nagueh, S.F.; Smiseth, O.A.; Appleton, C.P.; Byrd, B.F., 3rd; Dokainish, H.; Edvardsen, T.; Flachskampf, F.A.; Gillebert, T.C.; Klein, A.L.; Lancellotti, P.; et al. Recommendations for the Evaluation of Left Ventricular Diastolic Function by Echocardiography: An Update from the American Society of Echocardiography and the European Association of Cardiovascular Imaging. Eur. Heart J. Cardiovasc. Imaging 2016, 17, 1321–1360. [Google Scholar] [CrossRef] [PubMed]
- Andersen, O.S.; Smiseth, O.A.; Dokainish, H.; Abudiab, M.M.; Schutt, R.C.; Kumar, A.; Sato, K.; Harb, S.; Gude, E.; Remme, E.W.; et al. Estimating Left Ventricular Filling Pressure by Echocardiography. J. Am. Coll. Cardiol. 2017, 69, 1937–1948. [Google Scholar] [CrossRef] [PubMed]
- Lancellotti, P.; Galderisi, M.; Edvardsen, T.; Donal, E.; Goliasch, G.; Cardim, N.; Magne, J.; Laginha, S.; Hagendorff, A.; Haland, T.F.; et al. Echo-Doppler estimation of left ventricular filling pressure: Results of the multicentre EACVI Euro-Filling study. Eur. Heart J. Cardiovasc. Imaging 2017, 18, 961–968. [Google Scholar] [CrossRef]
- Caudron, J.; Fares, J.; Bauer, F.; Dacher, J.N. Evaluation of left ventricular diastolic function with cardiac MR imaging. RadioGraphics 2011, 31, 239–259. [Google Scholar] [CrossRef]
- Westenberg, J.J. CMR for Assessment of Diastolic Function. Curr. Cardiovasc. Imaging Rep. 2011, 4, 149–158. [Google Scholar] [CrossRef]
- Flachskampf, F.A.; Biering-Sorensen, T.; Solomon, S.D.; Duvernoy, O.; Bjerner, T.; Smiseth, O.A. Cardiac Imaging to Evaluate Left Ventricular Diastolic Function. JACC Cardiovasc. Imaging 2015, 8, 1071–1093. [Google Scholar] [CrossRef]
- Stuber, M.; Scheidegger, M.B.; Fischer, S.E.; Nagel, E.; Steinemann, F.; Hess, O.M.; Boesiger, P. Alterations in the local myocardial motion pattern in patients suffering from pressure overload due to aortic stenosis. Circulation 1999, 100, 361–368. [Google Scholar] [CrossRef]
- Sharifov, O.F.; Schiros, C.G.; Aban, I.; Perry, G.J.; Dell’italia, L.J.; Lloyd, S.G.; Denney, T.S., Jr.; Gupta, H. Left Ventricular Torsion Shear Angle Volume Approach for Noninvasive Evaluation of Diastolic Dysfunction in Preserved Ejection Fraction. J. Am. Heart Assoc. 2017, 7. [Google Scholar] [CrossRef]
- Aquaro, G.D.; Pizzino, F.; Terrizzi, A.; Carerj, S.; Khandheria, B.K.; Di Bella, G. Diastolic dysfunction evaluated by cardiac magnetic resonance: The value of the combined assessment of atrial and ventricular function. Eur. Radiol. 2019, 29, 1555–1564. [Google Scholar] [CrossRef]
- Gao, C.; Tao, Y.; Pan, J.; Shen, C.; Zhang, J.; Xia, Z.; Wan, Q.; Wu, H.; Gao, Y.; Shen, H.; et al. Evaluation of elevated left ventricular end diastolic pressure in patients with preserved ejection fraction using cardiac magnetic resonance. Eur. Radiol. 2019, 29, 2360–2368. [Google Scholar] [CrossRef]
- Hieda, M.; Parker, J.; Rajabi, T.; Fujimoto, N.; Bhella, P.S.; Prasad, A.; Hastings, J.L.; Sarma, S.; Levine, B.D. Left Ventricular Volume-Time Relation in Patients with Heart Failure with Preserved Ejection Fraction. Am. J. Cardiol. 2017. [Google Scholar] [CrossRef]
- Nacif, M.S.; Almeida, A.L.C.; Young, A.A.; Cowan, B.R.; Armstrong, A.C.; Yang, E.; Sibley, C.T.; Hundley, W.G.; Liu, S.; Lima, J.A.; et al. Three-Dimensional Volumetric Assessment of Diastolic Function by Cardiac Magnetic Resonance Imaging: The Multi-Ethnic Study of Atherosclerosis (MESA). Arquivos Brasileiros de Cardiologia 2017, 108, 552–563. [Google Scholar] [CrossRef]
- Kowallick, J.T.; Kutty, S.; Edelmann, F.; Chiribiri, A.; Villa, A.; Steinmetz, M.; Sohns, J.M.; Staab, W.; Bettencourt, N.; Unterberg-Buchwald, C.; et al. Quantification of left atrial strain and strain rate using Cardiovascular Magnetic Resonance myocardial feature tracking: A feasibility study. J. Cardiovasc. Magn. Reson. 2014, 16, 60. [Google Scholar] [CrossRef]
- Leng, S.; Tan, R.S.; Zhao, X.; Allen, J.C.; Koh, A.S.; Zhong, L. Validation of a rapid semi-automated method to assess left atrial longitudinal phasic strains on cine cardiovascular magnetic resonance imaging. J. Cardiovasc. Magn. Reson. 2018, 20, 71. [Google Scholar] [CrossRef]
- Mahmod, M.; Pal, N.; Rayner, J.; Holloway, C.; Raman, B.; Dass, S.; Levelt, E.; Ariga, R.; Ferreira, V.; Banerjee, R.; et al. The interplay between metabolic alterations, diastolic strain rate and exercise capacity in mild heart failure with preserved ejection fraction: A cardiovascular magnetic resonance study. J. Cardiovasc. Magn. Reson. 2018, 20, 88. [Google Scholar] [CrossRef]
- Evin, M.; Redheuil, A.; Soulat, G.; Perdrix, L.; Ashrafpoor, G.; Giron, A.; Lamy, J.; Defrance, C.; Roux, C.; Hatem, S.N.; et al. Left atrial aging: A cardiac magnetic resonance feature-tracking study. Am. J. Physiol. Heart Circ. Physiol. 2016, 310, H542–H549. [Google Scholar] [CrossRef]
- von Roeder, M.; Rommel, K.P.; Kowallick, J.T.; Blazek, S.; Besler, C.; Fengler, K.; Lotz, J.; Hasenfuss, G.; Lucke, C.; Gutberlet, M.; et al. Influence of Left Atrial Function on Exercise Capacity and Left Ventricular Function in Patients with Heart Failure and Preserved Ejection Fraction. Circ. Cardiovasc. Imaging 2017, 10. [Google Scholar] [CrossRef]
- Young, A.A.; Cowan, B.R. Evaluation of left ventricular torsion by cardiovascular magnetic resonance. J. Cardiovasc. Magn. Reson. 2012, 14, 49. [Google Scholar] [CrossRef]
- Oxenham, H.C.; Young, A.A.; Cowan, B.R.; Gentles, T.L.; Occleshaw, C.J.; Fonseca, C.G.; Doughty, R.N.; Sharpe, N. Age-related changes in myocardial relaxation using three-dimensional tagged magnetic resonance imaging. J. Cardiovasc. Magn. Reson. 2003, 5, 421–430. [Google Scholar] [CrossRef] [PubMed]
- Thompson, R.B.; Paterson, I.; Chow, K.; Cheng-Baron, J.; Scott, J.M.; Esch, B.T.; Ennis, D.B.; Haykowsky, M.J. Characterization of the relationship between systolic shear strain and early diastolic shear strain rates: Insights into torsional recoil. Am. J. Physiol. Heart Circ. Physiol. 2010, 299, H898–H907. [Google Scholar] [CrossRef] [PubMed]
- Nagel, E.; Stuber, M.; Burkhard, B.; Fischer, S.E.; Scheidegger, M.B.; Boesiger, P.; Hess, O.M. Cardiac rotation and relaxation in patients with aortic valve stenosis. Eur. Heart J. 2000, 21, 582–589. [Google Scholar] [CrossRef] [PubMed]
- Reyhan, M.; Ennis, D.B. Quantitative assessment of systolic and diastolic left ventricular twist using Fourier Analysis of Stimulated echoes (FAST) and CSPAMM. J. Magn. Reson. Imaging 2013, 37, 678–683. [Google Scholar] [CrossRef][Green Version]
- Reyhan, M.; Natsuaki, Y.; Ennis, D.B. Off-resonance insensitive complementary SPAtial Modulation of Magnetization (ORI-CSPAMM) for quantification of left ventricular twist. J. Magn. Reson. Imaging 2014, 39, 339–345. [Google Scholar] [CrossRef][Green Version]
- Fonseca, C.G.; Dissanayake, A.M.; Doughty, R.N.; Whalley, G.A.; Gamble, G.D.; Cowan, B.R.; Occleshaw, C.J.; Young, A.A. Three-dimensional assessment of left ventricular systolic strain in patients with type 2 diabetes mellitus, diastolic dysfunction, and normal ejection fraction. Am. J. Cardiol. 2004, 94, 1391–1395. [Google Scholar] [CrossRef]
- Singh, A.; Steadman, C.D.; Khan, J.N.; Reggiardo, G.; McCann, G.P. Effect of late sodium current inhibition on MRI measured diastolic dysfunction in aortic stenosis: A pilot study. BMC Res. Notes 2016, 9, 64. [Google Scholar] [CrossRef]
- Singh, A.; Steadman, C.D.; Khan, J.N.; Horsfield, M.A.; Bekele, S.; Nazir, S.A.; Kanagala, P.; Masca, N.G.; Clarysse, P.; McCann, G.P. Intertechnique agreement and interstudy reproducibility of strain and diastolic strain rate at 1.5 and 3 Tesla: A comparison of feature-tracking and tagging in patients with aortic stenosis. J. Magn. Reson. Imaging 2015, 41, 1129–1137. [Google Scholar] [CrossRef]
- Schiros, C.G.; Desai, R.V.; Venkatesh, B.A.; Gaddam, K.K.; Agarwal, S.; Lloyd, S.G.; Calhoun, D.A.; Denney, T.S., Jr.; Dell’italia, L.J.; Gupta, H. Left ventricular torsion shear angle volume analysis in patients with hypertension: A global approach for LV diastolic function. J. Cardiovasc. Magn. Reson. 2014, 16, 70. [Google Scholar] [CrossRef] [PubMed]
- Musa, T.A.; Uddin, A.; Swoboda, P.P.; Fairbairn, T.A.; Dobson, L.E.; Singh, A.; Garg, P.; Steadman, C.D.; Erhayiem, B.; Kidambi, A.; et al. Cardiovascular magnetic resonance evaluation of symptomatic severe aortic stenosis: Association of circumferential myocardial strain and mortality. J. Cardiovasc. Magn. Reson. 2017, 19, 13. [Google Scholar] [CrossRef]
- Scott, J.M.; Esch, B.T.; Haykowsky, M.J.; Paterson, I.; Warburton, D.E.; Chow, K.; Cheng Baron, J.; Lopaschuk, G.D.; Thompson, R.B. Effects of high intensity exercise on biventricular function assessed by cardiac magnetic resonance imaging in endurance trained and normally active individuals. Am. J. Cardiol. 2010, 106, 278–283. [Google Scholar] [CrossRef]
- Reyhan, M.; Kim, H.J.; Brown, M.S.; Ennis, D.B. Intra- and interscan reproducibility using Fourier Analysis of Stimulated Echoes (FAST) for the rapid and robust quantification of left ventricular twist. J. Magn. Reson. Imaging 2014, 39, 463–468. [Google Scholar] [CrossRef][Green Version]
- Maceira, A.M.; Prasad, S.K.; Khan, M.; Pennell, D.J. Normalized left ventricular systolic and diastolic function by steady state free precession cardiovascular magnetic resonance. J. Cardiovasc. Magn. Reson. 2006, 8, 417–426. [Google Scholar] [CrossRef]
- Bakir, M.; Wei, J.; Nelson, M.D.; Mehta, P.K.; Haftbaradaran, A.; Jones, E.; Gill, E.; Sharif, B.; Slomka, P.J.; Li, D.; et al. Cardiac magnetic resonance imaging for myocardial perfusion and diastolic function-reference control values for women. Cardiovasc. Diagn. Ther. 2016, 6, 78–86. [Google Scholar] [CrossRef] [PubMed]
- Komi, S.; Inoue, Y.; Hata, H.; Nakajima, A.; Miyatake, H. Cardiovascular magnetic resonance evaluation of left ventricular peak filling rate using steady-state free precession and phase contrast sequences. SpringerPlus 2016, 5, 1163. [Google Scholar] [CrossRef] [PubMed]
- Parikh, J.D.; Hollingsworth, K.G.; Wallace, D.; Blamire, A.M.; MacGowan, G.A. Left ventricular functional, structural and energetic effects of normal aging: Comparison with hypertension. PLoS ONE 2017, 12, e0177404. [Google Scholar] [CrossRef] [PubMed]
- Ahtarovski, K.A.; Iversen, K.K.; Lonborg, J.T.; Madsen, P.L.; Engstrom, T.; Vejlstrup, N. Left atrial and ventricular function during dobutamine and glycopyrrolate stress in healthy young and elderly as evaluated by cardiac magnetic resonance. Am. J. Physiol. Heart Circ. Physiol. 2012, 303, H1469–H1473. [Google Scholar] [CrossRef]
- Chacko, B.R.; Karur, G.R.; Connelly, K.A.; Yan, R.T.; Kirpalani, A.; Wald, R.; Jimenez-Juan, L.; Jacob, J.R.; Deva, D.P.; Yan, A.T. Left ventricular structure and diastolic function by cardiac magnetic resonance imaging in hypertrophic cardiomyopathy. Indian Heart J. 2016, 70, 75–81. [Google Scholar] [CrossRef]
- Graca, B.; Donato, P.; Ferreira, M.J.; Castelo-Branco, M.; Caseiro-Alves, F. Left ventricular diastolic function in type 2 diabetes mellitus and the association with coronary artery calcium score: A cardiac MRI study. Am. J. Roentgenol. 2014, 202, 1207–1214. [Google Scholar] [CrossRef] [PubMed][Green Version]
- Rodriguez-Granillo, G.A.; Mejia-Campillo, M.; Rosales, M.A.; Bolzan, G.; Ingino, C.; Lopez, F.; Degrossi, E.; Lylyk, P. Left ventricular filling patterns in patients with previous myocardial infarction measured by conventional cine cardiac magnetic resonance. Int. J. Cardiovasc. Imaging 2012, 28, 795–801. [Google Scholar] [CrossRef] [PubMed]
- Gupta, A.; Schiros, C.G.; Gaddam, K.K.; Aban, I.; Denney, T.S.; Lloyd, S.G.; Oparil, S.; Dell’Italia, L.J.; Calhoun, D.A.; Gupta, H. Effect of spironolactone on diastolic function in hypertensive left ventricular hypertrophy. J. Hum. Hypertens. 2015, 29, 241–246. [Google Scholar] [CrossRef] [PubMed]
- Kawaji, K.; Codella, N.C.; Prince, M.R.; Chu, C.W.; Shakoor, A.; LaBounty, T.M.; Min, J.K.; Swaminathan, R.V.; Devereux, R.B.; Wang, Y.; et al. Automated segmentation of routine clinical cardiac magnetic resonance imaging for assessment of left ventricular diastolic dysfunction. Circ. Cardiovasc. Imaging 2009, 2, 476–484. [Google Scholar] [CrossRef] [PubMed]
- Malek, L.A.; Chojnowska, L.; Klopotowski, M.; Misko, J.; Dabrowski, M.; Kusmierczyk-Droszcz, B.; Maczynska, R.; Piotrowicz, E.; Ruzyllo, W. Left ventricular diastolic function assessed with cardiovascular magnetic resonance imaging and exercise capacity in patients with non-obstructive hypertrophic cardiomyopathy. Kardiol. Pol. 2009, 67, 1–6, discussion 7–8. [Google Scholar] [CrossRef] [PubMed]
- Kawel-Boehm, N.; Maceira, A.; Valsangiacomo-Buechel, E.R.; Vogel-Claussen, J.; Turkbey, E.B.; Williams, R.; Plein, S.; Tee, M.; Eng, J.; Bluemke, D.A. Normal values for cardiovascular magnetic resonance in adults and children. J. Cardiovasc. Magn. Reson. 2015, 17, 29. [Google Scholar] [CrossRef]
- Hudsmith, L.E.; Petersen, S.E.; Francis, J.M.; Robson, M.D.; Neubauer, S. Normal human left and right ventricular and left atrial dimensions using steady state free precession magnetic resonance imaging. J. Cardiovasc. Magn. Reson. 2005, 7, 775–782. [Google Scholar] [CrossRef]
- Maceira, A.M.; Cosin-Sales, J.; Roughton, M.; Prasad, S.K.; Pennell, D.J. Reference left atrial dimensions and volumes by steady state free precession cardiovascular magnetic resonance. J. Cardiovasc. Magn. Reson. 2010, 12, 65. [Google Scholar] [CrossRef]
- Funk, S.; Kermer, J.; Doganguezel, S.; Schwenke, C.; von Knobelsdorff-Brenkenhoff, F.; Schulz-Menger, J. Quantification of the left atrium applying cardiovascular magnetic resonance in clinical routine. Scand. Cardiovasc. J. 2018, 1–8. [Google Scholar] [CrossRef]
- Petersen, S.E.; Aung, N.; Sanghvi, M.M.; Zemrak, F.; Fung, K.; Paiva, J.M.; Francis, J.M.; Khanji, M.Y.; Lukaschuk, E.; Lee, A.M.; et al. Reference ranges for cardiac structure and function using cardiovascular magnetic resonance (CMR) in Caucasians from the UK Biobank population cohort. J. Cardiovasc. Magn. Reson. 2017, 19, 18. [Google Scholar] [CrossRef]
- Germans, T.; Gotte, M.J.W.; Nijveldt, R.; Spreeuwenberg, M.D.; Beek, A.M.; Bronzwaer, J.G.F.; Visser, C.A.; Paulus, W.J.; van Rossum, A.C. Effects of Aging on Left Atrioventricular Coupling and Left Ventricular Filling Assessed Using Cardiac Magnetic Resonance Imaging in Healthy Subjects. Am. J. Cardiol. 2007, 100, 122–127. [Google Scholar] [CrossRef] [PubMed]
- Maceira, A.M.; Cosin-Sales, J.; Prasad, S.K.; Pennell, D.J. Characterization of left and right atrial function in healthy volunteers by cardiovascular magnetic resonance. J. Cardiovasc. Magn. Reson. 2016, 18, 64. [Google Scholar] [CrossRef] [PubMed]
- Janwanishstaporn, S.; Boonyasirinant, T. Correlation between aortic stiffness and left atrial volume index in hypertensive patients. Clin. Exp. Hypertens. 2016, 38, 160–165. [Google Scholar] [CrossRef] [PubMed]
- Kowallick, J.T.; Silva Vieira, M.; Kutty, S.; Lotz, J.; Hasenfu, G.; Chiribiri, A.; Schuster, A. Left Atrial Performance in the Course of Hypertrophic Cardiomyopathy: Relation to Left Ventricular Hypertrophy and Fibrosis. J. Am. Coll. Cardiol. 2016, 67, 1827. [Google Scholar] [CrossRef]
- Grassedonio, E.; Todiere, G.; La Grutta, L.; Toia, P.; Gentile, G.D.; Galia, M.; Midiri, F.; Pepe, A.; Midiri, M.; Aquaro, G.D. Assessment of atrial diastolic function in patients with hypertrophic cardiomyopathy by cine magnetic resonance imaging. La Radiologia Medica 2015, 120, 714–722. [Google Scholar] [CrossRef] [PubMed]
- Hinojar, R.; Zamorano, J.L.; Fernandez-Mendez, M.; Esteban, A.; Plaza-Martin, M.; Gonzalez-Gomez, A.; Carbonell, A.; Rincon, L.M.; Nacher, J.J.J.; Fernandez-Golfin, C. Prognostic value of left atrial function by cardiovascular magnetic resonance feature tracking in hypertrophic cardiomyopathy. Int. J. Cardiovasc. Imaging 2019, 35, 1055–1065. [Google Scholar] [CrossRef] [PubMed]
- Graca, B.; Ferreira, M.J.; Donato, P.; Gomes, L.; Castelo-Branco, M.; Caseiro-Alves, F. Left atrial dysfunction in type 2 diabetes mellitus: Insights from cardiac MRI. Eur. Radiol. 2014, 24, 2669–2676. [Google Scholar] [CrossRef]
- Shang, Y.; Zhang, X.; Leng, W.; Lei, X.; Chen, L.; Liang, Z.; Wang, J. Left atrium passive ejection fraction is the most sensitive index of type 2 diabetes mellitus-related cardiac changes. Int. J. Cardiovasc. Imaging 2017, 34, 141–151. [Google Scholar] [CrossRef]
- Markman, T.M.; Habibi, M.; Venkatesh, B.A.; Zareian, M.; Wu, C.; Heckbert, S.R.; Bluemke, D.A.; Lima, J.A.C. Association of left atrial structure and function and incident cardiovascular disease in patients with diabetes mellitus: Results from multi-ethnic study of atherosclerosis (MESA). Eur. Heart J. Cardiovasc. Imaging 2017, 18, 1138–1144. [Google Scholar] [CrossRef]
- Kwong, R.Y.; Heydari, B.; Abbasi, S.; Steel, K.; Al-Mallah, M.; Wu, H.; Falk, R.H. Characterization of Cardiac Amyloidosis by Atrial Late Gadolinium Enhancement Using Contrast-Enhanced Cardiac Magnetic Resonance Imaging and Correlation with Left Atrial Conduit and Contractile Function. Am. J. Cardiol. 2015, 116, 622–629. [Google Scholar] [CrossRef]
- Mohty, D.; Boulogne, C.; Magne, J.; Varroud-Vial, N.; Martin, S.; Ettaif, H.; Fadel, B.M.; Bridoux, F.; Aboyans, V.; Damy, T.; et al. Prognostic value of left atrial function in systemic light-chain amyloidosis: A cardiac magnetic resonance study. Eur. Heart J. Cardiovasc. Imaging 2016, 17, 961–969. [Google Scholar] [CrossRef]
- Farzaneh-Far, A.; Ariyarajah, V.; Shenoy, C.; Dorval, J.F.; Kaminski, M.; Curillova, Z.; Wu, H.; Brown, K.B.; Kwong, R.Y. Left atrial passive emptying function during dobutamine stress MR imaging is a predictor of cardiac events in patients with suspected myocardial ischemia. JACC Cardiovasc. Imaging 2011, 4, 378–388. [Google Scholar] [CrossRef]
- Gupta, S.; Matulevicius, S.A.; Ayers, C.R.; Berry, J.D.; Patel, P.C.; Markham, D.W.; Levine, B.D.; Chin, K.M.; de Lemos, J.A.; Peshock, R.M.; et al. Left atrial structure and function and clinical outcomes in the general population. Eur. Heart J. 2013, 34, 278–285. [Google Scholar] [CrossRef]
- Khan, M.A.; Yang, E.Y.; Zhan, Y.; Judd, R.M.; Chan, W.; Nabi, F.; Heitner, J.F.; Kim, R.J.; Klem, I.; Nagueh, S.F.; et al. Association of left atrial volume index and all-cause mortality in patients referred for routine cardiovascular magnetic resonance: A multicenter study. J. Cardiovasc. Magn. Reson. 2019, 21, 4. [Google Scholar] [CrossRef] [PubMed]
- Abbasi, S.A.; Shah, R.V.; McNulty, S.E.; Hernandez, A.F.; Semigran, M.J.; Lewis, G.D.; Jerosch-Herold, M.; Kim, R.J.; Redfield, M.M.; Kwong, R.Y. Left Atrial Structure and Function in Heart Failure with Preserved Ejection Fraction: A RELAX Substudy. PLoS ONE 2016, 11, e0164914. [Google Scholar] [CrossRef]
- Kindermann, M. How to diagnose diastolic heart failure: A consensus statement on the diagnosis of heart failure with normal left ventricular ejection fraction by the Heart Failure and Echocardiography Associations of the European Society of Cardiology. Eur. Heart J. 2007, 28, 2686. [Google Scholar] [CrossRef] [PubMed]
- Chirinos, J.A.; Sardana, M.; Ansari, B.; Satija, V.; Kuriakose, D.; Edelstein, I.; Oldland, G.; Miller, R.; Gaddam, S.; Lee, J.; et al. Left Atrial Phasic Function by Cardiac Magnetic Resonance Feature Tracking Is a Strong Predictor of Incident Cardiovascular Events. Circ. Cardiovasc. Imaging 2018, 11, e007512. [Google Scholar] [CrossRef] [PubMed]
- Ho, K.K.; Anderson, K.M.; Kannel, W.B.; Grossman, W.; Levy, D. Survival after the onset of congestive heart failure in Framingham Heart Study subjects. Circulation 1993, 88, 107–115. [Google Scholar] [CrossRef] [PubMed]
- Buss, S.J.; Krautz, B.; Schnackenburg, B.; Abdel-Aty, H.; Santos, M.F.B.; Andre, F.; Maertens, M.J.; Mereles, D.; Korosoglou, G.; Giannitsis, E.; et al. Classification of diastolic function with phase-contrast cardiac magnetic resonance imaging: Validation with echocardiography and age-related reference values. Clin. Res. Cardiol. 2014, 103, 441–450. [Google Scholar] [CrossRef]
- Paelinck, B.P.; de Roos, A.; Bax, J.J.; Bosmans, J.M.; van Der Geest, R.J.; Dhondt, D.; Parizel, P.M.; Vrints, C.J.; Lamb, H.J. Feasibility of tissue magnetic resonance imaging: A pilot study in comparison with tissue Doppler imaging and invasive measurement. J. Am. Coll. Cardiol. 2005, 45, 1109–1116. [Google Scholar] [CrossRef]
- Rathi, V.K.; Doyle, M.; Yamrozik, J.; Williams, R.B.; Caruppannan, K.; Truman, C.; Vido, D.; Biederman, R.W.W. Routine evaluation of left ventricular diastolic function by cardiovascular magnetic resonance: A practical approach. J. Cardiovasc. Magn. Reson. 2008, 10, 1–9. [Google Scholar] [CrossRef]
- Rubinshtein, R.; Glockner, J.F.; Feng, D.; Araoz, P.A.; Kirsch, J.; Syed, I.S.; Oh, J.K. Comparison of magnetic resonance imaging versus Doppler echocardiography for the evaluation of left ventricular diastolic function in patients with cardiac amyloidosis. Am. J. Cardiol. 2009, 103, 718–723. [Google Scholar] [CrossRef] [PubMed]
- El Din Behairy, N.H.; Homos, M.; Ramadan, A.; El Sayed Gouda, S.O. Evaluation of left ventricle diastolic dysfunction in ischemic heart disease by CMR: Correlation with echocardiography and myocardial scarring. Egypt. J. Radiol. Nucl. Med. 2014, 45, 1099–1104. [Google Scholar] [CrossRef]
- Beeres, S.L.; Lamb, H.J.; Roes, S.D.; Holman, E.R.; Kaandorp, T.A.; Fibbe, W.E.; de Roos, A.; van der Wall, E.E.; Schalij, M.J.; Bax, J.J.; et al. Effect of intramyocardial bone marrow cell injection on diastolic function in patients with chronic myocardial ischemia. J. Magn. Reson. Imaging 2008, 27, 992–997. [Google Scholar] [CrossRef] [PubMed]
- Hartiala, J.J.; Mostbeck, G.H.; Foster, E.; Fujita, N.; Dulce, M.C.; Chazouilleres, A.F.; Higgins, C.B. Velocity-encoded cine MRI in the evaluation of left ventricular diastolic function: Measurement of mitral valve and pulmonary vein flow velocities and flow volume across the mitral valve. Am. Heart J. 1993, 125, 1054–1066. [Google Scholar] [CrossRef]
- Bollache, E.; Redheuil, A.; Clement-Guinaudeau, S.; Defrance, C.; Perdrix, L.; Ladouceur, M.; Lefort, M.; De Cesare, A.; Herment, A.; Diebold, B.; et al. Automated left ventricular diastolic function evaluation from phase-contrast cardiovascular magnetic resonance and comparison with Doppler echocardiography. J. Cardiovasc. Magn. Reson. 2010, 12, 63. [Google Scholar] [CrossRef]
- Azarisman, S.M.; Shirazi, M.; Bradley, J.; Teo, K.S.; Worthley, M.I.; Worthley, S.G. Assessment of diastolic dysfunction in patients with acute coronary syndrome and preserved systolic function: Comparison between Doppler transthoracic echocardiography and velocity-encoded cardiac magnetic resonance. Acta Cardiol. 2016, 71, 425–434. [Google Scholar] [CrossRef] [PubMed]
- Seemann, F.; Baldassarre, L.A.; Llanos-Chea, F.; Gonzales, R.A.; Grunseich, K.; Hu, C.; Sugeng, L.; Meadows, J.; Heiberg, E.; Peters, D.C. Assessment of diastolic function and atrial remodeling by MRI-validation and correlation with echocardiography and filling pressure. Physiol. Rep. 2018, 6, e13828. [Google Scholar] [CrossRef] [PubMed]
- Ashrafpoor, G.; Bollache, E.; Redheuil, A.; De Cesare, A.; Giron, A.; Defrance, C.; Azarine, A.; Perdrix, L.; Ladouceur, M.; Diebold, B.; et al. Age-specific changes in left ventricular diastolic function: A velocity-encoded magnetic resonance imaging study. Eur. Radiol. 2015, 25, 1077–1086. [Google Scholar] [CrossRef]
- Chen, Q.; Gan, Y.; Li, Z.Y. Left ventricular diastolic dysfunction in type 2 diabetes patients: A novel 2D strain analysis based on cardiac magnetic resonance imaging. Comput. Methods Biomech. Biomed. Eng. 2016, 19, 1330–1338. [Google Scholar] [CrossRef] [PubMed]
- Diamant, M.; Lamb, H.J.; Groeneveld, Y.; Endert, E.L.; Smit, J.W.; Bax, J.J.; Romijn, J.A.; de Roos, A.; Radder, J.K. Diastolic dysfunction is associated with altered myocardial metabolism in asymptomatic normotensive patients with well-controlled type 2 diabetes mellitus. J. Am. Coll. Cardiol. 2003, 42, 328–335. [Google Scholar] [CrossRef]
- Clarke, G.D.; Solis-Herrera, C.; Molina-Wilkins, M.; Martinez, S.; Merovci, A.; Cersosimo, E.; Chilton, R.J.; Iozzo, P.; Gastaldelli, A.; Abdul-Ghani, M.; et al. Pioglitazone Improves Left Ventricular Diastolic Function in Subjects with Diabetes. Diabetes Care 2017, 40, 1530–1536. [Google Scholar] [CrossRef] [PubMed]
- Clarke, G.D.; Molina-Wilkins, M.; Solis-Herrera, C.; Mendez, V.; Monroy, A.; Cersosimo, E.; Chilton, R.J.; Abdul-Ghani, M.; DeFronzo, R.A. Impaired left ventricular diastolic function in T2DM patients is closely related to glycemic control. Endocrinol. Diabetes Metab. 2018, 1, e00014. [Google Scholar] [CrossRef]
- Hartiala, J.J.; Foster, E.; Fujita, N.; Mostbeck, G.H.; Caputo, G.R.; Fazio, G.P.; Winslow, T.; Higgins, C.B. Evaluation of left atrial contribution to left ventricular filling in aortic stenosis by velocity-encoded cine MRI. Am. Heart J. 1994, 127, 593–600. [Google Scholar] [CrossRef]
- Lamb, H.J.; Beyerbacht, H.P.; de Roos, A.; van der Laarse, A.; Vliegen, H.W.; Leujes, F.; Bax, J.J.; van der Wall, E.E. Left ventricular remodeling early after aortic valve replacement: Differential effects on diastolic function in aortic valve stenosis and aortic regurgitation. J. Am. Coll. Cardiol. 2002, 40, 2182–2188. [Google Scholar] [CrossRef]
- Andre, F.; Steen, H.; Matheis, P.; Westkott, M.; Breuninger, K.; Sander, Y.; Kammerer, R.; Galuschky, C.; Giannitsis, E.; Korosoglou, G.; et al. Age- and gender-related normal left ventricular deformation assessed by cardiovascular magnetic resonance feature tracking. J. Cardiovasc. Magn. Reson. 2015, 17, 25. [Google Scholar] [CrossRef]
- Shang, Y.; Zhang, X.; Leng, W.; Lei, X.; Chen, L.; Zhou, X.; Chow, K.; Shi, Y.; Dong, J.; Liang, Z.; et al. Increased fractal dimension of left ventricular trabeculations is associated with subclinical diastolic dysfunction in patients with type-2 diabetes mellitus. Int. J. Cardiovasc. Imaging 2019, 35, 665–673. [Google Scholar] [CrossRef] [PubMed]
- Nucifora, G.; Muser, D.; Gianfagna, P.; Morocutti, G.; Proclemer, A. Systolic and diastolic myocardial mechanics in hypertrophic cardiomyopathy and their link to the extent of hypertrophy, replacement fibrosis and interstitial fibrosis. Int. J. Cardiovasc. Imaging 2015, 31, 1603–1610. [Google Scholar] [CrossRef] [PubMed]
- Peng, J.; Zhao, X.; Zhao, L.; Fan, Z.; Wang, Z.; Chen, H.; Leng, S.; Allen, J.; Tan, R.S.; Koh, A.S.; et al. Normal values of myocardial deformation assessed by cardiovascular magnetic resonance feature tracking in a healthy Chinese population: A multicenter study. Front. Physiol. 2018, 9, 1181. [Google Scholar] [CrossRef]
- Lamy, J.; Soulat, G.; Evin, M.; Huber, A.; de Cesare, A.; Giron, A.; Diebold, B.; Redheuil, A.; Mousseaux, E.; Kachenoura, N. Scan-rescan reproducibility of ventricular and atrial MRI feature tracking strain. Comput. Biol. Med. 2018, 92, 197–203. [Google Scholar] [CrossRef]
- Schuster, A.; Backhaus, S.J.; Stiermaier, T.; Navarra, J.L.; Uhlig, J.; Rommel, K.P.; Koschalka, A.; Kowallick, J.T.; Lotz, J.; Gutberlet, M.; et al. Left Atrial Function with MRI Enables Prediction of Cardiovascular Events after Myocardial Infarction: Insights from the AIDA STEMI and TATORT NSTEMI Trials. Radiology 2019, 293, 292–302. [Google Scholar] [CrossRef]
- Chirinos, J.A.; Phan, T.S.; Syed, A.A.; Hashmath, Z.; Oldland, H.G.; Koppula, M.R.; Tariq, A.; Javaid, K.; Miller, R.; Varakantam, S.; et al. Late Systolic Myocardial Loading Is Associated with Left Atrial Dysfunction in Hypertension. Circ. Cardiovasc. Imaging 2017, 10, e006023. [Google Scholar] [CrossRef]
- Evin, M.; Cluzel, P.; Lamy, J.; Rosenbaum, D.; Kusmia, S.; Defrance, C.; Soulat, G.; Mousseaux, E.; Roux, C.; Clement, K.; et al. Assessment of left atrial function by MRI myocardial feature tracking. J. Magn. Reson. Imaging 2015, 42, 379–389. [Google Scholar] [CrossRef]
- Evin, M.; Broadhouse, K.M.; Callaghan, F.M.; McGrath, R.T.; Glastras, S.; Kozor, R.; Hocking, S.L.; Lamy, J.; Redheuil, A.; Kachenoura, N.; et al. Impact of obesity and epicardial fat on early left atrial dysfunction assessed by cardiac MRI strain analysis. Cardiovasc. Diabetol. 2016, 15, 164. [Google Scholar] [CrossRef] [PubMed]
- Wu, V.; Chyou, J.Y.; Chung, S.; Bhagavatula, S.; Axel, L. Evaluation of diastolic function by three-dimensional volume tracking of the mitral annulus with cardiovascular magnetic resonance: Comparison with tissue Doppler imaging. J. Cardiovasc. Magn. Reson. 2014, 16, 71. [Google Scholar] [CrossRef] [PubMed]
- Offen, S.; Celermajer, D.; Semsarian, C.; Puranik, R. The role of diastolic filling in preserving left ventricular stroke volume—An MRI study. Int. J. Cardiol. 2013, 168, 1596–1598. [Google Scholar] [CrossRef]
- Okayama, S.; Nakano, T.; Uemura, S.; Fujimoto, S.; Somekawa, S.; Watanabe, M.; Nakajima, T.; Saito, Y. Evaluation of left ventricular diastolic function by fractional area change using cine cardiovascular magnetic resonance: A feasibility study. J. Cardiovasc. Magn. Reson. 2013, 15, 87. [Google Scholar] [CrossRef] [PubMed]
- Kumar, R.; Charonko, J.; Hundley, W.G.; Hamilton, C.A.; Stewart, K.C.; McNeal, G.R.; Vlachos, P.P.; Little, W.C. Assessment of left ventricular diastolic function using 4-dimensional phase-contrast cardiac magnetic resonance. J. Comput. Assist. Tomogr. 2011, 35, 108–112. [Google Scholar] [CrossRef] [PubMed]
- Cao, J.J.; Wang, Y.; McLaughlin, J.; Haag, E.; Rhee, P.; Passick, M.; Toole, R.; Cheng, J.; Berke, A.D.; Lachman, J.; et al. Left ventricular filling pressure assessment using left atrial transit time by cardiac magnetic resonance imaging. Circ. Cardiovasc. Imaging 2011, 4, 130–138. [Google Scholar] [CrossRef] [PubMed][Green Version]
- Houlind, K.; Schroeder, A.P.; Egeblad, H.; Pedersen, E.M. Age-dependent changes in spatial and temporal blood velocity distribution of early left ventricular filling. Magn. Reson. Imaging 1999, 17, 859–868. [Google Scholar] [CrossRef]
- Suwa, K.; Saitoh, T.; Takehara, Y.; Sano, M.; Nobuhara, M.; Saotome, M.; Urushida, T.; Katoh, H.; Satoh, H.; Sugiyama, M.; et al. Characteristics of intra-left atrial flow dynamics and factors affecting formation of the vortex flow: Analysis with phase-resolved 3-dimensional cine phase contrast magnetic resonance imaging. Circ. J. 2014, 79, 144–152. [Google Scholar] [CrossRef]
- Suwa, K.; Saitoh, T.; Takehara, Y.; Sano, M.; Saotome, M.; Urushida, T.; Katoh, H.; Satoh, H.; Sugiyama, M.; Wakayama, T.; et al. Intra-left ventricular flow dynamics in patients with preserved and impaired left ventricular function: Analysis with 3D cine phase contrast MRI (4D-Flow). J. Magn. Reson. Imaging 2016, 44, 1493–1503. [Google Scholar] [CrossRef]
- Leng, S.; Zhao, X.D.; Huang, F.Q.; Wong, J.I.; Su, B.Y.; Allen, J.C.; Kassab, G.S.; Tan, R.S.; Zhong, L. Automated quantitative assessment of cardiovascular magnetic resonance-derived atrioventricular junction velocities. Am. J. Physiol. Heart Circ. Physiol. 2015, 309, H1923–H1935. [Google Scholar] [CrossRef] [PubMed]
- Elbaz, M.S.M.; Calkoen, E.E.; Westenberg, J.J.M.; Lelieveldt, B.P.F.; Roest, A.A.W.; Van Der Geest, R.J. Vortex flow during early and late left ventricular filling in normal subjects: Quantitative characterization using retrospectively-gated 4D flow cardiovascular magnetic resonance and three-dimensional vortex core analysis. J. Cardiovasc. Magn. Reson. 2014, 16, 78. [Google Scholar] [CrossRef] [PubMed]
- Dusch, M.N.; Thadani, S.R.; Dhillon, G.S.; Hope, M.D. Diastolic function assessed by cardiac MRI using longitudinal left ventricular fractional shortening. Clin. Imaging 2014, 38, 666–668. [Google Scholar] [CrossRef]
- Foll, D.; Jung, B.; Schilli, E.; Staehle, F.; Geibel, A.; Hennig, J.; Bode, C.; Markl, M. Magnetic resonance tissue phase mapping of myocardial motion: New insight in age and gender. Circ. Cardiovasc. Imaging 2010, 3, 54–64. [Google Scholar] [CrossRef] [PubMed]
- Seemann, F.; Pahlm, U.; Steding-Ehrenborg, K.; Ostenfeld, E.; Erlinge, D.; Dubois-Rande, J.L.; Jensen, S.E.; Atar, D.; Arheden, H.; Carlsson, M.; et al. Time-resolved tracking of the atrioventricular plane displacement in Cardiovascular Magnetic Resonance (CMR) images. BMC Med. Imaging 2017, 17, 19. [Google Scholar] [CrossRef]
- Zhao, X.; Tan, R.S.; Tang, H.C.; Leng, S.; Zhang, J.M.; Zhong, L. Analysis of three-dimensional endocardial and epicardial strains from cardiac magnetic resonance in healthy subjects and patients with hypertrophic cardiomyopathy. Med. Biol. Eng. Comput. 2017, 56, 159–172. [Google Scholar] [CrossRef]
- Kamphuis, V.P.; Westenberg, J.J.M.; van der Palen, R.L.F.; van Den Boogaard, P.J.; van der Geest, R.J.; de Roos, A.; Blom, N.A.; Roest, A.A.W.; Elbaz, M.S.M. Scan-rescan reproducibility of diastolic left ventricular kinetic energy, viscous energy loss and vorticity assessment using 4D flow MRI: Analysis in healthy subjects. Int. J. Cardiovasc. Imaging 2018, 34, 905–920. [Google Scholar] [CrossRef]
- Casas, B.; Viola, F.; Cedersund, G.; Bolger, A.F.; Karlsson, M.; Carlhall, C.J.; Ebbers, T. Non-invasive Assessment of Systolic and Diastolic Cardiac Function During Rest and Stress Conditions Using an Integrated Image-Modeling Approach. Front. Physiol. 2018, 9, 1515. [Google Scholar] [CrossRef] [PubMed]
- Crandon, S.; Westenberg, J.J.M.; Swoboda, P.P.; Fent, G.J.; Foley, J.R.J.; Chew, P.G.; Brown, L.A.E.; Saunderson, C.; Al-Mohammad, A.; Greenwood, J.P.; et al. Impact of Age and Diastolic Function on Novel, 4D flow CMR Biomarkers of Left Ventricular Blood Flow Kinetic Energy. Sci. Rep. 2018, 8, 14436. [Google Scholar] [CrossRef] [PubMed]
- Thavendiranathan, P.; Guetter, C.; da Silveira, J.S.; Lu, X.; Scandling, D.; Xue, H.; Jolly, M.P.; Raman, S.V.; Simonetti, O.P. Mitral annular velocity measurement with cardiac magnetic resonance imaging using a novel annular tracking algorithm: Validation against echocardiography. Magn. Reson. Imaging 2019, 55, 72–80. [Google Scholar] [CrossRef] [PubMed]


| Parameter | Author, Year | Controls, n (Age #) | Patients, n (Age #) | Sequence Parameter | Estimate, Controls | Estimate, Patients | Comparator ^ |
|---|---|---|---|---|---|---|---|
| Normalized apical rotation rate ◊ (s−1) | Oxenham [24] 2003 | 15 (22 ± 3) Healthy young | 15 (69 ± 4) Healthy elderly | 1.5T SPAMM TR: 35–45 ms ST: 7 mm SR: In-plane 1 mm/pixel | −7 ± 1 | −5 ± 1 * | Echo-Doppler; E 74 ± 16 vs. E 46 ± 10 |
| - | Thompson [25] 2010 | 32 (33 ± 7) Healthy | 1.5T SPAMM TR: 20 ms ST: 8 mm SR: Matrix 192 × 128 FoV:300–380 mm | −13 ± 3 | No | ||
| - | Nagel [26] 2000 | 12 (29 ± 6) Healthy | 13 (61 ± 12) AS | 1.5T CSPAMM TR 35 ms ST: 6–8 mm SR: In-plane pixel 1.4 × 1.4 mm | −11 ± 2 | −7 ± 1 * | No |
| Normalized global untwisting rate ◊ (s−1) | Thompson [25] 2010 | 32 (33 ± 7) Healthy | See above | −14 ± 2 | No | ||
| - | Reyhan [27] 2013 | 13 (33 ± 11) Healthy | 1.5T CSPAMM TR: NR ST: 5–6 mm SR: Matrix 192 × 144 FoV 300–360 × 280–300 mm | −8 ± 2 | No | ||
| - | Reyhan [28] 2014 | 13 (33 ± 11) Healthy | 1.5T CSPAMM TR: NR ST: 5–6 mm SR: Matrix 192 × 144 FoV 300–360 × 280–300 | −9 ± 2 | No |
| Parameter | Author, Year | Controls, n (Age #) | Patients, n (Age #) | Sequence Parameter | Estimate, Controls | Estimate, Patients | Comparator ^ |
|---|---|---|---|---|---|---|---|
| Global circumferential-longitudinal shear strain rate (% s−1) | Thompson [25] 2010 | 32 (33 ± 7) Healthy | 1.5T SPAMM TR: 20 ms ST: 8 mm SR: Matrix 192 × 128 FoV:300–380 mm | 72 ± 13 | No | ||
| Normalized global circumferential-longitudinal shear strain rate ◊ (s−1) | Thompson [25] 2010 | 32 (33 ± 7) Healthy | See above | −12 ± 1.4 | No | ||
| Global peak circumferential strain rate (% s−1) | Fonseca [29] 2004 | 31 (47 ± 24) Healthy | 28 (53 ± 8) DM2 | 1.5T SPAMM TR: 35–45 ms ST:8 mm SR: In-plane 1 mm/pixel | 108 ± 41 | 71 ± 20 * | E/A 1.3 ± 0.6 vs. 0.9 ± 0.2 |
| - | Singh [30] 2016 | 15 (66 ± 10) Moderate to severe AS | 3T SPAMM TR: 46 ST: 8 mm SR: NR | 79 ± 15 | Lateral E/e′ 11 ± 3 | ||
| - | Singh [31] 2015 | 8 (67 ± 8) 10 (67 ± 9) Moderate-Severe AS | 1.5T & 3T CSAPMM & SPAMM TR: 42 & 46 ST: 6&8 mm SR: NR | 100 ± 31 82 ± 26 | No | ||
| - | Schiros [32] 2014 | 40 (42 ± 13) Healthy | 60 (55 ± 12) AH | 1.5T SPAMM TR: NR ST: 8 mm SR: matrix 256 × 128 FoV 40 × 40 | 101 ± 28 | 79 ± 27 * | No |
| Peak mid-ventricular strain rate (% s−1) | Musa [33] 2017 | 52 (81 ± 6) Severe AS | 1.5T CSPAMM TR: NR ST: 10 mm SR: matrix 128 × 128 FoV 300 mm | 2.2 ± 1.5 | LVEDP; see text | ||
| Peak Longitudinal strain rate (% s−1) | Fonseca [29] 2004 | 31 (47 ± 24) Healthy | 28 (53 ± 8) AM2 | See above | 92 ± 37 | 63 ± 2 | See above |
| - | Schiros [32] 2014 | 40 (42 ± 13) Healthy | 60 (55 ± 12) AH | See above | 104 ± 32 | 79 ± 30 | No |
| Parameter | Author, Year | Control, n (Age #) | Patients, n (Age #) | Sequence Parameter | Estimate, Controls | Estimate, Patients | Comparator |
|---|---|---|---|---|---|---|---|
| Time to peak untwist | Stuber [12] 1999 | 11 (34 ± 9) Healthy | 12 (58 ± 13) AS | 1.5T CSPAMM TR:35 ms ST: 6 mm SR: matrix 256 × 256 FoV 360 mm | 47 ± 23 ms | 88 ± 19 ms * | Invasive (Figure 2) |
| - | Nagel [26] 2000 | 12 (29 ± 6) Healthy | 13 (61 ± 12) AS | 1.5T CSPAMM TR 35 ms ST: 6–8 mm SR: In-plane pixel 1.4 × 1.4 mm | 56 ± 25 ms | 103 ± 28 ms * | No |
| Parameter | Author, Year | Control, n (Age #) | Patients, n (Age #) | Sequence Parameter | Estimate, Controls | Estimate, Patients | Comparator ^ |
|---|---|---|---|---|---|---|---|
| Normalized peak early torsion shear angle vs. volume change ◊ | Sharifov [13] 2015 | 18 (62 ± 5) Patients∆ with low invasive LV pressure | 18 (60 ± 8) Patients ∆ with high invasive LV pressure | 1.5T SPAMM TR: NR ST: 8 mm SR: matrix 256 × 128 FoV 40 | 3.6 ± 1.6 | 7.6 ± 4.2 * | Invasive (Figure 2) |
| - | Schiros [32] 2014 | 40 (42 ± 13) Healthy | 60 (55 ± 12) AH | 1.5T SPAMM TR: NR ST: 8 mm SR: matrix 256 × 128 FoV 40 × 40 | 6.3 ± 3.9 | 10.5 ± 8.5 * | No |
| Parameter | Author, Year | Controls, n (Age #) | Patients, n (Age #) | Sequence Parameters | Estimate, Controls | Estimate, Patients | Comparator ^ |
|---|---|---|---|---|---|---|---|
| ePFR (mL s−1) | Maceira [36] 2006 | 20 (20–29), Healthy young | 20 (70–79), Healthy elderly | 1.5T TR: 22 ± 1 ms ST:7 mm SR: In-plane pixel size 2.1 × 1.3 mm Phases: NR | 720 ± 143 | 276 ± 143 * | No |
| - | Aquaro [14] 2018 | 20 (51 ± 16), Healthy. Normal DD ◊. | 40 (54 ± 18), Reduced DD ◊. Various diseases | 1.5T TR: NR ST: 8 mm SR: matrix 224 × 224 FoV 400 mm Phases: 30 | 375 ± 63 | DD I: 247 ± 47 * DD II: 325 ± 92 * DD III: 353 ± 92 | Echo-Doppler (Figure 2) |
| - | Gao [15] 2019 | 26 (65 ± 10), Patients with unexplained dyspnea | 25 (69 ± 8), HFpEF | 3T TR: NR ST:8 mm SR: matrix 232 × 219 FoV: NR Phases: NR | 253 ± 63 | 222 ± 66 | LVEDP < 16, E/e′ 9.4 ± 1.4 vs. LVEDP ≥ 16, E/e′ 12.7 ± 3.1 |
| - | Graca [30] 2014 | 21 (55 ± 7), Normo-glycemic controls | 41 (58 ± 7), DM2 | 3T TR:25–40 ms ST:8 mm SR: Matrix 256 × 156 Pixel size 2.1 × 1.6 mm Phases: 25 | 376 ± 103 | 293 ± 52 * | No |
| - | Chacho [31] 2016 | 20 (44–56), Healthy | 41 (45–57), HCM 21 (47–61), AH | 1.5T TR: 50 ms ST:8 mm SR: Matrix 256 × 256 FoV 280–340 mm Phases: 25 | 445 (372–532) | HCM 414 (349–536) AH 395 (356–528) | No |
| - | Rodriguez-Granillo [29] 2012 | 25 (57 ± 15) Healthy | 25 (62 ± 12) IHD | 3T TR:49.3 ms ST: 8 mm SR: matrix 144 × 157 FoV 320 mm Phases 30 | 316 ± 126 | 252 ± 98 * | No |
| - | Nacif [37] 2016 | 66 (67 ± 9) Normal DD ◊◊ | 15 (64 ± 10) Reduced DD ◊◊ | 1.5T TR: 30 ± 5 ms ST:8 mm SR: Matrix 205 × 256 FoV 360 mm Phases 30 | 189 ± 66 | 214 ± 72 | Average E/e′ 7.3 ± 1.8 vs. 14.2 ± 5.4 |
| Dobutamine stress ePFR | Ahtarovski [26] 2012 | 20 (20–30) Healthy young | 20 (60–70) Healthy Elderly | 1.5T TR:NR ST:7 mm SR: Matrix 192 × 162 FoV 300–360 mm Phases 25 | Increase by 72 ± 24% | Increase by 20 ± 9% * | No |
| Glycol-pyrrolate stress ePFR | Ahtarovski [26] 2012 | 20 (20–30) Healthy young | 20 (60–70) Healthy elderly | See above | Increase by 22 ± 10% | Decrease by −13 ± 9% * | No |
| Parameter | Author, Year | Controls, n (Age #) | Patients, n (Age #) | Sequence Parameter | Estimate, Controls | Estimate, Patients | Comparator |
|---|---|---|---|---|---|---|---|
| ePFR/ LVEDV (s−1) | Maceira [36] 2006 | 20 (20–29) Healthy young | 20 (70–79) Healthy elderly | 1.5T TR: 22 ± 1 ms ST:7 mm SR: In-plane pixel size 2.1 × 1.3 mm Phases: NR | 4.8 ± 0.8 | 2.3 ± 0.8 * | No |
| - | Schiros [32] 2014 | 40 (42 ± 13) Healthy | 60 (55 ± 12) AH | 1.5T TR: NR ST:8 mm SR: matrix 256 × 128 FoV 40 × 40 cm Phases: 20 | 3.0 ± 0.6 | 2.5 ± 0.7 * | No |
| - | Gupta [44] 2015 | 45 (41 ± 13) Healthy | 15 (54 ± 6) AH | 1.5T TR: NR ST:8 mm SR: matrix 256 × 128 FoV 40 × 40 cm Phases 20 | 3.1 ± 0.6 | 2.2 ± 0.8 * | No |
| - | Rodriguez-Granillo [43] 2012 | 25 (57 ± 15) Healthy | 25 (62 ± 12) IHD | 3T TR:49.3 ms ST: 8 mm SR: matrix 144 × 157 FoV 320 mm Phases 30 | 3.3 ± 1.5 | 1.6 ± 1.2 * | No |
| - | Gao [15] 2019 | 26 (65 ± 10), Patients with unexplained dyspnea | 25 (69 ± 8), HFpEF | 3.0T TR: NR ST:8 mm SR: matrix 232 × 219 FoV: NR Phases: NR | 2.6 ± 0.8 | 2.1 ± 0.8 * | Echo-Doppler. (Figure 2) |
| - | Hieda [16] 2017 | 12 (65–77) Healthy | 10 (62–85) HFpEF | 1.5T TR:39 ms ST: NR SR: NR Phases: NR | 3.6 ± 0.9 | 2.7 ± 0.9 * | Invasive and echo-Doppler (Figure 2) |
| - | Chacho [41] 2016 | 20 (44–56) Healthy | HCM 41 (45–57) AH 21 (47–61) | 1.5T TR: 50 ms ST:8 mm SR: Matrix 256 × 256 FoV 28–34 × 28–34 cm Phases: 25 | 2.9 (2.6–3.2) | HCM 2.7 (2.3–3.3), AH 2.7 (2.2–3.1) | No |
| - | Graca [42] 2014 | 21 (55 ± 7) Healthy | 41 (58 ± 7) DM2 | 3T TR 25–40 ms ST:8 mm SR: matrix 256 × 156 Pixel size 2.1 × 1.6 mm Phases 25 | 3.2 ± 0.8 | 3.1 ± 0.7 | No |
| - | Nacif [17] 2016 | 66 (67 ± 9) Normal DD ◊◊ | 15 (64 ± 10) Reduced DD ◊ | 1.5T TR: 30 ± 5 ms ST:8 mm SR: Matrix 205 × 256 FoV 36 cm Phases: 30 | 1.8 ± 0.5 | 2.1 ± 0.4 * | Echo-Doppler: (Figure 2) |
| Parameter | Author, Year | n (Age #), Controls | n (Age #), Patients | Sequence Parameter | Estimate, Controls | Estimate, Patients | Comparator ^ |
|---|---|---|---|---|---|---|---|
| ePFR/ aPFR | Maceira [36] 2006 | 20 (20–29) Healthy young | 20 (70–79) Healthy elderly | 1.5T TR: 22 ± 1 ms ST:7 mm SR: In-plane pixel 2.1 × 1.3 mm Phases: NR | 3.0 ± 0.34 | 0.5 ± 0.34* | No |
| Parikh [39] 2017 | 16 (60–69) Healthy | 15 (60–69) AH | 3T TR: NR ST: NR SR: NR Phases: NR | 1.5 ± 0.7 | 1.4 ± 0.4 | No | |
| Kawaji [45] 2009 | 51 (41 ± 14) Normal DD ◊◊ | 50 (64 ± 14) Reduced DD ◊ | 1.5T TR: 36 ± 10 ST: 6 mm SR: in-plane pixel 1.9 × 1.4 mm Phases: NR | 3.1 ± 1.6 | 1.6 ± 1.1 * | Average E/e′ 7 ± 3 vs. 15 ± 10 |
| Parameter | Author, Year | n (Age #), Controls | n (Age #), Patients | Sequence Parameter | Estimate, Controls | Estimate, Patients | Comparator ^ |
|---|---|---|---|---|---|---|---|
| LA maximum volume/ BSA (mL m−2) | Maceira [49] 2010 | 120 (20–80) Healthy | 1.5T TR: 21 ± 1 ST:5 mm SR: in-plane pixel 2.1 × 1.3 mm Phases: NR From Short axis | 40 ± 7 | No | ||
| - | Khan [65] 2019 | 85 (39 ± 12) Healthy | 10,890 (48–60) Various diseases | For controls 1.5T or 3T TR: NR ST: 6 mm SR: in-plan 1.5 × 1.5 × 2.1 mm Phases: 25–30 From 2 ch and 4 ch | 21–52 | LA dilatation Mild 52–62 Moderate 63–73 Severe >73 | No |
| - | Gao [15] 2019 | 26 (65 ± 10), Patients with unexplained dyspnea | 25 (69 ± 8), HFpEF | 3T TR: NR ST:8 mm SR: matrix 232 × 219 FoV; NR Phases: NR From: NR | 36 ± 12 | 46 ± 12 * | LVEDP < 16, E/e′ 9.4 ± 1.4 vs. LVEDP ≥ 16, E/e′ 12.7 ± 3.1 |
| - | Janwanishst-aporn [54] 2016 | 111 (71 ± 10) AH | 1.5T TR: NR ST: NR SR:1.25 × 1.25 × 8 mm2 Phases 25 From 2 ch and 4 ch | 55 ± 16 | No | ||
| - | Kowallick [55] 2016 | 23 (55 ± 11) Healthy | 73 (59 ± 13) HCM | 1.5T or 3T TR: 25–35 ms ST: NR SR: NR Phases 30 From 2 ch and 4 ch | 38 ± 7 | 52 ± 12 * | No |
| - | Shang [59] 2017 | 35 (52 ± 13) Healthy | 50 (55 ± 9) DM2 | 3T TR: NR ST:NR SR: NR Phases: NR From 2 ch and 4 ch | 35 ± 12 | 38 ± 11 | No |
| - | Kwong [61] 2015 | 37 (59 IQR 21) AH | 22 (66 IQR 17) Amyloidosis | 1.5T TR: 46 ST: 8 mm SR: in-plane pixel 1.5 × 1.8 or 1.8 × 2.1 mm Phases: NR From 2 ch and 4 ch | 46 IQR 47 | 60 IQR 17 * | Echo-Doppler: See text |
| - | Hinojar [57] 2019 | 75 (53 ± 16) Various diseases but none cardiac | 75 (55 ± 15) HCM | 1.5T TR: NR ST: NR SR: 1.8 × 1.8 × 8 mm Phases: NR From: NR | 44 ± 10 | 63 ± 20 | No |
| Parameter | Author, Year | n (Age #), Controls | n (Age #), Patients | Sequence Parameter | Estimate, Controls | Estimate, Patients | Comparator |
|---|---|---|---|---|---|---|---|
| LA total emptying fraction (%) | Maceira [53] 2016 | 20 (20–29) Healthy young | 20 (70–79) Healthy elderly | 1.5T TR: 21 ± 1 ST:5 mm SR: IN-plane pixel 2.1 × 1.3 mm Phases: NR From Short axis | 62 ± 6 | 55 ± 5 * | No |
| - | Aquaro [14] 2018 | 20 (51 ± 16), Healthy. Normal DD ◊. | 40 (54 ± 18), reduced DD ◊. Various diseases | 1.5T TR: NR ST: 8 mm SR: matrix 224 × 224 FoV 400 mm Phases: 30 From short axis | 48 ± 5 | DD I: 44 ± 5 * DD II: 25 ± 8 * DD III: 18 ± 12 * | Echo-Doppler (Figure 2) |
| - | Leng [19] 2018 | 50 (56 ± 13) Healthy | 30 (55 ± 14) HCM 30 (62 ± 11) HFpEF◊◊ | 3.0T TR: NR ST: 8 mm SR: matrix 240 × 240 FoV 300 mm Phases: 30–40 From 2 ch and 4 ch | 59 ± 5 | HCM 51 ± 7 * HFpEF 48 ± 7 * | Figure 2 |
| - | Kowallick [55] 2016 | 23 (55 ± 11) Healthy | 73 (59 ± 13) HCM | See Table 8 | 59 ± 6 | 51 ± 12 * | No |
| - | Shang [59] 2017 | 35 (52 ± 13) Healthy | 50 (55 ± 9) DM2 | See Table 8 | 59 ± 8 | 52 ± 9 | No |
| - | Kwong [61] (2015) | 37 (59 IQR 21) AH | 22 (66 IQR 17) Amyloidosis | See Table 8 | 40 ± 14 | 19 ± 14 * | Echo-Doppler: See text |
| - | Kowallick [18] 2014 | 10 (23–51) Healthy | 10 (44–73) HCM 10 (58–82) HfpEF ◊ | 1.5T TR: NR ST: 6–8 mm SR: Matrix 192–256 × 164–220 FoV 260–400 × 230 × 340 Phases: NR From 2 ch × 4 ch | 61 ± 6 | 59 ± 6 53 ± 7 * | Figure 2 |
| - | Hinojar [57] 2019 | 75 (53 ± 16) Various diseases but none cardiac | 75 (55 ± 15) HCM | See Table 8 | 55 ± 9 | 40 ± 16 * | No |
| Parameter | Author, Year | Controls, n (Age #) | Patients, n (Age #) | Sequence Parameter | Estimate, Controls | Estimate, Patients | Comparator |
|---|---|---|---|---|---|---|---|
| LA passive emptying fraction (%) | Maceira [53] 2016 | 20 (20–29) Healthy young | 20 (70–79) Healthy elderly | See Table 9 | 47 ± 6 | 29 ± 6 * | No |
| - | Kowallick [55] 2016 | 23 (55 ± 11) Healthy | 73 (59 ± 13) HCM | See Table 8 | 32 ± 7 | 22 ± 10 * | No |
| - | Shang [59] 2017 | 35 (52 ± 13) Healthy | 50 (55 ± 9) DM2 | See Table 8 | 39 ± 11 | 29 ± 10 * | No |
| - | Kwong [61] (2015) | 37 (59 IQR 21) AH | 22 (66 IQR 17) Amyloidosis | See Table 8 | 18 ± 12 | 11 ± 13 | Echo-Doppler: See text |
| - | Kowallick [18] 2014 | 10 (23–51) Healthy | 10 (44–73) HCM 10 (58–82) HFpEF◊ | See Table 9 | 35 ± 9 | HCM 26 ± 6 * HFpEF 24 ± 4 * | Figure 2 |
| - | Leng [19] 2018 | 50 (56 ± 13) Healthy | 30 (55 ± 14) HCM 30 (62 ± 11) HFpEF◊◊ | See Table 9 | 27 ± 7 | HCM 24 ± 7 * HFpEF 19 ± 7 * | Figure 2 |
| - | Hinojar [57] 2019 | 75 (53 ± 16) Various diseases but none cardiac | 75 (55 ± 15) HCM | See Table 8 | 24 ± 13 | 16 ± 11 | No |
| During dobutamine (%) | Ahtarovski [40] 2012 | 20 (20–30) Healthy Young | 20 (60–70) Healthy elderly | 1.5T TR:NR ST: 7 mm SR: Matix 192 × 162 FoV 300–360 mm Phases: 25 From Short axis | No change | 22 ± 9 * Decreased from 30 ± 7 | No |
| - | Farzaneh-Far [63] 2011 | 108 (61 ± 12) Low vs. high MACE incidence | 1.5T TR:45–50 ms ST: 8 mm SR: In-plane pixel 1.5 × 2 mm Phases: NR From 2 ch and 4 ch | Decrease of >11 from rest * | No | ||
| During glycol-pyrrolate (%) | Ahtarov-ski [40] 2012 | 20 (20–30) Healthy young | 20 (60–70) Healthy elderly | See above | No change | 16 ± 9 * Decrease from 30 ± 7 | No |
| Parameter | Author, Year | Controls, n (Age #) | Patients, n (Age #) | Sequence Parameter | Estimate, Controls | Estimate, Patients | Comparator |
|---|---|---|---|---|---|---|---|
| LA active emptying fraction (%) | Maceira [53] 2016 | 20 (20–29) Healthy young | 20 (70–79) Healthy elderly | See above | 32 ± 7 | 39 ± 7 * | No |
| - | Kowallick [55] 2016 | 23 (55 ± 11) Healthy | 73 (59 ± 13) HCM | 1.5T or 3T TR: 25–35 ms ST: NR SR: NR Phases: 30 From VLA and 4 ch | 40 ± 8 | 38 ± 10 | No |
| - | Kwong [61] (2015) | 37 (59 IQR 21) AH | 22 (66 IQR 17) Amyloidosis | 1.5T TR: 46 ST: 8 mm SR: in-plane pixel 1.5 × 1.8 or 1.8 × 2.1 mm Phases: NR From 2 ch × 4 ch | 28 ± 13 | 10 ± 11 * | Echo-Doppler: See text |
| - | Kowallick [18] 2014 | 10 (23–51) Healthy | 10 (44–73) HCM 10 (58–82) HFpEF | 1.5T TR: NR ST: 6–8 mm SR: Matrix 192–256 × 164–220 FoV 260–400 × 230 × 340 Phases: NR From 2 ch × 4 ch | 26 ± 7 | HCM 34 ± 6 * HFpEF 29 ± 7 | No |
| - | Leng [19] 2018 | 50 (56 ± 13) | 30 (55 ± 14) HCM 30 (62 ± 11) HFpEF | 3.0T TR: NR ST: 8 mm SR: matrix 240 × 240 FoV 300 mm Phases:30–40 From 2 ch and 4 ch | 43 ± 8 | HCM 36 ± 7 * HFpEF 36 ± 7 * | No |
| - | Hinojar [57] 2019 | 75 (53 ± 16) Various diseases but none cardiac | 75 (55 ± 15) HCM | 1.5T TR: NR ST: NR SR: 1.8 × 1.8 × 8 mm Phases: NR From: NR | 41 ± 11 | 27 ± 14 | No |
| Parameter | Author, Year | Controls, n (Age #), | Patients, n (Age #) | Sequence Parameter | Estimate, Controls | Estimate, Patients | Comparator |
|---|---|---|---|---|---|---|---|
| Radial (s−1) | Andre [87] 2015 | 150 (46 ± 14) Healthy | 1.5T TR: NR ST: 8 mm SR: In-plane pixel 2.2 × 2.2 mm Phases 35 From Short axis stack | −2.1 ± 0.5 | No | ||
| - | Shang [88] 2019 | 36 (51 ± 12) Healthy | 53 (54 ± 8) DM2 | 3T TR: NR ST: 6 mm SR: matrix 179 × 256 FoV 325 × 400 mm2 Phases 25 From 4 ch | −2.8 ± 1.0 | −2.7 ± 0.9 | No |
| Circumferential-endocardial (s−1) | Andre [87] 2015 | 150 (46 ± 14) Healthy | See above | 2.1 ± 0.6 | No | ||
| - | Nucifora [89] 2015 | 15 (46 ± 12) Healthy | 45 (48 ± 17) HCM | 1.5T TR:30 ms ST: 8 mm SR: matrix 205 × 256 FoV 340 × 340 mm Phases: NR from: NR | 1.5 ± 0.8 | 1.5 ± 0.3 | No |
| Circumferential-myocardial ◊ (s−1) | Andre [87] 2015 | 150 (46 ± 14) Healthy | See above | 1.7 ± 0.5 | No | ||
| - | Singh [31] 2015 | 8 (67 ± 8) 10 (67 ± 9) AS | 1.5T & 3T CSAPMM & SPAMM TR: 42 & 46 ST: 6 & 8 mm SR: NR Phases: NR from: Apical, mid-ventricular and basal slice | 1.3 ± 0.3 | Tagging CMR; 1.0 ± 0.3 | ||
| - | Mahmod [20] (2018) | 14 (69 ± 6) Healthy | 27 (72 ± 7) HFpEF | 3T TR: NR ST:NR SR:NR Phases: NR from: Short axis stack | 110 ± 28 % s−1 | 85 ± 27 % s−1 * | Figure 2 |
| - | Shang [88] 2019 | 36 (51 ± 12) Healthy | 53 (54 ± 8) DM2 | 3T TR: NR ST: 6 mm SR: matrix 179 × 256 FoV 325 × 400 mm2 Phases 25 From mid-ventricular short axis slice | 1.4 ± 0.4 | 1.3 ± 0.4 | No |
| Longitudinal-endocardial (s−1) | Andre [87] 2015 | 150 (46 ± 14) Healthy | See above. But from: 4 ch | 1.8 (1.5–2.2) | No | ||
| Longitudinal-myocardial ◊ (s−1) | Andre [87] 2015 | 150 (46 ± 14) Healthy | See above. But from: 4 ch | 1.6 (1.4–2.0) | No | ||
| - | Shang [88] 2019 | 36 (51 ± 12) Healthy | 53 (54 ± 8) DM2 | See above. But from: 4 ch | 1.2 ± 0.3 | 1.1 ± 0.2 * | No |
| Normalized Circumferential-endocardial (s−1) | Nucifora [89] 2015 | 15 (46 ± 12) Healthy | 45 (48 ± 17) HCM | See Above | −1.1 ± 0.2 | −0.9 ± 0.3 * | No |
| Parameter | Author, Year | Controls, n (Age #) | Patients, n (Age #) | Sequence Parameter | Estimate, Controls | Estimate, Patients | Comparator |
|---|---|---|---|---|---|---|---|
| Total longitudinal strain (%) | Evin [21] 2016 | 28 (25 ± 3) Healthy young | 30 (59 ± 7) Healthy elderly | 1.5T TR: 20–30 ms ST: 8 mm SR: matrix 260 × 192 FoV: NR Phases: NR | 26 ± 6 | 21 ± 6 * | Figure 2 |
| - | Kowallick [18] 2014 | 10 (23–51) Healthy | 10 (44–73) HCM 10 (58–82) HFpEF◊ | 1.5T TR: NR ST: 6–8 mm SR: Matrix 192–256 × 164–220 FoV 260–400 × 230 × 340 Phases: NR | 29 ± 5 | 22 ± 6* HCM 16 ± 6 * HFpEF | Figure 2 |
| - | Evin [94] 2015 | 10 (64 ± 6) Healthy | 10 (73 ± 15) AS | See above | 23 ± 5 | 12 ± 7 * | No |
| - | Leng [19] 2018 | 50 (56 ± 13) Healthy | 30 (55 ± 14) HCM 30 (62 ± 11) HFpEF | 3.0T TR: ST: 8 mm SR: matrix 240 × 240 FoV 300 mm Phases 30–40 | 35 ± 5 | HCM 27 ± 5 * HFpEF 24 ± 5 * | No |
| - | Von Roeder [22] 2017 | 12 (58 ± 9) Various diseases | 22 (65 ± 9) HFpEF◊ | 1.5T TR: NR ST: 8–10 mm SR: Voxel size 1.25 × 1.25 × 8 mm2 Phases: NR | 29 ± 6 | 22 ± 7 | Figure 2 |
| - | Hinojar [57] 2019 | 75 (53 ± 16) Various diseases | 75 (55 ± 15) HCM | 1.5T TR: NR ST: NR SR: 1.8 × 1.8 × 8 mm Phases: NR | 30 ± 6 | 17 ± 8 | No |
| Parameter | Author, Year | Controls, n (Age #) | Patients, n (Age #) | Sequence Parameter | Estimate, Controls | Estimate, Patients | Comparator |
|---|---|---|---|---|---|---|---|
| Total longitudinal strain rate (% s−1) | Evin [21] 2016 | 28 (25 ± 3) Healthy young | 30 (59 ± 7) Healthy elderly | See Table 13 | 1.3 ± 0.4 | 0.9 ± 0.2* | E/e′ 5 ± 1 vs. 7 ± 2 |
| - | Kowallick [18] 2014 | 10 (23–51) Healhy | 10 (44–73) HCM 10 (58–82) HFpEF | See Table 13 | 1.1 ± 0.2 | 0.9 ± 0.2 * 0.8 ± 0.3 * | No |
| - | Evin [94] 2015 | 10 (64 ± 6) Healthy elderly | 10 (73 ± 15) AS | See Table 13 | 1.5 ± 0.6 | 0.7 ± 0.5 * | No |
| - | Leng [19] 2018 | 50 (56 ± 13) Healthy | 30 (55 ± 14) HCM 30 (62 ± 11) HFpEF | See Table 13 | 1.8 ± 0.4 | HCM 1.3 ± 0.3 * HFpEF 1.1 ± 0.2 * | No |
| - | Von Roeder [22] 2017 | 12 (58 ± 9) Various diseases | 22 (65 ± 9) HFpEF ◊ | See Table 13 | 1.1 ± 0.3 | 0.8 ± 0.3 | E/e′ 7.2 ± 1 vs. 15 ± 4 |
Publisher’s Note: MDPI stays neutral with regard to jurisdictional claims in published maps and institutional affiliations. |
© 2021 by the authors. Licensee MDPI, Basel, Switzerland. This article is an open access article distributed under the terms and conditions of the Creative Commons Attribution (CC BY) license (https://creativecommons.org/licenses/by/4.0/).
Share and Cite
Bojer, A.S.; Soerensen, M.H.; Gaede, P.; Myerson, S.; Madsen, P.L. Left Ventricular Diastolic Function Studied with Magnetic Resonance Imaging: A Systematic Review of Techniques and Relation to Established Measures of Diastolic Function. Diagnostics 2021, 11, 1282. https://doi.org/10.3390/diagnostics11071282
Bojer AS, Soerensen MH, Gaede P, Myerson S, Madsen PL. Left Ventricular Diastolic Function Studied with Magnetic Resonance Imaging: A Systematic Review of Techniques and Relation to Established Measures of Diastolic Function. Diagnostics. 2021; 11(7):1282. https://doi.org/10.3390/diagnostics11071282
Chicago/Turabian StyleBojer, Annemie Stege, Martin Heyn Soerensen, Peter Gaede, Saul Myerson, and Per Lav Madsen. 2021. "Left Ventricular Diastolic Function Studied with Magnetic Resonance Imaging: A Systematic Review of Techniques and Relation to Established Measures of Diastolic Function" Diagnostics 11, no. 7: 1282. https://doi.org/10.3390/diagnostics11071282
APA StyleBojer, A. S., Soerensen, M. H., Gaede, P., Myerson, S., & Madsen, P. L. (2021). Left Ventricular Diastolic Function Studied with Magnetic Resonance Imaging: A Systematic Review of Techniques and Relation to Established Measures of Diastolic Function. Diagnostics, 11(7), 1282. https://doi.org/10.3390/diagnostics11071282