
Raman Spectroscopy Technique: A Non-Invasive Tool in Celiac Disease Diagnosis

 ,
, 
Abstract
:1. Introduction
2. Materials and Methods
2.1. Patients and Sample Preparation
2.2. FT Raman Spectroscopy, Data Collection and Analysis
2.3. Statistical Analysis
3. Results
4. Discussion
5. Conclusions
6. Patents
Author Contributions
Funding
Institutional Review Board Statement
Informed Consent Statement
Acknowledgments
Conflicts of Interest
References
- Lebwohl, B.; Sanders, D.S.; Green, P.H.R. Coeliac disease. Lancet 2018, 391, 70–81. [Google Scholar] [CrossRef]
- Ludvigsson, J.F.; Murray, J.A. Epidemiology of Celiac Disease. Gastroenterol. Clin. N. Am. 2019, 48, 1–18. [Google Scholar] [CrossRef] [PubMed] [Green Version]
- Fasano, A.; Berti, I.; Gerarduzzi, T.; Not, T.; Colletti, R.B.; Drago, S.; Elitsur, Y.; Green, P.H.R.; Guandalini, S.; Hill, I.D.; et al. Prevalence of Celiac Disease in At-Risk and Not-At-Risk Groups in the United States. Arch. Intern. Med. 2003, 163, 286–292. [Google Scholar] [CrossRef]
- Ludvigsson, J.F.; Bai, J.C.; Biagi, F.; Card, T.R.; Ciacci, C.; Ciclitira, P.J.; Green, P.H.R.; Hadjivassiliou, M.; Holdoway, A.; van Heel, D.A.; et al. Diagnosis and management of adult coeliac disease: Guidelines from the British Society of Gastroenterology. Gut 2014, 63, 1210–1228. [Google Scholar] [CrossRef]
- Husby, S.; Koletzko, S.; Korponay-Szabó, I.; Kurppa, K.; Mearin, M.L.; Ribes-Koninckx, C.; Shamir, R.; Troncone, R.; Auricchio, R.; Castillejo, G.; et al. European Society Paediatric Gastroenterology, Hepatology and Nutrition Guidelines for Diagnosing Coeliac Disease 2020. J. Pediatr. Gastroenterol. Nutr. 2020, 70, 141–156. [Google Scholar] [CrossRef] [PubMed] [Green Version]
- Freeman, H.J. Adult Celiac Disease and Its Malignant Complications. Gut Liver 2009, 3, 237–246. [Google Scholar] [CrossRef] [Green Version]
- Neumann, H.; Vieth, M.; Langner, C.; Neurath, M.F.; Mudter, J. Cancer risk in IBD: How to diagnose and how to manage DALM and ALM. World J. Gastroenterol. 2011, 17, 3184–3191. [Google Scholar] [CrossRef] [PubMed]
- Wachsmann-Hogiu, S.; Weeks, T.; Huser, T. Chemical analysis in vivo and in vitro by Raman spectroscopy—from single cells to humans. Curr. Opin. Biotechnol. 2009, 20, 63–73. [Google Scholar] [CrossRef] [PubMed] [Green Version]
- Orkoula, M.G.; Kontoyannis, C.G. Raman spectroscopy for the study of biological organisms (biogenic materials and biological tissues): A valuable analytical tool. Spectrosc Eur. 2014, 26, 16–19. [Google Scholar]
- Venuti, V.; Crupi, V.; Fazio, B.; Majolino, D.; Acri, G.; Testagrossa, B.; Stancanelli, R.; De Gaetano, F.; Gagliardi, A.; Paolino, D.; et al. Physicochemical Characterization and Antioxidant Activity Evaluation of Idebenone/Hydroxypropyl-β-Cyclodextrin Inclusion Complex. Biomolecules 2019, 9, 531. [Google Scholar] [CrossRef] [Green Version]
- Acri, G.; Testagrossa, B.; Giudice, E.; Arfuso, F.; Piccione, G.; Giannetto, C. Application of Raman Spectroscopy for the Evaluation of Metabolomic Dynamic Analysis in Athletic Horses. J. Equine Veter Sci. 2021, 96, 103319. [Google Scholar] [CrossRef]
- Acri, G.; Testagrossa, B.; Faenza, P.; Caridi, F. Spectroscopic analysis of pigments of the Antonello Gagini annunciation’s sculptural marble group, church of st. Theodore martyr (Bagaladi, Reggio Calabria, Italy): Case study. Mediterr. Archaeol. Archaeom. 2020, 20, 1–5. [Google Scholar] [CrossRef]
- Pence, I.; Mahadevan-Jansen, A. Clinical instrumentation and applications of Raman spectroscopy. Chem. Soc. Rev. 2016, 45, 1958–1979. [Google Scholar] [CrossRef] [Green Version]
- Almond, M.; Hutchings, J.; Lloyd, G.; Barr, H.; Shepherd, N.; Day, J.; Stevens, O.; Sanders, S.; Wadley, M.; Stone, N.; et al. Endoscopic Raman spectroscopy enables objective diagnosis of dysplasia in Barrett’s esophagus. Gastrointest. Endosc. 2014, 79, 37–45. [Google Scholar] [CrossRef] [PubMed]
- Haka, A.S.; Volynskaya, Z.; Gardecki, J.A.; Nazemi, J.H.; Shenk, R.; Wang, N.; Dasari, R.R.; Fitzmaurice, M.; Feld, M.S. Diagnosing breast cancer using Raman spectroscopy: Prospective analysis. J. Biomed. Opt. 2009, 14, 054023. [Google Scholar] [CrossRef] [PubMed] [Green Version]
- Li, Y.; Wen, Z.-N.; Li, L.-J.; Li, M.-L.; Gao, N.; Guo, Y.-Z. Research on the Raman spectral character and diagnostic value of squamous cell carcinoma of oral mucosa. J. Raman Spectrosc. 2009, 41, 142–147. [Google Scholar] [CrossRef]
- Leslie, D.G.; Kast, R.; Poulik, J.M.; Rabah, R.; Sood, S.; Auner, G.W.; Klein, M.D. Identification of Pediatric Brain Neoplasms Using Raman Spectroscopy. Pediatr. Neurosurg. 2012, 48, 109–117. [Google Scholar] [CrossRef]
- Feng, X.; Moy, A.J.; Nguyen, H.T.M.; Zhang, Y.; Zhang, J.; Fox, M.C.; Sebastian, K.R.; Reichenberg, J.S.; Markey, M.K.; Tunnell, J.W. Raman biophysical markers in skin cancer diagnosis. J. Biomed. Opt. 2018, 23, 057002. [Google Scholar] [CrossRef]
- Kallaway, C.; Almond, L.M.; Barr, H.; Wood, J.; Hutchings, J.; Kendall, C.; Stone, N. Advances in the clinical application of Raman spectroscopy for cancer diagnostics. Photodiagnosis Photodyn. Ther. 2013, 10, 207–219. [Google Scholar] [CrossRef] [PubMed]
- Anna, I.; Bartosz, P.; Lech, P.; Halina, A. Novel strategies of Raman imaging for brain tumor research. Oncotarget 2017, 8, 85290–85310. [Google Scholar] [CrossRef] [PubMed] [Green Version]
- Desroches, J.; Jermyn, M.; Pinto, M.; Picot, F.; Tremblay, M.-A.; Obaid, S.; Marple, E.; Urmey, K.; Trudel, D.; Soulez, G.; et al. A new method using Raman spectroscopy for in vivo targeted brain cancer tissue biopsy. Sci. Rep. 2018, 8, 1–10. [Google Scholar] [CrossRef]
- Cui, S.; Zhang, S.; Yue, S. Raman Spectroscopy and Imaging for Cancer Diagnosis. J. Healthc. Eng. 2018, 2018, 1–11. [Google Scholar] [CrossRef] [PubMed]
- Kuo, M.-T.; Lin, C.-C.; Liu, H.-Y.; Chang, H.-C. Tear Analytical Model Based on Raman Microspectroscopy for Investigation of Infectious Diseases of the Ocular Surface. Investig. Opthalmology Vis. Sci. 2011, 52, 4942–4950. [Google Scholar] [CrossRef] [Green Version]
- Harz, M.; Kiehntopf, M.; Stöckel, S.; Rösch, P.; Straube, E.; Deufel, T.; Popp, J. Direct analysis of clinical relevant single bacterial cells from cerebrospinal fluid during bacterial meningitis by means of micro-Raman spectroscopy. J. Biophotonics 2009, 2, 70–80. [Google Scholar] [CrossRef]
- Kloss, S.; Kampe, B.; Sachse, S.; Rösch, P.; Straube, E.; Pfister, W.; Kiehntopf, M.; Popp, J. Culture Independent Raman Spectroscopic Identification of Urinary Tract Infection Pathogens: A Proof of Principle Study. Anal. Chem. 2013, 85, 9610–9616. [Google Scholar] [CrossRef] [PubMed]
- Willemse-Erix, H.; Scholtes-Timmerman, M.; Jachtenberg, J.-W.; Van Leeuwen, W.; Horst-Kreft, D.; Schut, T.B.; Deurenberg, R.; Puppels, G.; Van Belkum, A.; Vos, M.; et al. Optical Fingerprinting in Bacterial Epidemiology: Raman Spectroscopy as a Real-Time Typing Method. J. Clin. Microbiol. 2008, 47, 652–659. [Google Scholar] [CrossRef] [Green Version]
- Devitt, G.; Howard, K.; Mudher, A.; Mahajan, S. Raman Spectroscopy: An Emerging Tool in Neurodegenerative Disease Research and Diagnosis. ACS Chem. Neurosci. 2018, 9, 404–420. [Google Scholar] [CrossRef] [PubMed]
- Bi, X.; Walsh, A.; Mahadevan-Jansen, A.; Herline, A. Development of Spectral Markers for the Discrimination of Ulcerative Colitis and Crohn’s Disease Using Raman Spectroscopy. Dis. Colon Rectum 2011, 54, 48–53. [Google Scholar] [CrossRef]
- Bielecki, C.; Bocklitz, T.W.; Schmitt, M.; Krafft, C.; Marquardt, C.; Gharbi, A.; Knösel, T.; Stallmach, A.; Popp, J. Classification of inflammatory bowel diseases by means of Raman spectroscopic imaging of epithelium cells. J. Biomed. Opt. 2012, 17, 0760301–0760308. [Google Scholar] [CrossRef] [Green Version]
- Pence, I.; Beaulieu, D.B.; Horst, S.N.; Bi, X.; Herline, A.J.; Schwartz, D.A.; Mahadevan-Jansen, A. Clinical characterization of in vivo inflammatory bowel disease with Raman spectroscopy. Biomed. Opt. Express 2017, 8, 524–535. [Google Scholar] [CrossRef] [PubMed] [Green Version]
- Marro, M.; Taubes, A.; Abernathy, A.; Balint, S.; Moreno, B.; Sanchez-Dalmau, B.F.; Martínez-Lapiscina, E.H.; Amat-Roldan, I.; Petrov, D.; Villoslada, P. Dynamic molecular monitoring of retina inflammation byin vivoRaman spectroscopy coupled with multivariate analysis. J. Biophotonics 2013, 7, 724–734. [Google Scholar] [CrossRef]
- O’Regan, G.M.; Kemperman, P.M.; Sandilands, A.; Chen, H.; Campbell, L.E.; Kroboth, K.; Watson, R.; Rowland, M.; Puppels, G.J.; McLean, W.I.; et al. Raman profiles of the stratum corneum define 3 filaggrin genotype–determined atopic dermatitis endophenotypes. J. Allergy Clin. Immunol. 2010, 126, 574–580. [Google Scholar] [CrossRef] [Green Version]
- Rygula, A.; Majzner, K.; Marzec, K.M.; Kaczor, A.; Pilarczyk, M.; Baranska, M. Raman spectroscopy of proteins: A review. J. Raman Spectrosc. 2013, 44, 1061–1076. [Google Scholar] [CrossRef]
- Fornasaro, S.; Vicario, A.; De Leo, L.; Bonifacio, A.; Not, T.; Sergo, V. Potential use of MCR-ALS for the identification of coeliac-related biochemical changes in hyperspectral Raman maps from pediatric intestinal biopsies. Integr. Biol. 2018, 10, 356–363. [Google Scholar] [CrossRef] [PubMed]
- Acri, G.; Venuti, V.; Costa, S.; Testagrossa, B.; Pellegrino, S.; Crupi, V.; Majolino, D. Raman Spectroscopy as Noninvasive Method of Diagnosis of Pediatric Onset Inflammatory Bowel Disease. Appl. Sci. 2020, 10, 6974. [Google Scholar] [CrossRef]
- Morasso, C.; Truffi, M.; Vanna, R.; Albasini, S.; Mazzucchelli, S.; Colombo, F.; Sorrentino, L.; Sampietro, G.; Ardizzone, S.; Corsi, F. Raman Analysis Reveals Biochemical Differences in Plasma of Crohn’s Disease Patients. J. Crohns Coliti 2020, 14, 1572–1580. [Google Scholar] [CrossRef] [PubMed]
- Ralbovsky, N.M.; Lednev, I.K. Analysis of individual red blood cells for Celiac disease diagnosis. Talanta 2021, 221, 121642. [Google Scholar] [CrossRef] [PubMed]
- Kurouski, D.; Van Duyne, R.P.; Lednev, I.K. Exploring the structure and formation mechanism of amyloid fibrils by Raman spectroscopy: A review. Analyst 2015, 140, 4967–4980. [Google Scholar] [CrossRef] [PubMed]
- Hernández, B.; Pflüger, F.; Kruglik, S.G.; Ghomi, M. Characteristic Raman lines of phenylalanine analyzed by a multiconformational approach. J. Raman Spectrosc. 2013, 44, 827–833. [Google Scholar] [CrossRef]
- Herrero, A.; Cambero, M.; Ordóñez, J.; De La Hoz, L.; Carmona, P. Raman spectroscopy study of the structural effect of microbial transglutaminase on meat systems and its relationship with textural characteristics. Food Chem. 2008, 109, 25–32. [Google Scholar] [CrossRef] [Green Version]
- Kumar, R.; Indrayan, A. Receiver operating characteristic (ROC) curve for medical researchers. Indian Pediatr. 2011, 48, 277–287. [Google Scholar] [CrossRef]
- Feinstein, A.R. XXXI. On the sensitivity, specificity, and discrimination of diagnostic tests. Clin. Pharmacol. Ther. 1975, 17, 104–116. [Google Scholar] [CrossRef]
- Lalkhen, M.C.F.A.G.; McCluskey, B.M.C.F.A. Clinical tests: Sensitivity and specificity. Contin. Educ. Anaesth. Crit. Care Pain 2008, 8, 221–223. [Google Scholar] [CrossRef] [Green Version]
- Hajian-Tilaki, K. Receiver Operating Characteristic (ROC) Curve Analysis for Medical Diagnostic Test Evaluation. Casp. J. Intern. Med. 2013, 4, 627–635. [Google Scholar]
- Fluss, R.; Faraggi, D.; Reiser, B. Estimation of the Youden Index and its Associated Cutoff Point. Biom. J. 2005, 47, 458–472. [Google Scholar] [CrossRef] [PubMed] [Green Version]
- Mandrekar, J.N. Receiver Operating Characteristic Curve in Diagnostic Test Assessment. J. Thorac. Oncol. 2010, 5, 1315–1316. [Google Scholar] [CrossRef] [Green Version]
- Youden, W.J. Index for rating diagnostic tests. Cancer 1950, 3, 32–35. [Google Scholar] [CrossRef]
- Schisterman, E.F.; Perkins, N.; Liu, A.; Bondell, H. Optimal Cut-point and Its Corresponding Youden Index to Discriminate Individuals Using Pooled Blood Samples. Epidemiology 2005, 16, 73–81. [Google Scholar] [CrossRef] [PubMed]
- Boyaci, I.H.; Temiz, H.T.; Geniş, H.E.; Soykut, E.A.; Yazgan, N.N.; Guven, B.; Uysal, R.S.; Bozkurt, A.G.; Ilaslan, K.; Torun, O.; et al. Dispersive and FT-Raman spectroscopic methods in food analysis. RSC Adv. 2015, 5, 56606–56624. [Google Scholar] [CrossRef]
- Harris, M.; Cilwa, K.; Elster, E.A.; Potter, B.K.; Forsberg, J.A.; Crane, N.J. Pilot study for detection of early changes in tissue associated with heterotopic ossification: Moving toward clinical use of Raman spectroscopy. Connect. Tissue Res. 2015, 56, 144–152. [Google Scholar] [CrossRef]
- Gao, F.; Xu, L.; Zhang, Y.; Yang, Z.; Han, L.; Liu, X. Analytical Raman spectroscopic study for discriminant analysis of different animal-derived feedstuff: Understanding the high correlation between Raman spectroscopy and lipid characteristics. Food Chem. 2018, 240, 989–996. [Google Scholar] [CrossRef]
- Howell, N.K.; Arteaga, G.; Nakai, S.; Li-Chan, E.C.Y. Raman Spectral Analysis in the C−H Stretching Region of Proteins and Amino Acids for Investigation of Hydrophobic Interactions. J. Agric. Food Chem. 1999, 47, 924–933. [Google Scholar] [CrossRef]
- Talari, A.C.S.; Movasaghi, Z.; Rehman, S.; Rehman, I.U. Raman Spectroscopy of Biological Tissues. Appl. Spectrosc. Rev. 2015, 50, 46–111. [Google Scholar] [CrossRef]
- Stewart, S.; Fredericks, P. Surface-enhanced Raman spectroscopy of amino acids adsorbed on an electrochemically prepared silver surface. Spectrochim. Acta Part A Mol. Biomol. Spectrosc. 1999, 55, 1641–1660. [Google Scholar] [CrossRef]
- Bandekar, J. Amide modes and protein conformation. Biochim. Biophys. Acta Protein Struct. Mol. Enzymol. 1992, 1120, 123–143. [Google Scholar] [CrossRef]
- Brusco, G.; Muzi, P.; Ciccocioppo, R.; Biagi, F.; Cifone, M.G.; Corazza, G.R. Transglutaminase and coeliac disease: Endomysial reactivity and small bowel expression. Clin. Exp. Immunol. 1999, 118, 371–375. [Google Scholar] [CrossRef] [PubMed]
- Di Sabatino, A.; Vanoli, A.; Giuffrida, P.; Luinetti, O.; Solcia, E.; Corazza, G.R. The function of tissue transglutaminase in celiac disease. Autoimmun. Rev. 2012, 11, 746–753. [Google Scholar] [CrossRef]


| CD | Non-CD | |
|---|---|---|
| Median age and SD 1 | 15.6 (3.15) | 12.6 (5.17) |
| M:F ratio | 1.4 | 1.5 |
| Final diagnosis in non-CD group | - | IBS * (50%), RAP ** (30%), Functional dyspepsia # (15%), Iron deficiency Anemia (5%) |
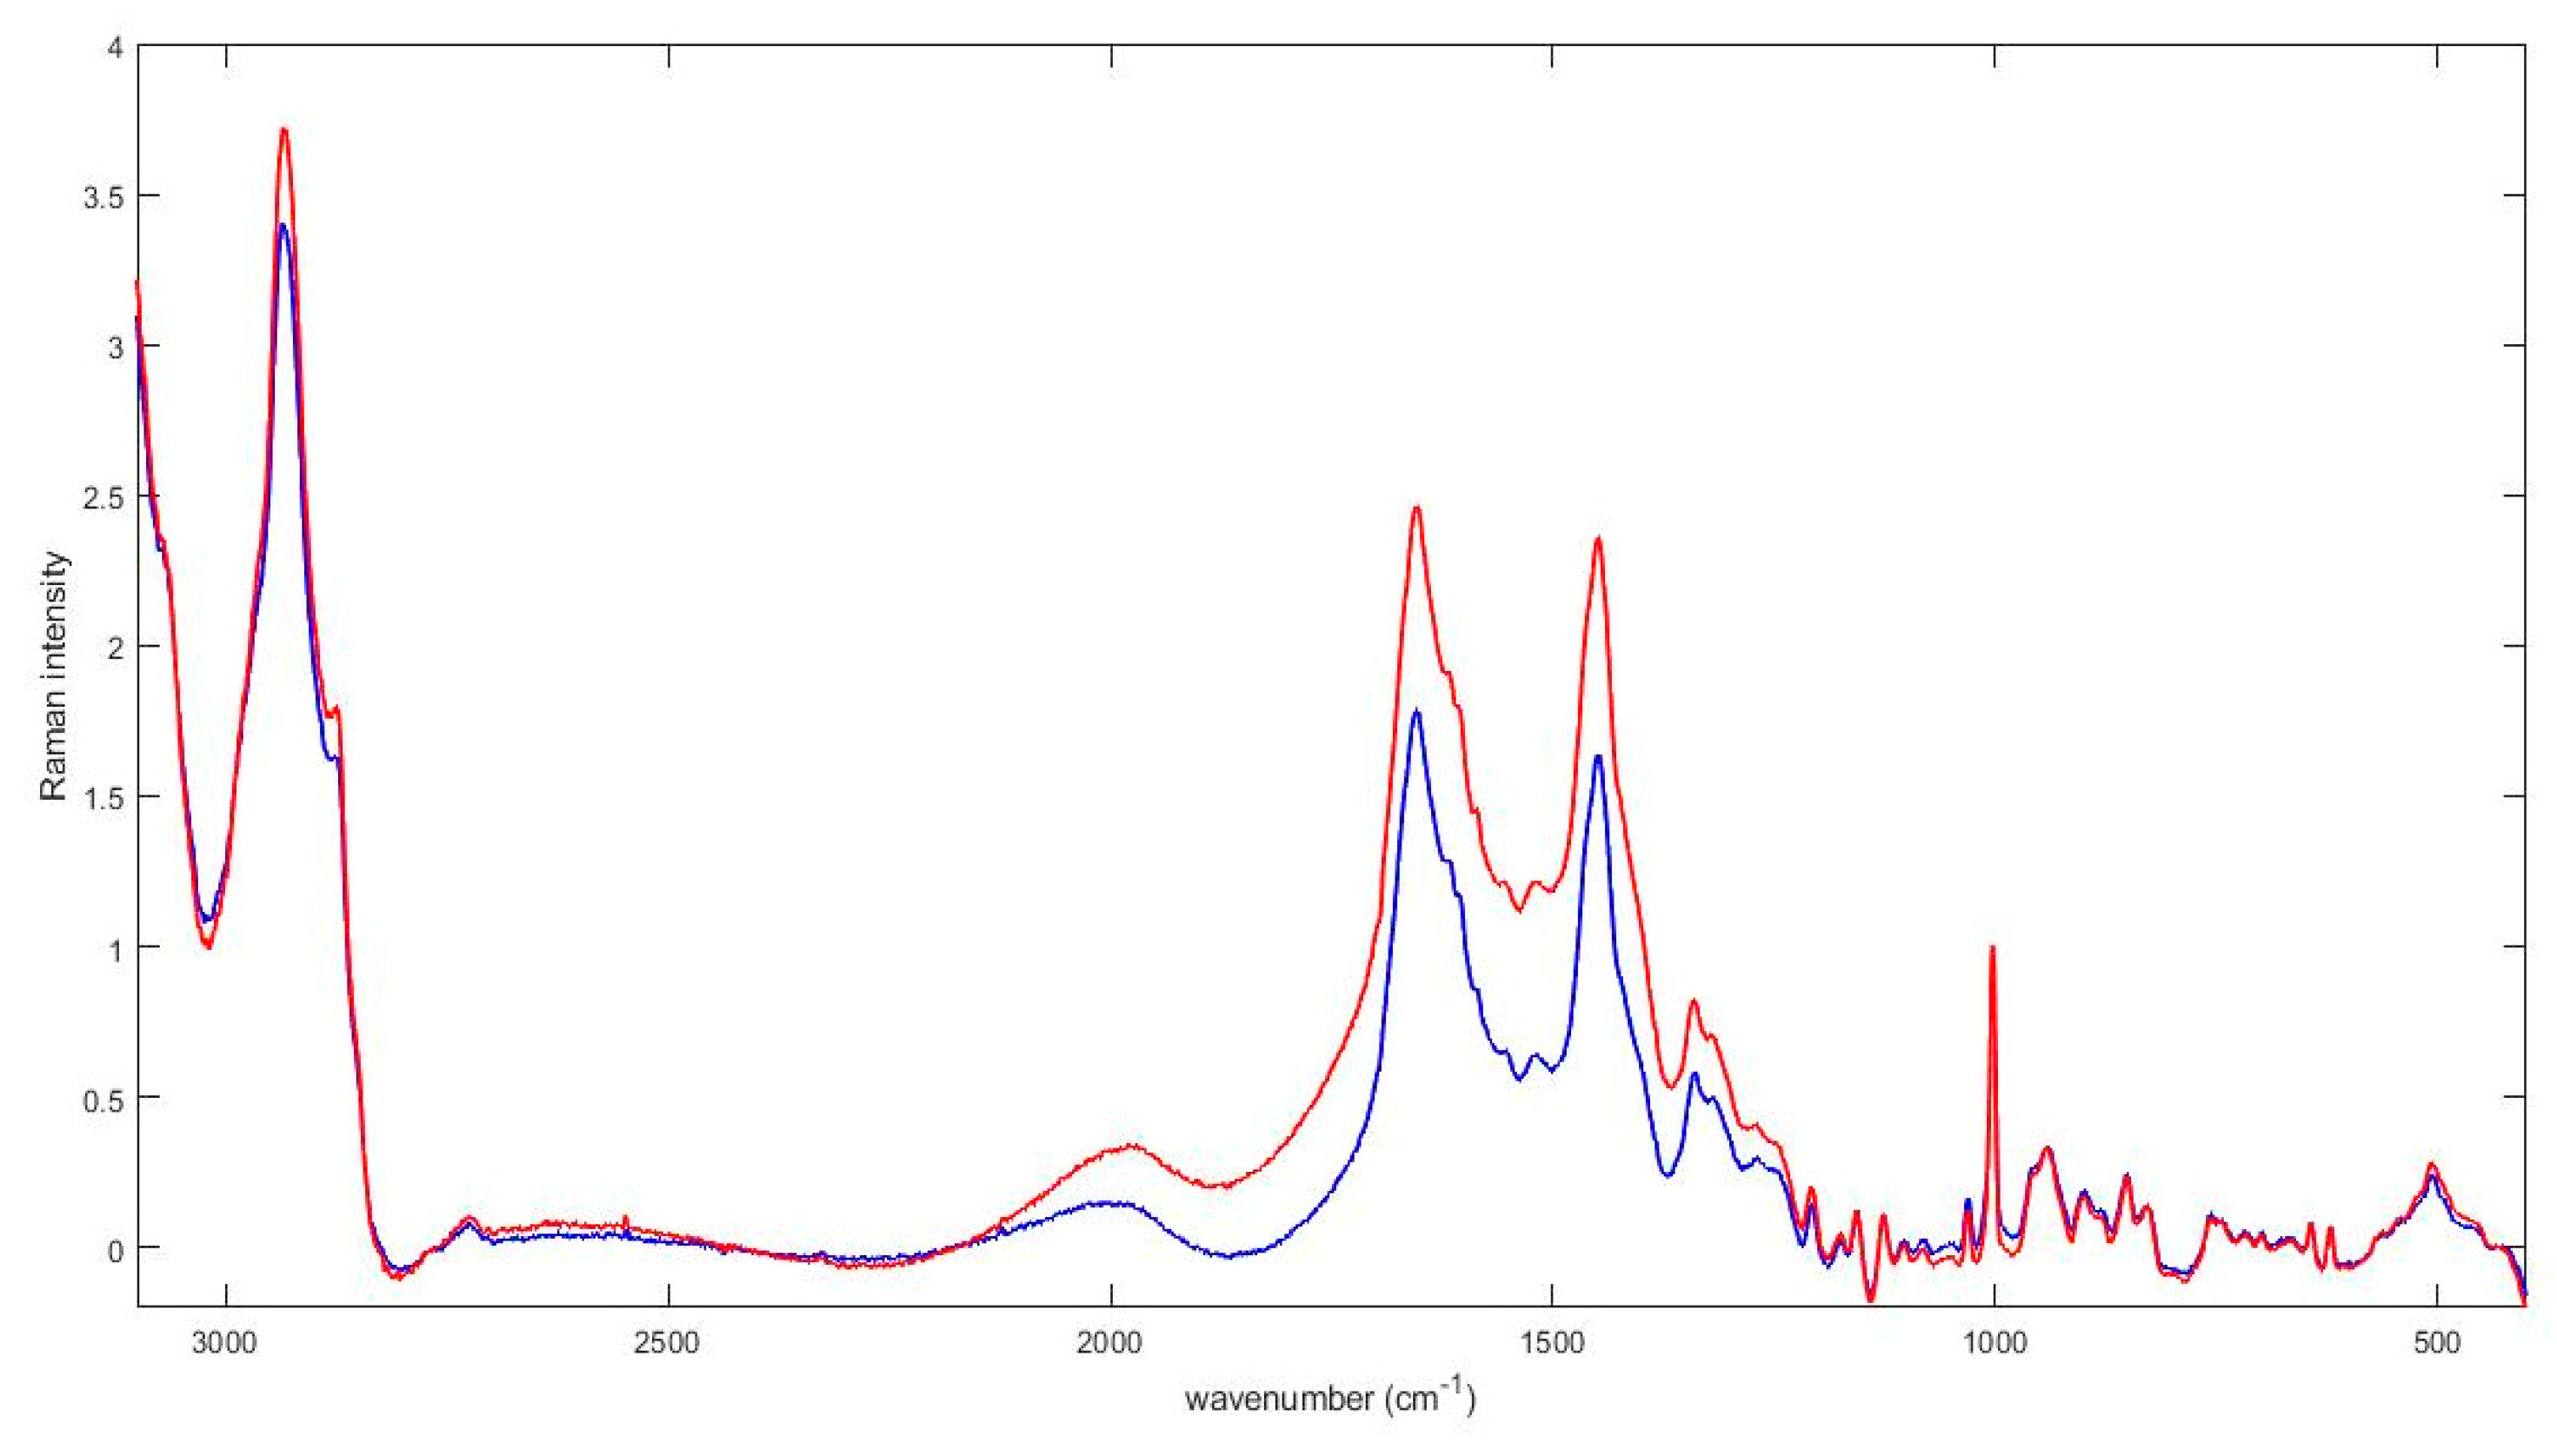
| Center Frequency (cm−1) | Tentative Assignment | References |
|---|---|---|
| 520 | Disulfide band | [32] |
| 759 | Ring vibration of tryptophan | [33] |
| 830 and 850 | Tyrosine doublet | [33,34] |
| 1003 | Phenylalanine | [40] |
| 1300 band | Amide III vibration | [49] |
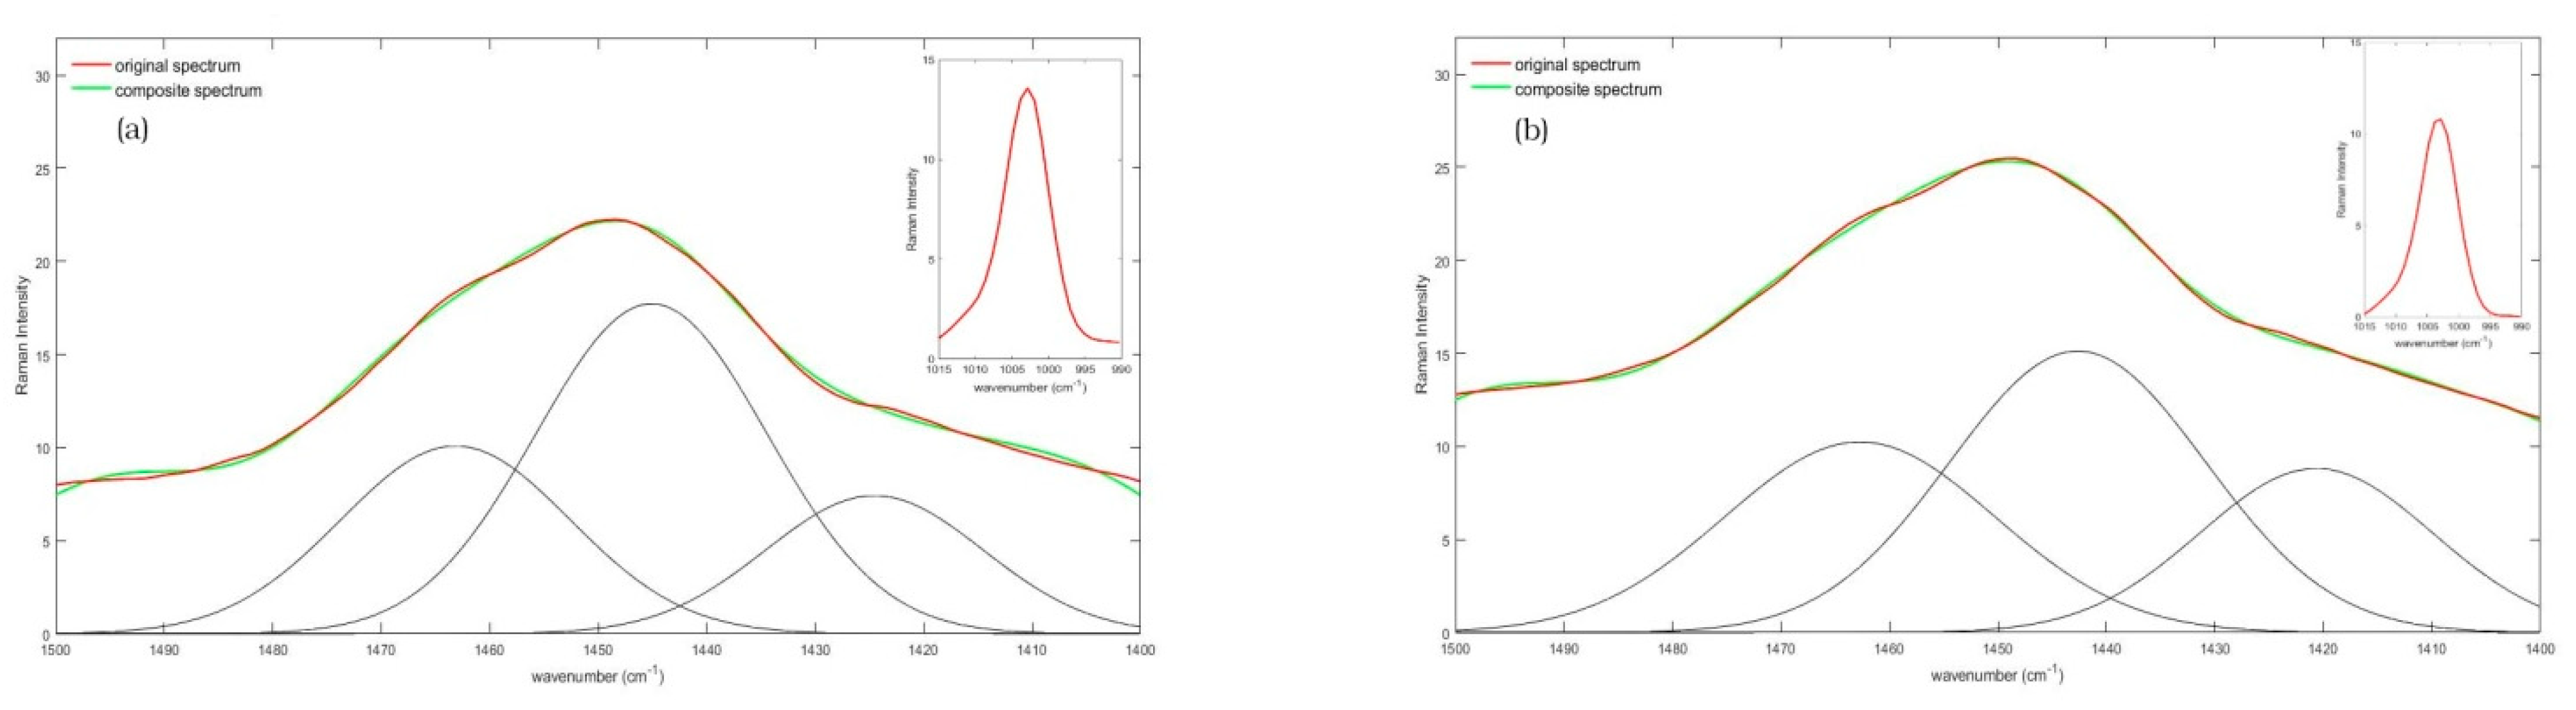
| 1450 band | CH2 scissoring deformation | [49,50] |
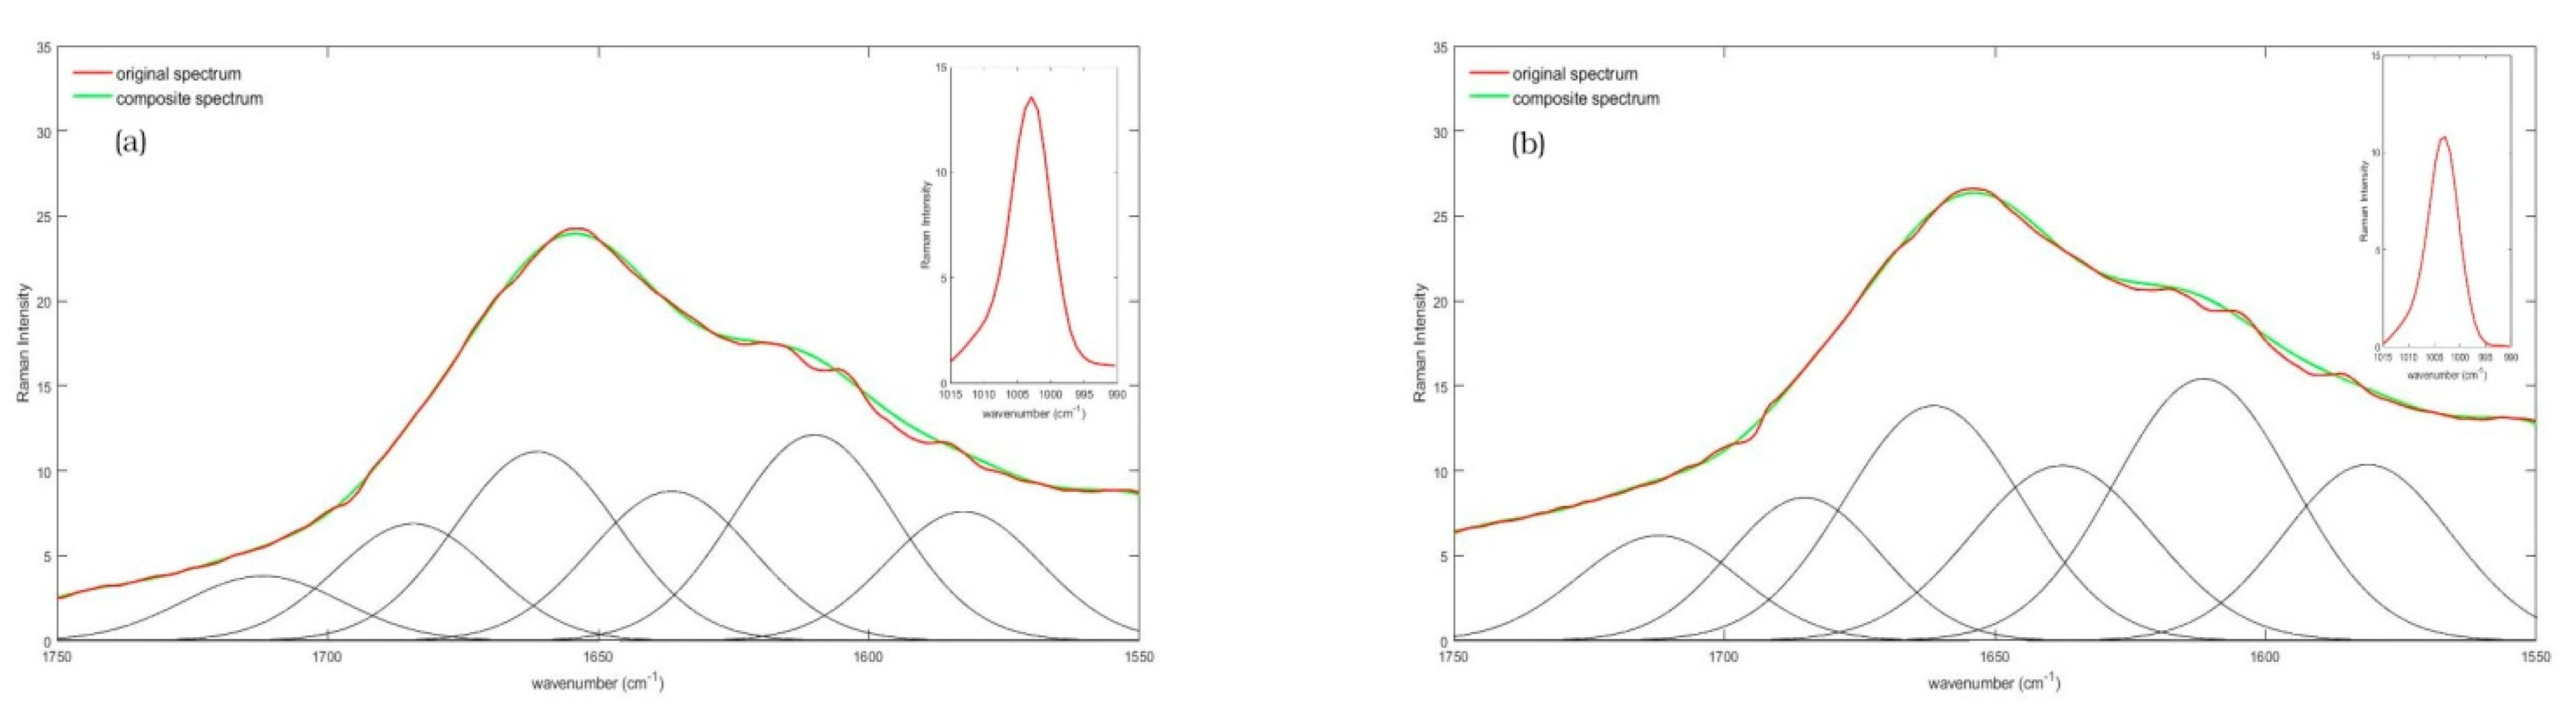
| 1550 | Amide II vibration | [39] |
| 1650 | Amide I vibration | [38] |
| 2935 | C–H Stretching vibration | [51] |
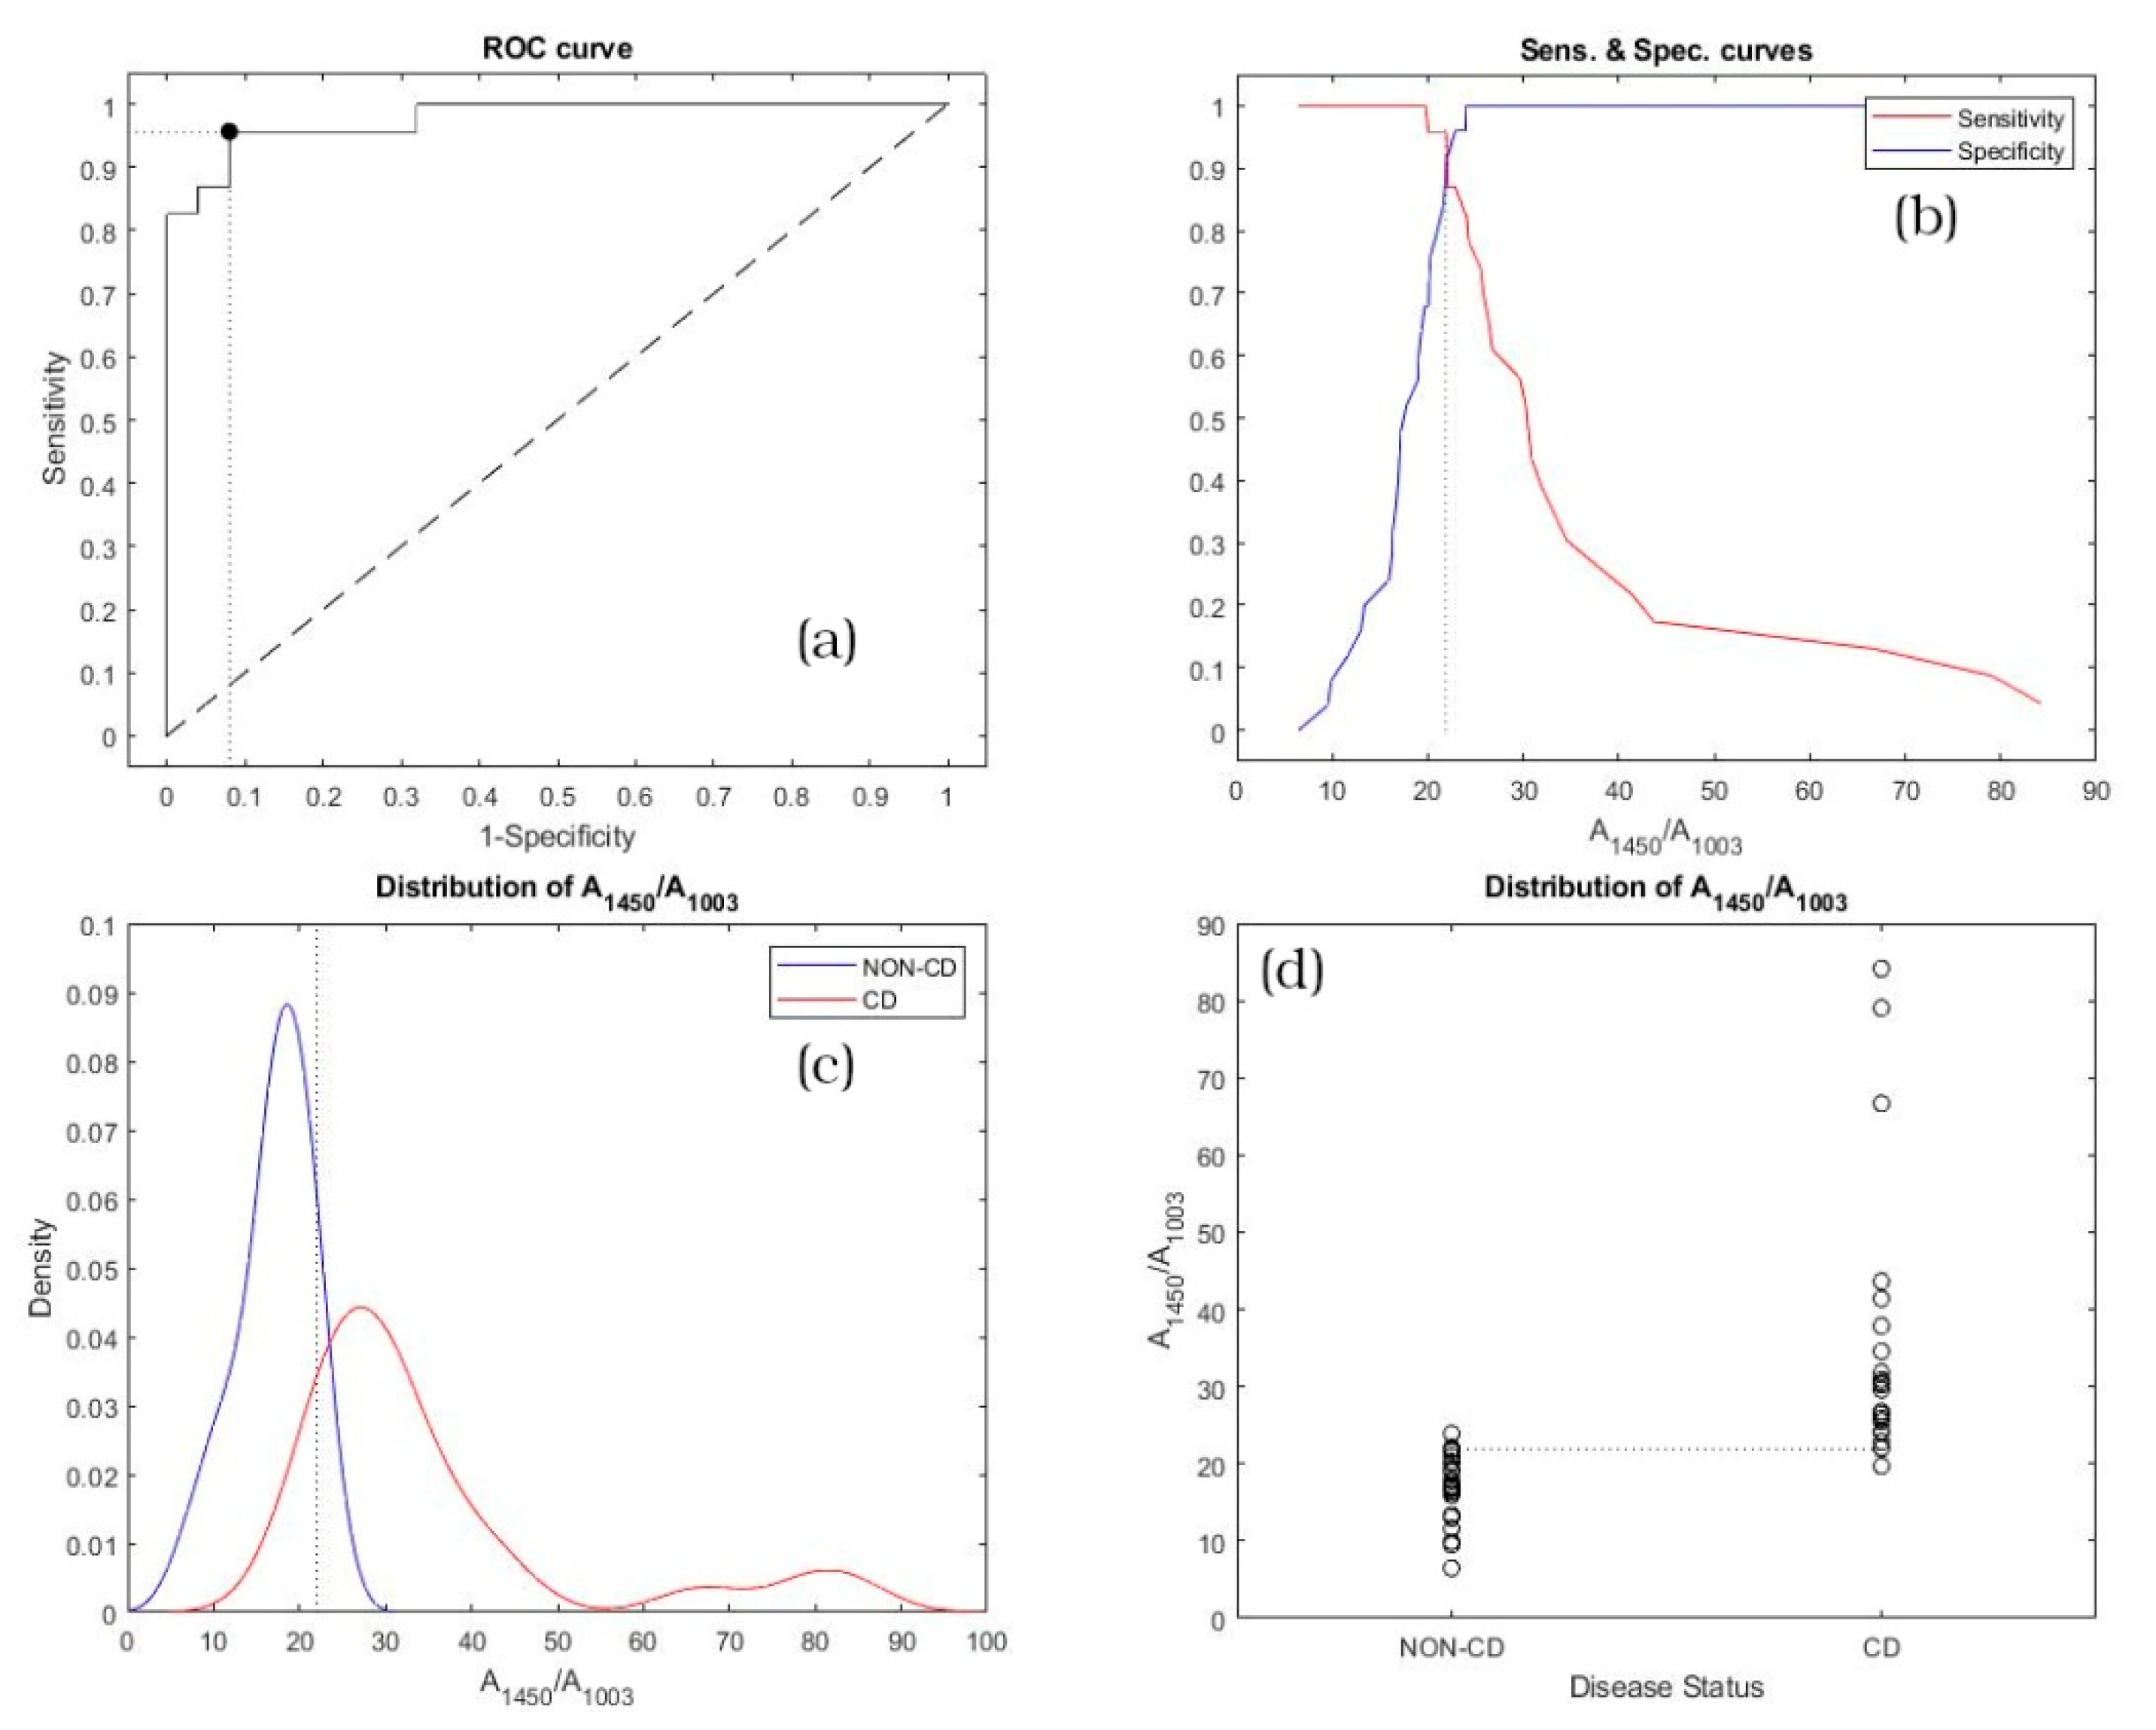
| Marker | AUC | Lower Limit | Upper Limit |
|---|---|---|---|
| A1450/A1003 | 0.97739 | 0.85208 | 0.99984 |
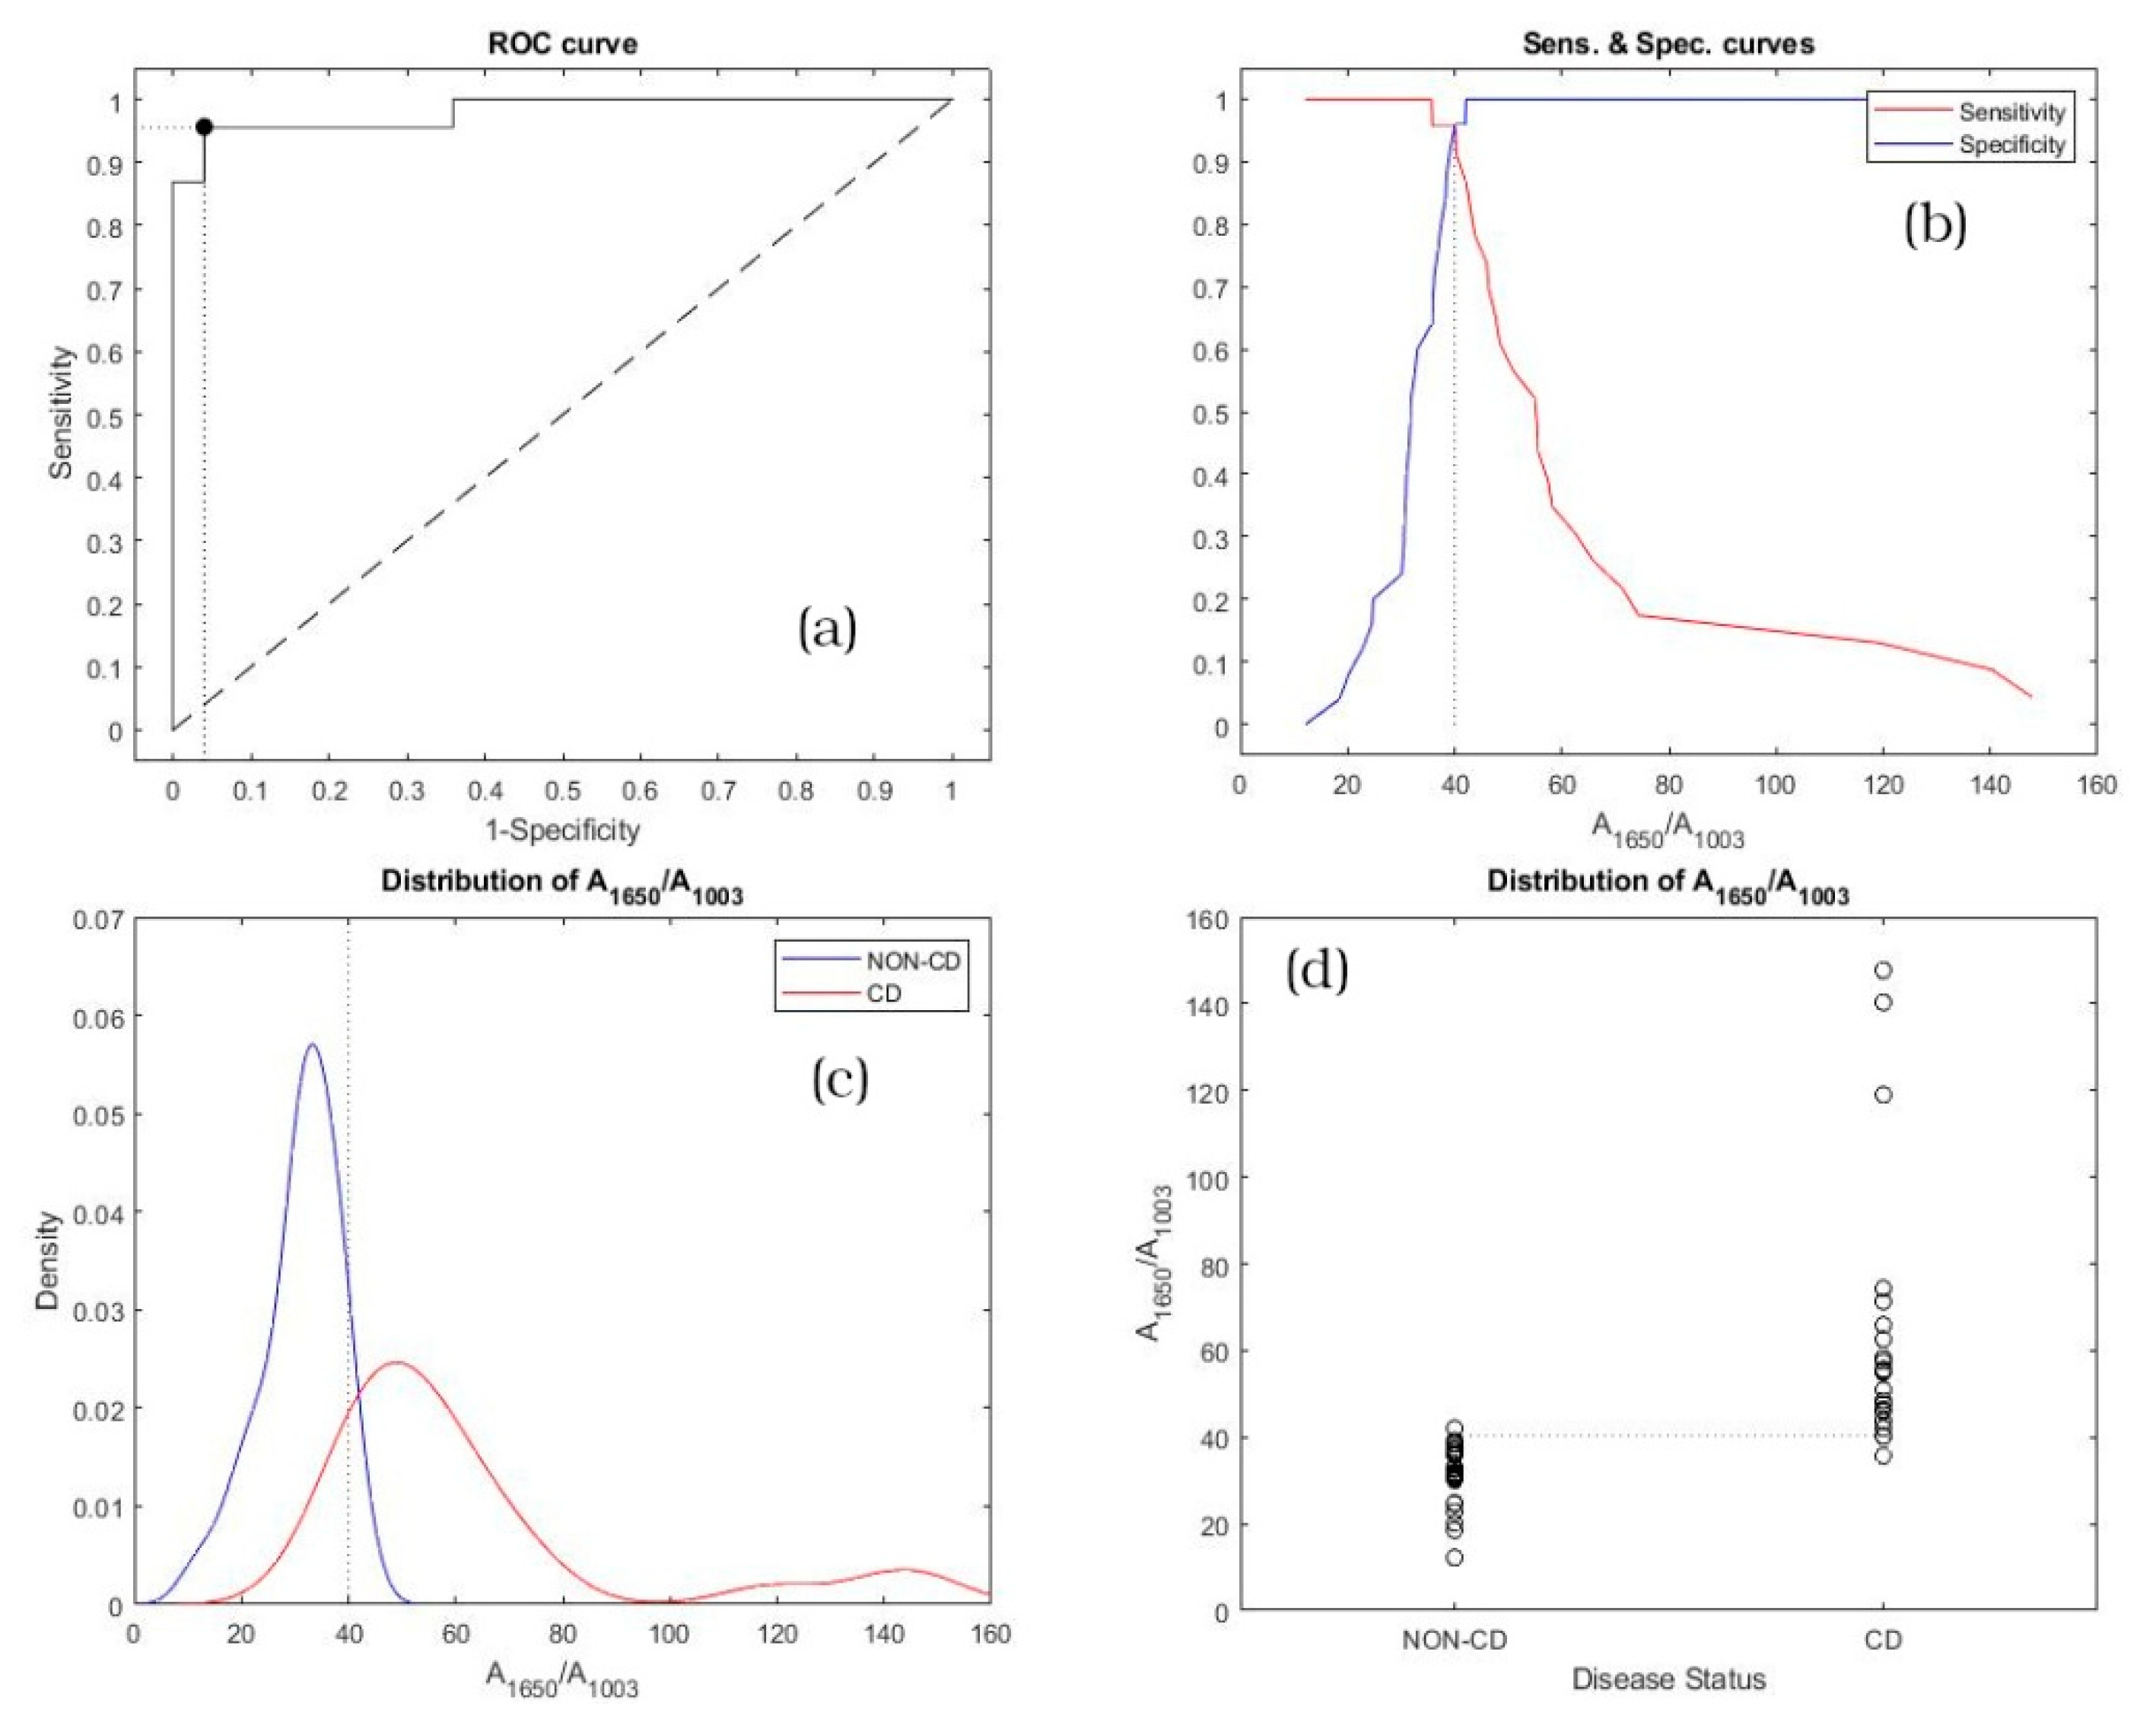
| A1650/A1003 | 0.98087 | 0.85817 | 0.99994 |
| Marker | Cut-Off Point | Sensitivity | Specificity |
|---|---|---|---|
| A1450/A1003 | 21.97 | 0.957 (LL 1: 0.781; UL 2: 0.999) | 0.920 (LL 1: 0.740; UL 2: 0.990) |
| A1650/A1003 | 40.14 | 0.957 (LL 1: 0.781; UL 2: 0.999) | 0.960 (LL 1: 0.796; UL 2: 0.999) |
Publisher’s Note: MDPI stays neutral with regard to jurisdictional claims in published maps and institutional affiliations. |
© 2021 by the authors. Licensee MDPI, Basel, Switzerland. This article is an open access article distributed under the terms and conditions of the Creative Commons Attribution (CC BY) license (https://creativecommons.org/licenses/by/4.0/).
Share and Cite
Acri, G.; Romano, C.; Costa, S.; Pellegrino, S.; Testagrossa, B. Raman Spectroscopy Technique: A Non-Invasive Tool in Celiac Disease Diagnosis. Diagnostics 2021, 11, 1277. https://doi.org/10.3390/diagnostics11071277
Acri G, Romano C, Costa S, Pellegrino S, Testagrossa B. Raman Spectroscopy Technique: A Non-Invasive Tool in Celiac Disease Diagnosis. Diagnostics. 2021; 11(7):1277. https://doi.org/10.3390/diagnostics11071277
Chicago/Turabian StyleAcri, Giuseppe, Claudio Romano, Stefano Costa, Salvatore Pellegrino, and Barbara Testagrossa. 2021. "Raman Spectroscopy Technique: A Non-Invasive Tool in Celiac Disease Diagnosis" Diagnostics 11, no. 7: 1277. https://doi.org/10.3390/diagnostics11071277
APA StyleAcri, G., Romano, C., Costa, S., Pellegrino, S., & Testagrossa, B. (2021). Raman Spectroscopy Technique: A Non-Invasive Tool in Celiac Disease Diagnosis. Diagnostics, 11(7), 1277. https://doi.org/10.3390/diagnostics11071277