
Determination of Non-Invasive Biomarkers for the Assessment of Fibrosis, Steatosis and Hepatic Iron Overload by MR Image Analysis. A Pilot Study


Abstract
:1. Introduction
2. Materials and Methods
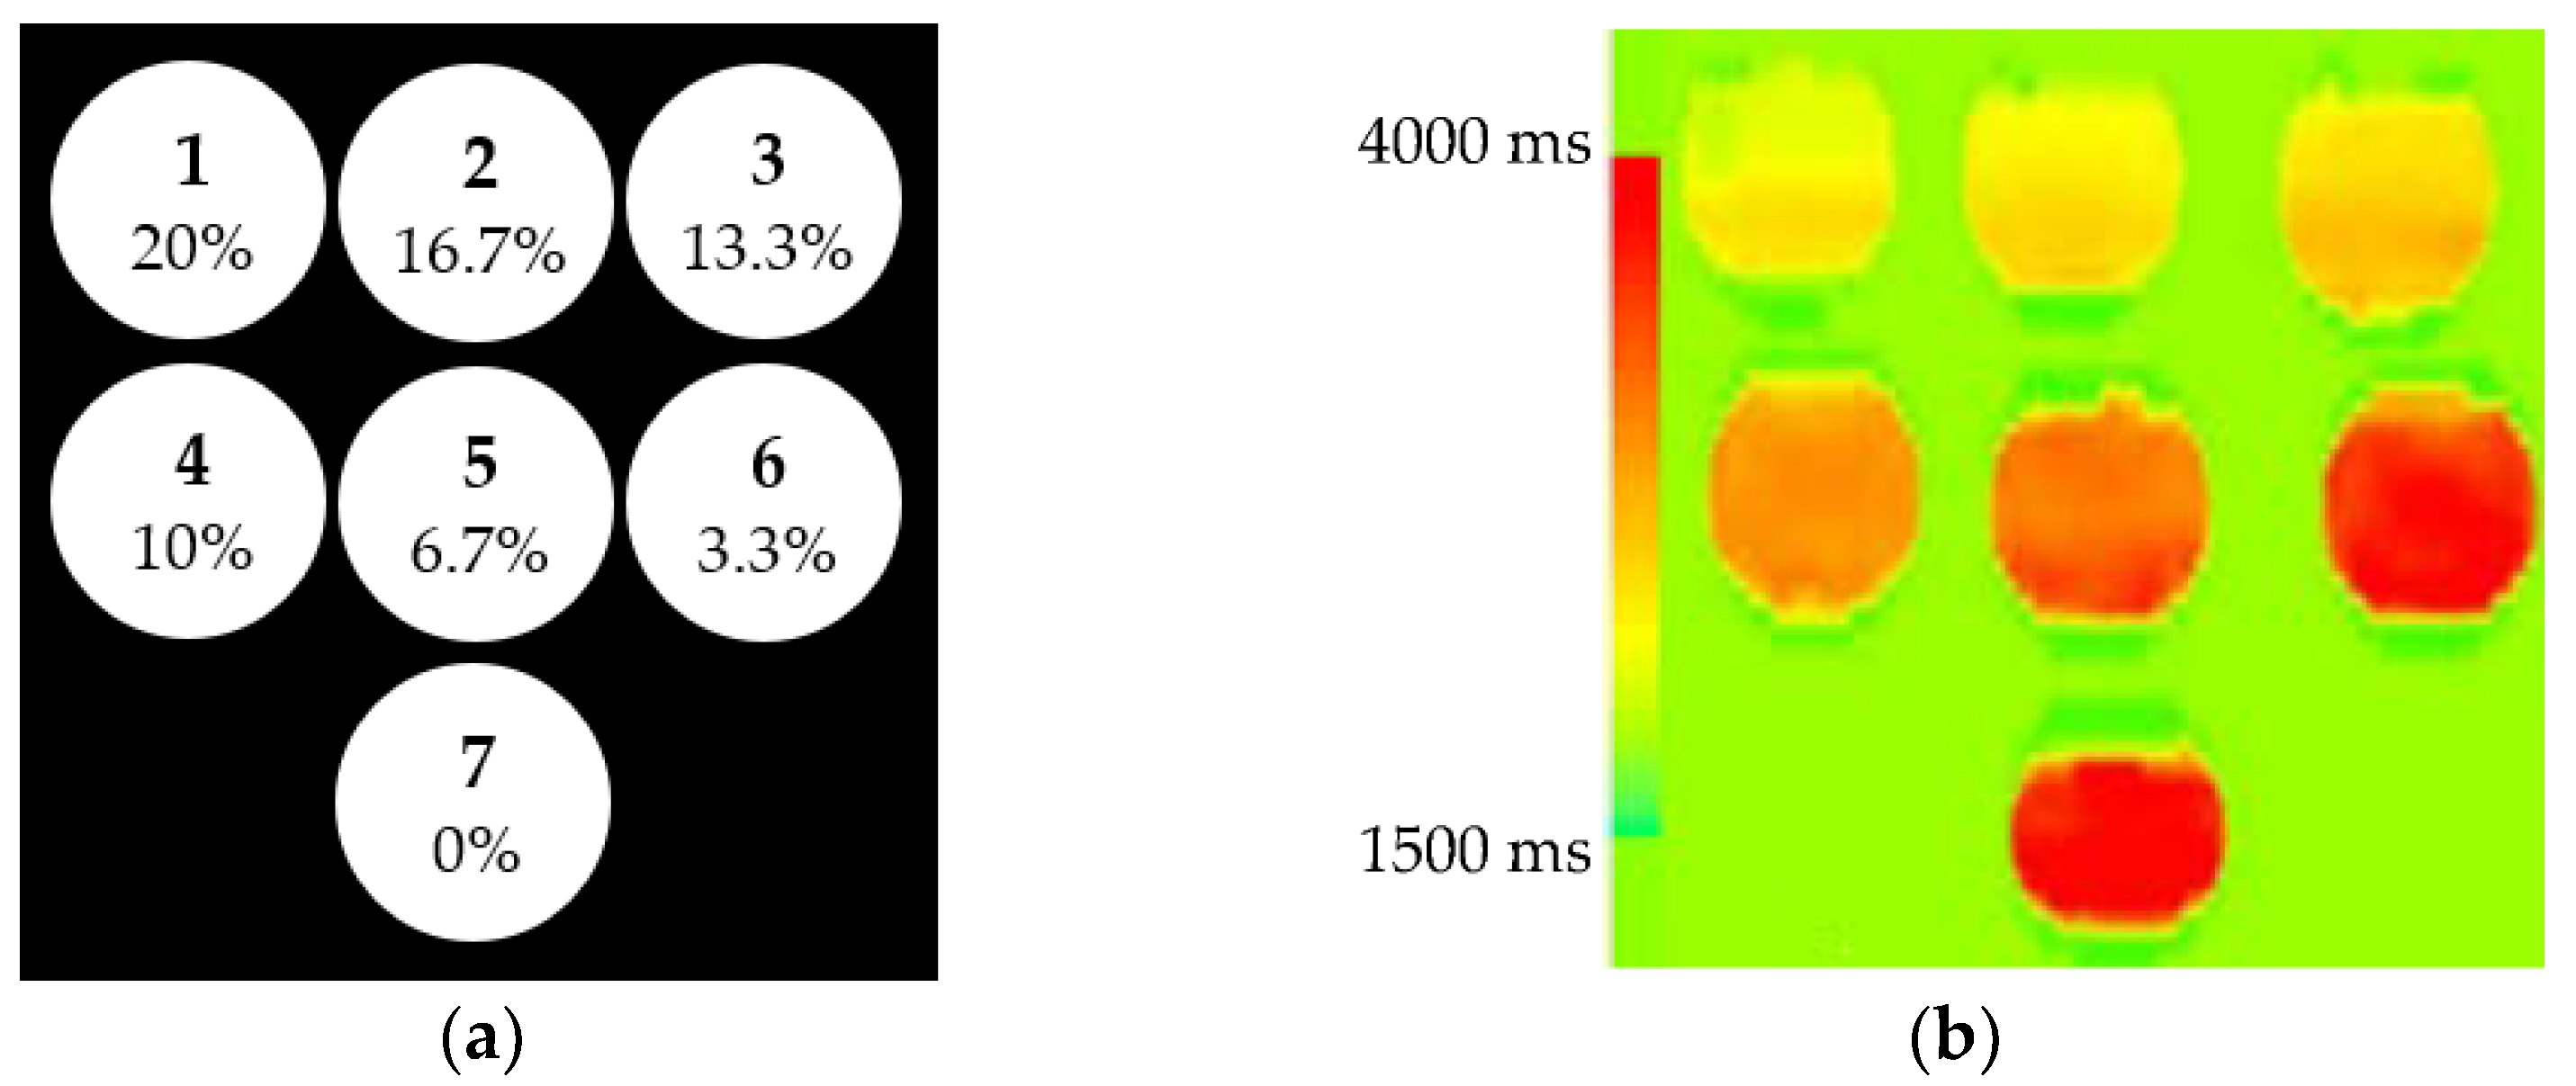
2.1. Phantoms
2.2. Subjects and Image Acquisition
2.3. Software
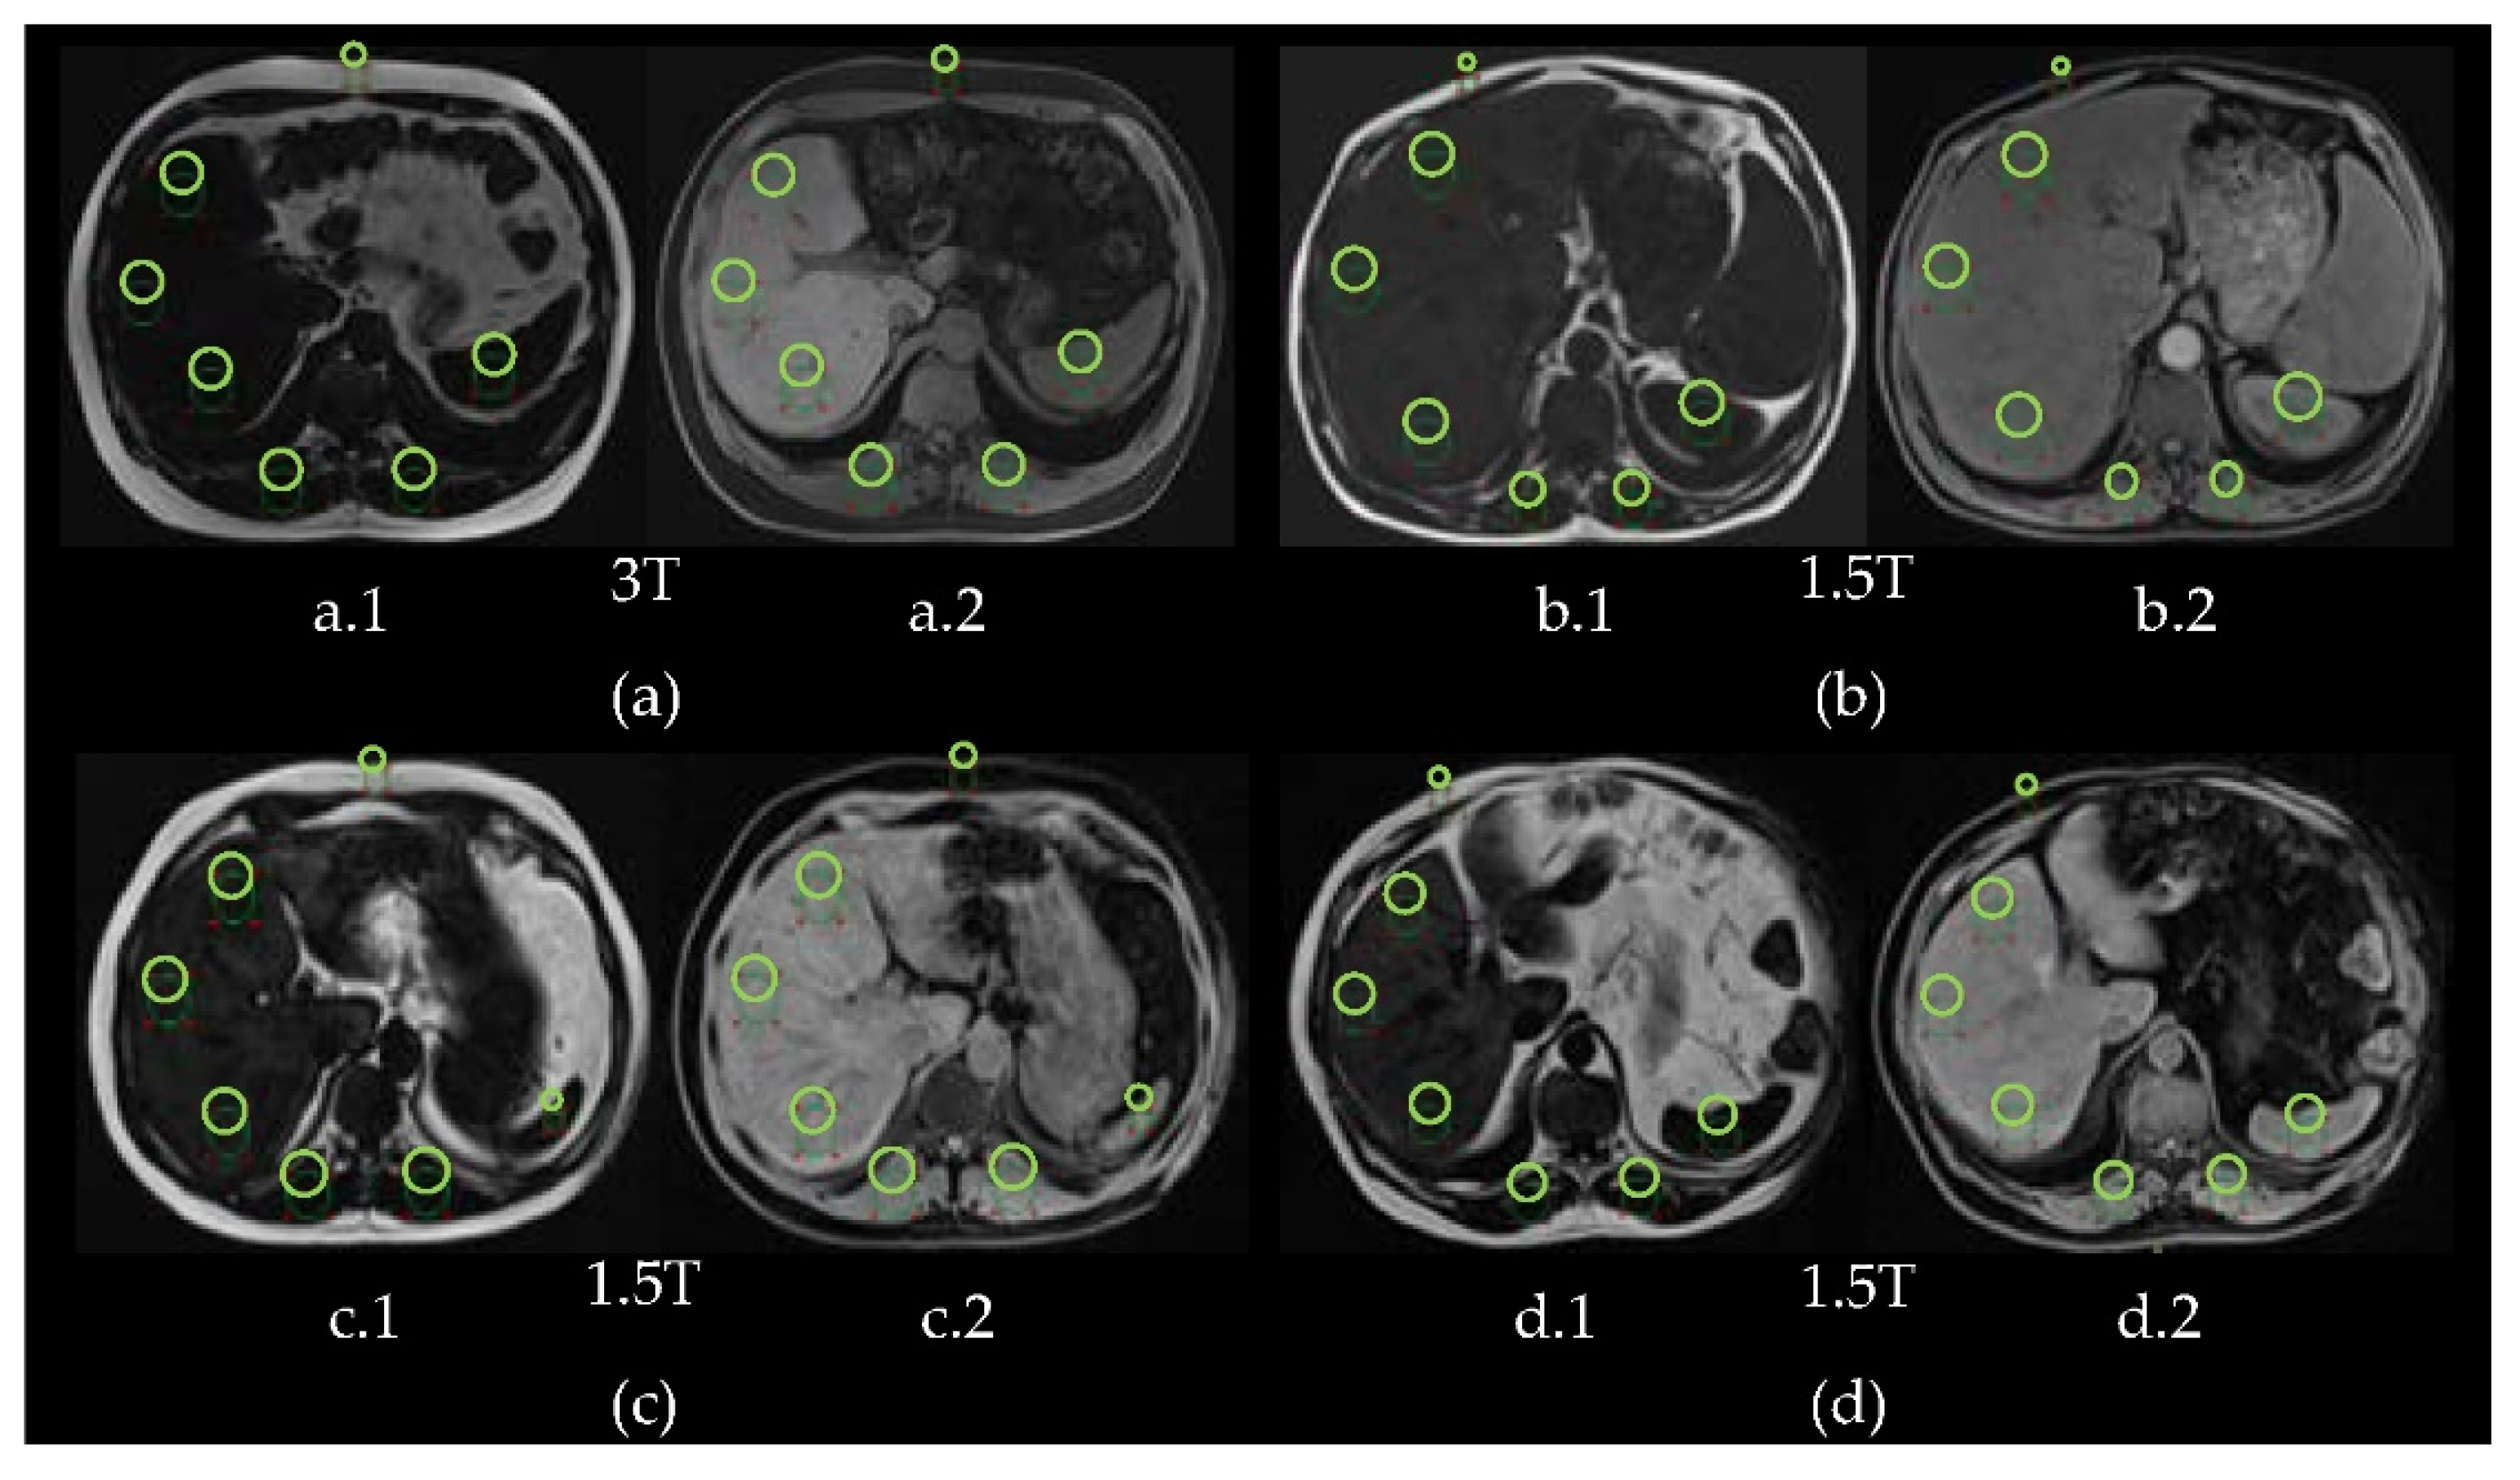
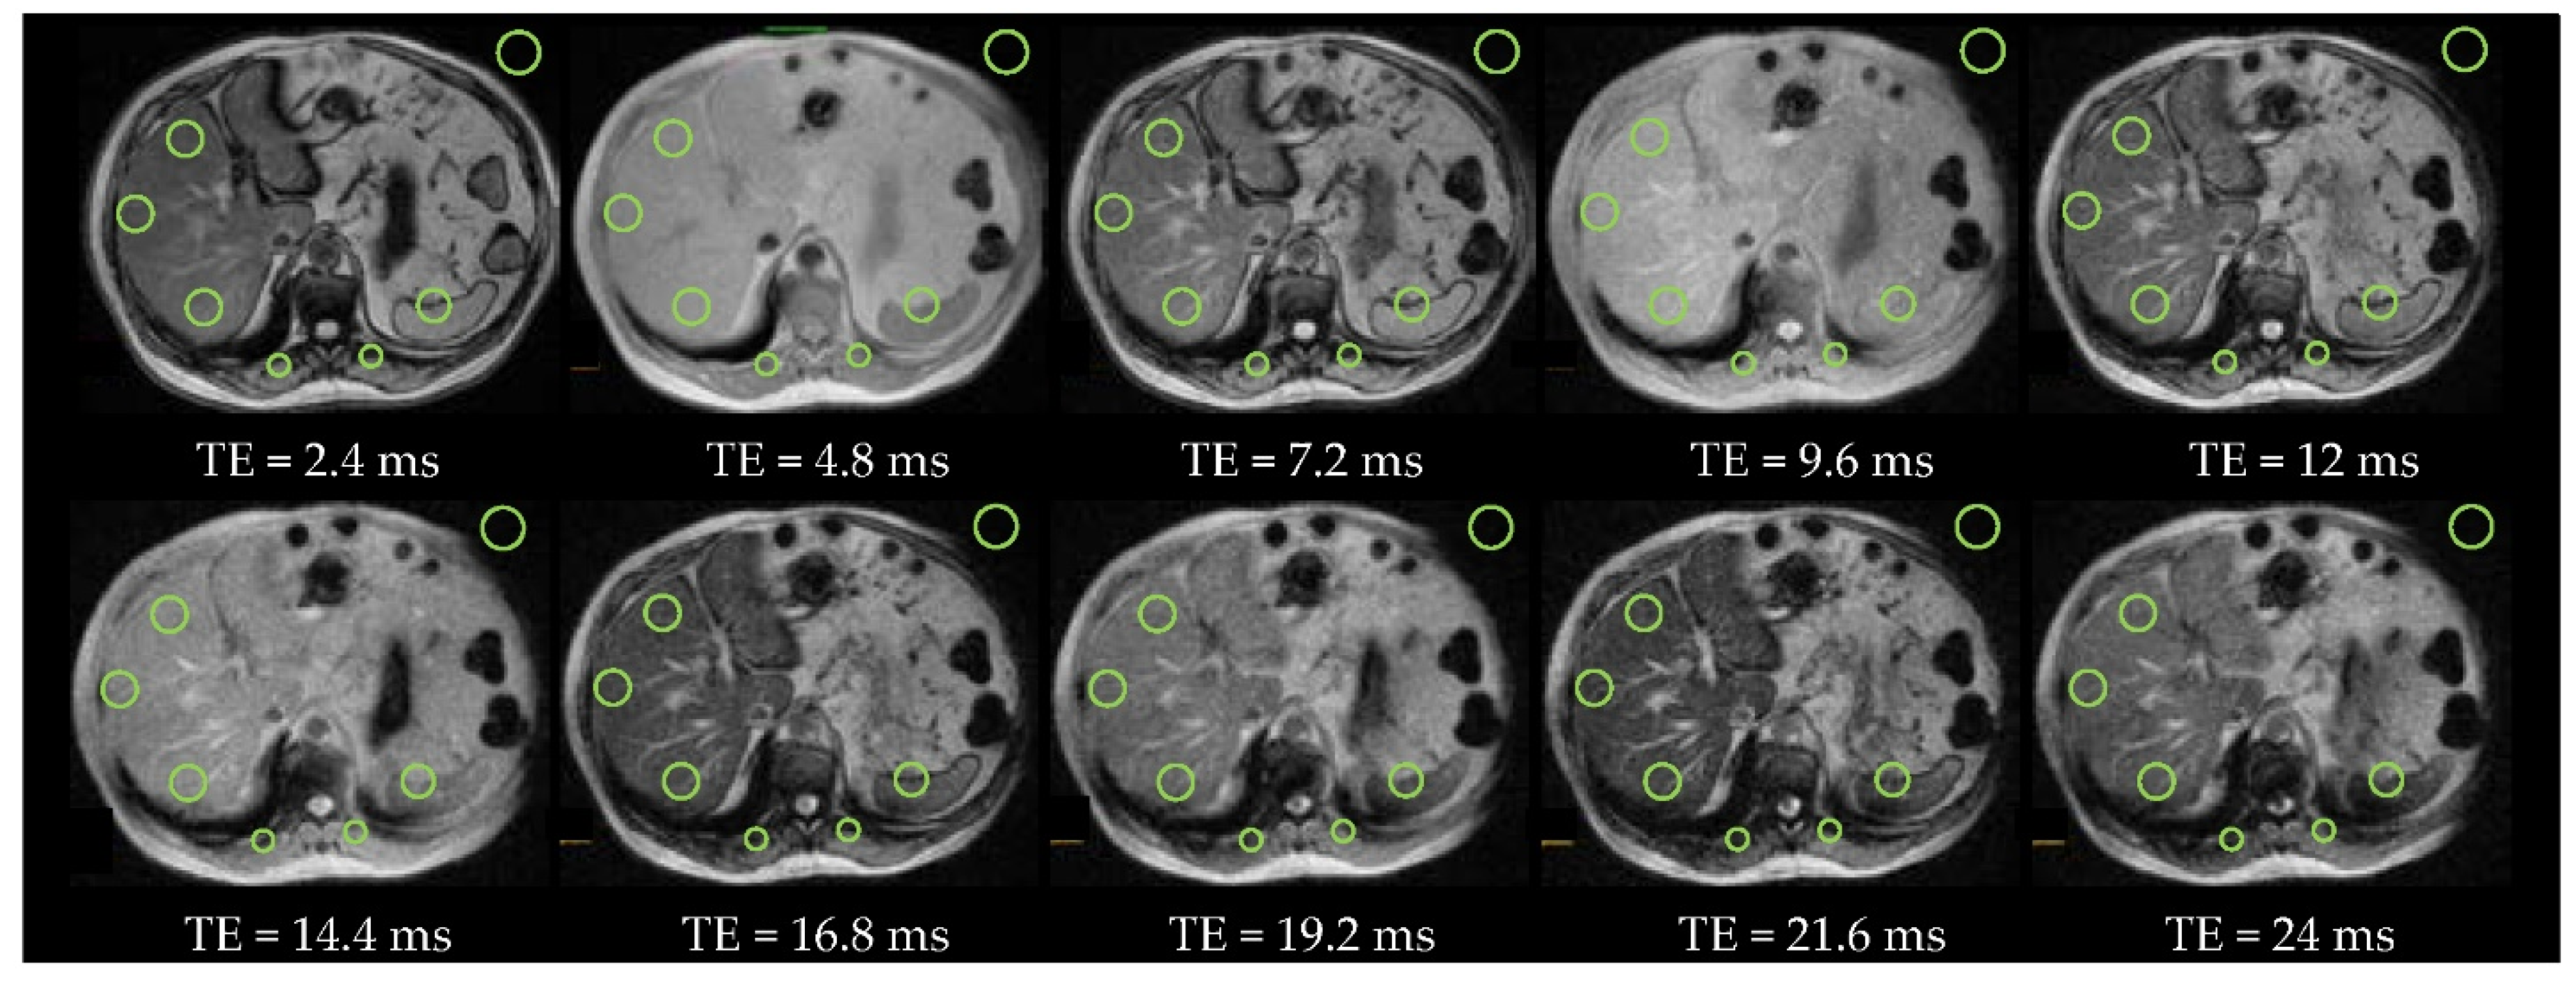
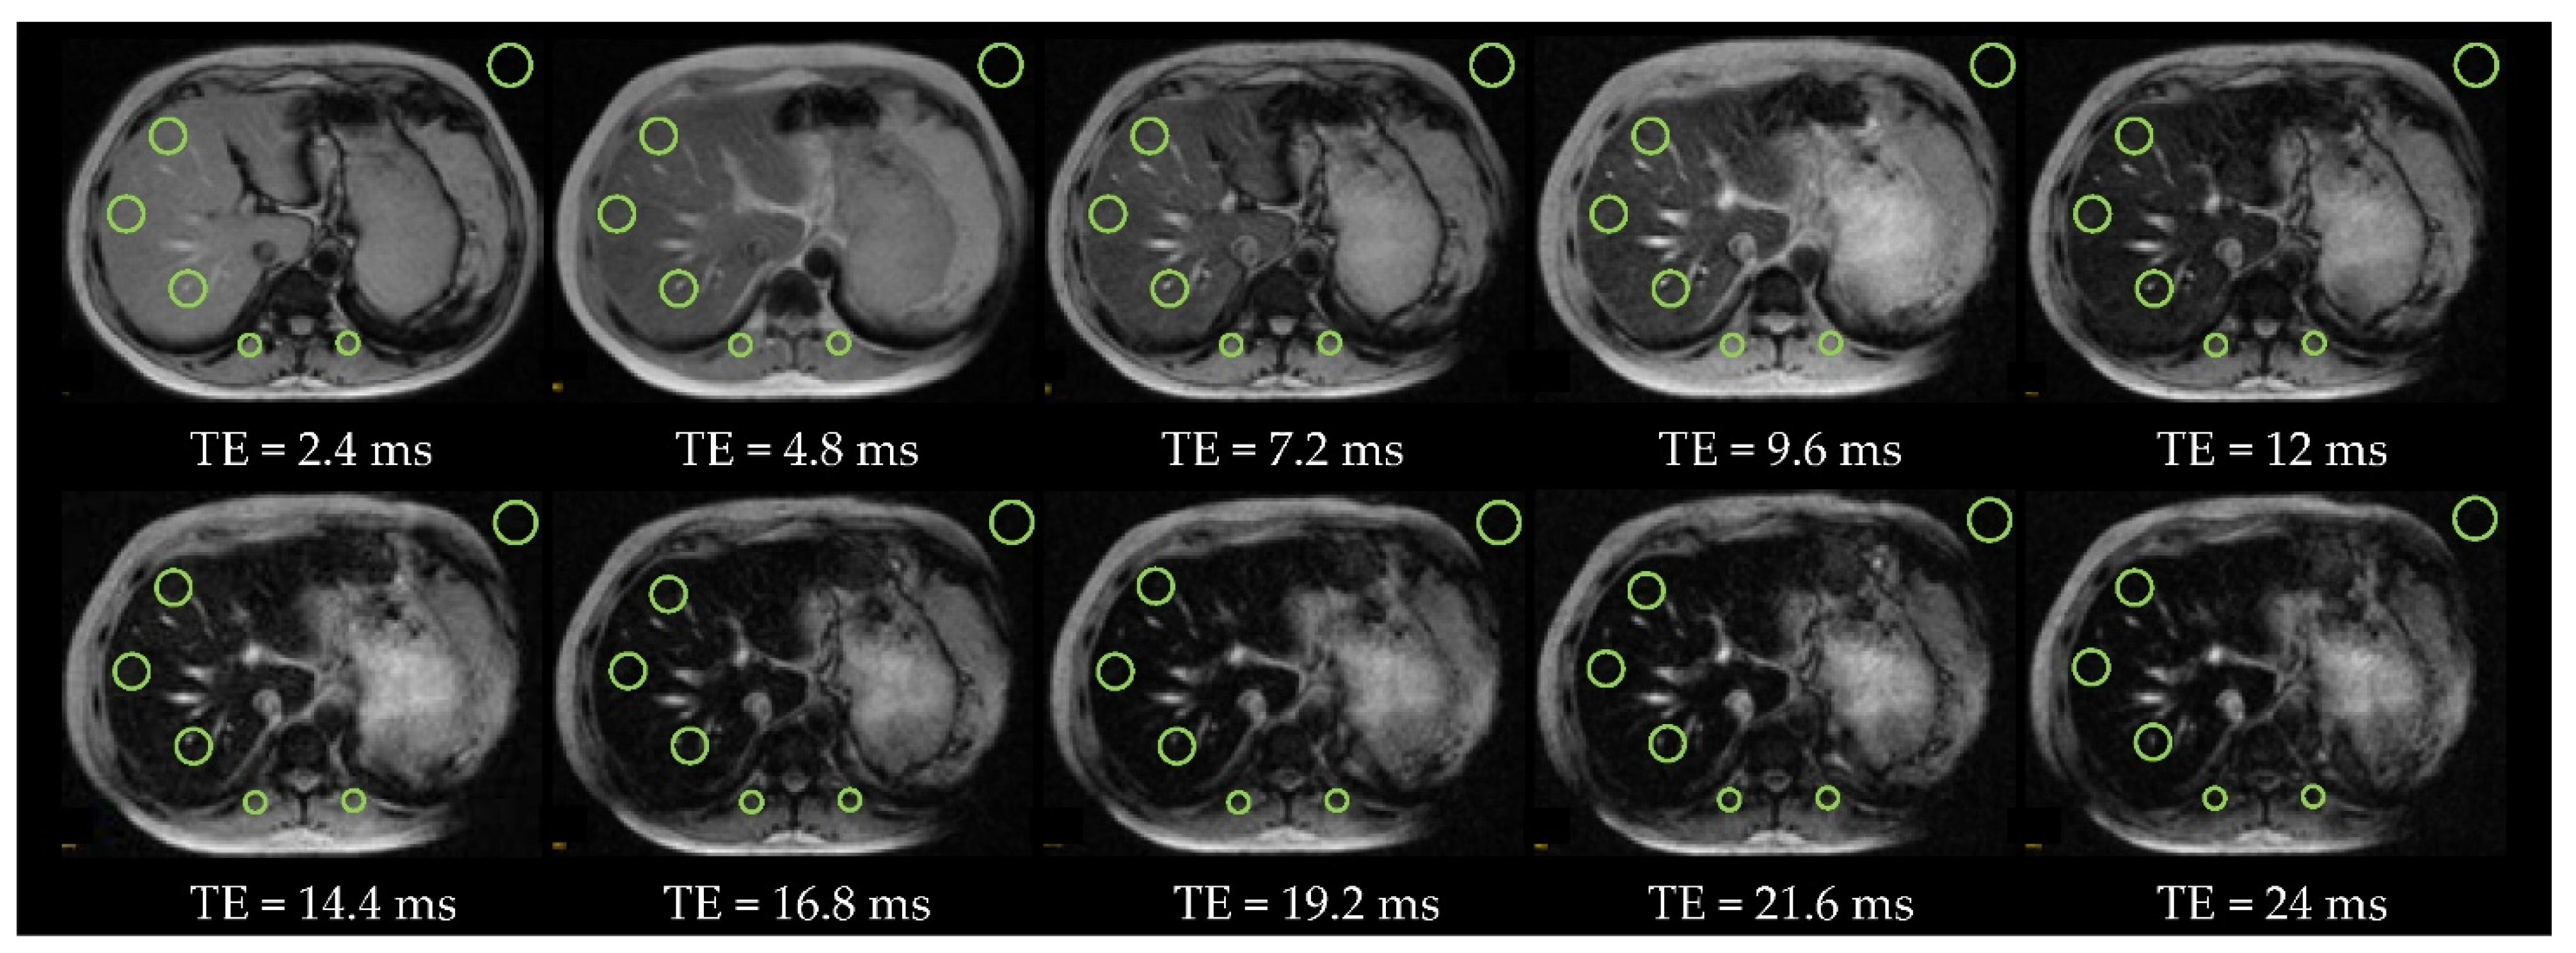
2.4. Regions of Interest
2.5. Biomarkers
2.5.1. Fibrosis
2.5.2. Steatosis
2.5.3. Hepatic Iron Overload
3. Results
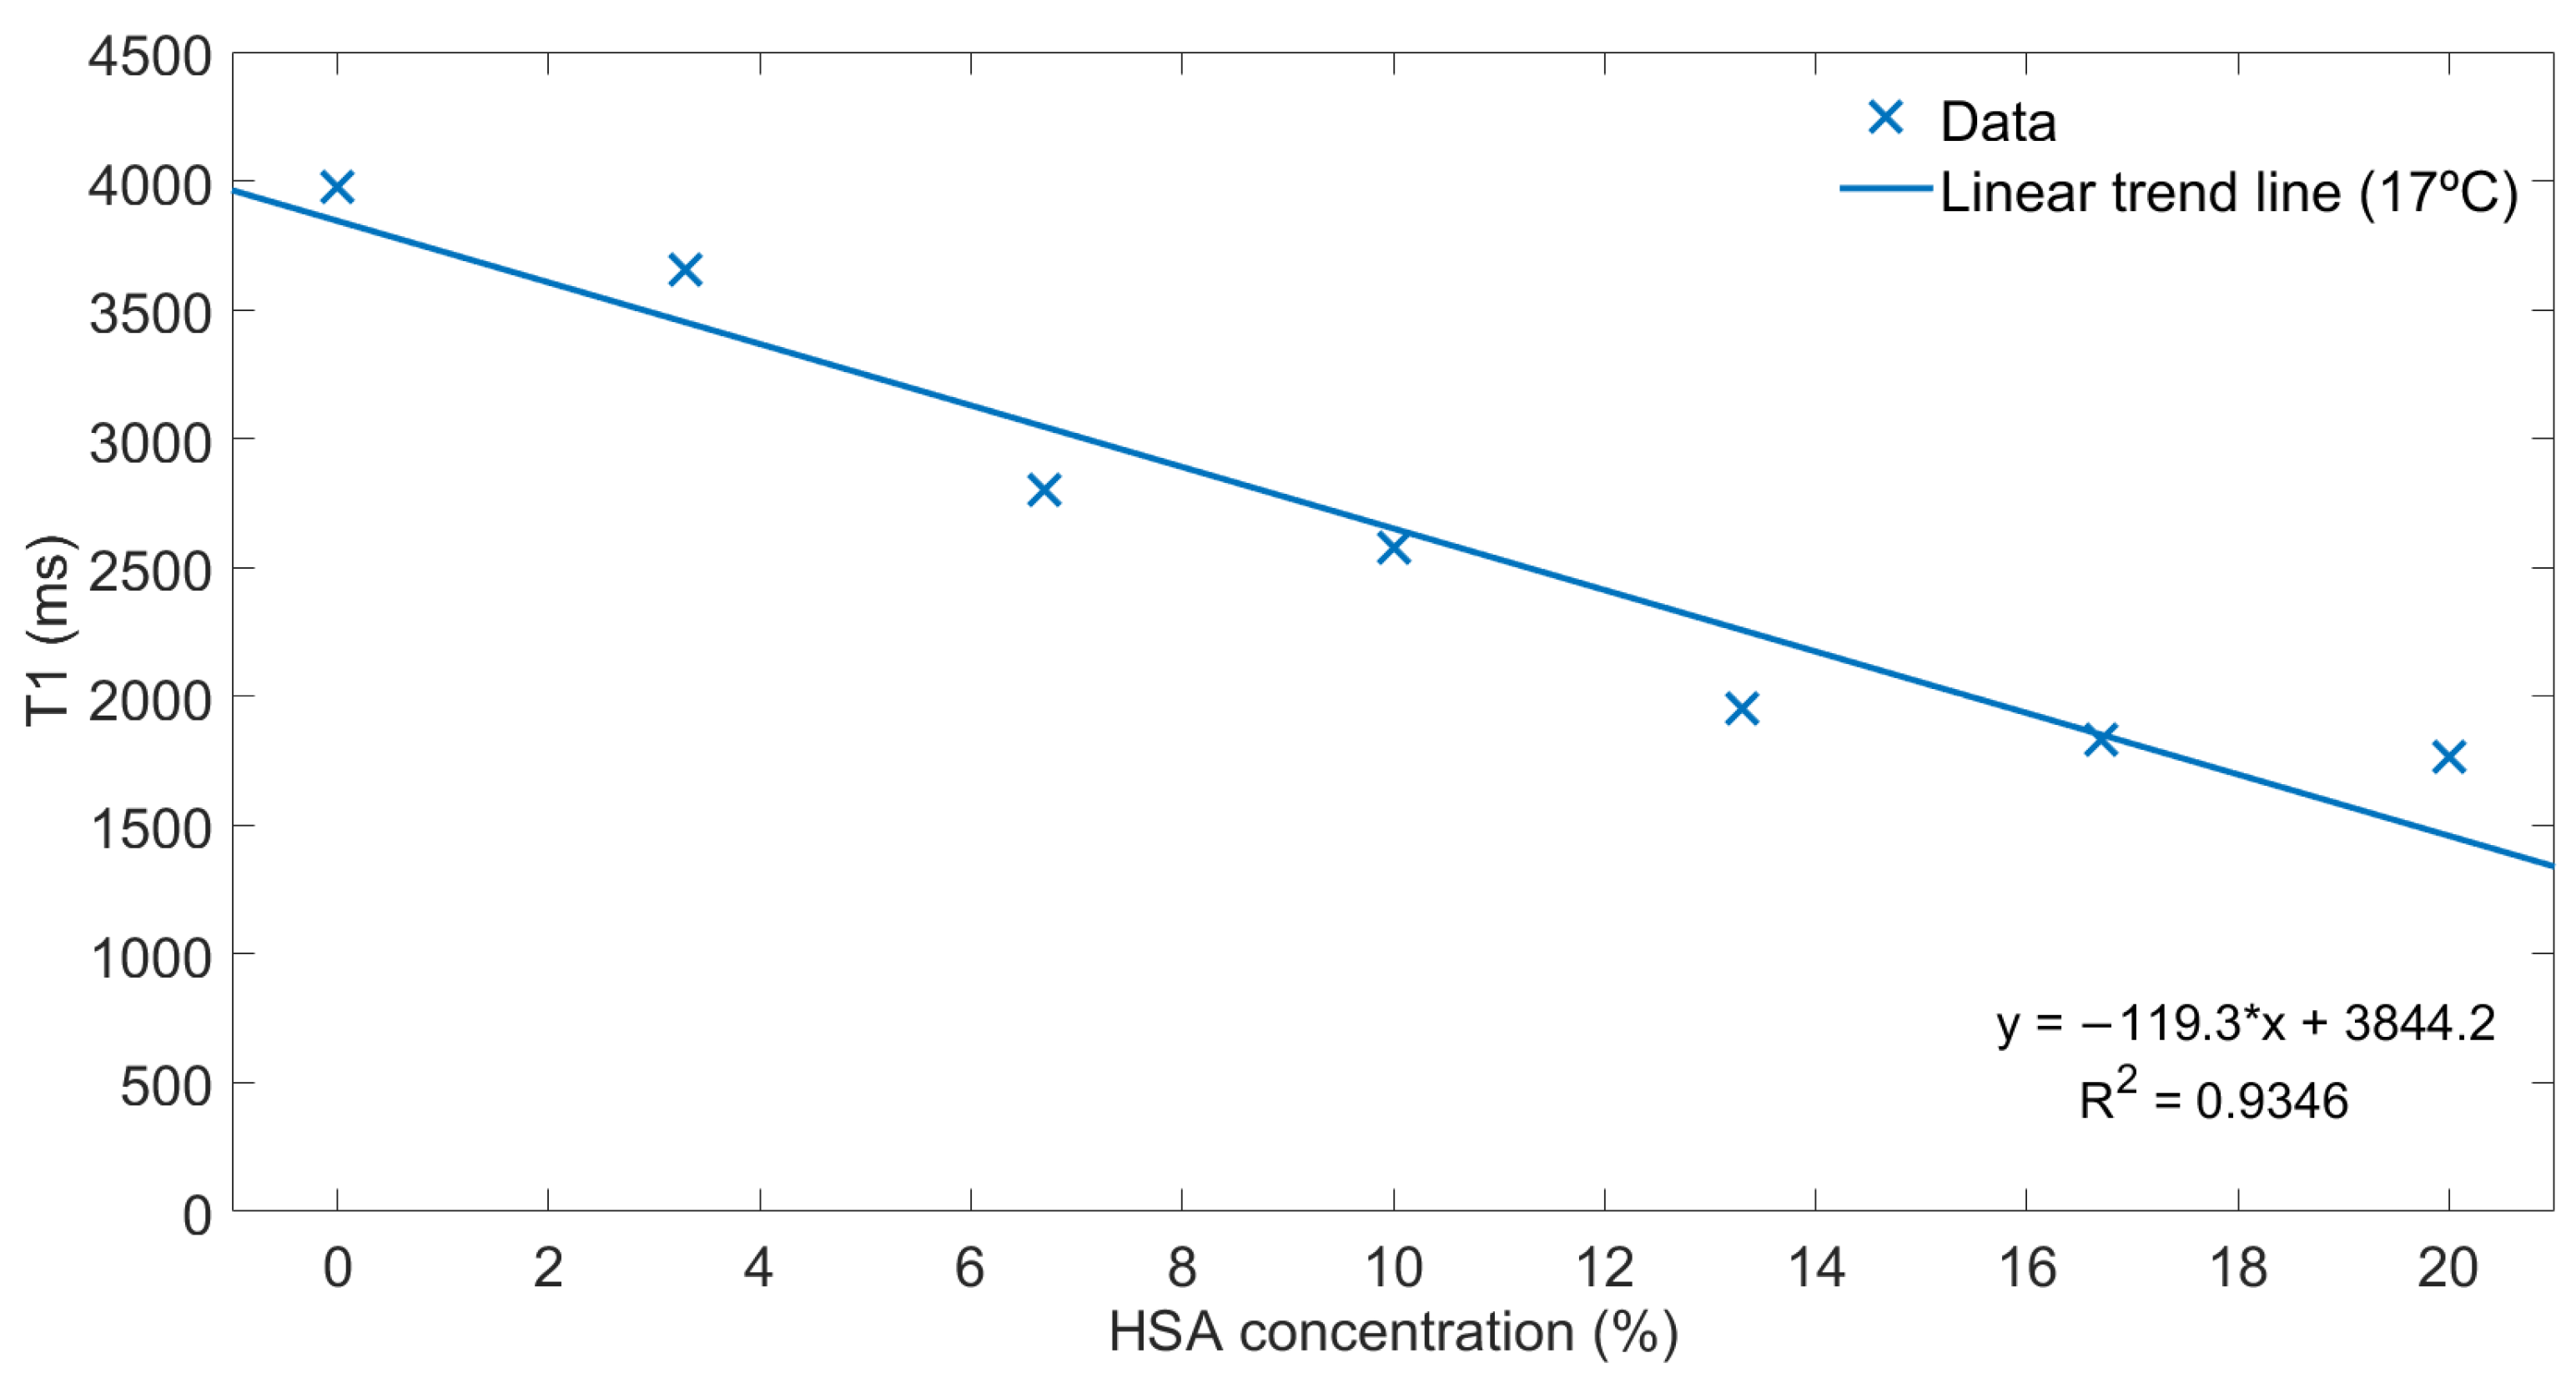
3.1. Phantoms
3.2. Fibrosis
3.3. Steatosis
3.4. Hepatic Iron Overload
4. Discussion
4.1. Fibrosis
4.2. Steatosis
4.3. Hepatic Iron Overload
4.4. Limitations and Strengths
5. Conclusions
Author Contributions
Funding
Institutional Review Board Statement
Informed Consent Statement
Data Availability Statement
Acknowledgments
Conflicts of Interest
References
- Asrani, S.K.; Devarbhavi, H.; Eaton, J.; Kamath, P.S. Burden of liver diseases in the world. J. Hepatol. 2019, 70, 151–171. [Google Scholar] [CrossRef] [PubMed]
- Toshikuni, N.; Tsutsumi, M.; Arisawa, T. Clinical differences between alcoholic liver disease and nonalcoholic fatty liver disease. World J. Gastroenterol. 2014, 20, 8393–8406. [Google Scholar] [CrossRef] [PubMed]
- Vilgrain, V.; Ronot, M.; Abdel-Rehim, M.; Zappa, M.; d’Assignies, G.; Bruno, O.; Vullierme, M.-P. Hepatic steatosis: A major trap in liver imaging. Diagn. Interv. Imaging 2013, 94, 713–727. [Google Scholar] [CrossRef] [PubMed] [Green Version]
- Beaton, M.D.; Adams, P.C. The myths and realities of hemochromatosis. Can. J. Gastroenterol. 2007, 21, 101–104. [Google Scholar] [CrossRef]
- Collier, J. Clinical and biochemical assessment of symptomatic and asymptomatic liver disease. Medicine 2015, 43, 557–561. [Google Scholar] [CrossRef]
- Bravo, A.A.; Sheth, S.G.; Chopra, S. Liver biopsy. N. Engl. J. Med. 2001, 344, 495–500. [Google Scholar] [CrossRef] [PubMed]
- Pournik, O.; Alavian, S.M.; Ghalichi, L.; Seifizarei, B.; Mehrnoush, L.; Aslani, A.; Anjarani, S.; Eslami, S. Inter-observer and intra-observer agreement in pathological evaluation of non-alcoholic fatty liver disease suspected liver biopsies. Hepatitis Mon. 2014, 14, 15167. [Google Scholar] [CrossRef] [PubMed] [Green Version]
- Ros, P.R. Imaging of Diffuse and Inflammatory Liver Disease. In Diseases of the Abdomen and Pelvis 2018–2021, 1st ed.; Hodler, J., Kubik-Huch, R.A., Von Schulthess, G.K., Eds.; IDKD Springer Series; Springer: Cham, Switzerland, 2018; Volume 1, pp. 237–246. [Google Scholar]
- Dasarathy, S.; Dasarathy, J.; Khiyami, A.; Joseph, R.; Lopez, R.; McCullough, A.J. Validity of real time ultrasound in the diagnosis of hepatic steatosis: A prospective study. J. Hepatol. 2009, 51, 1061–1067. [Google Scholar] [CrossRef]
- Yeom, S.; Lee, C.; Cha, S.; Park, C. Prediction of liver cirrhosis, using diagnostic imaging tools. World J Hepatol. 2015, 7, 2069–2079. [Google Scholar] [CrossRef] [Green Version]
- Palmucci, S.; Cappello, G.; Attinà, G.; Sanzà, G.F.; Foti, P.V.; Etorre, G.C.; Milone, P. Diffusion-weighted MRI for the assessment of liver fibrosis: Principles and Applications. BioMed Res. Int. 2015, 2015, 1–7. [Google Scholar] [CrossRef] [Green Version]
- Stoopen-Rometti, M.; Encinas-Escobar, E.R.; Ramirez-Carmona, C.R.; Wolpert-Barraza, E.; Kimura-Hayama, E.; Sosa-Lozano, L.A.; Favila, R.; Kimura-Fujikami, Y.; Saavedra-Abril, J.A.; Loaeza-Del Castillo, A. Diagnosis and quantification of fibrosis, steatosis, and hepatic siderosis through multiparametric magnetic resonance imaging. Rev. Gastroenterol. Mex. 2017, 82, 32–45. [Google Scholar] [CrossRef] [PubMed]
- Qayyum, A. MR spectroscopy of the liver: Principles and clinical applications. Radiographics 2009, 29, 1653–1664. [Google Scholar] [CrossRef]
- Sasso, M.; Miette, V.; Sandrin, L.; Beaugrand, M. The controlled attenuation parameter (CAP): A novel tool for the non-invasive evaluation of steatosis using Fibroscan. Clin. Res. Hepatol. Gastroenterol. 2012, 36, 13–20. [Google Scholar] [CrossRef]
- Venkatesh, S.K.; Yin, M.; Takahashi, N.; Glockner, J.F.; Talwalkar, J.A.; Ehman, R.L. Non-invasive detection of liver fibrosis: MR imaging features vs. MR elastography. Abdom. Imaging 2015, 40, 766–775. [Google Scholar] [CrossRef] [PubMed] [Green Version]
- Domínguez, A.; Noceti, M.; Fino, D.; Ariza, P. Hepatic Elastography and Other Advanced MRI Sequences (Multiparametric MRI). Argent. J. Radiol. 2018, 82, 064–071. [Google Scholar]
- Popa, A.; Bende, F.; Sirli, R.; Popescu, A.; Bâldea, V.; Lupusoru, R.; Cotrău, R.; Fofiu, R.; Foncea, C.; Sporea, I. Quantification of Liver Fibrosis, Steatosis, and Viscosity Using Multiparametric Ultrasound in Patients with Non-Alcoholic Liver Disease: A “Real-Life” Cohort Study. Diagnostics 2021, 11, 783. [Google Scholar] [CrossRef] [PubMed]
- Sugimoto, K.; Moriyasu, F.; Oshiro, H.; Takeuchi, H.; Abe, M.; Yoshimasu, Y.; Kasai, Y.; Sakamaki, K.; Hara, T.; Itoi, T. The Role of Multiparametric US of the Liver for the Evaluation of Nonalcoholic Steatohepatitis. Radiology 2020, 296, 532–540. [Google Scholar] [CrossRef] [PubMed]
- Lee, D.H.; Cho, E.J.; Bae, J.S.; Lee, J.Y.; Yu, S.J.; Kim, H.; Lee, K.B.; Han, J.K.; Choi, B.I. Accuracy of Two-Dimensional Shear Wave Elastography and Attenuation Imaging for Evaluation of Patients with Nonalcoholic Steatohepatitis. Clin. Gastroenterol. Hepatol. 2020, 19, 797–805. [Google Scholar] [CrossRef]
- Martí-Bonmatí, L. Abdominal MR imaging and radiomics in the metabolic syndrome. An. RANM 2018, 135, 151–158. [Google Scholar] [CrossRef] [Green Version]
- Mendelson, D.A.; Heinsbergen, J.F.; Kennedy, S.D.; Szczepaniak, L.S.; Lester, C.C.; Bryant, R.G. Comparison of agarose and cross-linked protein gels as magnetic resonance imaging phantoms. Magn. Reson. Imaging 1991, 9, 975–978. [Google Scholar] [CrossRef]
- Siemens Operator Manual—Ortho. Available online: https://cbbi.udel.edu/wp-content/uploads/2017/01/Ortho.pdf (accessed on 22 March 2021).
- Sutherland, F.; Harris, J. Claude Couinaud: A passion for the liver. Arch. Surg. 2002, 137, 1305–1310. [Google Scholar] [CrossRef] [PubMed]
- Hautekeete, M.L.; Geerts, A. The hepatic stellate (Ito) cell: Its role in human liver disease. Virchows Arch. 1997, 430, 195–207. [Google Scholar] [CrossRef] [PubMed]
- Taylor, A.J.; Salerno, M.; Dharmakumar, R.; Jerosch-Herold, M. T1 mapping basic techniques and clinical applications. JAAC Cardiovasc. Imaging 2016, 9, 67–81. [Google Scholar] [CrossRef] [PubMed] [Green Version]
- Carvalho, J.R.; Machado, M.V. New insights about albumin and liver disease. Ann. Hepatol. 2018, 17, 547–560. [Google Scholar] [CrossRef]
- Tang, A.; Tan, J.; Sun, M.; Hamilton, G.; Bydder, M.; Wolfson, T.; Gamst, A.C.; Middleton, M.; Brunt, E.M.; Loomba, R.; et al. Nonalcoholic fatty liver disease: MR imaging of liver proton density fat fraction to assess hepatic steatosis. Radiology 2013, 267, 422–437. [Google Scholar] [CrossRef] [PubMed] [Green Version]
- Ma, J. Dixon techniques for water and fat imaging. J. Magn. Reson. Imaging 2008, 28, 543–558. [Google Scholar] [CrossRef]
- Reeder, S.B.; Sirlin, C.B. Quantification of liver fat with magnetic resonance imaging. Magn. Reson. Imaging Clin. N. Am. 2010, 18, 337–357. [Google Scholar] [CrossRef] [Green Version]
- Henniger, B.; Kremser, C.; Rauch, S.; Eder, R.; Zoller, H.; Finkenstedt, A.; Michaely, H.J.; Schoke, M. Evaluation of MR imaging with T1 and T2* mapping for the determination of hepatic iron overload. Eur. Radiol. 2012, 22, 2478–2486. [Google Scholar] [CrossRef]
- d’Assignies, G.; Paisant, A.; Bardou-Jacquet, E.; Boulic, A.; Bannier, E.; Lainé, F.; Ropert, M.; Morcet, J.; Saint-Jalmes, H.; Gandon, Y. Non-invasive measurement of liver iron concentration using 3-Tesla magnetic resonance imaging: Validation against biopsy. Eur. Radiol. 2018, 28, 2022–2030. [Google Scholar] [CrossRef]
- Gandon, Y.; Olivié, D.; Guyader, D.; Aubé, C.; Oberti, F.; Sebille, V.; Deugnier, Y. Non-invasive assessment of hepatic iron stores by MRI. Lancet 2004, 363, 357–362. [Google Scholar] [CrossRef]
- Alústiza, J.M.; Castiella, A.; Emparanza, J.I. Quantification of iron concentration in the liver by MRI. Insights Imaging 2012, 3, 173–180. [Google Scholar] [CrossRef] [PubMed] [Green Version]


| Disease | Patient | Age (Years Old) | Gender | Magnetic Field (T) of the MRI Scanner | |
|---|---|---|---|---|---|
| Fibrosis | #1 * | 41 | Male | 3 | |
| #2 | 41 | Male | 3 | ||
| Steatosis | Hepatic iron overload | #3 ** | 42 | Male | 3 |
| #4 | 53 | Male | 1.5 | ||
| #5 | 47 | Male | 1.5 | ||
| #6 | 79 | Male | 1.5 | ||
| #7 | 33 | Male | 3 | ||
| #8 | 24 | Female | 3 | ||
| Sequences | TR (ms) | TE (ms) | FA (°) | ETL | MS | ST (mm) |
|---|---|---|---|---|---|---|
| B1Map_for_T1mapping | 5050 | 1.8 | 8 | 1 | 64 × 52 | 8 |
| T1_Images_B1corr | 5 | 2.3 | 3 | 1 | 224 × 135 | 4 |
| T1_VIBE_Dixon | 4 | 1.3 | 9 | 2 | 320 × 195 | 3 |
| T2_Multi-echo | 120 | 1.2 | 20 | 12 | 128 × 128 | 7 |
Publisher’s Note: MDPI stays neutral with regard to jurisdictional claims in published maps and institutional affiliations. |
© 2021 by the authors. Licensee MDPI, Basel, Switzerland. This article is an open access article distributed under the terms and conditions of the Creative Commons Attribution (CC BY) license (https://creativecommons.org/licenses/by/4.0/).
Share and Cite
Meneses, A.; Santabárbara, J.M.; Romero, J.A.; Aliaga, R.; Maceira, A.M.; Moratal, D. Determination of Non-Invasive Biomarkers for the Assessment of Fibrosis, Steatosis and Hepatic Iron Overload by MR Image Analysis. A Pilot Study. Diagnostics 2021, 11, 1178. https://doi.org/10.3390/diagnostics11071178
Meneses A, Santabárbara JM, Romero JA, Aliaga R, Maceira AM, Moratal D. Determination of Non-Invasive Biomarkers for the Assessment of Fibrosis, Steatosis and Hepatic Iron Overload by MR Image Analysis. A Pilot Study. Diagnostics. 2021; 11(7):1178. https://doi.org/10.3390/diagnostics11071178
Chicago/Turabian StyleMeneses, Alba, José Manuel Santabárbara, Juan Antonio Romero, Roberto Aliaga, Alicia María Maceira, and David Moratal. 2021. "Determination of Non-Invasive Biomarkers for the Assessment of Fibrosis, Steatosis and Hepatic Iron Overload by MR Image Analysis. A Pilot Study" Diagnostics 11, no. 7: 1178. https://doi.org/10.3390/diagnostics11071178
APA StyleMeneses, A., Santabárbara, J. M., Romero, J. A., Aliaga, R., Maceira, A. M., & Moratal, D. (2021). Determination of Non-Invasive Biomarkers for the Assessment of Fibrosis, Steatosis and Hepatic Iron Overload by MR Image Analysis. A Pilot Study. Diagnostics, 11(7), 1178. https://doi.org/10.3390/diagnostics11071178