Use of the Taguchi Method to Optimize an Immunodetection System for Quantitative Analysis of a Rapid Test


Abstract
1. Introduction
2. Experimental Procedure
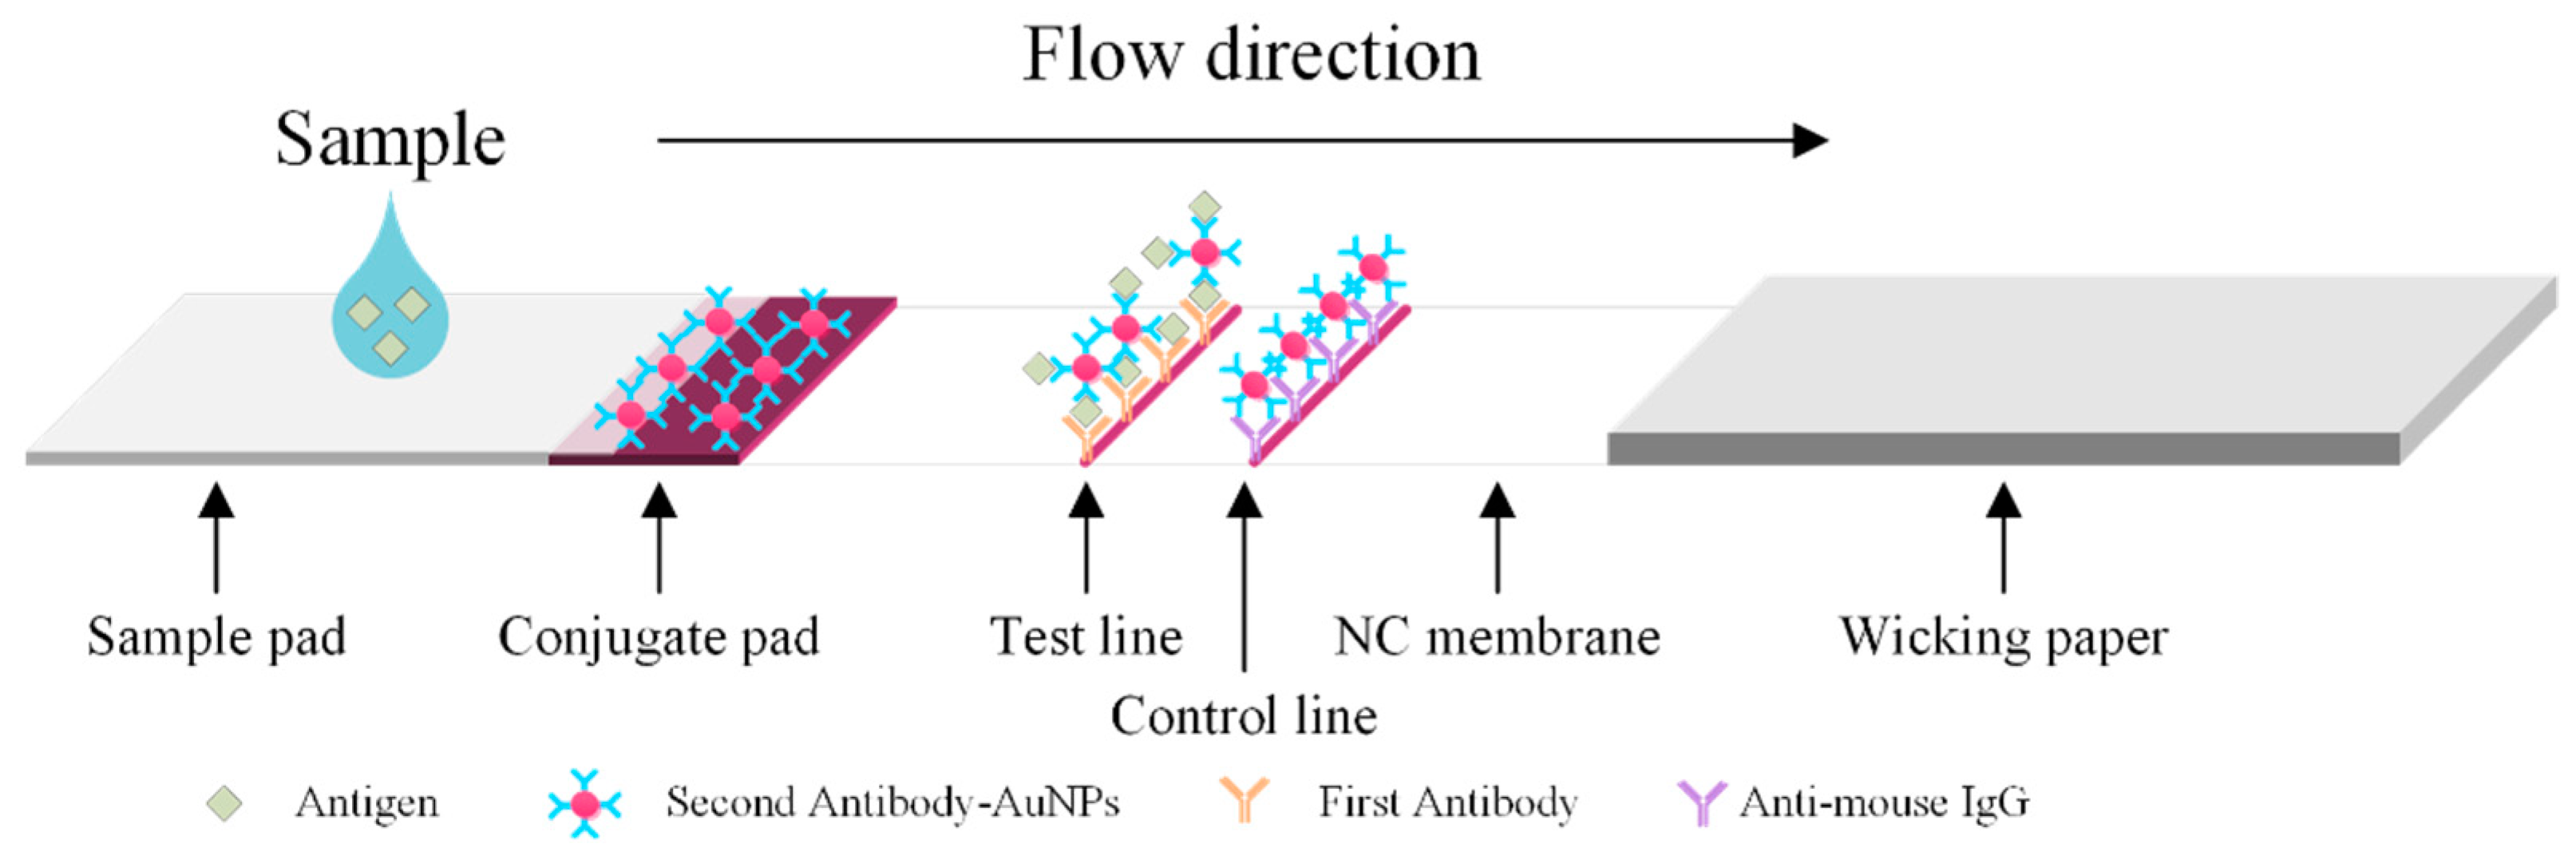
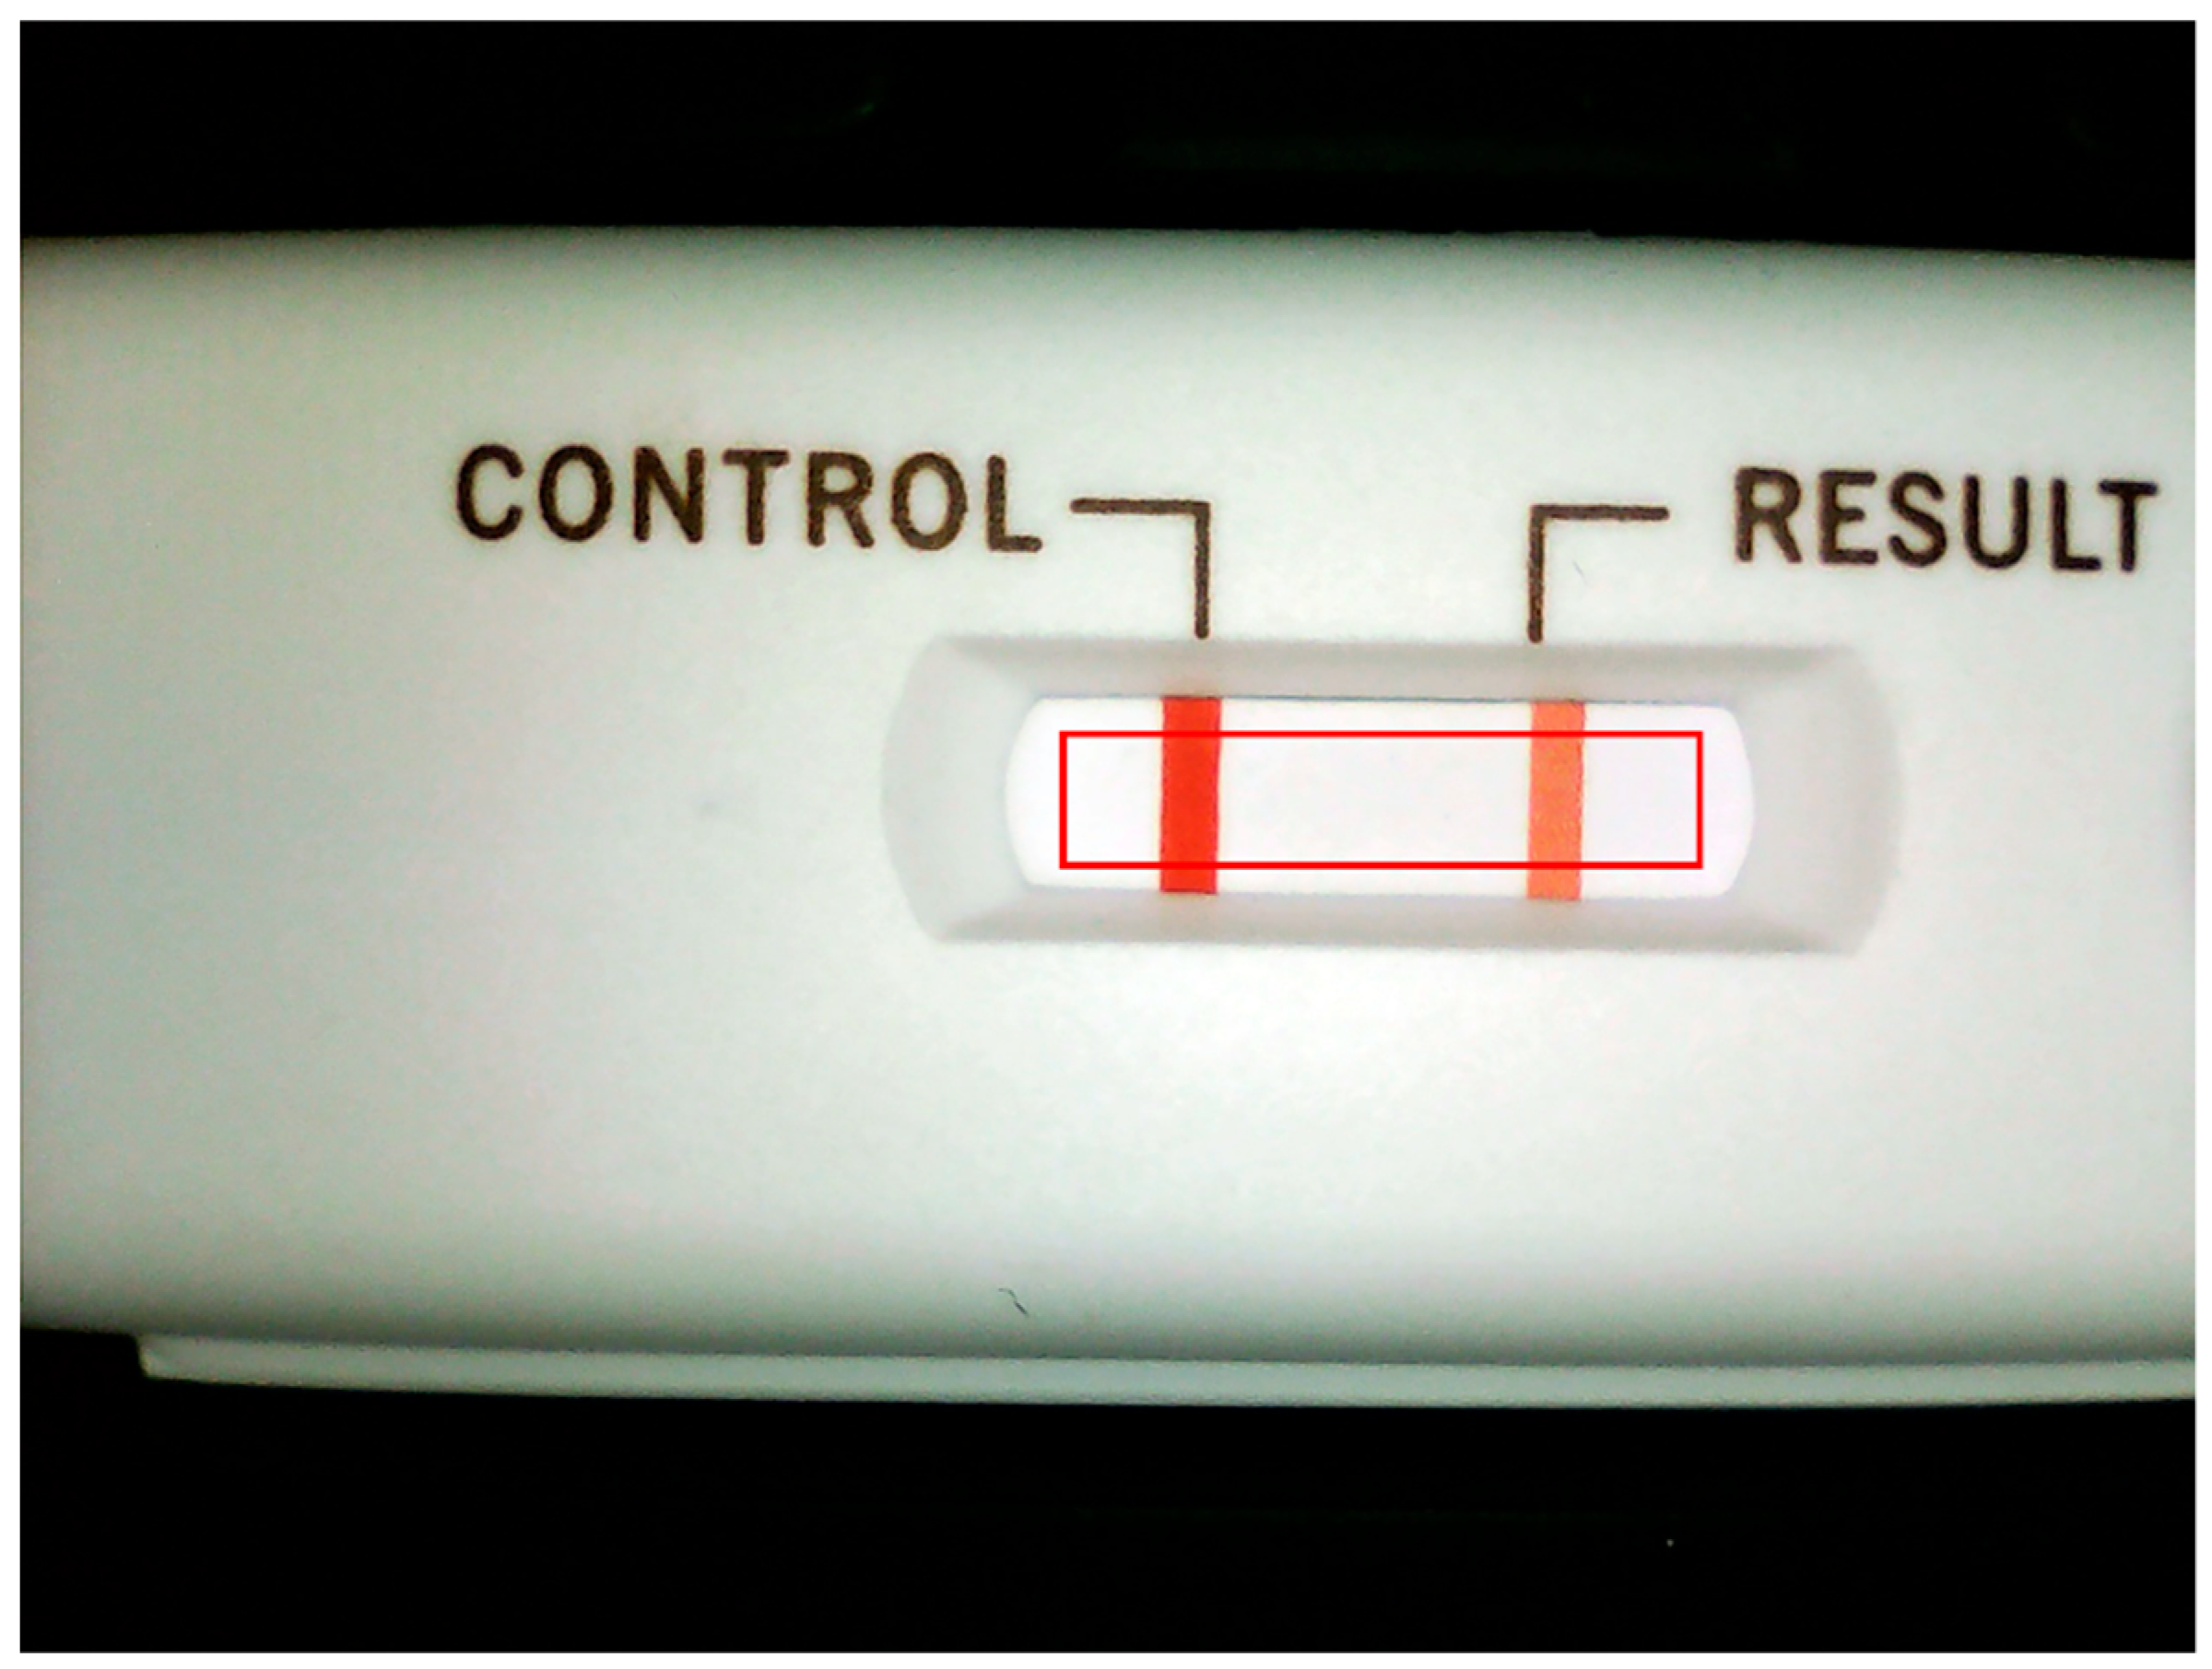
2.1. Experimental Principles
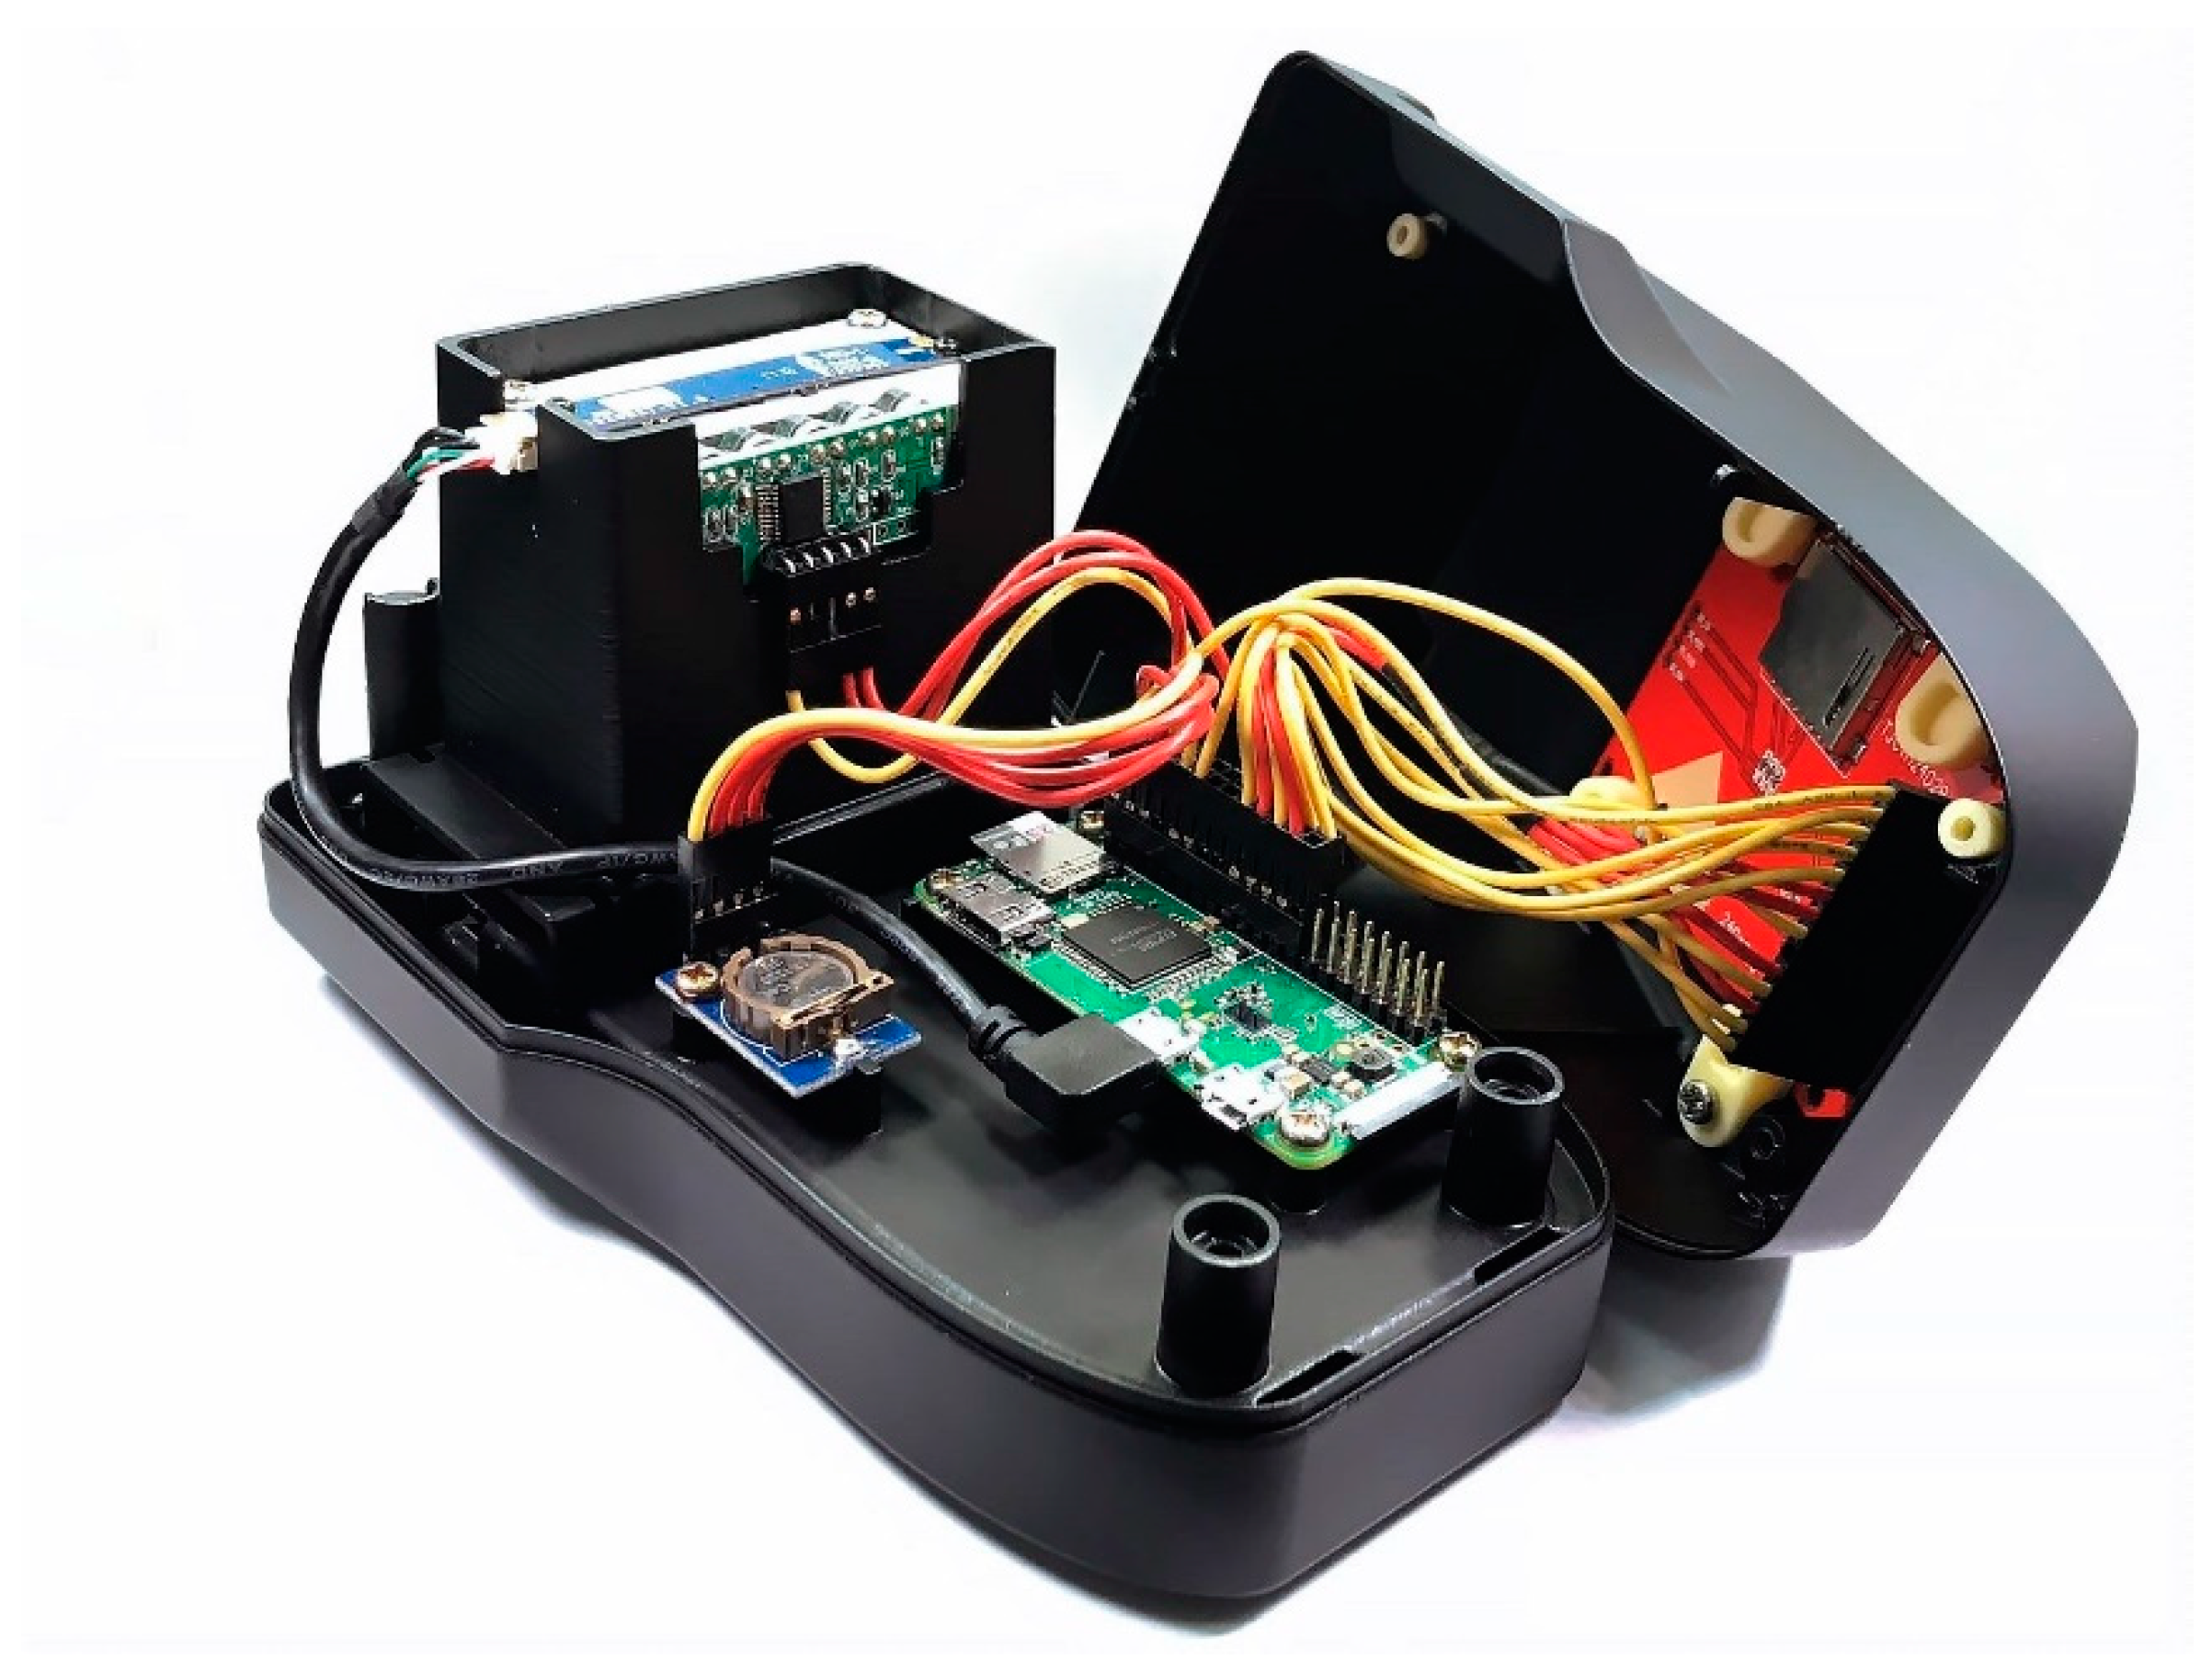
2.2. Hardware Platform
2.3. Experimental Procedure
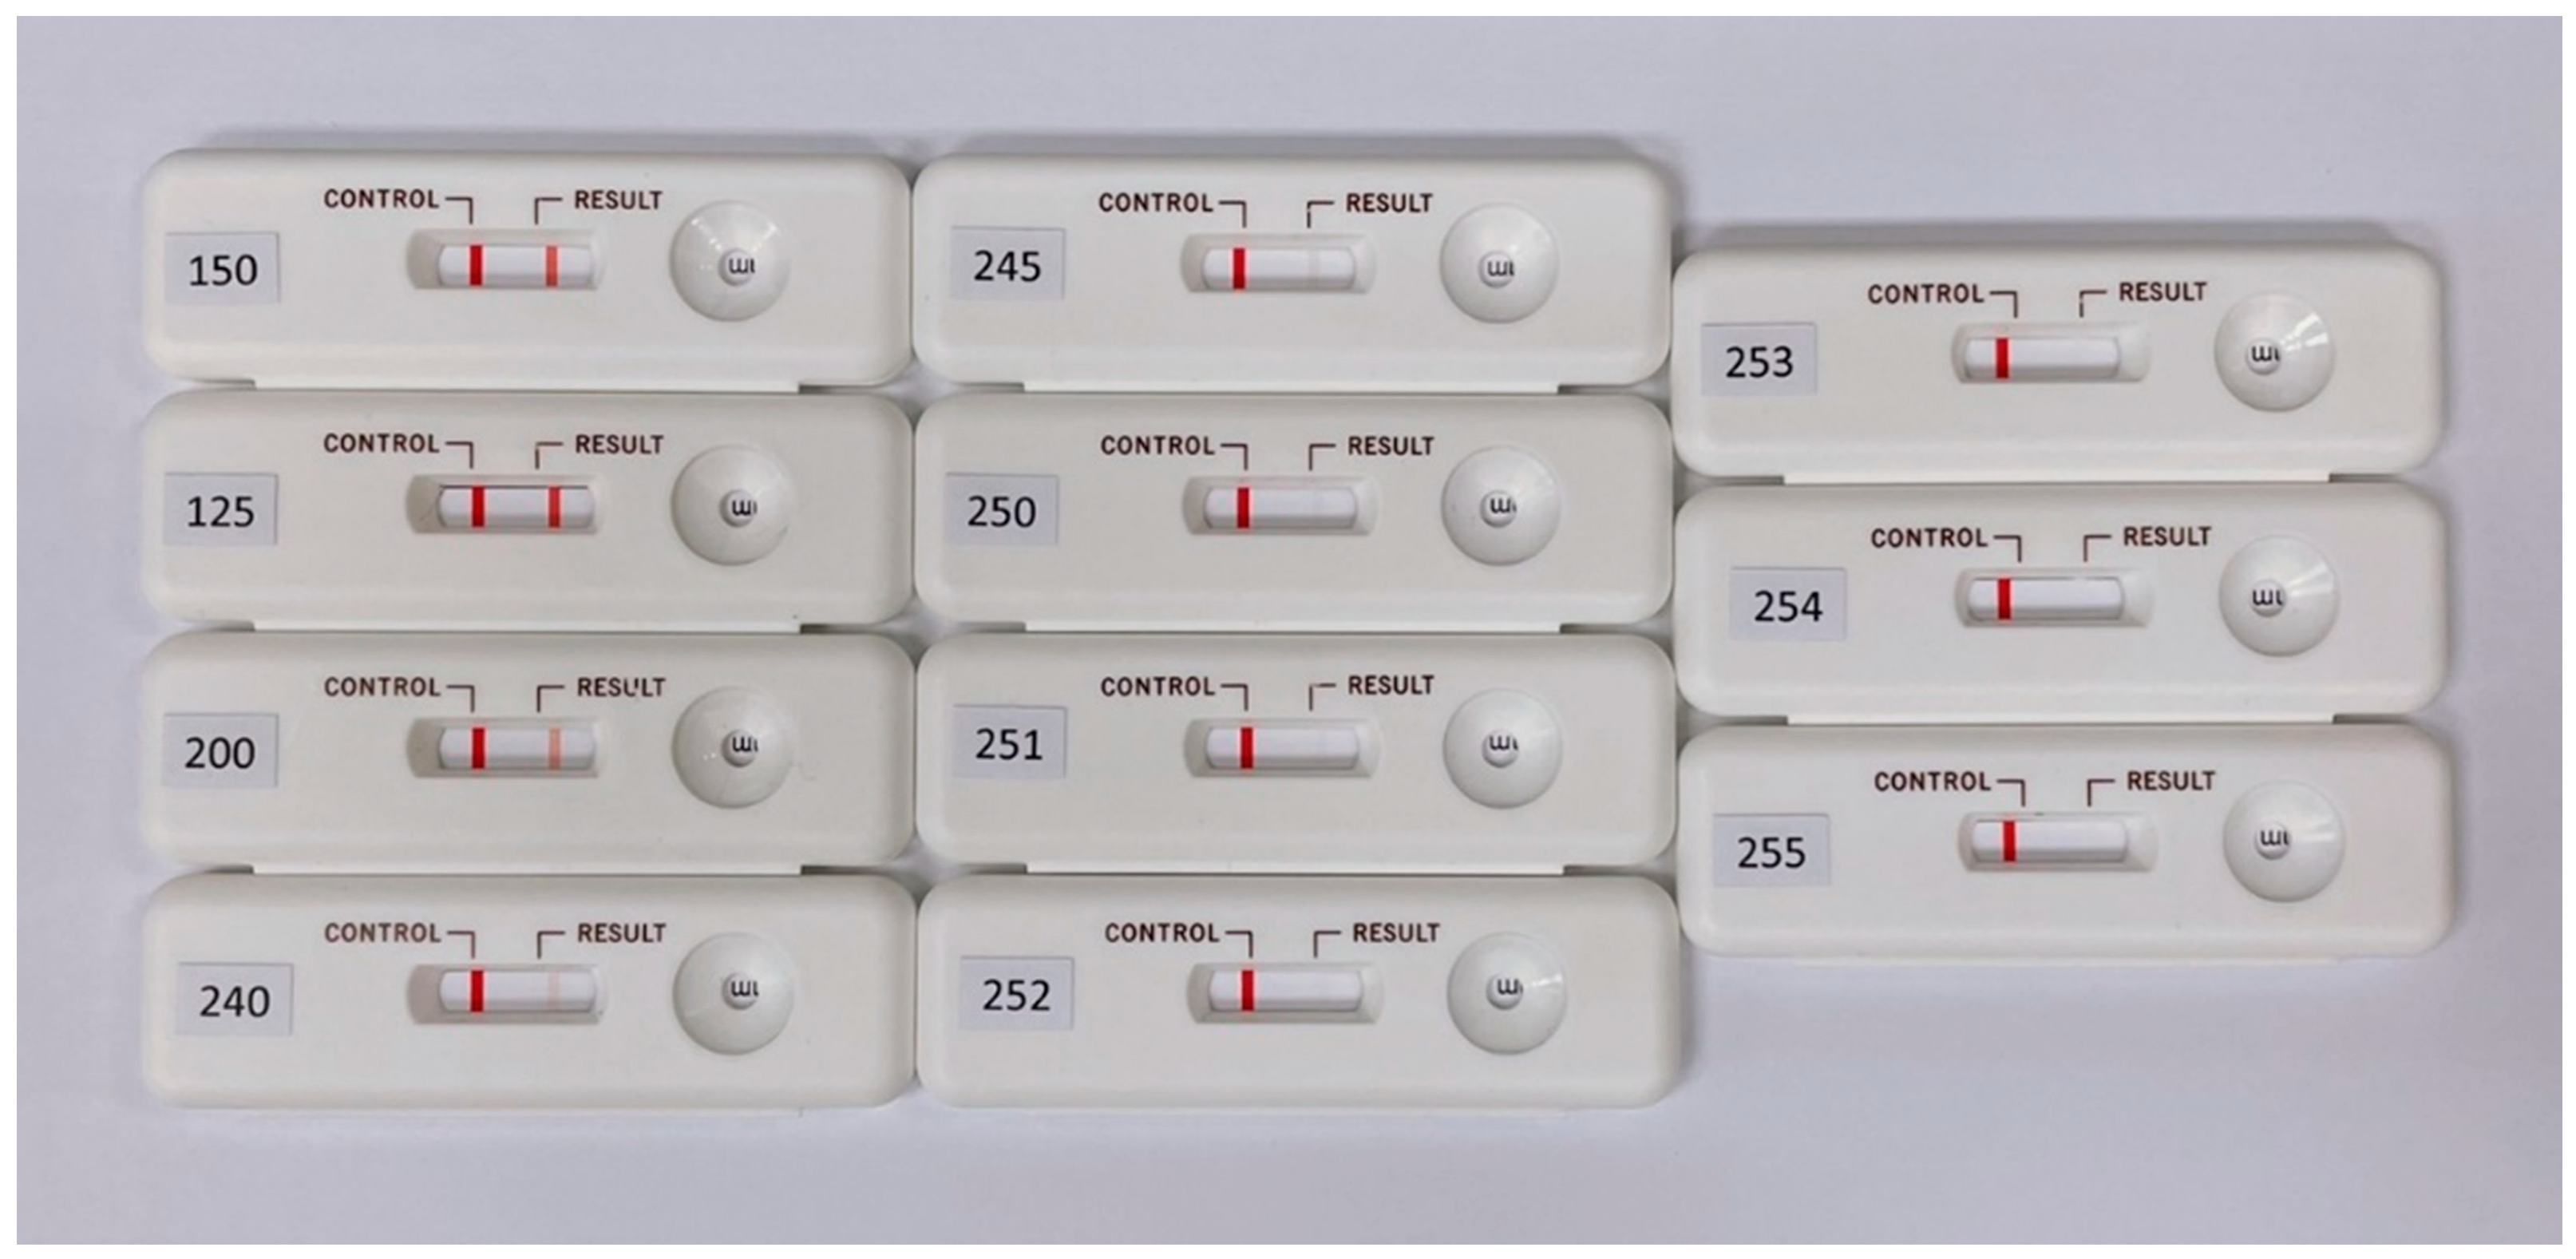
3. Results and Discussion
The Taguchi Approach
4. Conclusions
Author Contributions
Funding
Institutional Review Board Statement
Informed Consent Statement
Data Availability Statement
Conflicts of Interest
References
- Baselt, D.R.; Lee, G.U.; Natesan, M.; Metzger, S.W.; Sheehan, P.; Colton, R.J. A biosensor based on magnetoresistance technology. Biosens. Bioelectron. 1998, 13, 731–739. [Google Scholar] [CrossRef]
- Chen, L.; Bao, C.-C.; Yang, H.; Li, D.; Lei, C.; Wang, T.; Hu, H.-Y.; He, M.; Zhou, Y.; Cui, D.-X. A prototype of giant magnetoimpedance-based biosensing system for targeted detection of gastric cancer cells. Biosens. Bioelectron. 2011, 26, 3246–3253. [Google Scholar] [CrossRef] [PubMed]
- Buznikov, N.; Safronov, A.; Orue, I.; Golubeva, E.; Lepalovskij, V.; Svalov, A.; Chlenova, A.; Kurlyandskaya, G. Modelling of magnetoimpedance response of thin film sensitive element in the presence of ferrogel: Next step toward development of biosensor for in-tissue embedded magnetic nanoparticles detection. Biosens. Bioelectron. 2018, 117, 366–372. [Google Scholar] [CrossRef] [PubMed]
- Nara, S.; Tripathi, V.; Singh, H.; Shrivastav, T.G. Colloidal gold probe based rapid immunochromatographic strip assay for cortisol. Anal. Chim. Acta 2010, 682, 66–71. [Google Scholar] [CrossRef] [PubMed]
- Wang, Y.; Wang, L.; Zhang, J.; Wang, G.; Chen, W.; Chen, L.; Zhang, X. Preparation of Colloidal Gold Immunochromatographic Strip for Detection of Paragonimiasis skrjabini. PLoS ONE 2014, 9, e92034. [Google Scholar] [CrossRef]
- Azzazy, H.M.; Mansour, M. In vitro diagnostic prospects of nanoparticles. Clin. Chim. Acta 2009, 403, 1–8. [Google Scholar] [CrossRef] [PubMed]
- Martiskainen, I.; Talha, S.; Vuorenpää, K.; Salminen, T.; Juntunen, E.; Chattopadhyay, S.; Kumar, D.; Vuorinen, T.; Pettersson, K.; Khanna, N.; et al. Upconverting Nanoparticle Reporter–Based Highly Sensitive Rapid Lateral Flow Immunoassay for Hepatitis B Virus Surface Antigen. Anal. Bioanal. Chem. 2020, 413, 967–978. [Google Scholar] [CrossRef] [PubMed]
- Wang, D.; He, S.; Wang, X.; Yan, Y.; Liu, J.; Wu, S.; Liu, S.; Lei, Y.; Chen, M.; Li, L.; et al. Rapid Lateral Flow Immunoassay for The Fluorescence Detection Of SARS-Cov-2 RNA. Nat. Biomed. Eng. 2020, 4, 1150–1158. [Google Scholar] [CrossRef] [PubMed]
- Sakamoto, S.; Putalun, W.; Vimolmangkang, S.; Phoolcharoen, W.; Shoyama, Y.; Tanaka, H.; Morimoto, S. Enzyme-linked immunosorbent assay for the quantitative/qualitative analysis of plant secondary metabolites. J. Nat. Med. 2018, 72, 32–42. [Google Scholar] [CrossRef] [PubMed]
- Sheng, W.; Li, S.; Liu, Y.; Wang, J.; Zhang, Y.; Wang, S. Visual and rapid lateral flow immunochromatographic assay for enrofloxacin using dyed polymer microspheres and quantum dots. Microchim. Acta 2017, 184, 4313–4321. [Google Scholar] [CrossRef]
- Wong, R.; Tse, H. Lateral Flow Immunoassay; Springer: New York, NY, USA, 2009; pp. 75–94. [Google Scholar]
- Wild, D. The Immunoassay Handbook: Theory and Applications of Ligand Binding, ELISA and Related Techniques, 4th ed.; Elsevier Science: Oxford, UK, 2013. [Google Scholar]
- Lin, K.-W.; Chang, Y.-C. Embedded Immunodetection System for Fecal Occult Blood. Biosensors 2021, 11, 106. [Google Scholar] [CrossRef] [PubMed]
- Jiang, H.; Du, M. Research on the detection of gold immunochromatographic assay by the image histogram feature vectors and fuzzy C-means. In Proceedings of the 2011 Eighth International Conference on Fuzzy Systems and Knowledge Discovery (FSKD), Shanghai, China, 26–28 July 2011; pp. 467–471. [Google Scholar]
- Mei, J.; Ye, Q.; Zhou, W.; Hui, W.; Tian, J. Development and study of lateral flow test strip reader based on embedded system. In Proceedings of the IEEE 2011 10th International Conference on Electronic Measurement & Instruments, Chengdu, China, 16–19 August 2011; pp. 201–204. [Google Scholar]
- Mudanyali, O.; Dimitrov, S.; Sikora, U.; Padmanabhan, S.; Navruz, I.; Ozcan, A. Integrated rapid-diagnostic-test reader platform on a cellphone. Lab Chip 2012, 12, 2678–2686. [Google Scholar] [CrossRef] [PubMed]
- Chowdhury, K.B.; Joseph, J.; Sivaprakasam, M. Image based quantitative reader for Lateral flow immunofluorescence assay. In Proceedings of the 2015 37th Annual International Conference of the IEEE Engineering in Medicine and Biology Society (EMBC); Institute of Electrical and Electronics Engineers (IEEE), Milan, Italy, 25–29 August 2015; Volume 2015, pp. 1223–1226. [Google Scholar]
- Chowdhury, K.B.; Joseph, J.; Vasan, J.K.; Sivaprakasam, M. ImQuant—An image based fluorescence reader for quantitative lateral flow immunoassays. In Proceedings of the 38th Annual International Conference of the IEEE Engineering in Medicine and Biology Society (EMBC); Institute of Electrical and Electronics Engineers (IEEE), Orlando, FL, USA, 16–20 August 2016; Volume 2016, pp. 5152–5155. [Google Scholar]
- Kilickap, E. Optimization of cutting parameters on delamination based on Taguchi method during drilling of GFRP composite. Expert Syst. Appl. 2010, 37, 6116–6122. [Google Scholar] [CrossRef]
- Fratila, D.; Caizar, C. Application of Taguchi method to selection of optimal lubrication and cutting conditions in face milling of AlMg3. J. Clean. Prod. 2011, 19, 640–645. [Google Scholar] [CrossRef]
- Vardhan, M.V.; Sankaraiah, G.; Yohan, M.; Rao, H.J. Optimization of Parameters in CNC milling of P20 steel using Response Surface methodology and Taguchi Method. Mater. Today Proc. 2017, 4, 9163–9169. [Google Scholar] [CrossRef]
- Zahraee, S.M.; Chegeni, A.; Rohani, J.M. Characterization of Manufacturing System Computer Simulation using Taguchi Method. J. Teknol. 2015, 72, 72. [Google Scholar] [CrossRef][Green Version]
- Zhou, J.; Wu, D.; Guo, D. Optimization of the production of thiocarbohydrazide using the Taguchi method. J. Chem. Technol. Biotechnol. 2010, 85, 1402–1406. [Google Scholar] [CrossRef]
- Jamshidi, R.; Ghomi, S.F.; Karimi, B. Multi-objective green supply chain optimization with a new hybrid memetic algorithm using the Taguchi method. Sci. Iran. 2012, 19, 1876–1886. [Google Scholar] [CrossRef]
- Majeed, S.H.; Jumaa, N.K.; Mohamad, A.A. Taguchi Optimization Method for Testing Best Image Encryption Algorithm. Int. J. Comput. Digit. Syst. 2020, 9, 1001–1008. [Google Scholar] [CrossRef]
- Zhang, G.; Zhao, H.; Chen, Y.; Zhang, G.; Zhang, Z.; Peng, J.; Zhao, Z.; Yan, A. Optimization thermal design method for space cameras based on thermo-optical analysis and Taguchi method. Opt. Eng. 2020, 59, 075101. [Google Scholar] [CrossRef]


| Control Factors | Level | |||
|---|---|---|---|---|
| 1 | 2 | 3 | ||
| A | Illuminance (lux) | 200 | 240 | 280 |
| B | Contrast | 0.13 | 0.33 | 0.53 |
| C | Color Saturation | 0.35 | 0.5 | 0.65 |
| D | Tone | 0.35 | 0.5 | 0.65 |
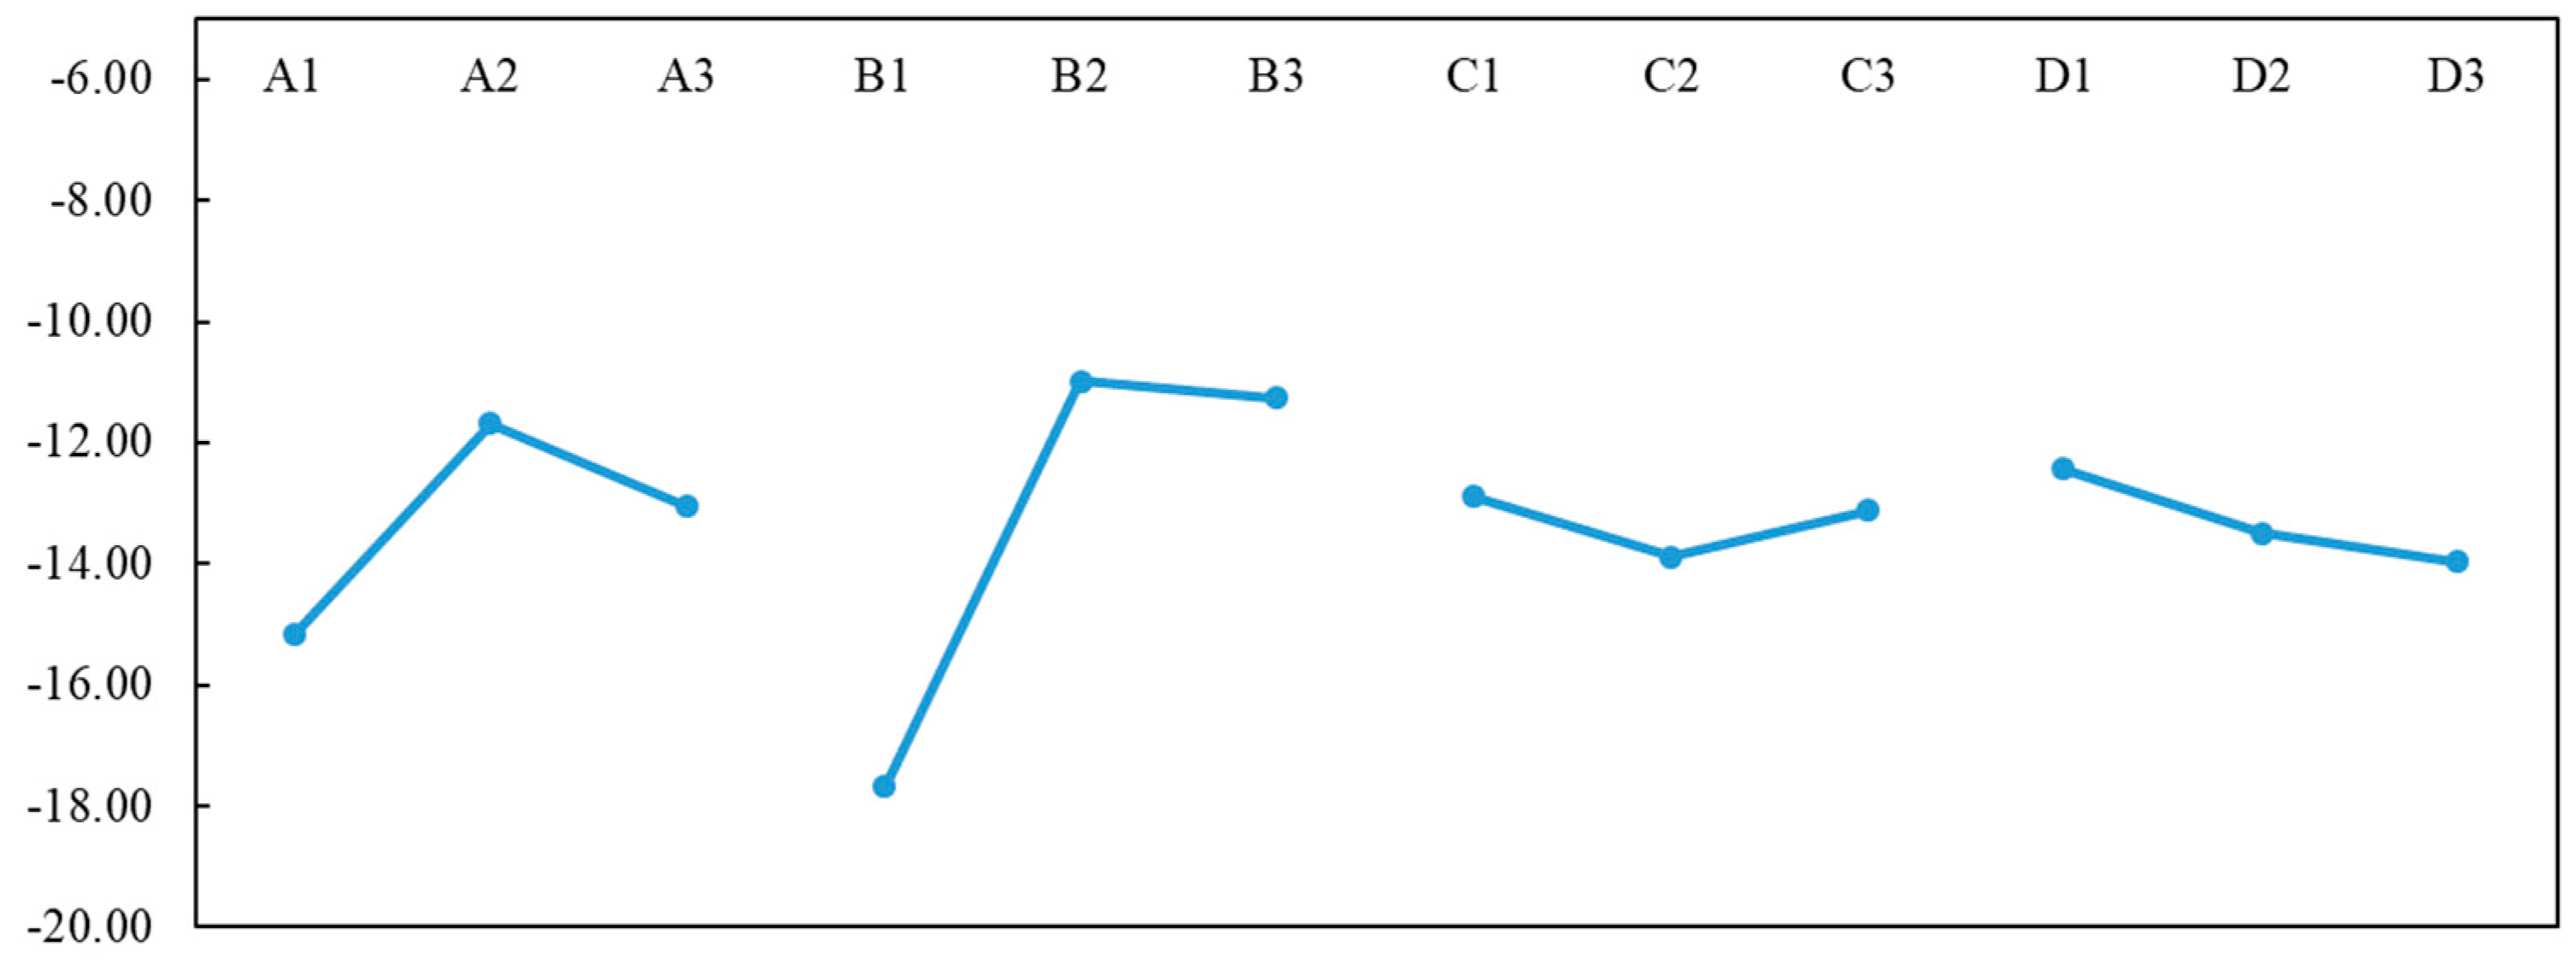
| A (Light Intensity, Lux) | B (Contract) | C (Color Saturation) | D (Tone) | |
|---|---|---|---|---|
| Level 1 | −15.2 | −17.7 | −12.9 | −12.4 |
| Level 2 | −11.7 | −11.0 | −13.9 | −13.5 |
| Level 3 | −13.1 | −11.3 | −13.1 | −14.0 |
| Range | 3.5 | 6.7 | 1.0 | 1.5 |
| Rank | 2 | 1 | 4 | 3 |
| Factors | SS | DOF | Var | F | Probability | Confidence | Significance * |
|---|---|---|---|---|---|---|---|
| A | 18.54 | 2 | 9.27 | 6.96 | 49.8% | 95.02% | Yes |
| B | 85.88 | 2 | 42.95 | 32.23 | 0.34% | 99.66% | Yes |
| C | Pooled | ||||||
| D | Pooled | ||||||
| Error | 5.32 | 4 | 1.33 | S = 1.1542 | |||
| Total | 109.76 | 8 | |||||
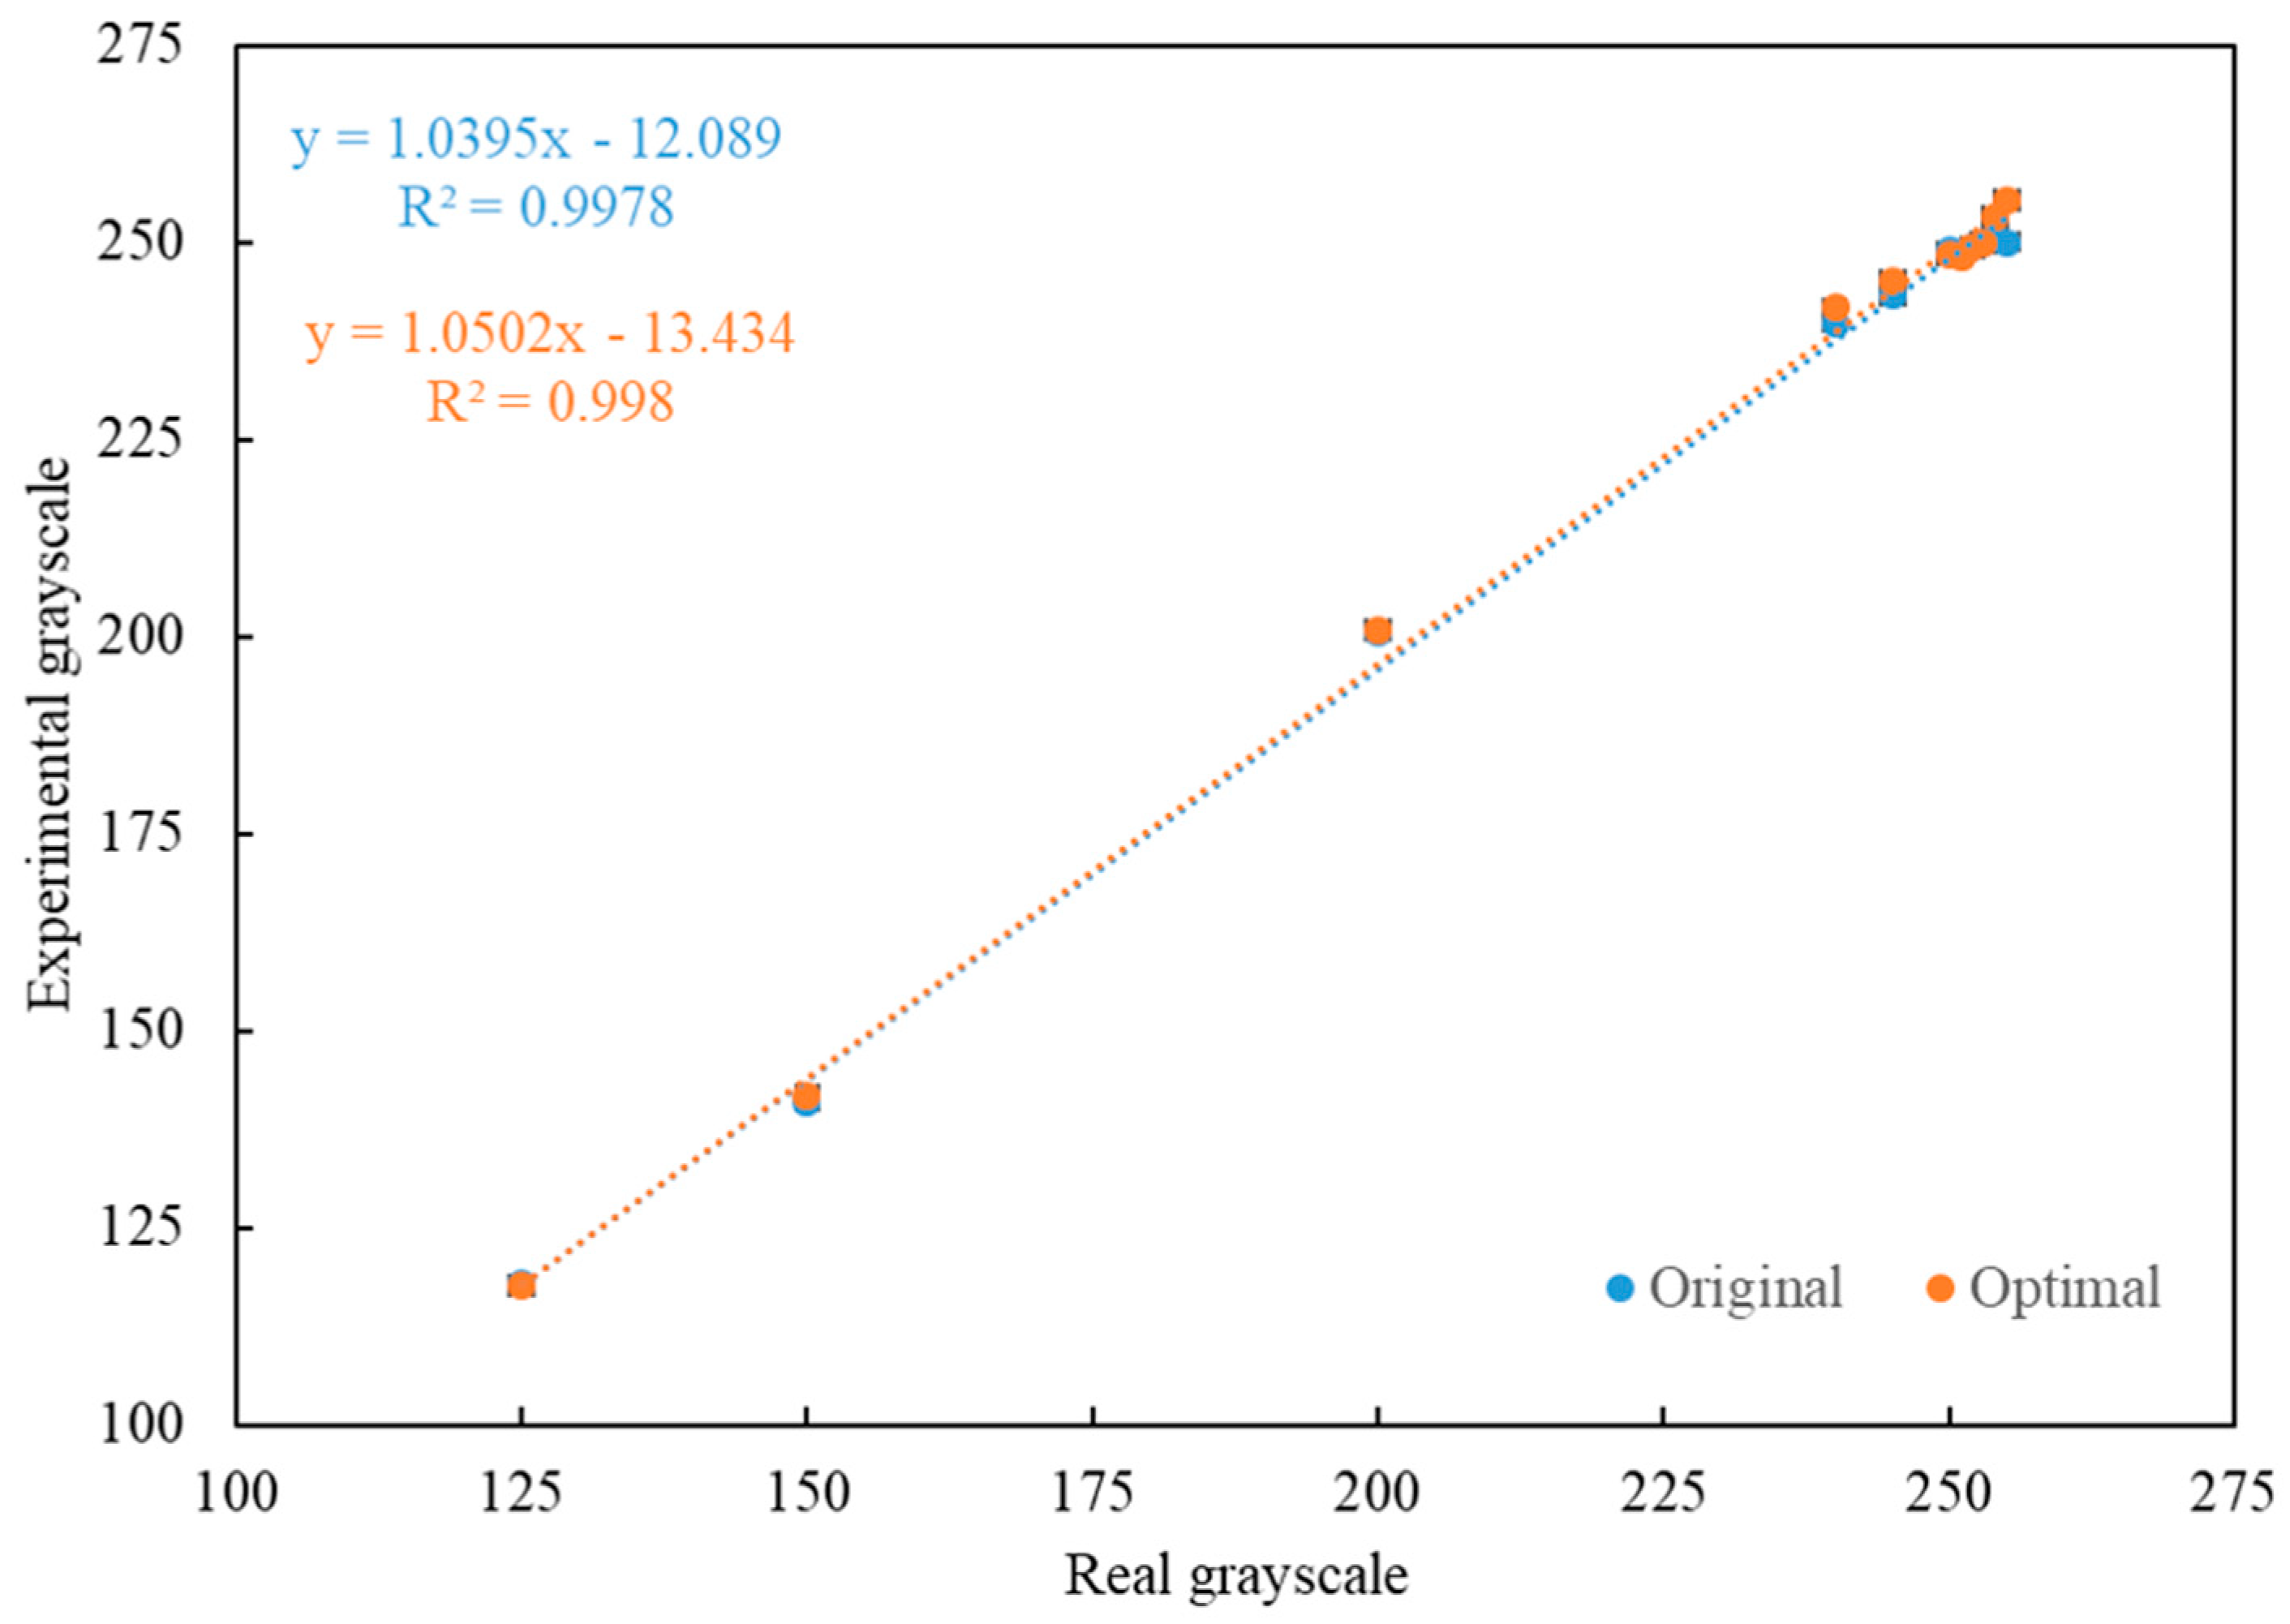
| 125 | 150 | 200 | 240 | 245 | 250 | 251 | 252 | 253 | 254 | 255 | β | Sd | S/N | ||
|---|---|---|---|---|---|---|---|---|---|---|---|---|---|---|---|
| Exp. | Predicted | ||||||||||||||
| Original | 117.85 | 140.91 | 200.59 | 239.81 | 243.31 | 248.93 | 248.61 | 249.19 | 249.81 | 250.64 | 250.04 | 0.9998 | 4.41 | −12.89 | −13.55 |
| Optimal | 117.68 | 141.76 | 200.83 | 241.71 | 245.05 | 248.37 | 248.21 | 249.35 | 250.05 | 253.29 | 255.28 | 0.9925 | 3.48 | −10.91 | −9.35 |
Publisher’s Note: MDPI stays neutral with regard to jurisdictional claims in published maps and institutional affiliations. |
© 2021 by the authors. Licensee MDPI, Basel, Switzerland. This article is an open access article distributed under the terms and conditions of the Creative Commons Attribution (CC BY) license (https://creativecommons.org/licenses/by/4.0/).
Share and Cite
Lin, K.-W.; Chang, Y.-C. Use of the Taguchi Method to Optimize an Immunodetection System for Quantitative Analysis of a Rapid Test. Diagnostics 2021, 11, 1179. https://doi.org/10.3390/diagnostics11071179
Lin K-W, Chang Y-C. Use of the Taguchi Method to Optimize an Immunodetection System for Quantitative Analysis of a Rapid Test. Diagnostics. 2021; 11(7):1179. https://doi.org/10.3390/diagnostics11071179
Chicago/Turabian StyleLin, Kai-Wen, and Yu-Chi Chang. 2021. "Use of the Taguchi Method to Optimize an Immunodetection System for Quantitative Analysis of a Rapid Test" Diagnostics 11, no. 7: 1179. https://doi.org/10.3390/diagnostics11071179
APA StyleLin, K.-W., & Chang, Y.-C. (2021). Use of the Taguchi Method to Optimize an Immunodetection System for Quantitative Analysis of a Rapid Test. Diagnostics, 11(7), 1179. https://doi.org/10.3390/diagnostics11071179