
Artificial Intelligence Based Algorithms for Prostate Cancer Classification and Detection on Magnetic Resonance Imaging: A Narrative Review

 , , ,
, , ,
Abstract
1. Introduction
2. Background
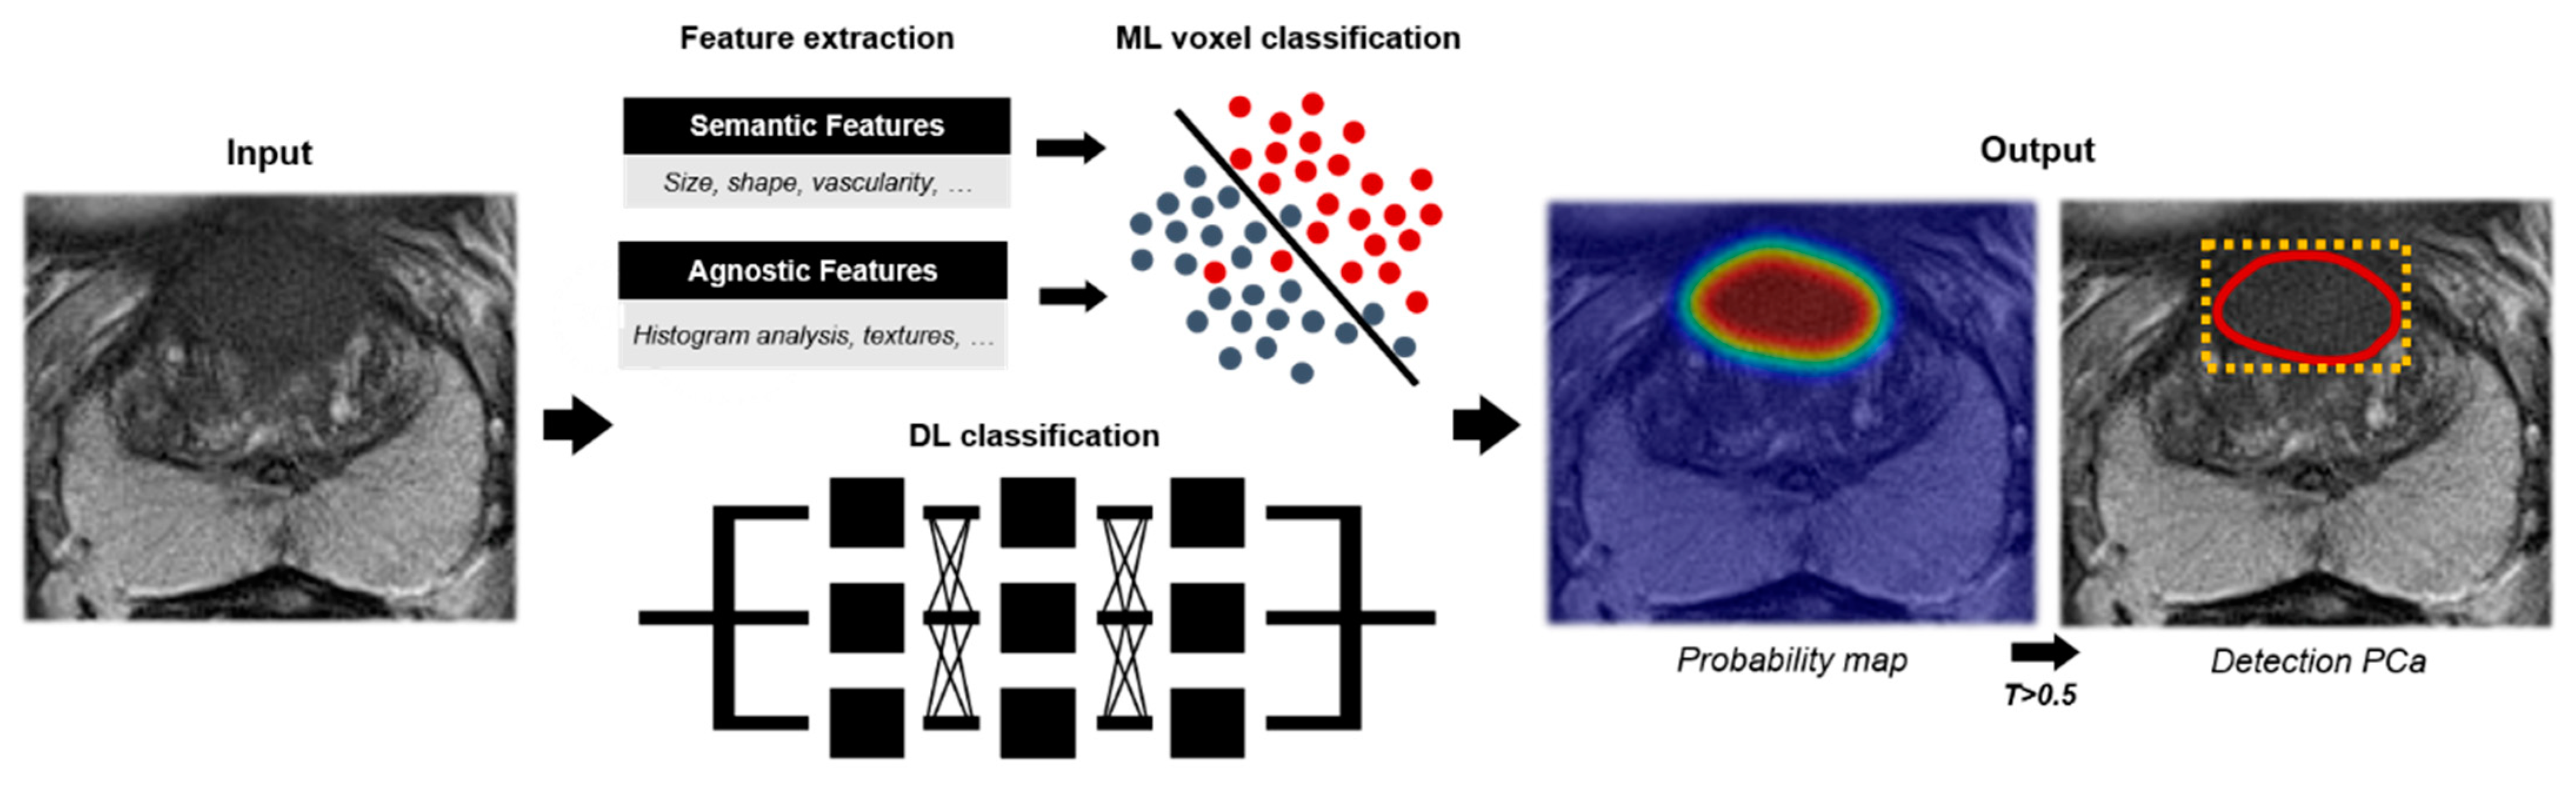
Machine Learning and Deep Learning Approaches
3. Materials and Methods
- 1.
- Lesion classification algorithms, i.e., Computer-Aided Diagnosis (CADx)Within the first group we included algorithms that classify manually annotated regions, such as lesion segmentations. We discriminate between two-class classification algorithms, utilizing either ML or DL, and multi-class classification algorithms.
- 2.
- Lesion detection algorithms, i.e., Computer-Aided Detection (CADe)The second group included algorithms that detect and localize PCa lesions and provide the user with probability maps, segmentations, and/or attention boxes as output. We discriminate between algorithms providing two-class detection and multi-class detection.
4. AI Algorithms for Prostate Cancer Classification and Detection
4.1. Lesion Classification (CADx)
4.1.1. Two-Class Lesion Classification with Machine Learning
4.1.2. Two-Class Lesion Classification with Deep Learning
4.1.3. Multi-Class Lesion Classification
4.2. Lesion Detection (CADe)
4.2.1. Two-Class Lesion Detection
4.2.2. Multi-Class Lesion Detection
4.3. Commercial CAD Algorithms for Prostate MRI
5. Discussion
6. Conclusions
Supplementary Materials
Author Contributions
Funding
Institutional Review Board Statement
Informed Consent Statement
Data Availability Statement
Conflicts of Interest
References
- Sung, H.; Ferlay, J.; Siegel, R.L.; Laversanne, M.; Soerjomataram, I.; Jemal, A.; Bray, F. Global cancer statistics 2020: GLOBOCAN estimates of incidence and mortality worldwide for 36 cancers in 185 countries. CA Cancer J. Clin. 2021, 68, 394–424. [Google Scholar] [CrossRef]
- Siegel, R.L.; Miller, K.D.; Jemal, A. Cancer statistics, 2020. CA Cancer J. Clin. 2020, 70, 7–30. [Google Scholar] [CrossRef]
- Martín Noguerol, T.; Paulano-Godino, F.; Martín-Valdivia, M.T.; Menias, C.O.; Luna, A. Strengths, Weaknesses, Opportunities, and Threats Analysis of Artificial Intelligence and Machine Learning Applications in Radiology. J. Am. Coll. Radiol. 2019, 16, 1239–1247. [Google Scholar] [CrossRef] [PubMed]
- Kasivisvanathan, V.; Rannikko, A.S.; Borghi, M. MRI-targeted or standard biopsy for prostate-cancer diagnosis. N. Engl. J. Med. 2018, 378, 1767–1777. [Google Scholar] [CrossRef]
- Rouvière, O.; Puech, P.; Renard-Penna, R.; Claudon, M.; Roy, C.; Mège-Lechevallier, F.; Decaussin-Petrucci, M.; Dubreuil-Chambardel, M.; Magaud, L.; Remontet, L.; et al. Use of prostate systematic and targeted biopsy on the basis of multiparametric MRI in biopsy-naive patients (MRI-FIRST): A prospective, multicentre, paired diagnostic study. Lancet Oncol. 2019, 20, 100–109. [Google Scholar] [CrossRef]
- van der Leest, M.; Cornel, E.; Israël, B.; Hendriks, R.; Padhani, A.R.; Hoogenboom, M.; Zamecnik, P.; Bakker, D.; Setiasti, A.Y.; Veltman, J.; et al. Head-to-head Comparison of Transrectal Ultrasound-guided Prostate Biopsy Versus Multiparametric Prostate Resonance Imaging with Subsequent Magnetic Resonance-guided Biopsy in Biopsy-naïve Men with Elevated Prostate-specific Antigen: A Large Prospective Mu. Eur. Urol. 2019, 75, 570–578. [Google Scholar] [CrossRef]
- Drost, F.H.; Osses, D.F.; Nieboer, D.; Steyerberg, E.W.; Bangma, C.H.; Roobol, M.J.; Schoots, I.G. Prostate MRI, with or without MRI-targeted biopsy, and systematic biopsy for detecting prostate cancer. Cochrane Database Syst. Rev. 2019, 2019, 1–207. [Google Scholar] [CrossRef]
- Mottet, N.; Bellmunt, J.; Bolla, M.; Briers, E.; Cumberbatch, M.G.; De Santis, M.; Fossati, N.; Gross, T.; Henry, A.M.; Joniau, S.; et al. EAU-ESTRO-SIOG Guidelines on Prostate Cancer. Part 1: Screening, Diagnosis, and Local Treatment with Curative Intent. Eur. Urol. 2017, 71, 618–629. [Google Scholar] [CrossRef]
- Weinreb, J.C.; Barentsz, J.O.; Choyke, P.L.; Cornud, F.; Haider, M.A.; Macura, K.J.; Margolis, D.; Schnall, M.D.; Shtern, F.; Tempany, C.M.; et al. PI-RADS Prostate Imaging—Reporting and Data System: 2015, Version 2. Eur. Urol. 2016, 69, 16–40. [Google Scholar] [CrossRef]
- Rosenkrantz, A.B.; Ayoola, A.; Hoffman, D.; Khasgiwala, A.; Prabhu, V.; Smereka, P.; Somberg, M.; Taneja, S.S. The Learning Curve in Prostate MRI Interpretation: Self-Directed Learning Versus Continual Reader Feedback. Am. J. Roentgenol. 2017, 208, 92–100. [Google Scholar] [CrossRef]
- Rudolph, M.M.; Baur, A.D.J.; Cash, H.; Haas, M.; Mahjoub, S.; Hartenstein, A.; Hamm, C.A.; Beetz, N.L.; Konietschke, F.; Hamm, B.; et al. Diagnostic performance of PI-RADS version 2.1 compared to version 2.0 for detection of peripheral and transition zone prostate cancer. Sci. Rep. 2020, 10, 1–10. [Google Scholar] [CrossRef] [PubMed]
- Smith, C.P.; Harmon, S.A.; Barrett, T.; Bittencourt, L.K.; Law, Y.M.; Shebel, H.; An, J.Y.; Czarniecki, M.; Mehralivand, S.; Coskun, M.; et al. Intra- and interreader reproducibility of PI-RADSv2: A multireader study. J. Magn. Reson. Imaging 2019, 49, 1694–1703. [Google Scholar] [CrossRef]
- Fujita, H. AI—based computer—aided diagnosis ( AI—CAD): The latest review to read first. Radiol. Phys. Technol. 2020, 13, 6–19. [Google Scholar] [CrossRef] [PubMed]
- Choy, G.; Khalilzadeh, O.; Michalski, M.; Do, S.; Samir, A.E.; Pianykh, O.S.; Geis, J.R.; Pandharipande, P.V.; Brink, J.A.; Dreyer, K.J. Current Applications and Future Impact of Machine Learning in Radiology. Radiology 2018, 288, 318–328. [Google Scholar] [CrossRef] [PubMed]
- Erickson, B.J.; Korfiatis, P.; Akkus, Z.; Kline, T.L. Machine learning for medical imaging. Radiographics 2017, 37, 505–515. [Google Scholar] [CrossRef]
- Gillies, R.J.; Kinahan, P.E.; Hricak, H. Radiomics: Images are more than pictures, they are data. Radiology 2016, 278, 563–577. [Google Scholar] [CrossRef] [PubMed]
- Shen, D.; Wu, G.; Suk, H. Il Deep Learning in Medical Image Analysis. Annu. Rev. Biomed. Eng. 2017, 19, 221–248. [Google Scholar] [CrossRef]
- Miotto, R.; Wang, F.; Wang, S.; Jiang, X.; Dudley, J.T. Deep learning for healthcare: Review, opportunities and challenges. Brief. Bioinform. 2017, 19, 1236–1246. [Google Scholar] [CrossRef]
- Litjens, G.; Kooi, T.; Bejnordi, B.E.; Arindra, A.; Setio, A.; Ciompi, F.; Ghafoorian, M.; Van Der Laak, J.A.W.M.; Van Ginneken, B.; Clara, I.S. A Survey on Deep Learning in Medical Image Analysis. Med. Image Anal. 2017, 42, 60–88. [Google Scholar] [CrossRef]
- Fryback, D.G.; Thornbury, J.R. The Efficacy of Diagnostic Imaging. Med. Decis. Mak. 1991, 11, 88–94. [Google Scholar] [CrossRef]
- van Leeuwen, K.G.; Schalekamp, S.; Rutten, M.J.C.M.; van Ginneken, B.; de Rooij, M. Artificial intelligence in radiology: 100 commercially available products and their scientific evidence. Eur. Radiol. 2021, 1–8. [Google Scholar] [CrossRef]
- Akamine, Y.; Ueda, Y.; Ueno, Y.; Sofue, K.; Murakami, T.; Yoneyama, M.; Obara, M.; Van Cauteren, M. Application of hierarchical clustering to multi-parametric MR in prostate: Differentiation of tumor and normal tissue with high accuracy. Magn. Reson. Imaging 2020, 74, 90–95. [Google Scholar] [CrossRef] [PubMed]
- Algohary, A.; Shiradkar, R.; Pahwa, S.; Purysko, A.; Verma, S.; Moses, D.; Shnier, R.; Haynes, A.; Delprado, W.; Thompson, J.; et al. Combination of Peri-Tumoral and Intra-Tumoral Radiomic Features on Bi-Parametric MRI Accurately Stratifies Prostate Cancer Risk: A Multi-Site Study. Cancers 2020, 12, 2200. [Google Scholar] [CrossRef]
- Antonelli, M.; Johnston, E.W.; Dikaios, N.; Cheung, K.K.; Sidhu, H.S.; Appayya, M.B.; Giganti, F.; Simmons, L.A.M.M.; Freeman, A.; Allen, C.; et al. Machine learning classifiers can predict Gleason pattern 4 prostate cancer with greater accuracy than experienced radiologists. Eur. Radiol. 2019, 29, 4754–4764. [Google Scholar] [CrossRef] [PubMed]
- Bleker, J.; Kwee, T.C.; Dierckx, R.A.J.O.; de Jong, I.J.; Huisman, H.; Yakar, D. Multiparametric MRI and auto-fixed volume of interest-based radiomics signature for clinically significant peripheral zone prostate cancer. Eur. Radiol. 2020, 30, 1313–1324. [Google Scholar] [CrossRef] [PubMed]
- Bonekamp, D.; Kohl, S.; Wiesenfarth, M.; Schelb, P.; Radtke, J.P.; Götz, M.; Kickingereder, P.; Yaqubi, K.; Hitthaler, B.; Gählert, N.; et al. Radiomic Machine Learning for Characterization of Prostate Lesions with MRI: Comparison to ADC Values. Radiology 2018, 289, 128–137. [Google Scholar] [CrossRef] [PubMed]
- Brancato, V.; Aiello, M.; Basso, L.; Monti, S.; Palumbo, L.; Di Costanzo, G.; Salvatore, M.; Ragozzino, A.; Cavaliere, C. Evaluation of a multiparametric MRI radiomic-based approach for stratification of equivocal PI-RADS 3 and upgraded PI-RADS 4 prostatic lesions. Sci. Rep. 2021, 11, 1–10. [Google Scholar] [CrossRef]
- Chen, T.; Li, M.; Gu, Y.; Zhang, Y.; Yang, S.; Wei, C.; Wu, J.; Li, X.; Zhao, W.; Shen, J. Prostate Cancer Differentiation and Aggressiveness: Assessment With a Radiomic-Based Model vs. PI-RADS v2. J. Magn. Reson. Imaging 2019, 49, 875–884. [Google Scholar] [CrossRef] [PubMed]
- Dinh, A.H.; Melodelima, C.; Souchon, R.; Moldovan, P.C.; Bratan, F.; Pagnoux, G.; Mège-Lechevallier, F.; Ruffion, A.; Crouzet, S.; Colombel, M.; et al. Characterization of prostate cancer with Gleason score of at least 7 by using quantitative multiparametric MR imaging: Validation of a computer-aided diagnosis system in patients referred for prostate biopsy. Radiology 2018, 287, 525–533. [Google Scholar] [CrossRef]
- Dinh, A.H.; Melodelima, C.; Souchon, R.; Lehaire, J.; Bratan, F.; Florence, M.L.; Ruffion, A.; Crouzet, S.; Colombel, M.; Rouvière, O. Quantitative analysis of prostate multiparametric MR images for detection of aggressive prostate cancer in the peripheral zone: A multiple imager study. Radiology 2016, 280, 117–127. [Google Scholar] [CrossRef]
- Ellmann, S.; Schlicht, M.; Dietzel, M.; Janka, R.; Hammon, M.; Saake, M.; Ganslandt, T.; Hartmann, A.; Kunath, F.; Wullich, B.; et al. Computer-Aided Diagnosis in Multiparametric MRI of the Prostate: An Open-Access Online Tool for Lesion Classification with High Accuracy. Cancers 2020, 12, 2366. [Google Scholar] [CrossRef]
- Hectors, S.J.; Cherny, M.; Yadav, K.K.; Beksac, A.T.; Thulasidass, H.; Lewis, S.; Davicioni, E.; Wang, P.; Tewari, A.K.; Taouli, B. Radiomics Features Measured with Multiparametric Magnetic Resonance Imaging Predict Prostate Cancer Aggressiveness. J. Urol. 2019, 202, 498–505. [Google Scholar] [CrossRef] [PubMed]
- Kan, Y.; Zhang, Q.; Hao, J.; Wang, W.; Zhuang, J.; Gao, J.; Huang, H.; Liang, J.; Marra, G.; Calleris, G.; et al. Clinico-radiological characteristic-based machine learning in reducing unnecessary prostate biopsies of PI-RADS 3 lesions with dual validation. Eur. Radiol. 2020, 30, 6274–6284. [Google Scholar] [CrossRef]
- Kwon, D.; Reis, I.M.; Breto, A.L.; Tschudi, Y.; Gautney, N.; Zavala-Romero, O.; Lopez, C.; Ford, J.C.; Punnen, S.; Pollack, A.; et al. Classification of suspicious lesions on prostate multiparametric MRI using machine learning. J. Med. Imaging 2018, 5, 1–9. [Google Scholar] [CrossRef]
- Li, J.; Weng, Z.; Xu, H.; Zhang, Z.; Miao, H.; Chen, W.; Liu, Z. Support Vector Machines (SVM) classification of prostate cancer Gleason score in central gland using multiparametric magnetic resonance images: A cross-validated study. Eur. J. Radiol. 2018, 98, 61–67. [Google Scholar] [CrossRef]
- Liu, B.; Cheng, J.; Guo, D.J.; He, X.J.; Luo, Y.D.; Zeng, Y.; Li, C.M. Prediction of prostate cancer aggressiveness with a combination of radiomics and machine learning-based analysis of dynamic contrast-enhanced MRI. Clin. Radiol. 2019, 74, 1–8. [Google Scholar] [CrossRef]
- Min, X.; Li, M.; Dong, D.; Feng, Z.; Zhang, P.; Ke, Z.; You, H.; Han, F.; Ma, H.; Tian, J.; et al. Multi-parametric MRI-based radiomics signature for discriminating between clinically significant and insignificant prostate cancer: Cross-validation of a machine learning method. Eur. J. Radiol. 2019, 115, 16–21. [Google Scholar] [CrossRef]
- Orczyk, C.; Villers, A.; Rusinek, H.; Lepennec, V.; Giganti, F.; Mikheev, A.; Bernaudin, M. Prostate cancer heterogeneity: Texture analysis score based on multiple magnetic resonance imaging sequences for detection, stratification and selection of lesions at time of biopsy. BJU Int. 2019, 124, 76–86. [Google Scholar] [CrossRef]
- Qi, Y.; Zhang, S.; Wei, J.; Zhang, G.; Lei, J.; Yan, W.; Xiao, Y.; Yan, S.; Xue, H.; Feng, F.; et al. Multiparametric MRI-Based Radiomics for Prostate Cancer Screening With PSA in 4–10 ng/mL to Reduce Unnecessary Biopsies. J. Magn. Reson. Imaging 2020, 51, 1890–1899. [Google Scholar] [CrossRef]
- Toivonen, J.; Perez, I.M.; Movahedi, P.; Merisaari, H.; Pesola, M.; Taimen, P.; Boström, P.J.; Pohjankukka, J.; Kiviniemi, A.; Pahikkala, T.; et al. Radiomics and machine learning of multisequence multiparametric prostate MRI: Towards improved non-invasive prostate cancer characterization. PLoS ONE 2019, 88, 1–23. [Google Scholar] [CrossRef] [PubMed]
- Transin, S.; Souchon, R.; Gonindard-Melodelima, C.; de Rozario, R.; Walker, P.; Funes de la Vega, M.; Loffroy, R.; Cormier, L.; Rouvière, O. Computer-aided diagnosis system for characterizing ISUP grade ≥ 2 prostate cancers at multiparametric MRI: A cross-vendor evaluation. Diagn. Interv. Imaging 2019, 100, 801–811. [Google Scholar] [CrossRef]
- Varghese, B.; Chen, F.; Hwang, D.; Palmer, S.L.; Abreu, A.L.D.C.; Ukimura, O.; Aron, M.; Aron, M.; Gill, I.; Duddalwar, V.; et al. Objective risk stratification of prostate cancer using machine learning and radiomics applied to multiparametric magnetic resonance images. Sci. Rep. 2019, 9, 1–10. [Google Scholar] [CrossRef]
- Viswanath, S.E.; Chirra, P.V.; Yim, M.C.; Rofsky, N.M.; Purysko, A.S.; Rosen, M.A.; Bloch, B.N.; Madabhushi, A. Comparing radiomic classifiers and classifier ensembles for detection of peripheral zone prostate tumors on T2-weighted MRI: A multi-site study. BMC Med. Imaging 2019, 19, 1–12. [Google Scholar] [CrossRef] [PubMed]
- Woźnicki, P.; Westhoff, N.; Huber, T.; Riffel, P.; Froelich, M.F.; Gresser, E.; von Hardenberg, J.; Mühlberg, A.; Michel, M.S.; Schoenberg, S.O.; et al. Multiparametric MRI for prostate cancer characterization: Combined use of radiomics model with PI-RADS and clinical parameters. Cancers 2020, 12, 1767. [Google Scholar] [CrossRef] [PubMed]
- Wu, M.; Krishna, S.; Thornhill, R.E.; Flood, T.A.; McInnes, M.D.F.; Schieda, N. Transition Zone Prostate Cancer: Logistic Regression and Machine-Learning Models of Quantitative ADC, Shape and Texture Features Are Highly Accurate for Diagnosis. J. Magn. Reson. Imaging 2019, 50, 940–950. [Google Scholar] [CrossRef] [PubMed]
- Xu, M.; Fang, M.; Zou, J.; Yang, S.; Yu, D.; Zhong, L.; Hu, C.; Zang, Y.; Dong, D.; Tian, J.; et al. Using biparametric MRI radiomics signature to differentiate between benign and malignant prostate lesions. Eur. J. Radiol. 2019, 114, 38–44. [Google Scholar] [CrossRef]
- Zhang, Y.; Chen, W.; Yue, X.; Shen, J.; Gao, C.; Pang, P.; Cui, F.; Xu, M. Development of a Novel, Multi-Parametric, MRI-Based Radiomic Nomogram for Differentiating Between Clinically Significant and Insignificant Prostate Cancer. Front. Oncol. 2020, 10, 1–10. [Google Scholar] [CrossRef]
- Litjens, G.J.S.; Debats, O.; Barentsz, J.O.; Karssemeijer, N.; Huisman, H. SPIE-AAPM PROSTATEx Challenge Data. In: Cancer Imaging Arch. Available online: https://wiki.cancerimagingarchive.net/display/Public/SPIE-AAPM-NCI+PROSTATEx+Chal-lenges (accessed on 3 May 2021).
- Park, S.H.; Han, K. Methodologic Guide for Evaluating Clinical Performance and Effect of Artificial Intelligence Technology for Medical Diagnosis and Prediction. Radiology 2018, 286, 800–809. [Google Scholar] [CrossRef]
- Van Calster, B.; Vickers, A.J. Calibration of risk prediction models: Impact on decision-analytic performance. Med. Decis. Mak. 2015, 35, 162–169. [Google Scholar] [CrossRef]
- Aldoj, N.; Lukas, S.; Dewey, M.; Penzkofer, T. Semi-automatic classification of prostate cancer on multi-parametric MR imaging using a multi-channel 3D convolutional neural network. Eur. Radiol. 2020, 30, 1243–1253. [Google Scholar] [CrossRef]
- Chen, Q.; Hu, S.; Long, P.; Lu, F.; Shi, Y.; Li, Y. A Transfer Learning Approach for Malignant Prostate Lesion Detection on Multiparametric MRI. Technol. Cancer Res. Treat. 2019, 18, 1–9. [Google Scholar] [CrossRef]
- Deniffel, D.; Abraham, N.; Namdar, K.; Dong, X.; Salinas, E.; Milot, L.; Khalvati, F.; Haider, M.A. Using decision curve analysis to benchmark performance of a magnetic resonance imaging-based deep learning model for prostate cancer risk assessment. Eur. Radiol. 2020, 30, 6867–6876. [Google Scholar] [CrossRef]
- Reda, I.; Khalil, A.; Elmogy, M.; Abou El-Fetouh, A.; Shalaby, A.; Abou El-Ghar, M.; Elmaghraby, A.; Ghazal, M.; El-Baz, A. Deep Learning Role in Early Diagnosis of Prostate Cancer. Technol. Cancer Res. Treat. 2018, 17, 1–11. [Google Scholar] [CrossRef]
- Song, Y.; Zhang, Y.-D.; Yan, X.; Liu, H.; Zhou, M.; Hu, B.; Yang, G. Computer-aided diagnosis of prostate cancer using a deep convolutional neural network from multiparametric MRI. J. Magn. Reson. Imaging 2018, 48, 1570–1577. [Google Scholar] [CrossRef]
- Takeuchi, T.; Hattori-Kato, M.; Okuno, Y.; Iwai, S.; Mikami, K. Prediction of prostate cancer by deep learning with multilayer artificial neural network. Can. Urol. Assoc. J. 2019, 13, 145–150. [Google Scholar] [CrossRef]
- Wang, Y.; Wang, M. Selecting proper combination of mpMRI sequences for prostate cancer classification using multi-input convolutional neuronal network. Phys. Medica 2020, 80, 92–100. [Google Scholar] [CrossRef]
- Yoo, S.; Gujrathi, I.; Haider, M.A.; Khalvati, F. Prostate Cancer Detection using Deep Convolutional Neural Networks. Sci. Rep. 2019, 9, 1–10. [Google Scholar] [CrossRef] [PubMed]
- Yuan, Y.; Qin, W.; Buyyounouski, M.; Ibragimov, B.; Hancock, S.; Han, B.; Xing, L. Prostate cancer classification with multiparametric MRI transfer learning model. Med. Phys. 2019, 46, 756–765. [Google Scholar] [CrossRef] [PubMed]
- Zhong, X.; Cao, R.; Shakeri, S.; Scalzo, F.; Lee, Y.; Enzmann, D.R.; Wu, H.H.; Raman, S.S.; Sung, K. Deep transfer learning-based prostate cancer classification using 3 Tesla multi-parametric MRI. Abdom. Radiol. 2019, 44, 2030–2039. [Google Scholar] [CrossRef] [PubMed]
- Van Calster, B.; Wynants, L.; Verbeek, J.F.M.; Verbakel, J.Y.; Christodoulou, E.; Vickers, A.J.; Roobol, M.J.; Steyerberg, E.W. Reporting and Interpreting Decision Curve Analysis: A Guide for Investigators. Eur. Urol. 2018, 74, 796–804. [Google Scholar] [CrossRef]
- Abraham, B.; Nair, M.S. Automated grading of prostate cancer using convolutional neural network and ordinal class classifier. Inform. Med. Unlocked 2019, 17, 1–8. [Google Scholar] [CrossRef]
- Brunese, L.; Mercaldo, F.; Reginelli, A.; Santone, A. Radiomics for gleason score detection through deep learning. Sensors (Switzerland) 2020, 20, 5411. [Google Scholar] [CrossRef]
- Chaddad, A.; Kucharczyk, M.J.; Niazi, T. Multimodal radiomic features for the predicting gleason score of prostate cancer. Cancers 2018, 10, 249. [Google Scholar] [CrossRef]
- Jensen, C.; Carl, J.; Boesen, L.; Langkilde, N.C.; Østergaard, L.R. Assessment of prostate cancer prognostic Gleason grade group using zonal-specific features extracted from biparametric MRI using a KNN classifier. J. Appl. Clin. Med. Phys. 2019, 20, 146–153. [Google Scholar] [CrossRef]
- Bloch, B.N.; Jain, A.; Jaffe, C.C. Data from PROSTATE-DIAGNOSIS. Available online: https://wiki.cancerimagingarchive.net/display/Public/PROSTATE-DIAGNOSIS#3277254e31de0388cfa43f6af738c8e20831bd1 (accessed on 3 May 2021).
- Madabhushi, A.; Feldman, M. Fused Radiology-Pathology Prostate Dataset. Available online: https://wiki.cancerimagingarchive.net/display/Public/Prostate+Fused (accessed on 3 May 2021).
- Van Leenders, G.J.L.H.; Van Der Kwast, T.H.; Grignon, D.J.; Evans, A.J.; Kristiansen, G.; Kweldam, C.F.; Litjens, G.; McKenney, J.K.; Melamed, J.; Mottet, N.; et al. The 2019 International Society of Urological Pathology (ISUP) Consensus Conference on Grading of Prostatic Carcinoma. Am. J. Surg. Pathol. 2020, 44, E87–E99. [Google Scholar] [CrossRef]
- Kinsella, N.; Helleman, J.; Bruinsma, S.; Carlsson, S.; Cahill, D.; Brown, C.; Van Hemelrijck, M. Active surveillance for prostate cancer: A systematic review of contemporary worldwide practices. Transl. Androl. Urol. 2018, 7, 83–97. [Google Scholar] [CrossRef]
- Alkadi, R.; Taher, F.; El-Baz, A.; Werghi, N. A Deep Learning-Based Approach for the Detection and Localization of Prostate Cancer in T2 Magnetic Resonance Images. J. Digit. Imaging 2019, 32, 793–807. [Google Scholar] [CrossRef]
- Arif, M.; Schoots, I.G.; Castillo Tovar, J.; Bangma, C.H.; Krestin, G.P.; Roobol, M.J.; Niessen, W.; Veenland, J.F. Clinically significant prostate cancer detection and segmentation in low-risk patients using a convolutional neural network on multi-parametric MRI. Eur. Radiol. 2020, 30, 6582–6592. [Google Scholar] [CrossRef]
- Bagher-Ebadian, H.; Janic, B.; Liu, C.; Pantelic, M.; Hearshen, D.; Elshaikh, M.; Movsas, B.; Chetty, I.J.; Wen, N. Detection of Dominant Intra-prostatic Lesions in Patients With Prostate Cancer Using an Artificial Neural Network and MR Multi-modal Radiomics Analysis. Front. Oncol. 2019, 9, 1–14. [Google Scholar] [CrossRef] [PubMed]
- Gaur, S.; Lay, N.; Harmon, S.A.; Doddakashi, S.; Mehralivand, S.; Argun, B.; Barrett, T.; Bednarova, S.; Girometti, R.; Karaarslan, E.; et al. Can computer-aided diagnosis assist in the identification of prostate cancer on prostate MRI? A multi-center, multi-reader investigation. Oncotarget 2018, 9, 33804–33817. [Google Scholar] [CrossRef]
- Lay, N.; Tsehay, Y.; Greer, M.D.; Turkbey, B.; Kwak, J.T.; Choyke, P.L.; Pinto, P.; Wood, B.J.; Summers, R.M. Detection of prostate cancer in multiparametric MRI using random forest with instance weighting. J. Med. Imaging 2017, 4, 1–11. [Google Scholar] [CrossRef]
- Gholizadeh, N.; Simpson, J.; Ramadan, S.; Denham, J.; Lau, P.; Siddique, S.; Dowling, J.; Welsh, J.; Chalup, S.; Greer, P.B. Voxel-based supervised machine learning of peripheral zone prostate cancer using noncontrast multiparametric MRI. J. Appl. Clin. Med. Phys. 2020, 21, 179–191. [Google Scholar] [CrossRef]
- Greer, M.D.; Lay, N.; Shih, J.H.; Barrett, T.; Bittencourt, L.K.; Borofsky, S.; Kabakus, I.; Law, Y.M.; Marko, J.; Shebel, H.; et al. Computer-aided diagnosis prior to conventional interpretation of prostate mpMRI: An international multi-reader study. Eur. Radiol. 2018, 28, 4407–4417. [Google Scholar] [CrossRef] [PubMed]
- Ishioka, J.; Matsuoka, Y.; Uehara, S.; Yasuda, Y.; Kijima, T.; Yoshida, S.; Yokoyama, M.; Saito, K.; Kihara, K.; Numao, N.; et al. Computer-aided diagnosis of prostate cancer on magnetic resonance imaging using a convolutional neural network algorithm. BJU Int. 2018, 122, 411–417. [Google Scholar] [CrossRef] [PubMed]
- Khalvati, F.; Zhang, J.; Chung, A.G.; Shafiee, M.J.; Wong, A.; Haider, M.A. MPCaD: A multi-scale radiomics-driven framework for automated prostate cancer localization and detection. BMC Med. Imaging 2018, 18, 1–14. [Google Scholar] [CrossRef]
- Lee, P.Q.; Guida, A.; Patterson, S.; Trappenberg, T.; Bowen, C.; Beyea, S.D.; Merrimen, J.; Wang, C.; Clarke, S.E. Model-free prostate cancer segmentation from dynamic contrast-enhanced MRI with recurrent convolutional networks: A feasibility study. Comput. Med. Imaging Graph. 2019, 75, 14–23. [Google Scholar] [CrossRef]
- McGarry, S.D.; Bukowy, J.D.; Iczkowski, K.A.; Lowman, A.K.; Brehler, M.; Bobholz, S.; Nencka, A.; Barrington, A.; Jacobsohn, K.; Unteriner, J.; et al. Radio-pathomic mapping model generated using annotations from five pathologists reliably distinguishes high-grade prostate cancer. J. Med. Imaging 2020, 7, 1–11. [Google Scholar] [CrossRef]
- McGarry, S.D.; Hurrell, S.L.; Iczkowski, K.A.; Hall, W.; Kaczmarowski, A.L.; Banerjee, A.; Keuter, T.; Jacobsohn, K.; Bukowy, J.D.; Nevalainen, M.T.; et al. Radio-pathomic Maps of Epithelium and Lumen Density Predict the Location of High-Grade Prostate Cancer. Int. J. Radiat. Oncol. Biol. Phys. 2018, 101, 1179–1187. [Google Scholar] [CrossRef]
- Mehralivand, S.; Harmon, S.A.; Shih, J.H.; Smith, C.P.; Lay, N.; Argun, B.; Bednarova, S.; Baroni, R.H.; Canda, A.E.; Ercan, K.; et al. Multicenter Multireader Evaluation of an Artificial Intelligence-Based Attention Mapping System for the Detection of Prostate Cancer with Multiparametric MRI. Am. J. Roentgenol. 2020, 215, 903–912. [Google Scholar] [CrossRef]
- Sanyal, J.; Banerjee, I.; Hahn, L.; Rubin, D. An Automated Two-step Pipeline for Aggressive Prostate Lesion Detection from Multi-parametric MR Sequence. AMIA Jt. Summits Transl. Sci. Proc. 2020, 2020, 552–560. [Google Scholar]
- Schelb, P.; Wang, X.; Radtke, J.P.; Wiesenfarth, M.; Kickingereder, P.; Stenzinger, A.; Hohenfellner, M.; Schlemmer, H.-P.; Maier-Hein, K.H.; Bonekamp, D. Simulated clinical deployment of fully automatic deep learning for clinical prostate MRI assessment. Eur. Radiol. 2021, 31, 302–313. [Google Scholar] [CrossRef]
- Schelb, P.; Kohl, S.; Radtke, J.P.; Wiesenfarth, M.; Kickingereder, P.; Bickelhaupt, S.; Kuder, T.A.; Stenzinger, A.; Hohenfellner, M.; Schlemmer, H.P.; et al. Classification of cancer at prostate MRI: Deep Learning versus Clinical PI-RADS Assessment. Radiology 2019, 293, 607–617. [Google Scholar] [CrossRef]
- Sumathipala, Y.; Lay, N.; Turkbey, B. Prostate cancer detection from multi-institution multiparametric MRIs using deep convolutional neural networks. J. Med. Imaging 2018, 5, 1–12. [Google Scholar] [CrossRef]
- Wang, Z.; Liu, C.; Cheng, D.; Wang, L.; Yang, X.; Cheng, K.T. Automated detection of clinically significant prostate cancer in mp-MRI images based on an end-to-end deep neural network. IEEE Trans. Med. Imaging 2018, 37, 1127–1139. [Google Scholar] [CrossRef]
- Xu, H.; Baxter, J.S.H.; Akin, O.; Cantor-Rivera, D. Prostate cancer detection using residual networks. Int. J. Comput. Assist. Radiol. Surg. 2019, 14, 1647–1650. [Google Scholar] [CrossRef]
- Zhu, L.; Gao, G.; Liu, Y.; Han, C.; Liu, J.; Zhang, X.; Wang, X. Feasibility of integrating computer-aided diagnosis with structured reports of prostate multiparametric MRI. Clin. Imaging 2020, 60, 123–130. [Google Scholar] [CrossRef]
- Zhao, K.; Wang, C.Y.; Hu, J.; Yang, X.D.; Wang, H.; Li, F.Y.; Zhang, X.D.; Zhang, J.; Wang, X.Y. Prostate cancer identification: Quantitative analysis of T2-weighted MR images based on a back propagation artificial neural network model. Sci. China Life Sci. 2015, 58, 666–673. [Google Scholar] [CrossRef]
- Lemaître, G.; Martí, R.; Freixenet, J.; Vilanova, J.C.; Walker, P.M.; Meriaudeau, F. Computer-Aided Detection and diagnosis for prostate cancer based on mono and multi-parametric MRI: A review. Comput. Biol. Med. 2015, 60, 8–31. [Google Scholar] [CrossRef]
- Cao, R.; Mohammadian Bajgiran, A.; Afshari Mirak, S.; Shakeri, S.; Zhong, X.; Enzmann, D.; Raman, S.; Sung, K. Joint Prostate Cancer Detection and Gleason Score Prediction in mp-MRI via FocalNet. IEEE Trans. Med. Imaging 2019, 38, 2496–2506. [Google Scholar] [CrossRef]
- De Vente, C.; Vos, P.; Hosseinzadeh, M.; Pluim, J.; Veta, M. Deep Learning Regression for Prostate Cancer Detection and Grading in Bi-Parametric MRI. IEEE Trans. Biomed. Eng. 2021, 68, 374–383. [Google Scholar] [CrossRef]
- Winkel, D.J.; Wetterauer, C.; Matthias, M.O.; Lou, B.; Shi, B.; Kamen, A.; Comaniciu, D.; Seifert, H.-H.; Rentsch, C.A.; Boll, D.T. Autonomous Detection and Classification of PI-RADS Lesions in an MRI Screening Population Incorporating Multicenter-Labeled Deep Learning and Biparametric Imaging: Proof of Concept. Diagnostics 2020, 10, 951. [Google Scholar] [CrossRef]
- Bluemke, D.A.; Moy, L.; Bredella, M.A.; Ertl-Wagner, B.B.; Fowler, K.J.; Goh, V.J.; Halpern, E.F.; Hess, C.P.; Schiebler, M.L.; Weiss, C.R. Assessing radiology research on artificial intelligence: A brief guide for authors, reviewers, and readers-from the Radiology Editorial Board. Radiology 2020, 294, 487–489. [Google Scholar] [CrossRef]
- AI for Radiology. Available online: www.AIforRadiology.com (accessed on 12 March 2021).
- FDA Cleared AI Algorithms. Available online: https://models.acrdsi.org/ (accessed on 12 March 2021).
- Castillo, J.M.T.; Arif, M.; Niessen, W.J.; Schoots, I.G.; Veenland, J.F. Automated classification of significant prostate cancer on MRI: A systematic review on the performance of machine learning applications. Cancers 2020, 12, 1606. [Google Scholar] [CrossRef] [PubMed]
- Rodriguez-Ruiz, A.; Lång, K.; Gubern-Merida, A.; Broeders, M.; Gennaro, G.; Clauser, P.; Helbich, T.H.; Chevalier, M.; Tan, T.; Mertelmeier, T.; et al. Stand-Alone Artificial Intelligence for Breast Cancer Detection in Mammography: Comparison With 101 Radiologists. JNCI J. Natl. Cancer Inst. 2019, 111, 916–922. [Google Scholar] [CrossRef] [PubMed]
- Kim, D.W.; Jang, H.Y.; Kim, K.W.; Shin, Y.; Park, S.H. Design characteristics of studies reporting the performance of artificial intelligence algorithms for diagnostic analysis of medical images: Results from recently published papers. Korean J. Radiol. 2019, 20, 405–410. [Google Scholar] [CrossRef] [PubMed]
- Liu, X.; Faes, L.; Kale, A.U.; Wagner, S.K.; Fu, D.J.; Bruynseels, A.; Mahendiran, T.; Moraes, G.; Shamdas, M.; Kern, C.; et al. A comparison of deep learning performance against health-care professionals in detecting diseases from medical imaging: A systematic review and meta-analysis. Lancet Digit. Heal. 2019, 1, 271–297. [Google Scholar] [CrossRef]
- Park, J.E.; Kim, H.S.; Kim, D.; Park, S.Y.; Kim, J.Y.; Cho, S.J.; Kim, J.H. A systematic review reporting quality of radiomics research in neuro-oncology: Toward clinical utility and quality improvement using high-dimensional imaging features. BMC Cancer 2020, 20, 1–11. [Google Scholar] [CrossRef]
- Park, J.E.; Park, S.Y.; Kim, H.J.; Kim, H.S. Reproducibility and generalizability in radiomics modeling: Possible strategies in radiologic and statistical perspectives. Korean J. Radiol. 2019, 20, 1124–1137. [Google Scholar] [CrossRef]
- Winkel, D.J.; Tong, A.; Lou, B.; Kamen, A.; Comaniciu, D.; Disselhorst, J.A.; Rodríguez-Ruiz, A.; Huisman, H.; Szolar, D.; Shabunin, I.; et al. A Novel Deep Learning Based Computer-Aided Diagnosis System Improves the Accuracy and Efficiency of Radiologists in Reading Biparametric Magnetic Resonance Images of the Prostate. Investig. Radiol. 2021, 1–9. [Google Scholar] [CrossRef]
- ProCancer-I: An AI Platform Integrating Imaging Data and Models, Supporting Precision Care through Prostate Cancer’s Continuum. Available online: https://cordis.europa.eu/project/id/952159 (accessed on 5 May 2021).


| Level | Explanation | Typical Measures |
|---|---|---|
| Level 1t * | Technical efficacy Article demonstrates the technical feasibility of the software. | Reproducibility, inter-software agreement, error rate. |
| Level 1c ** | Potential clinical efficacy Article demonstrates the feasibility of the software to be clinically applied. | Correlation to alternative methods, potential predictive value, biomarker studies. |
| Level 2 | Diagnostic accuracy efficacy Article demonstrates the stand-alone performance of the software. | Standalone sensitivity, specificity, area under the ROC ¶ curve, or Dice score. |
| Level 3 | Diagnostic thinking efficacy Article demonstrates the added value to the diagnosis. | Radiologist performance with/without AI, change in radiological judgement. |
| Level 4 | Therapeutic efficacy Article demonstrates the impact of the software on the patient management decisions. | Effect on treatment or follow-up examinations. |
| Level 5 | Patient outcome efficacy Article demonstrates the impact of the software on patient outcomes. | Effect on quality of life, morbidity, or survival. |
| Level 6 | Societal efficacy Article demonstrates the impact of the software on society by performing an economic analysis. | Effect on costs and quality adjusted life years, incremental costs per quality adjusted life year. |
| Study | Input/Features | Algorithm | MR Sequences | Study Type (n = centers) | Cohort (Patients) | Validation Cohort/Total Cohort | Classification Categories | Ground Truth | AUC | Other Performance | Efficacy Level |
|---|---|---|---|---|---|---|---|---|---|---|---|
| Akamine, 2020 [22] | Quantitative MRI | HC | DWI, DCE | retrospective single center | 52 | N.A. | benign vs. PCa (not reported) | prostatectomy | - | Accuracy 96.3% (PZ) 97.8% (TZ) | 2 |
| Algohary, 2020 [23] | Intensity and texture features | QDA | T2W and ADC | retrospective multi center (4) | 231 | 115/231 | - low versus high risk PCa - low versus intermediate and high risk PCa (D’Amico Classification) | biopsy | 0.87 (low vs. high risk PCa) 0.75 (low vs. intermediate-high risk PCa) | Accuracy (L vs. H) 53% (model) 48% (readers) | 2 |
| Antonelli, 2019 [24] | Quantitative MRI and intensity features | LR and NB | T2W, ADC and DCE | retrospective single center | 164 | 30/164 | cisPCa vs. csPCa (ISUP ≥ 2) | biopsy | 0.83 (PZ) 0.75 (TZ) | Sensitivity at 50% threshold of specificity 88% (model) 82% (readers) | 2 |
| Bleker, 2020 [25] | Intensity and texture features | XGBoost | T2W, DWI, ADC and DCE | retrospective public dataset ¶ | 206 | 71/206 | benign and/or cisPCa vs. csPCa (ISUP ≥ 2) | biopsy | 0.870 [95%CI 0.980–0.754] | 2 | |
| Bonekamp, 2018 [26] | Shape, intensity and texture features | RF | T2W, DWI and ADC | retrospective single center | 316 | 133/316 | benign and/or cisPCa vs. csPCa (ISUP ≥ 2) | biopsy | Lesion based 0.88 | Sensitivity 97% (model) 88% (readers) Specificity 58% (model) 50% (readers) | 2 |
| Brancato, 2021 [27] | Shape, intensity and texture features | LR | T2W, ADC and DCE | retrospective single center | 73 | N.A. | benign versus PCa (ISUP ≥ 1) | biopsy | 0.76 (PI-RADS = 3) 0.89 (upPI-RADS = 4) † | 2 | |
| Chen, 2019 [28] | Shape, intensity, and texture features | RF | T2W and ADC | retrospective single center | 381 | 115/381 | - benign versus PCa (ISUP ≥ 1) - cisPCa vs. csPCa (ISUP ≥ 2) | biopsy | ISUP ≥ 1 0.999 (model) 0.867 (readers) ISUP ≥ 2 0.931 (model) 0.763 (readers) | 2 | |
| Dinh, 2018 [29,30] | Quantitative MRI and intensity features | Exponential model | ADC and DCE | retrospective single center | 129 | 129 * | benign versus PCa (ISUP ≥ 2) | biopsy | 0.95 [95% CI: 0.90–0.98] (CAD) 0.88 [95% CI: 0.68–0.96] (readers) | 2 | |
| Ellmann, 2020 [31] | Quantitative MRI, shape, intensity, and clinical features | XGBoost | T2W, ADC and DCE | retrospective single center | 124 | 24/124 | benign vs. PCa (ISUP ≥ 1) | biopsy | 0.913 (0.772–0.997) | 2 | |
| Hectors, 2019 [32] | Intensity and texture features | LR | T2W, DWI and ADC | Retrospective, single center | 64 | N.A. | low vs. high risk PCa (ISUP ≥ 4) | prostatectomy | 0.72 | 2 | |
| Kan, 2020 [33] | Quantitative MRI, shape, intensity, and clinical features | RF | T2W | retrospective multi center (2) | 346 | 59/346 * | benign vs. PCa (ISUP ≥ 1) | biopsy | Lesion based 0.668 | 2 | |
| Kwon, 2018 [34] | Intensity and texture features | RF | T2W, DWI, ADC and DCE | retrospective public dataset ¶ | 344 | 140/344 | benign and/or cisPCa vs. csPCa (ISUP ≥ 2) | biopsy | 0.82 | 2 | |
| Li, 2018 [35] | Intensity features | SVM | IVIM, ADC, DCE | retrospective single center | 48 | N.A. | cisPCa vs. csPCa (ISUP ≥ 2) | biopsy | 0.91 [95% CI: 0.85–0.95] | 2 | |
| Liu, 2019 [36] | Intensity, texture, and filter features | LR | DCE | retrospective single center | 40 | N.A. | low vs. high risk PCa (ISUP ≥ 3) | biopsy | 0.93 | 2 | |
| Min, 2019 [37] | Shape, intensity, texture, and filter features | LR (features) Linear model (radiomics signature) | T2W, DWI and ADC | Retrospective, single center | 280 | 93/280 | cisPCa vs. csPCa (ISUP ≥ 2) | biopsy | 0.823 [95% CI: 0.67–0.98] | 2 | |
| Orczyk, 2019 [38] | Quantitative MRI and intensity features | LR | T2W, ADC, and DCE | retrospective single center | 20 | N.A. | benign and/or cisPCa vs. csPCa (ISUP ≥ 2) | biopsy | 0.93 [95% CI: 0.82–1.00] | 2 | |
| Qi, 2020 [39] | Shape, intensity, texture, and filter features | RF and Multivariate LR (radiomics and clinical-radiological risk) | T2W, DWI and DCE | retrospective single center | 199 | 66/199 | benign vs. PCa (ISUP ≥ 1) | biopsy | 0.902 [95% CI: 0.884–0.920] (model) 0.933 [95% CI: 0.918–0.948] (model with clinical-radiological variables) | 2 | |
| Toivonen, 2019 [40] | Texture and filter features | LR | T2W, DWI and T2mapping | retrospective single center | 62 | N.A. | cisPCa vs. csPCa (ISUP ≥ 2) | prostatectomy | 0.88 [95% CI: 0.82–0.95] | 2 | |
| Transin, 2019 [29,41] | Quantitative MRI and intensity features | Exponential model | ADC and DCE | retrospective single center | 74 | 74 * | benign and/or cisPCa vs. csPCa (ISUP ≥ 2) | biopsy and or prostatectomy | 0.78 [95% CI: 0.69–0.87] (model) 0.74 [95% CI: 0.62–0.86] (readers) | 2 | |
| Varghese, 2019 [42] | Texture features | Quadratic kernel based SVM | T2W and ADC | retrospective single center | 68 | N.A. | low versus high risk PCa (ISUP ≥ 4) | biopsy | 0.71 [SE 0.01] (model) 0.73 (readers) | 2 | |
| Viswanath, 2019 [43] | Intensity, texture, and filter features | QDA | T2W | retrospective multi center (3) | 85 | 69/85 * | benign vs. PCa (not reported) | prostatectomy | Three sites validation 0.730, 0.686, 0.713 | 2 | |
| Woźnicki, 2020 [44] | Shape, intensity, texture, and clinical features | RF (benign vs malignant) SVM (csPCa vs cisPCa) | T2W and ADC | retrospective single center | 191 | 40/191 | benign vs. PCa (ISUP ≥ 1) cisPCa vs. csPCa (ISUP ≥ 2) | biopsy | ISUP ≥ 1 0.889 [95% CI: 0.751–0.990] (model) 0.779 [95% CI: 0.603–0.922] (readers) ISUP ≥ 2 0.844 [95% CI: 0.6–1.0] (model) 0.668 [95% CI: 0.431–0.889] (readers) | 2 | |
| Wu, 2019 [45] | Shape, intensity, and texture features | LR | T2W and ADC | retrospective single center | 90 | N.A. | benign vs. PCa (ISUP ≥ 2) | prostatectomy | 0.989 [95% CI: 0.9773–1.0000] | 2 | |
| Xu, 2019 [46] | Intensity, texture, filter and clinical features | LR | T2W, DWI, and ADC | retrospective single center | 331 | 99/331 | benign vs. PCa (not reported) | prostatectomy | 0.93 (model) | 4 ** | |
| Zhang, 2020 [47] | Shape, intensity, and texture features | LR | T2W, DWI, and ADC | retrospective multi center (2) | 159 | 83/159 * | cisPCa vs. csPCa (ISUP ≥ 2) | biopsy | 0.84 [95% CI: 0.74–0.94] | 4 ** |
| Study | Input/Features | Algorithm | MR Sequences | Study Type (n = centers) | Cohort (Patients) | Validation Cohort/Total Cohort | Classification Categories | Ground Truth | AUC | Other Performance | Efficacy Level |
|---|---|---|---|---|---|---|---|---|---|---|---|
| Aldoj, 2020 [51] | MR: Spherical VOI lesion | CNN: 3D multi-channel | T2W, DWI, ADC and DCE | retrospective public dataset ¶ | 200 | 25/200 | cisPCa vs. csPCa (ISUP ≥ 2) | biopsy | 0.897 ± 0.008 | 2 | |
| Chen, 2019 [52] | MR: Patch lesion | Transfer Learning (CNN: Inception V3 and VGG-16) | T2W, ADC and DCE | retrospective public dataset ¶ | 346 | 142/346 | benign vs. PCa (not reported) | biopsy | 0.81 (InceptionV3) 0.83 (VGG-16) | 2 | |
| Deniffel, 2020 [53] | MR: VOI prostate | CNN: 3D | T2W, DWI, and ADC | retrospective single center | 499 | 50/499 | benign and/or cisPCa vs. csPCa (ISUP ≥ 2) | biopsy | 0.85 [95% CI: 0.76–0.97] | Sensitivity 100% (calibrated model) 84% (PI-RADS ≥ 4) 95% (PI-RADS = 3 + PSAd) Specificity 52% (calibrated model) 61% (PI-RADS ≥ 4) 35% (PI-RADS = 3 + PSAd) | 4 ** |
| Reda, 2018 [54] | MR: prostate segmentation and PSA | DL (SNCSAE) | DWI | retrospective single center | 18 | N.A. | benign vs. PCa (ISUP ≥ 1) | biopsy | 0.98 [95% CI: 0.79–1] | 2 | |
| Song, 2018 [55] | MR: Patch lesion | Deep CNN | T2W, DWI, and ADC | retrospective public dataset ¶ | 195 | 19/195 | benign vs. PCa (not reported) | biopsy | 0.944 [95% CI: 0.876–0.994] | 4 ** | |
| Takeuchi, 2019 [56] | Intensity features and clinical variables | ANN: 5 hidden layers | T2W and DWI | retrospective single center | 334 | 102/334 | benign vs. PCa (ISUP ≥ 1) | biopsy | 0.76 | 4 ** | |
| Wang, 2020 [57] | MR: Patch lesion | DL MISN (multi-input selec. Network) | T2W, DWI, ADC, and DCE | retrospective public dataset ¶ | 346 | 142/346 | cisPCa vs. csPCa (ISUP ≥ 2) | biopsy | 0.95 | 2 | |
| Yoo, 2019 [58] | MR: Patch prostate | Deep CNN with RF | DWI | retrospective single center | 427 | 108/427 | benign and/or cisPCa vs. csPCa (ISUP ≥ 2) | biopsy | Patient level 0.84 [95% CI: 0.76–0.91] | 2 | |
| Yuan, 2019 [59] | MR: Patch lesion | Transfer learning (CNN: AlexNet) | T2W and ADC | retrospective single center and public dataset ¶ | 221 | 44 (20%)/221 | cisPCa vs. csPCa (ISUP ≥ 2) | biopsy | 0.896 | 2 | |
| Zhong, 2020 [60] | MR: Patch lesion | Transfer learning (CNN: ResNet) | T2W and ADC | retrospective single center | 140 | 30/140 | benign and/or cisPCa vs. csPCa (ISUP ≥ 2) | prostatectomy | 0.726 [95% CI: 0.575, 0.876] (model) 0.711 [95% CI: 0.575–0.847] (readers) | 2 |
| Study | Input/Features | Algorithm | MR Sequences | Study Type (n = centers) | Cohort (Patients) | Validation Cohort/Total Cohort | Ground Truth | AUC per Classification Category | Other Performance | Efficacy Level |
|---|---|---|---|---|---|---|---|---|---|---|
| Abraham, 2019 [62] | MR: Patch lesion | CNN: VGG-16. Ordinal Class Classifier | T2W, DWI and ADC | retrospective single public dataset ¶ | 112 | N.A. | biopsy | ISUP 1 = 0.626 ISUP 2 = 0.535 ISUP 3 = 0.379 ISUP 4 = 0.761 ISUP 5 = 0.847 | Quadratic weighted kappa 0.473 [95% CI: 0.27755–0.66785] | 2 |
| Brunese, 2020 [63] | Shape, intensity and texture features | Deep CNN | TW2 | retrospective multiple public datasets ¶¶, † | 72 | N.A. | biopsy | Accuracy: normal = 0.96 ISUP 1 = 0.98 ISUP 2 = 0.96 ISUP 3 = 0.98 ISUP 4 = 0.97 | 2 | |
| Chaddad, 2018 [64] | Texture features | RF | T2W and ADC | retrospective single public dataset ¶ | 99 | 20 lesions / 40 lesions (per Gleason Group) | biopsy | ISUP 1 ≤ 0.784 ISUP 2 = 0.824 ISUP 3 ≥ 0.647 | 2 | |
| Jensen, 2019 [65] | Texture features | KNN | T2W, DWI, and ADC | retrospective single public dataset ¶ | 99 | 70 lesions / 182 lesions | biopsy | ISUP 1 = 0.87 (PZ), 0.85 (TZ) ISUP 2 = 0.88 (PZ), 0.89 (TZ) ISUP 1 + 2 = 0.96 (PZ), 0.83 (TZ) ISUP 3 = 0.98 (PZ), 0.94 (TZ) ISUP 4 + 5 = 0.91 (PZ), 0.87 (TZ) | 2 |
| Study | Input/Features | Algorithm | MR Sequences | Study Type (n = centers) | Cohort (Patients) | Validation Cohort/Total Cohort | Detection Threshold | Ground Truth | AUC | Other Performance | Efficacy Level |
|---|---|---|---|---|---|---|---|---|---|---|---|
| Alkadi, 2019 [70] | MR image | Deep CNN | T2W | retrospective single public dataset ¶¶ | 19 (2356 slices) | 707 (30%)/2356 slices | PCa (not reported) | biopsy | 0.995 | 2 | |
| Arif, 2020 [71] | MR image | Deep CNN | T2W, DWI and ADC | retrospective single center | 292 | 194/292 | csPCa (ISUP ≥ 2) | biopsy | 0.65 (lesion > 0.03 cc) 0.73 (lesion > 0.1 cc) 0.89 (lesion > 0.5 cc) | 2 | |
| Bagher-Ebadian, 2019 [72] | Texture and filter features | ANN: feed-forward multilayer perceptron | T2W, DWI and ADC | retrospective, single center | 117 | 19/117 * | PCa (not reported) | biopsy | 94% | 2 | |
| Gaur, 2018 [73,74] | Shape, intensity, and texture features | RF | T2W, DWI and ADC | retrospective multi center (9) (5 centers data) | 216 | 216 * | csPCa (ISUP ≥ 2) | biopsy and or prostatectomy | Patient level 0.831 (CADe) 0.819 (readers) | 3 | |
| Gholizadeh, 2020 [75] | Intensity, texture, and filter features | SVM | T2W, DWI, ADC and DTI | retrospective single center | 16 | N.A. | PCa (ISUP ≥ 2) | biopsy | 0.93 ± 0.03 | 2 | |
| Greer, 2018 [74,76] | Shape, intensity, and texture features | RF | T2W, DWI and ADC | retrospective multi center (8) (single center data) | 163 | 163 * | csPCa (ISUP ≥ 2) | prostatectomy | PI-RADS ≥ 3 0.849 [95% CI: 79.0–89.5] (CADe) 0.882 [95% CI: 83.4–92.1] (readers) | 3 | |
| Ishioka, 2018 [77] | MR image | CNN: Unet with ResNet50 | T2W | retrospective single center | 335 | 34/335 | PCa (ISUP ≥ 1) | biopsy | Two validation 0.645, 0.636 | 2 | |
| Khalvati, 2018 [78] | Shape, intensity, and texture features | SVM | T2W, DWI, ADC, CDI | retrospective single center | 30 | N.A. | PCa (ISUP ≥ 1) | biopsy | Accuracy 86% | 2 | |
| Lee, 2019 [79] | MR image | CNN: UconvGRU (2D image slices) | T2W, ADC and DCE | prospective single center (retrospective reading) | 16 | N.A. | csPCa (ISUP ≥ 2) | prostatectomy | F1 score: 0.5323 | 2 | |
| McGarry, 2020 [80,81] | Intensity features | Partial least-squares regression models | T2W, delta T1, DWI and ADC | retrospective single center | 48 | 20/48 | csPCa (ISUP ≥ 2) | prostatectomy | 0.8 [95% CI: 0.66–0.90] | 2 | |
| Mehralivand, 2020 [73,82] | Shape, intensity, and texture features | RF | T2W, DWI and ADC | retrospective multi center (5) | 236 | 236 * | csPCa (ISUP ≥ 2) | biopsy and or prostatectomy | Lesion level 0.775 (CADe) 0.749 (readers) | 3 | |
| Sanyal, 2020 [83] | MR image | CNN: U-net | T2W, DWI and ADC | retrospective single center | 77 | 20/77 | csPCa (ISUP ≥ 2) | biopsy | 0.86 (ISUP ≥ 2) 0.88 (ISUP = 1) | 2 | |
| Schelb, 2021 [84,85] | MR image | CNN: U-net | T2W, DWI and ADC | retrospective, single center | 259 | 259 * | csPCa (ISUP ≥ 2) | biopsy | Sensitivity (PI-RADS ≥ 3, PI-RADS ≥ 4) 99%, 83% (model) 98%. 84% (readers) Specificity (PI-RADS ≥ 3, PI-RADS ≥ 4) 24%, 55% (model) 17%, 58% (readers) | 2 | |
| Sumathipala, 2018 [86] | MR image | Deep CNN: Holistically Nested Edge Detector | T2W, DWI and ADC | retrospective multi center (6) | 186 | 47/186 | PCa (not reported) | biopsy and or prostatectomy | 0.97 ± 0.01 | 2 | |
| Wang, 2018 [87] | MR image | CNN: dual-path multimodal | T2W, ADC | retrospective single center and public dataset ¶ | 360 | N.A. | csPCa (ISUP ≥ 2) | biopsy | 0.979 ± 0.009 | 2 | |
| Xu, 2019 [88] | MR image | CNN: ResNets | T2W, DWI and ADC | retrospective single public dataset ¶ | 346 | 103/346 | csPCa (ISUP ≥ 2) | biopsy | 0.97 | 2 | |
| Zhu, 2020 [89,90] | Intensity and texture features | ANN | T2W, DWI and ADC | retrospective, single center | 153 | 153 * | csPCa (ISUP ≥ 2) | biopsy | 0.89 [95% CI: 0.83–0.94] (CADe) 0.83 [95% CI: 0.76–0.88] (readers) | 3 |
| Study | Input/Features | Algorithm | MR Sequences | Study Type (n = centers) | Cohort (Patients) | Validation Cohort/Total Cohort | Ground Truth | AUC per Detection Category | Other Performance | Efficacy Level |
|---|---|---|---|---|---|---|---|---|---|---|
| Cao, 2019 [92] | MR images | CNN: FocalNet (multi-class) | T2W, ADC | retrospective single center | 417 | N.A. | prostatectomy | ISUP 2 ≥ 0.81 ± 0.01 ISUP 3 ≥ 0.79 ± 0.01 ISUP 4 ≥ 0.67 ± 0.04 ISUP 5 ≥ 0.57 ± 0.02 | 2 | |
| Vente, 2021 [93] | MR images and zonal masks | CNN: 2D U-Net | T2W, ADC | retrospective public dataset ¶ | 162 | 63/162 | biopsy | Quadratic weighted kappa 0.13 ± 0.27 | 2 | |
| Winkel, 2020 [94] | MR images | Deep CNN: multi network | T2W, DWI and ADC | prospective single center (retrospective reading) | 48 | 48 * | biopsy | weighted kappa (CADe with PI-RADS classification) 0.42 Lesion level Sensitivity PI-RADS 5 = 100% PI-RADS 4 = 73% PI-RADS 3 = 43% | 2 |
| Company | Product | Key (AI) Features | Market Date | FDA | CE |
|---|---|---|---|---|---|
| Cortechs.ai | OnQ Prostate (previously RSI-MRI+) | prostate segmentation, enhanced DWI map | 11–2019 | 510(k) cleared, Class II | |
| GE Medical Systems | PROView | prostate segmentation and volumetry, AI supported lesion segmentation, workflow optimization | 11–2020 | 510(k) cleared, Class II | |
| JLK Inc. | JPC-01K | image level probability for cancer presence, heatmap/contour of malignancy location | 04–2019 | Class I | |
| Quantib | Quantib Prostate | prostate segmentation and volumetry, AI supported lesion segmentation, workflow optimization | 10–2020 | 510(k) cleared, Class II | Class IIb |
| Quibim | qp-Prostate | (regional) prostate segmentation and volumetry, workflow optimization | 02–2021 | 510(k) cleared, Class II | |
| Siemens Healthineers | Prostate MR | prostate segmentation and volumetry, lesion detection and classification, workflow optimization | 05–2020 | 510(k) cleared, Class II | Class IIa |
Publisher’s Note: MDPI stays neutral with regard to jurisdictional claims in published maps and institutional affiliations. |
© 2021 by the authors. Licensee MDPI, Basel, Switzerland. This article is an open access article distributed under the terms and conditions of the Creative Commons Attribution (CC BY) license (https://creativecommons.org/licenses/by/4.0/).
Share and Cite
Twilt, J.J.; van Leeuwen, K.G.; Huisman, H.J.; Fütterer, J.J.; de Rooij, M. Artificial Intelligence Based Algorithms for Prostate Cancer Classification and Detection on Magnetic Resonance Imaging: A Narrative Review. Diagnostics 2021, 11, 959. https://doi.org/10.3390/diagnostics11060959
Twilt JJ, van Leeuwen KG, Huisman HJ, Fütterer JJ, de Rooij M. Artificial Intelligence Based Algorithms for Prostate Cancer Classification and Detection on Magnetic Resonance Imaging: A Narrative Review. Diagnostics. 2021; 11(6):959. https://doi.org/10.3390/diagnostics11060959
Chicago/Turabian StyleTwilt, Jasper J., Kicky G. van Leeuwen, Henkjan J. Huisman, Jurgen J. Fütterer, and Maarten de Rooij. 2021. "Artificial Intelligence Based Algorithms for Prostate Cancer Classification and Detection on Magnetic Resonance Imaging: A Narrative Review" Diagnostics 11, no. 6: 959. https://doi.org/10.3390/diagnostics11060959
APA StyleTwilt, J. J., van Leeuwen, K. G., Huisman, H. J., Fütterer, J. J., & de Rooij, M. (2021). Artificial Intelligence Based Algorithms for Prostate Cancer Classification and Detection on Magnetic Resonance Imaging: A Narrative Review. Diagnostics, 11(6), 959. https://doi.org/10.3390/diagnostics11060959