
Evaluation of a Clinical Index as a Predictive Tool for Primary Ciliary Dyskinesia

 , , , , , and
Abstract
1. Introduction
2. Materials and Methods
2.1. Ethics
2.2. Study Population
2.3. Clinical Data
2.4. Statistical Analysis
3. Results
4. Discussion
5. Conclusions
Author Contributions
Funding
Institutional Review Board Statement
Informed Consent Statement
Acknowledgments
Conflicts of Interest
References
- Wallmeier, J.; Nielsen, K.G.; Kuehni, C.E.; Lucas, J.S.; Leigh, M.W.; Zariwala, M.A.; Omran, H. Motile ciliopathies. Nat. Rev. Dis. Primers. 2020, 6, 77–106. [Google Scholar] [CrossRef] [PubMed]
- Armengot-Carceller, M.; Reula, A.; Mata-Roig, M.; Pérez-Panadés, J.; Milian-Medina, L.; Carda-Batalla, C. Understanding Primary Ciliary Dyskinesia: Experience From a Mediterranean Diagnostic Reference Centre. J. Clin. Med. 2020, 9, 810. [Google Scholar] [CrossRef] [PubMed]
- Shoemark, A.; Rubbo, B.; Legendre, M.; Fassad, M.R.; Haarman, E.G.; Best, S.; Bon, I.C.M.; Brandsma, J.; Burgel, P.R.; Carlsson, G.; et al. Topological data analysis reveals genotype-phenotype relationships in primary ciliary dyskinesia. Eur. Respir. J. 2021, 57, 2002359. [Google Scholar] [CrossRef] [PubMed]
- Kuehni, C.E.; Frischer, T.; Strippoli, M.P.; Maurer, E.; Bush, A.; Nielsen, K.G.; Escribano, A.; Lucas, J.S.; Yiallouros, P.; Omran, H.; et al. ERS Task Force on Primary Ciliary Dyskinesia in Children. Factors influencing age at diagnosis of primary ciliary dyskinesia in European children. Eur. Respir. J. 2010, 36, 1248–1258. [Google Scholar] [CrossRef] [PubMed]
- Shoemark, A.; Dell, S.; Shapiro, A.; Lucas, J.S. ERS and ATS diagnostic guidelines for primary ciliary dyskinesia: Similarities and differences in approach to diagnosis. Eur. Respir. J. 2019, 54, 1901066. [Google Scholar] [CrossRef] [PubMed]
- Shoemark, A.; Rubbo, B.; Haarman, E.; Hirst, R.A.; Hogg, C.; Jackson, C.L.; Nielsen, K.G.; Papon, J.F.; Robinson, P.; Walker, W.T.; et al. The Controversies and Difficulties of Diagnosing Primary Ciliary Dyskinesia. Am. J. Respir. Crit. Care. Med. 2020, 201, 120–122. [Google Scholar] [CrossRef] [PubMed]
- Halbeisen, F.S.; Shoemark, A.; Barbato, A.; Boon, M.; Carr, S.; Crowley, S.; Hirst, R.; Karadag, B.; Koerner-Rettberg, C.; Loebinger, M.R.; et al. Time trends in diagnostic testing for primary ciliary dyskinesia in Europe. Eur. Respir. J. 2019, 54, 1900528. [Google Scholar] [CrossRef]
- Lucas, J.S.; Barbato, A.; Collins, S.A.; Goutaki, M.; Behan, L.; Caudri, D.; Dell, S.; Eber, E.; Escudier, E.; Hirst, R.A.; et al. European Respiratory Society guidelines for the diagnosis of primary ciliary dyskinesia. Eur. Respir. J. 2017, 49, 1601090. [Google Scholar] [CrossRef]
- Djakow, J.; Rozehnalova, E.; Havlisova, M.; Svobodova, T.; Pohunek, P. Clinical index to evaluate the risk of primary ciliary diskinesia in children. Eur. Respir. J. 2012, 40 (Suppl. 56), 2844. [Google Scholar]
- Djakow, J. Aspects of Identification of Patients with Primary Ciliary Dyskinesia’. Ph.D. Thesis, Charles University in Prague, Prague, Czech Republic, 2015. [Google Scholar]
- Behan, L.; Dimitrov, B.D.; Kuehni, C.E.; Hogg, C.; Carroll, M.; Evans, H.J.; Goutaki, M.; Harris, A.; Packham, S.; Walker, W.T.; et al. PICADAR: A diagnostic predictive tool for primary ciliary dyskinesia. Eur. Respir. J. 2016, 47, 1103–1112. [Google Scholar] [CrossRef]
- Leigh, M.W.; Ferkol, T.W.; Davis, S.D.; Lee, H.S.; Rosenfeld, M.; Dell, S.D.; Sagel, S.D.; Milla, C.; Olivier, K.N.; Sullivan, K.M.; et al. Clinical Features and Associated Likelihood of Primary Ciliary Dyskinesia in Children and Adolescents. Ann. Am. Thorac. Soc. 2016, 13, 1305–1313. [Google Scholar] [CrossRef]
- Palmas, K.; Shanthikumar, S.; Robinson, P. Assessment of primary ciliary dyskinesia predictive tools. Eur. Respir. J. 2020, 56, 2001169. [Google Scholar] [CrossRef]
- American Thoracic Society; European Respiratory Society. ATS/ERS recommendations for standardized procedures for the online and offline measurement of exhaled lower respiratory nitric oxide and nasal nitric oxide, 2005. Am. J. Respir Crit Care Med. 2005, 171, 912–930. [Google Scholar] [CrossRef]
- Chilvers, M.A.; O’Callaghan, C. Analysis of ciliary beat pattern and beat frequency using digital high speed imaging: Comparison with the photomultiplier and photodiode methods. Thorax 2000, 55, 314–317. [Google Scholar] [CrossRef] [PubMed]
- Rubbo, B.; Shoemark, A.; Jackson, C.L.; Hirst, R.; Thompson, J.; Hayes, J.; Frost, E.; Copeland, F.; Hogg, C.; O’Callaghan, C.; et al. National PCD Service, UK. Accuracy of High-Speed Video Analysis to Diagnose Primary Ciliary Dyskinesia. Chest 2019, 155, 1008–1017. [Google Scholar] [CrossRef] [PubMed]
- Rutland, J.; Dewar, A.; Cox, T.; Cole, P. Nasal brushing for the study of ciliary ultrastructure. J. Clin. Pathol. 1982, 35, 357–359. [Google Scholar] [CrossRef]
- Gil, H.I.; Lee, T.; Jeong, B.H.; Lee, H.; Choe, J.; Ahn, K.; Hong, S.D.; Jeon, K.; Koh, W.J.; Kim, J.S.; et al. Additional role of bronchial mucosal biopsy for ciliary structural abnormality in diagnosis of primary ciliary dyskinesia. J. Thorac. Dis. 2019, 11, 839–847. [Google Scholar] [CrossRef] [PubMed]
- Shoemark, A.; Boon, M.; Brochhausen, C.; Bukowy-Bieryllo, Z.; De Santi, M.M.; Goggin, P.; Griffin, P.; Hegele, R.G.; Hirst, R.A.; Leigh, M.W.; et al. International consensus guideline for reporting transmission electron microscopy results in the diagnosis of primary ciliary dyskinesia (BEAT PCD TEM Criteria). Eur. Respir. J. 2020, 55, 1900725. [Google Scholar] [CrossRef]
- Martinů, V.; Dvorakova, P.; Uhlik, J.; Varenyiova, Z.; Borek-Dohalska, L.; Pohunek, P. Kdy pomýšlet na řasinkové dysfunkce? Čes-Slov. Pediat. 2020, 75, 401–409. [Google Scholar]
- Lucas, J.S.; Davis, S.D.; Omran, H.; Shoemark, A. Primary ciliary dyskinesia in the genomics age. Lancet Respir. Med. 2020, 8, 202–216. [Google Scholar] [CrossRef]
- Goutaki, M.; Halbeisen, F.S.; Barbato, A.; Crowley, S.; Harris, A.; Hirst, R.A.; Karadag, B.; Martinu, V.; Morgan, L.; O’Callaghan, C.; et al. Late Diagnosis of Infants with PCD and Neonatal Respiratory Distress. J. Clin. Med. 2020, 9, 2871. [Google Scholar] [CrossRef] [PubMed]
- Shapiro, A.J.; Dell, S.D.; Gaston, B.; O’Connor, M.; Marozkina, N.; Manion, M.; Hazucha, M.J.; Leigh, M.W. Nasal Nitric Oxide Measurement in Primary Ciliary Dyskinesia. A Technical Paper on Standardized Testing Protocols. Ann. Am. Thorac. Soc. 2020, 17, e1–e12. [Google Scholar] [CrossRef] [PubMed]
- Rademacher, J.; Buck, A.; Schwerk, N.; Price, M.; Fuge, J.; Welte, T.; Ringshausen, F.C. Nasal Nitric Oxide Measurement and a Modified PICADAR Score for the Screening of Primary Ciliary Dyskinesia in Adults with Bronchiectasis. Pneumologie 2017, 71, 543–548. [Google Scholar] [CrossRef] [PubMed]


| Clinical Index 7-Item Questionnaire (Each YES = 1 Point) | |
| Did the child manifest with significant respiratory difficulties with breathing after birth? | |
| Did the child have rhinitis or excessive mucus production in the first 2 months of life? | |
| Did the child suffer from pneumonia? | |
| Did the child present with 3 or more episodes of bronchitis? | |
| Was the child treated for chronic secretoric otitis or suffered from >3 episodes of acute otitis? | |
| Does the child have a year-round nasal discharge or nasal obstruction? | |
| Was the child treated with antibiotics for acute upper respiratory tract infection >3 times? | |
| Overall score and risk | Proposed management |
| 0–1 point very low risk | PCD not suspected, focus on different causes of patient’s clinical symptoms, re-evaluate Clinical Index once a year. Refer the patient for PCD screening only if suspicion continues and other diagnoses were excluded |
| 2 points low risk | |
| 3 points medium risk | Exclude other causes of clinical symptoms and refer the patient for PCD screening. |
| 4 points high risk | |
| 5 + points very high risk | Probability of PCD is very high. Always refer the patient for HSVM. |
| CI | PICADAR | NA-CDCF | |
|---|---|---|---|
| Pre-term vs. full term | − | + | − |
| Neonatal respiratory symptoms | + | + | − |
| Unexplained neonatal respiratory distress | − | − | + |
| Admission to a neonatal intensive care unit | − | + | − |
| Early-onset year-round wet cough | − | + | + |
| Rhinitis or nasal congestion in the first 2 months of life | + | − | + |
| Pneumonia in childhood | + | − | − |
| 3 or more bronchitis episodes in childhood | + | − | − |
| Laterality defect | − | + | + |
| Congenital heart defect | − | + | − |
| Antibiotic therapy for rhinosinusitis > 3 times | + | − | − |
| Persistent year-round rhinitis | + | + | + |
| Chronic ear or hearing symptoms | + | + | − |
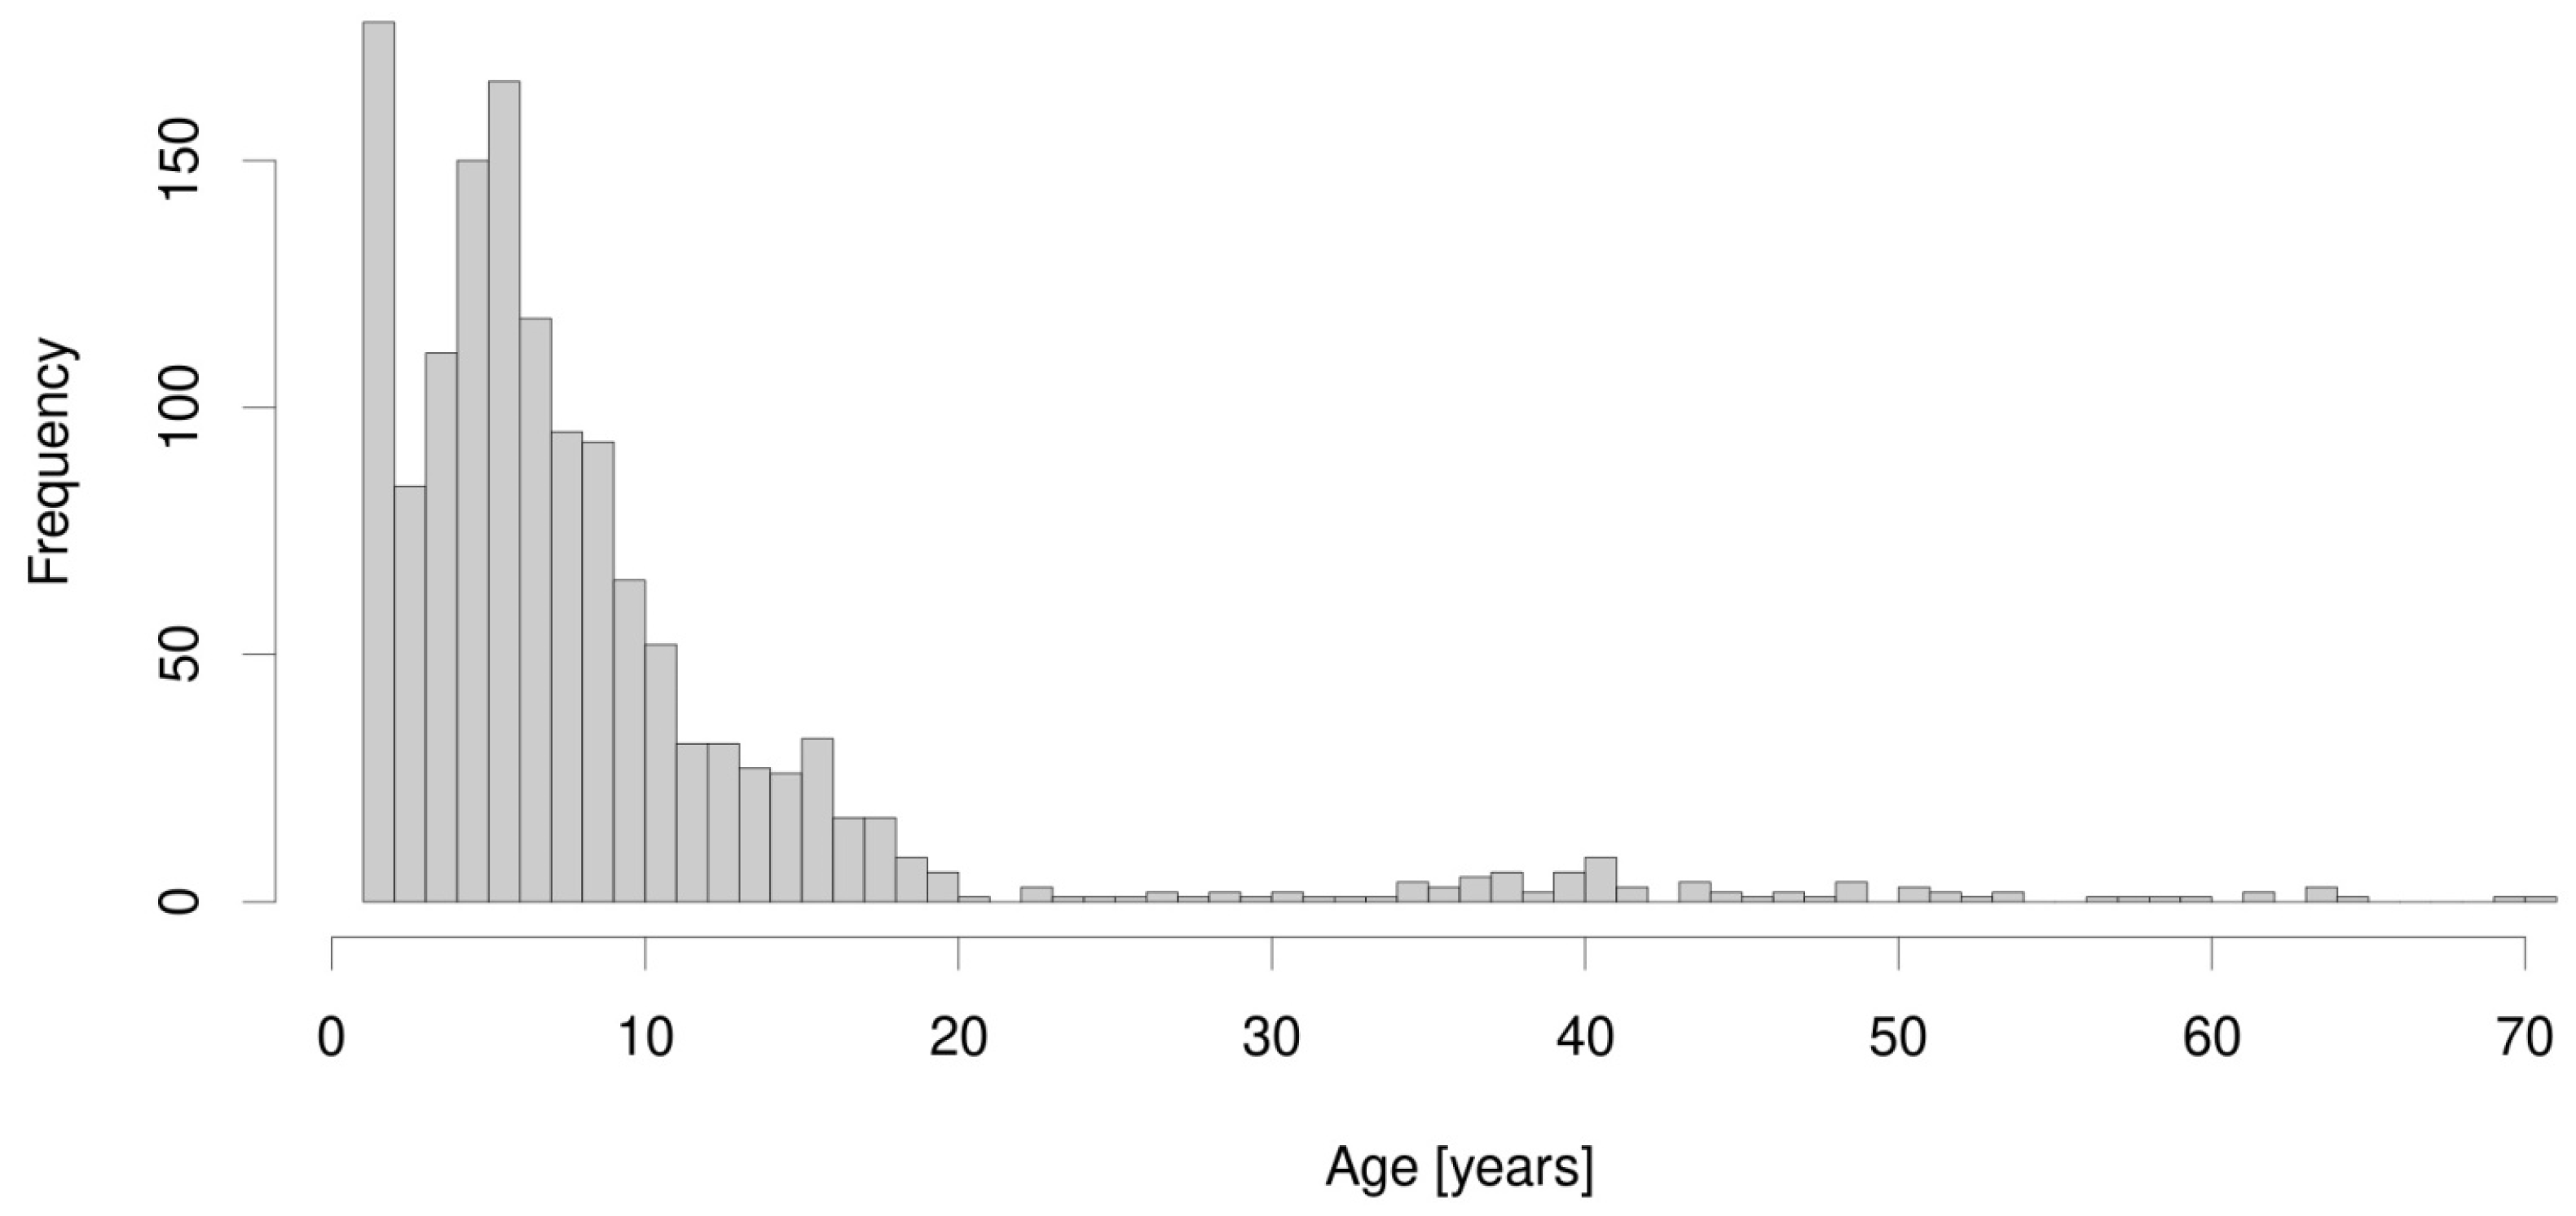
| Median age at diagnosis (IQR) | 6.1 (3.8; 9.8) | ||
| Gender (% of males) | 34 (50.74%) | ||
| Height (z-score) | −0.03 ± 1.27 | ||
| Weight (z-score) | 0.16 ± 1.60 | ||
| BMI (z-score) | 0.07 ± 1.75 | ||
| FEV1 * | −2.10 ± 1.81 | ||
| FVC * | −1.99 ± 2.28 | ||
| FEV1/FVC * | −0.49 ± 1.40 | ||
| MEF25 * | −1.28 ± 1.55 | ||
| MMEF 25–75 * | −1.68 ± 1.20 | ||
| Laterality defects | 26 (38.80%) | ||
| TEM finding | Gene defect | ||
| ODA | 23 (34.32%) | DNAH5 | 13 19.4%) |
| DNAI1 | 2 (2.98%) | ||
| CCDC151 | 1 (1.49%) | ||
| other | 7 (10.44%) | ||
| ODA + IDA | 21 (31.34%) | SPAG1 | 12 (17.91%) |
| PIH1D3 | 1 (1.49%) | ||
| DNAAF3 | 1 (1.49%) | ||
| other | 7 (10.44%) | ||
| MD + IDA | 6 (8.95%) | CCDC39 | 3 (4.47%) |
| CCDC40 | 1 (1.49%) | ||
| other | 2 (2.98%) | ||
| CP/TD | 4 (5.97%) | RSPH4A | 1 (1.49%) |
| HYDIN | 1 (1.49%) | ||
| other | 2 (2.98%) | ||
| Normal | 13 (19.4%) | DNAH11 | 3 (4.47%) |
| HYDIN | 1 (1.49%) | ||
| DRC1 | 1 (1.49%) | ||
| other | 8 (11.94%) | ||
| Predictive Tool | AUC | LCL | UCL | Optimal Threshold | Specificity | Sensitivity | NPV | PPV |
|---|---|---|---|---|---|---|---|---|
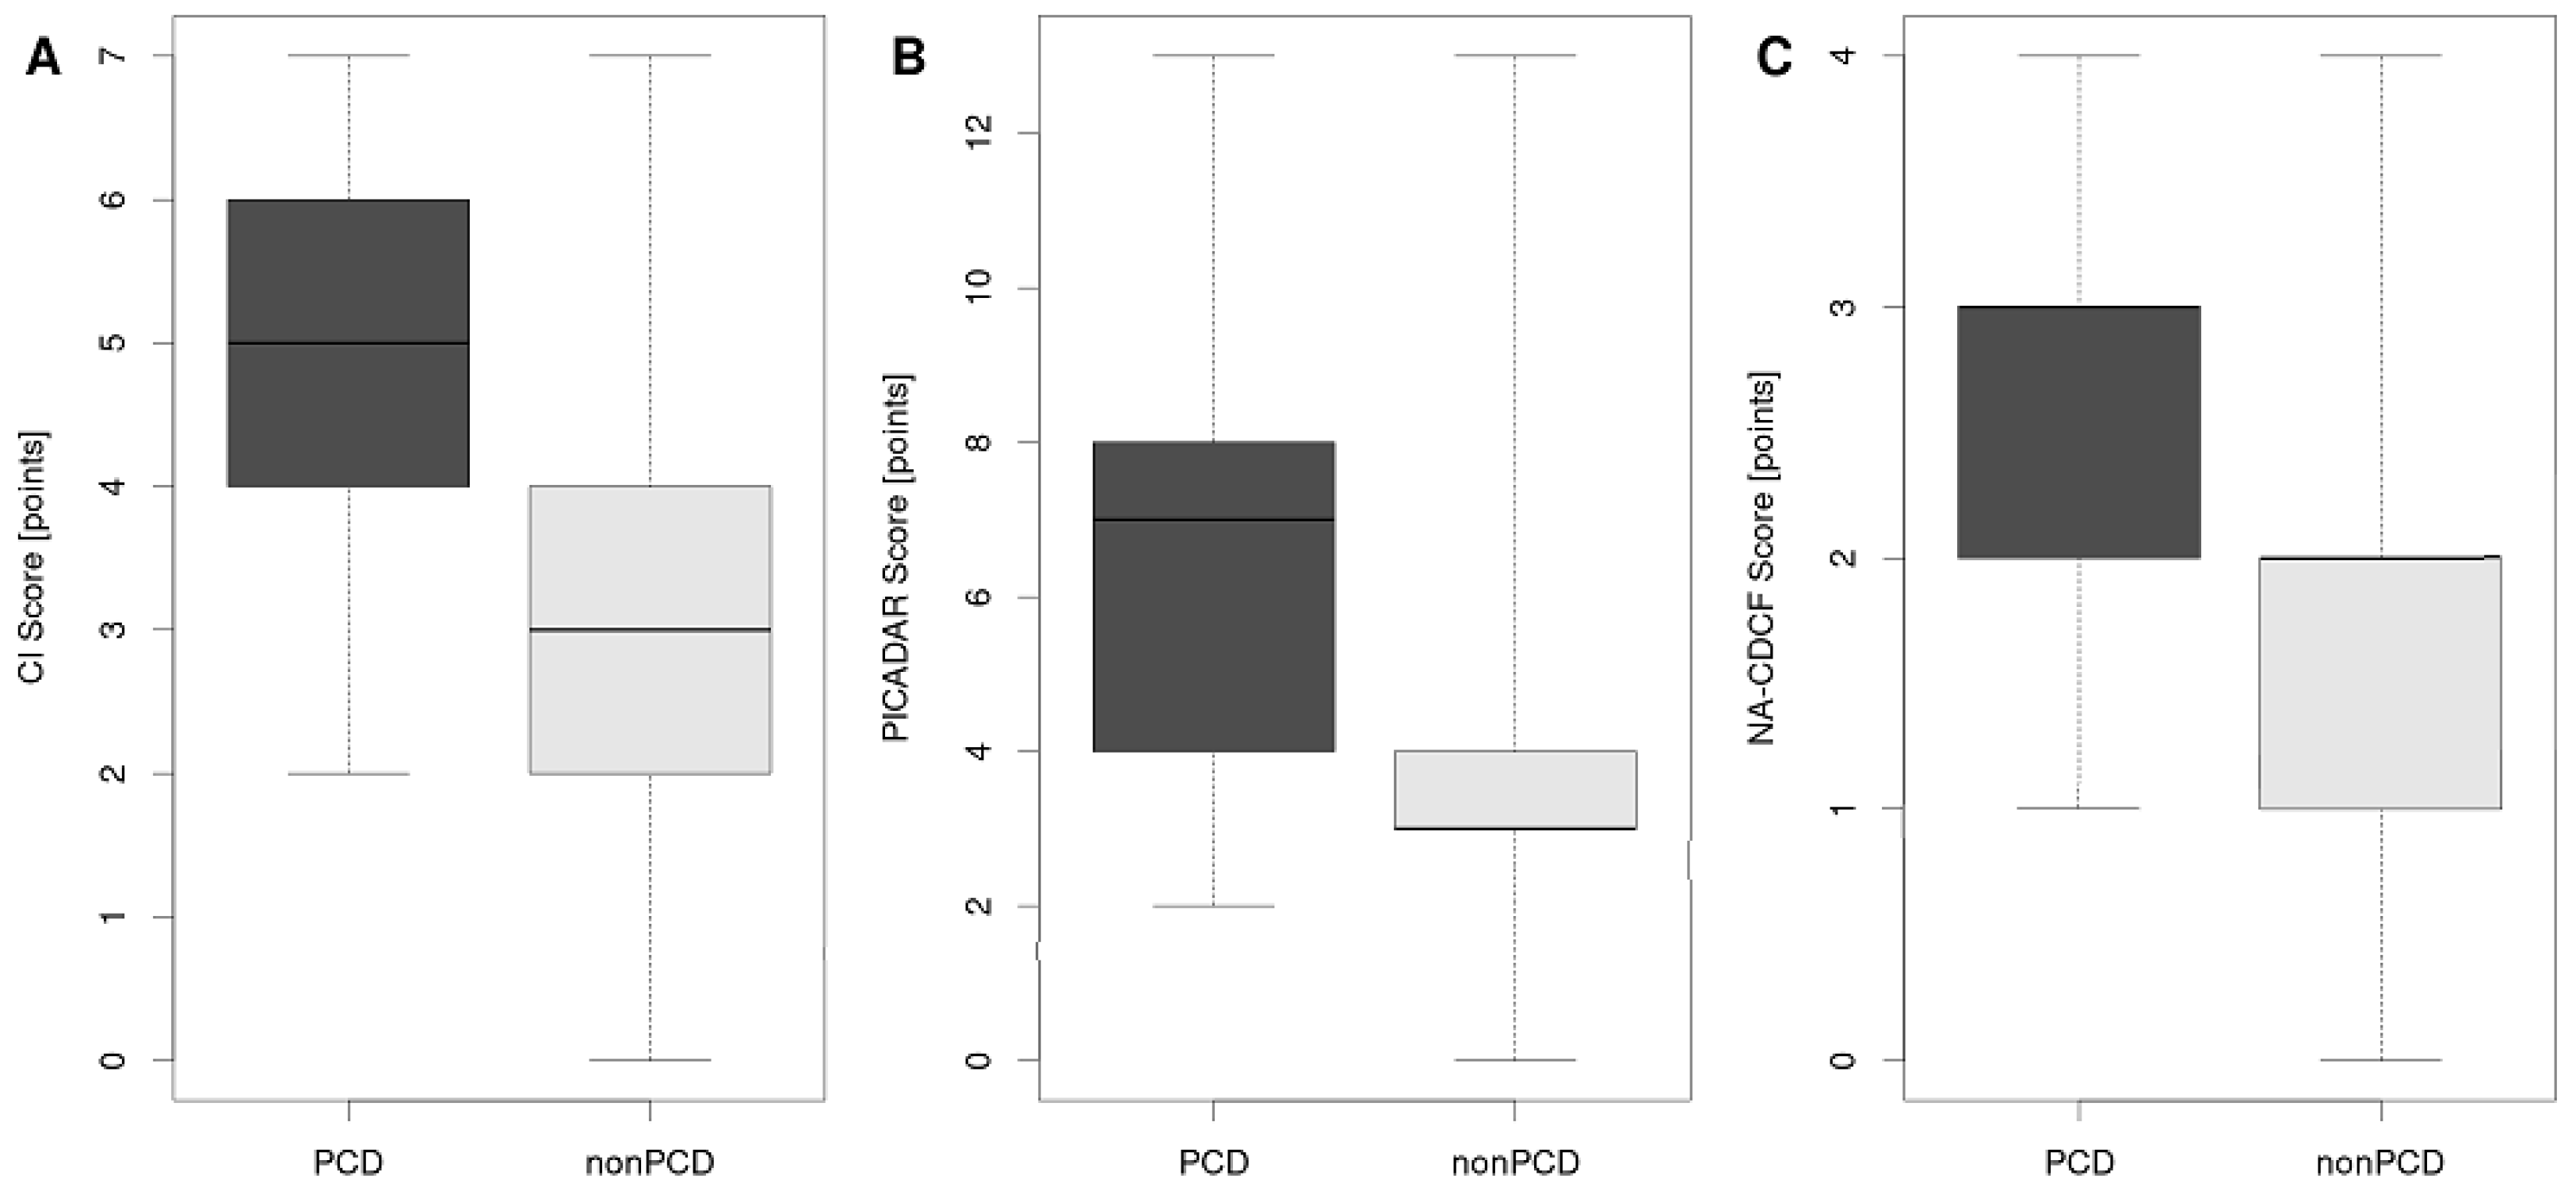
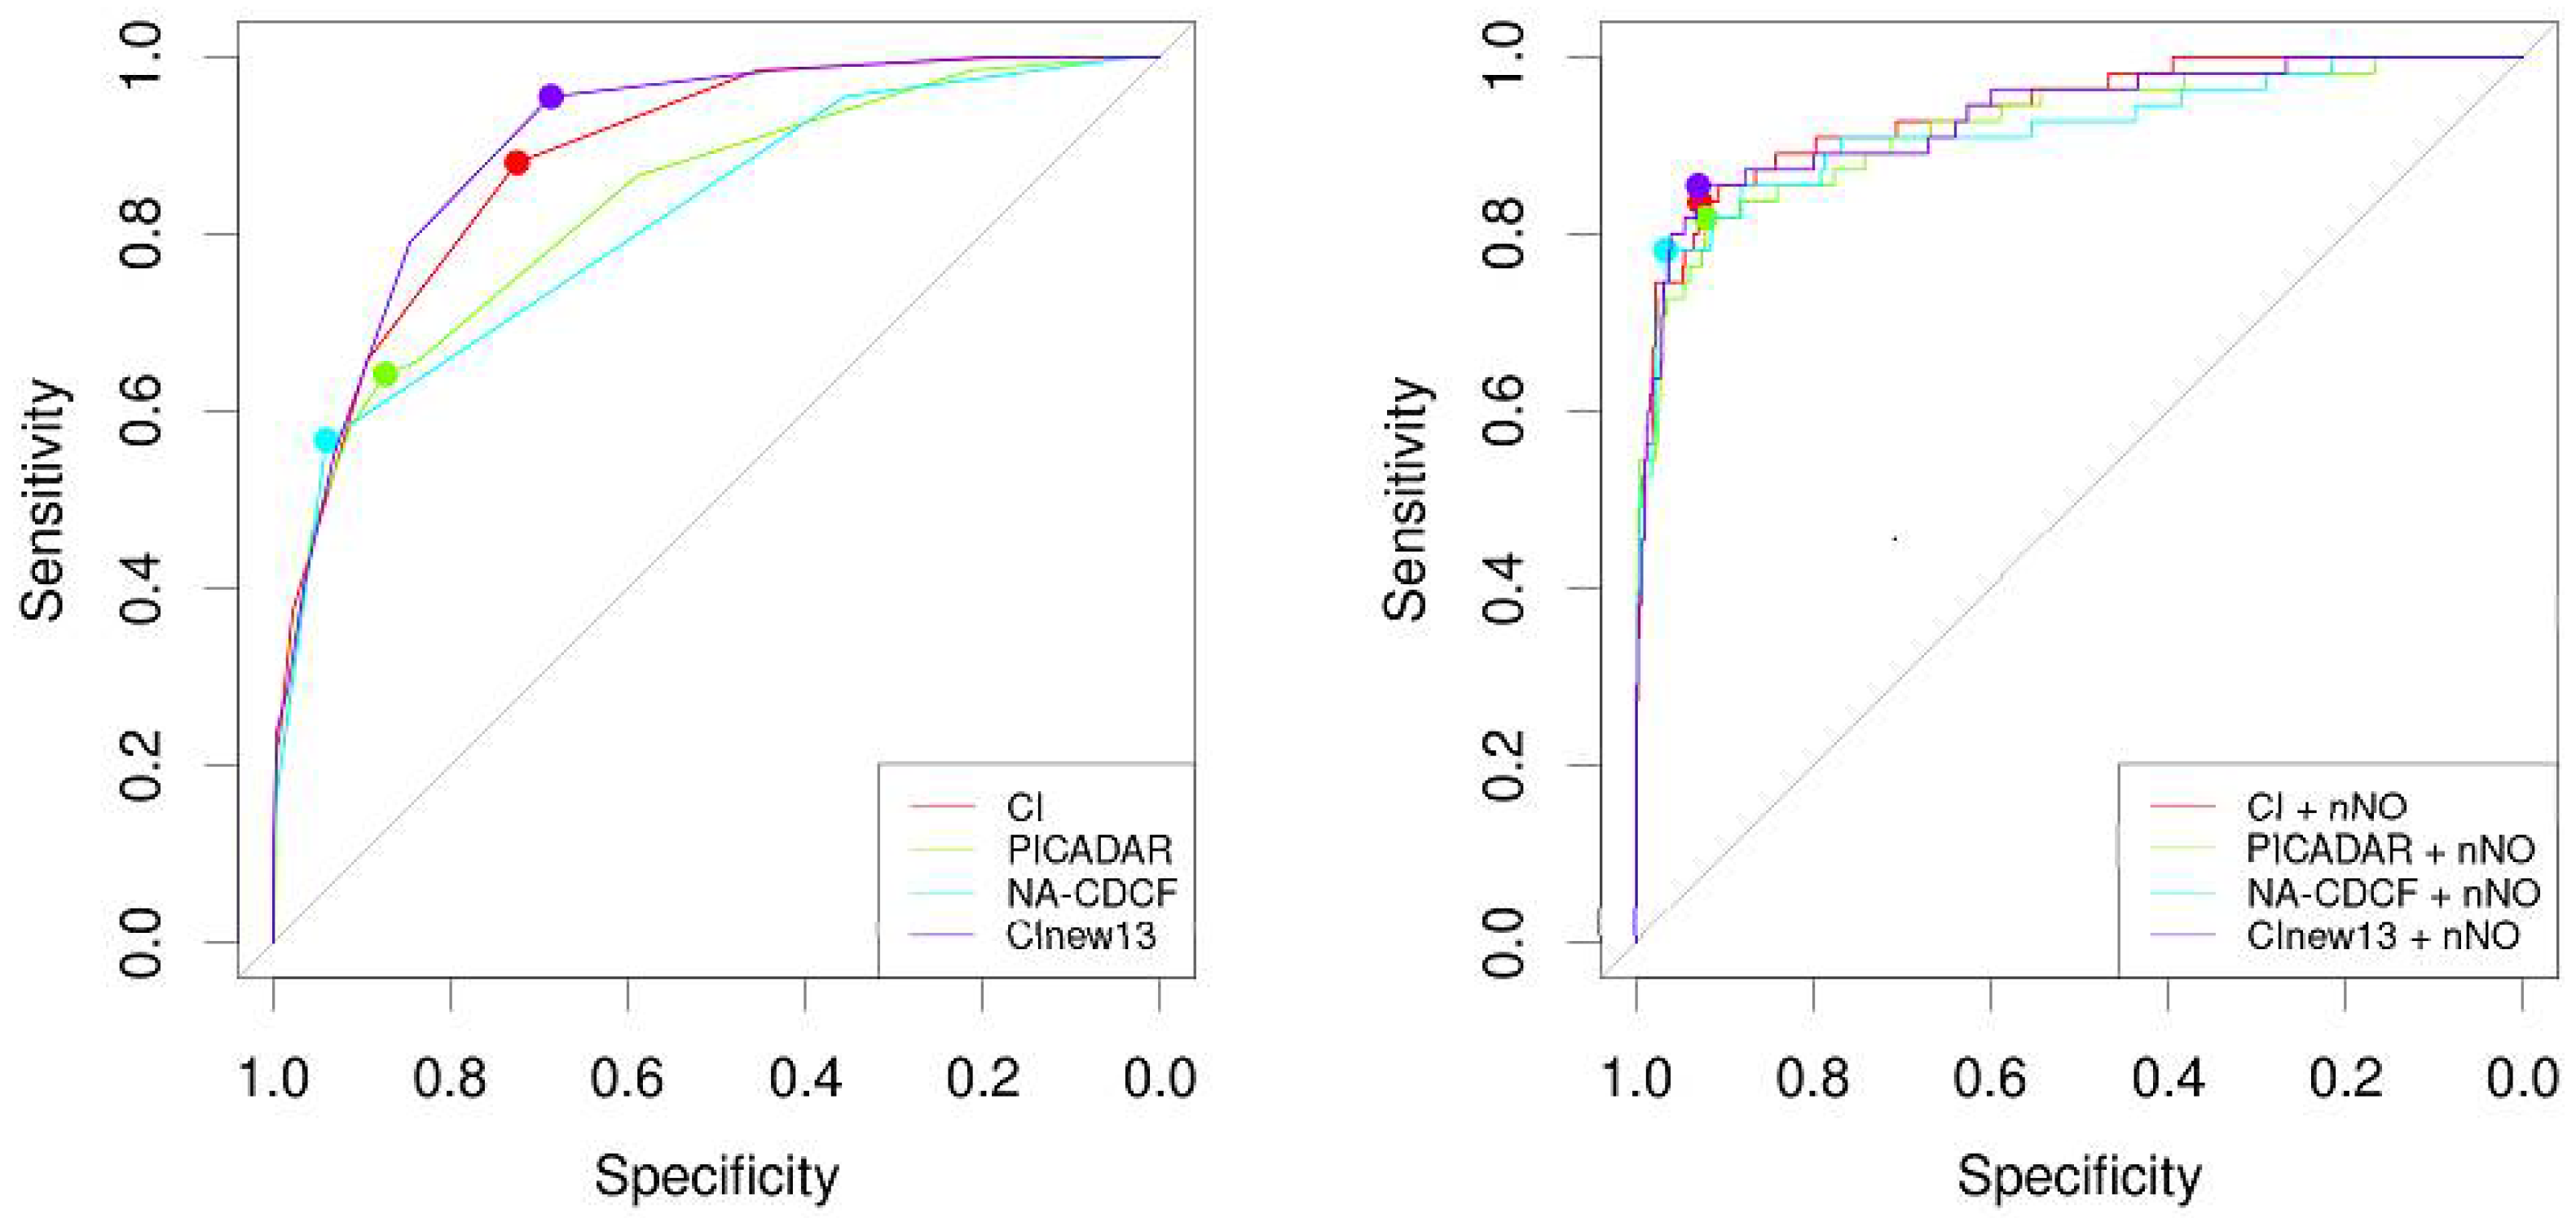
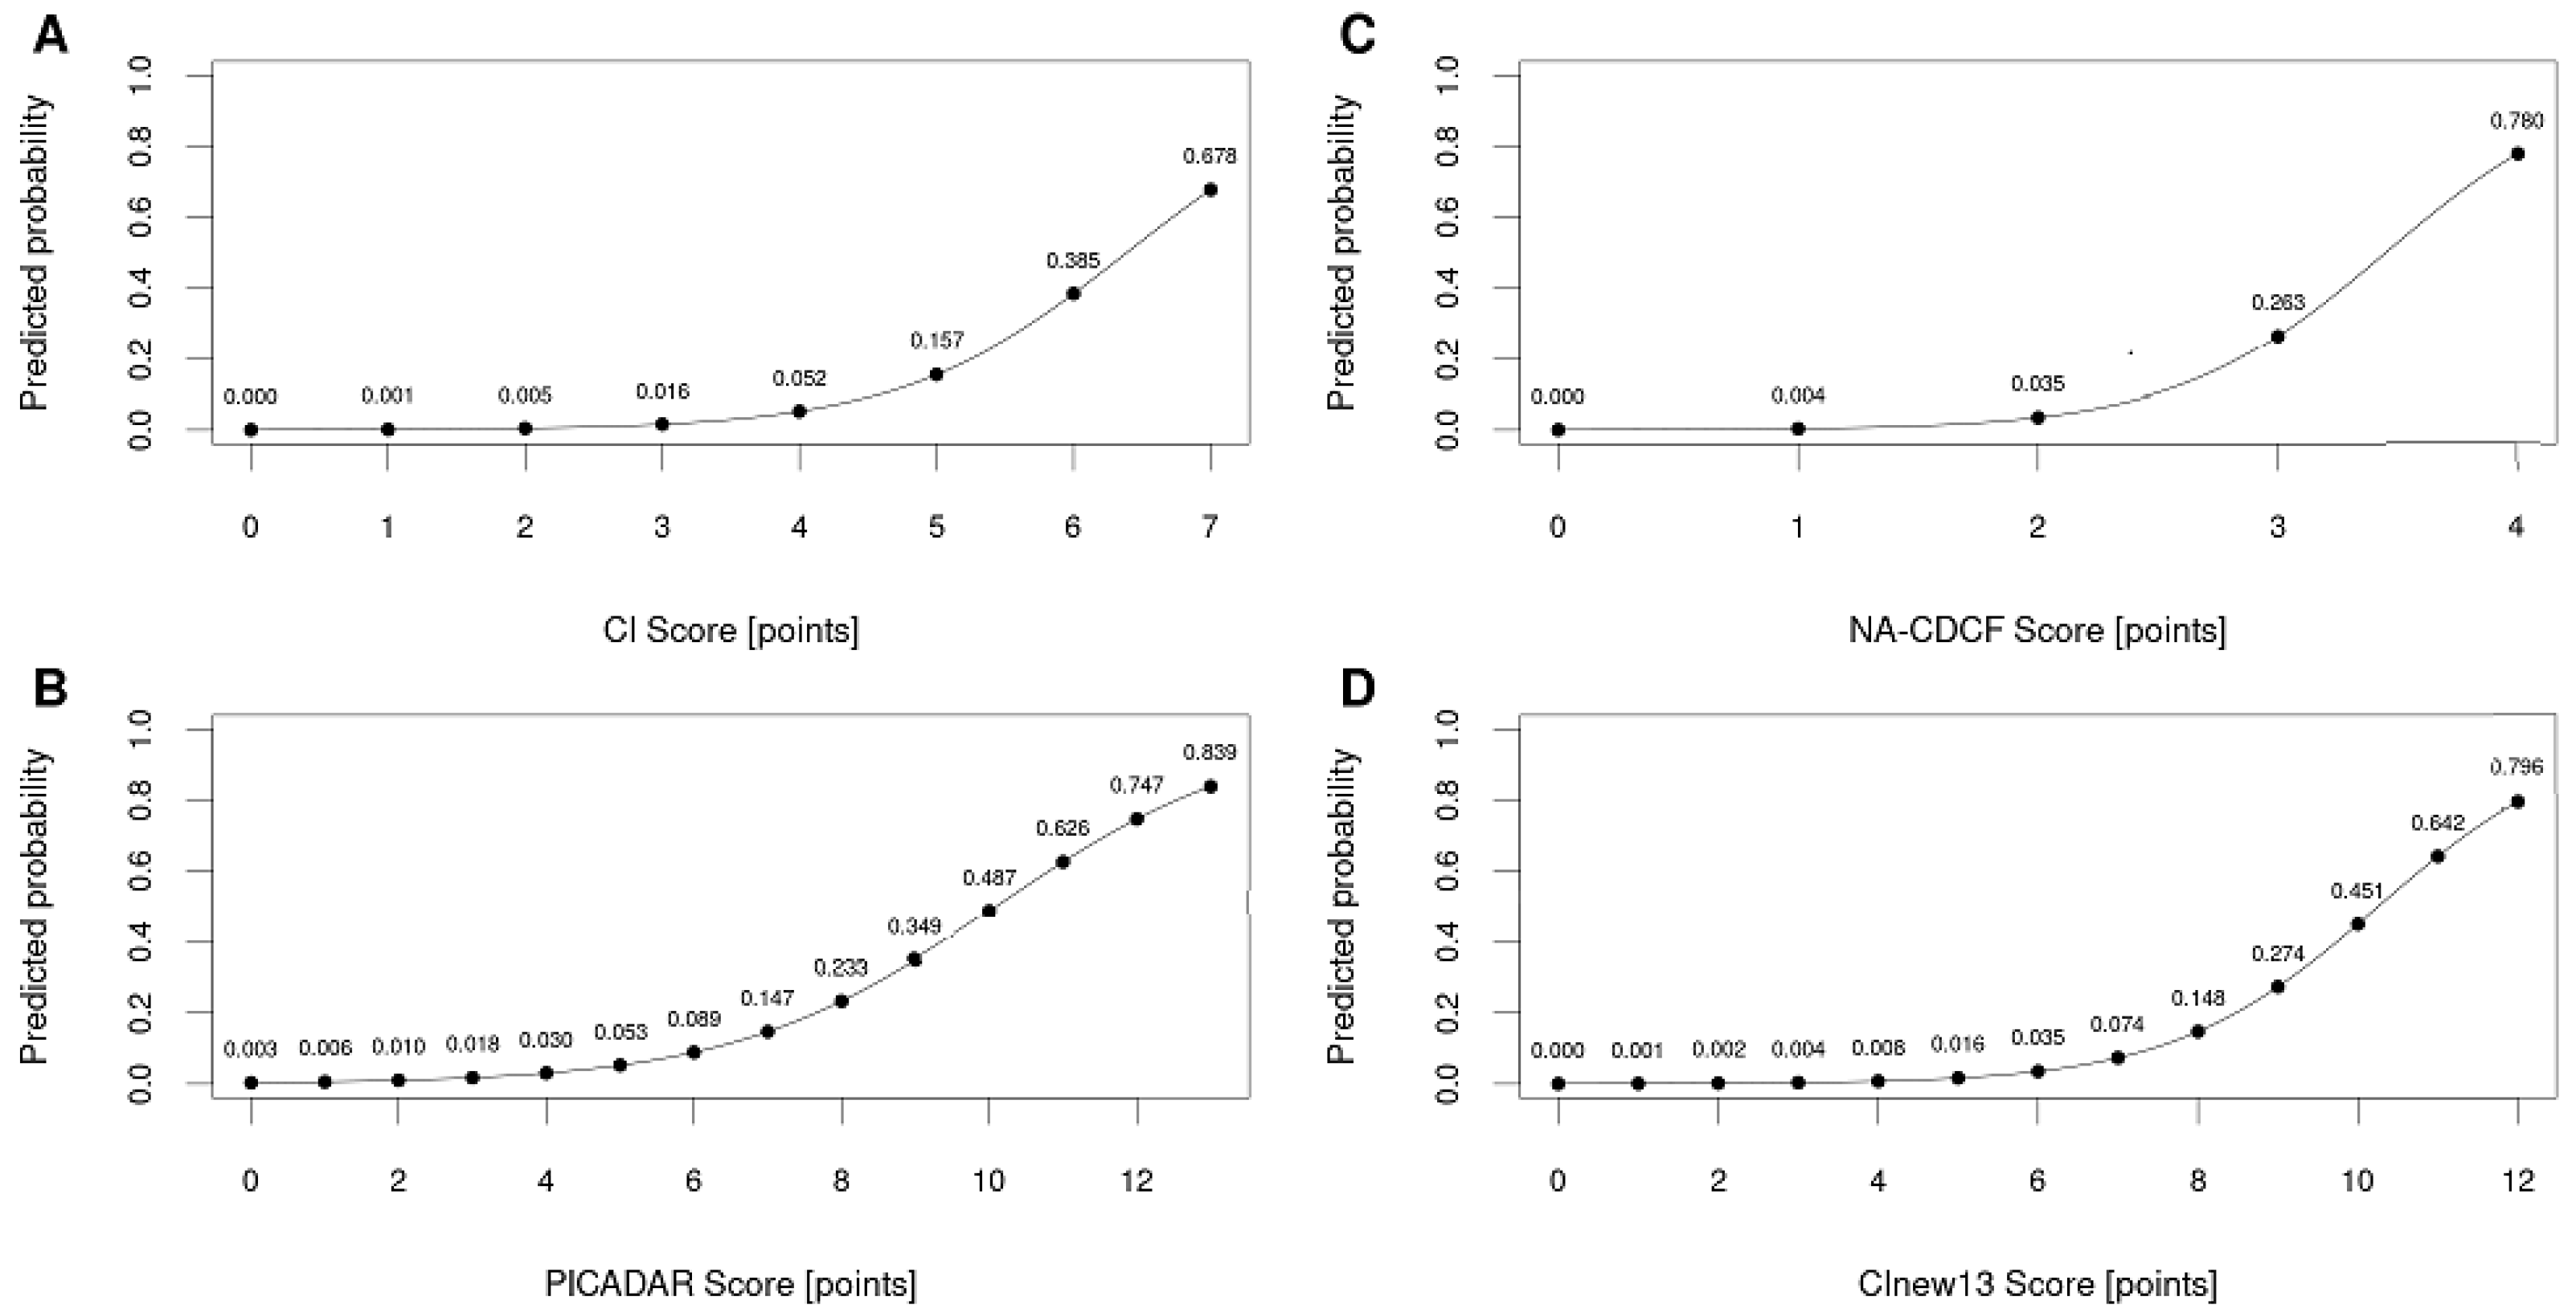
| CI | 0.8836 | 0.8479 | 0.9193 | 4 | 0.7249 | 0.9552 | 0.9918 | 0.1385 |
| PICADAR | 0.8319 | 0.7797 | 0.884 | 6 | 0.8734 | 0.6418 | 0.9785 | 0.2139 |
| NA-CDCF | 0.8141 | 0.7632 | 0.865 | 3 | 0.94 | 0.5672 | 0.9774 | 0.322 |
| CInew13 | 0.9 | 0.86 | 0.93 | 6 | 0.68 | 0.95 | 0.99 | 0.13 |
| CI + NO | 0.9377 | 0.9012 | 0.9741 | N.A. | 0.928 | 0.8364 | 0.9815 | 0.5542 |
| PICADAR + nNO | 0.921 | 0.8763 | 0.9657 | N.A. | 0.9215 | 0.8182 | 0.9786 | 0.5357 |
| NA-CDCF + nNO | 0.9171 | 0.8679 | 0.9664 | N.A. | 0.9669 | 0.7818 | 0.9764 | 0.7167 |
| CInew13 + nNO | 0.9324 | 0.8918 | 0.9729 | N.A. | 0.93 | 0.8545 | 0.9835 | 0.5663 |
Publisher’s Note: MDPI stays neutral with regard to jurisdictional claims in published maps and institutional affiliations. |
© 2021 by the authors. Licensee MDPI, Basel, Switzerland. This article is an open access article distributed under the terms and conditions of the Creative Commons Attribution (CC BY) license (https://creativecommons.org/licenses/by/4.0/).
Share and Cite
Martinů, V.; Bořek-Dohalská, L.; Varényiová, Ž.; Uhlík, J.; Čapek, V.; Pohunek, P.; Koucký, V. Evaluation of a Clinical Index as a Predictive Tool for Primary Ciliary Dyskinesia. Diagnostics 2021, 11, 1088. https://doi.org/10.3390/diagnostics11061088
Martinů V, Bořek-Dohalská L, Varényiová Ž, Uhlík J, Čapek V, Pohunek P, Koucký V. Evaluation of a Clinical Index as a Predictive Tool for Primary Ciliary Dyskinesia. Diagnostics. 2021; 11(6):1088. https://doi.org/10.3390/diagnostics11061088
Chicago/Turabian StyleMartinů, Vendula, Lucie Bořek-Dohalská, Žofia Varényiová, Jiří Uhlík, Václav Čapek, Petr Pohunek, and Václav Koucký. 2021. "Evaluation of a Clinical Index as a Predictive Tool for Primary Ciliary Dyskinesia" Diagnostics 11, no. 6: 1088. https://doi.org/10.3390/diagnostics11061088
APA StyleMartinů, V., Bořek-Dohalská, L., Varényiová, Ž., Uhlík, J., Čapek, V., Pohunek, P., & Koucký, V. (2021). Evaluation of a Clinical Index as a Predictive Tool for Primary Ciliary Dyskinesia. Diagnostics, 11(6), 1088. https://doi.org/10.3390/diagnostics11061088