
Magnetic Resonance Spectroscopy of Hepatic Fat from Fundamental to Clinical Applications

 ,
,  ,
, 


Abstract
1. Introduction
2. Why Is a Sensitive Method for Liver Fat Assessment Important?
3. Available Imaging Modalities for Liver Fat Assessment Compared to MRS

| Method | Assessment for Liver Fat | Advantages | Disadvantages | Possible Confounders |
|---|---|---|---|---|
| US | Nonquantitative Mild steatosis: Sensitivity 55.3–66.6%, Specificity 77.0–93.1% [22,45,61] Moderate-to-severe steatosis: Sensitivity 79.7–90%, Specificity 86.2–95% [61,67,68] | Noninvasive Readily available in clinical setting Relatively inexpensive | Nonqualitative Indirect measurement Low accuracy for mild steatosis and steatosis grading Modest diagnostic accuracy User dependence | Iron deposition, fibrosis, edema, hepatitis, ascites, and obesity [31,32] |
| CAP | Relative Quantitative Mild steatosis: Sensitivity 87%, Specificity 91%. Moderate steatosis: Sensitivity 85%, Specificity 74%. Severe steatosis: Sensitivity 76%, Specificity 58% [40] | Noninvasive Ease of measurement Operator-independence Relatively inexpensive | Required further validation Low accuracy in severe steatosis | Acute hepatitis, chronic hepatitis, ascites. Narrow intercostal space, high visceral fat, obesity [37,69] |
| CT | Relative Quantitative Mild steatosis: Sensitivity 50%, Specificity 77.2% [45] Moderate-to-severe steatosis: Sensitivity 72.7%, Specificity 91.3% [45] | Readily available in clinical setting Easy to perform Simple to analyze | Uses ionizing radiation Indirect measurement Low accuracy for mild steatosis | Iron deposition, edema, glycogen, and amiodarone Unenhanced CT is preferred [43,46] |
| MRI | Relative Quantitative All degrees of steatosis: IP and OP method; Sensitivity 82–90%, Specificity 89.9–91% [8] | Noninvasive Can be used in sensitive groups. Possible detectability 0–100% dynamic range after correction for confounders Allows liver fat mapping of the entire liver | Relatively expensive Indirect measurement of liver fat but from the assessment of signal loss during IP and OP echoes. Requires correction for confounding factors | Iron deposition, fibrosis, and severe steatosis Contraindications for MRI scanner [48] |
| MRS | Relative Quantitative All degrees of steatosis: Sensitivity = 94.4%, specificity = 89.5% [61,62] | Directly measures a signal from liver fat. Allows absolute quantitative measurement. Not affected by iron deposition, fibrosis, or coexisting liver pathology | Relatively expensive Usually samples only small area of liver Analysis methods are complex and require user expertise Requires correction for confounding factors for accurate quantification | Variability between MR vendors, pulses sequence, and method of analysis Contraindications for MRI scanner |
4. Basic Principle for MRS
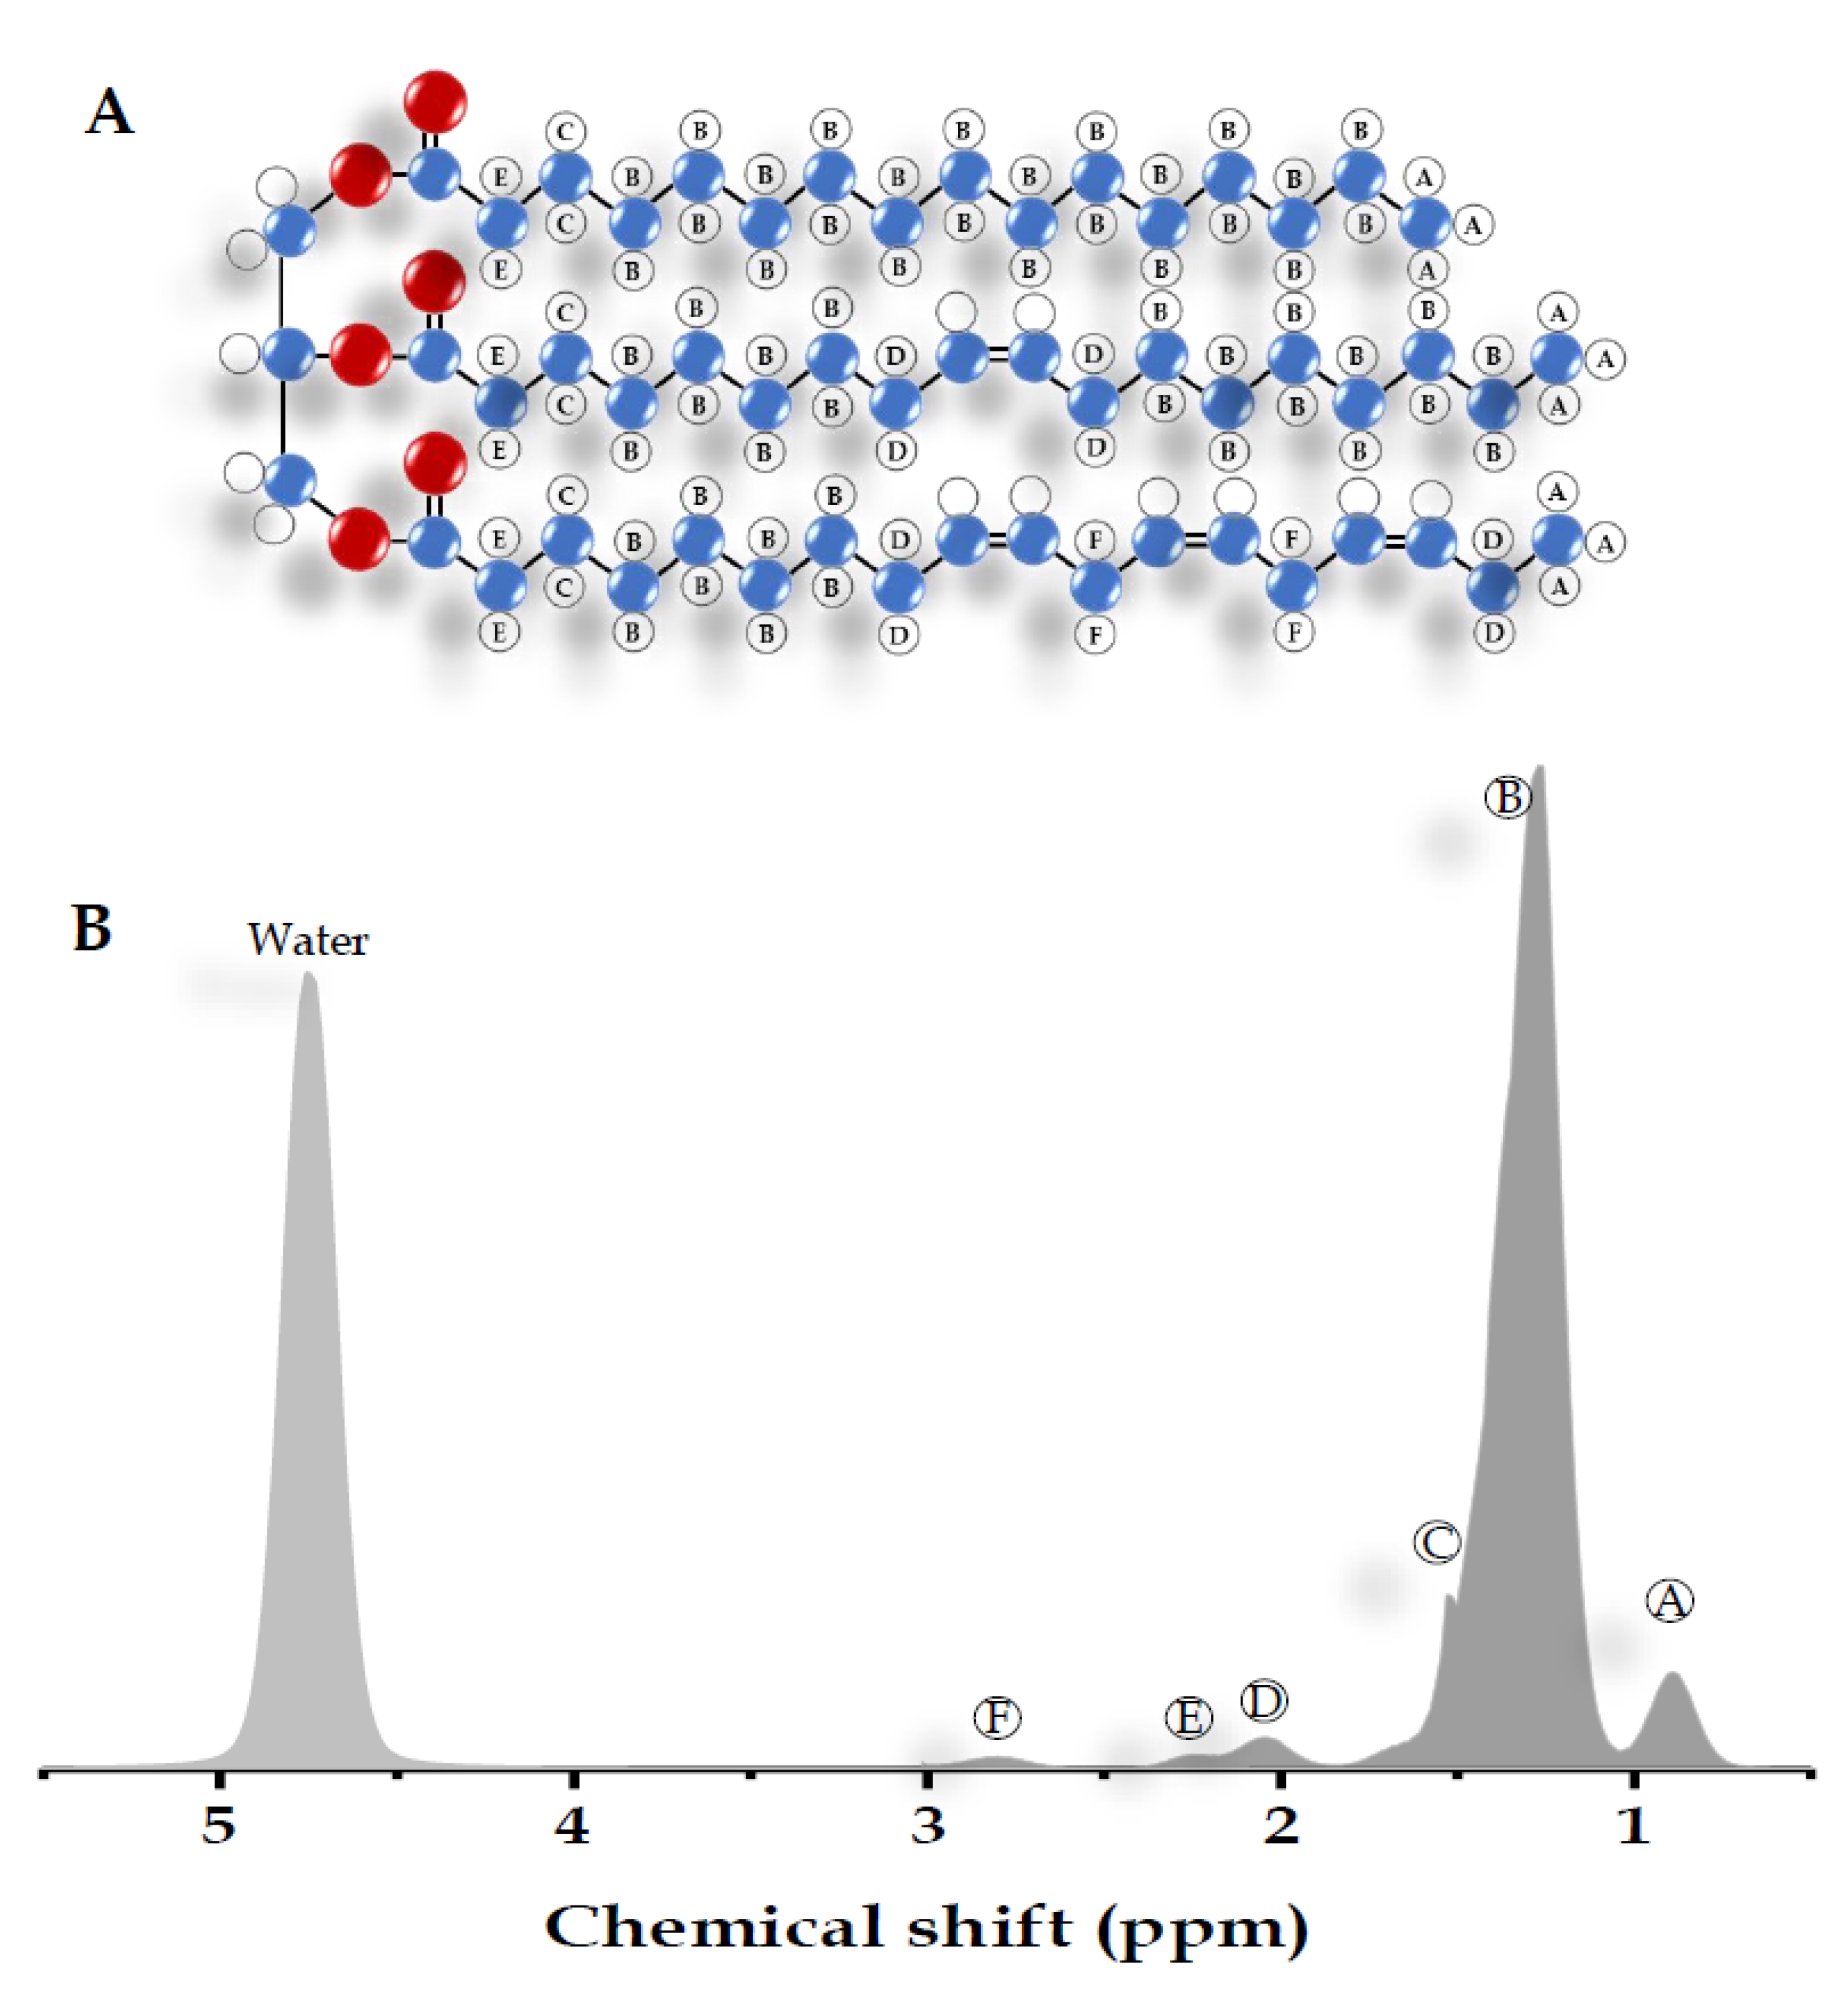
4.1. Liver MRS Spectrum
4.2. The Acquisition of Liver MRS Spectrum
4.3. MRS Spectrum Analysis and Liver Fat Quantification
5. Application of MRS for Liver Fat Quantification
5.1. Evaluation of Diffuse Liver Fat Disposition
5.2. Cirrhosis
5.3. Evaluation of Focal Liver Fat Disposition
6. Possible Confounders and Limitation of Liver MRS
7. Conclusions
Author Contributions
Funding
Institutional Review Board Statement
Informed Consent Statement
Acknowledgments
Conflicts of Interest
Appendix A
Software Packages for Liver Fat Quantification
References
- Chalasani, N.; Younossi, Z.; Lavine, J.E.; Charlton, M.; Cusi, K.; Rinella, M.; Harrison, S.A.; Brunt, E.M.; Sanyal, A.J. The diagnosis and management of nonalcoholic fatty liver disease: Practice guidance from the American Association for the Study of Liver Diseases. Hepatology 2018, 67, 328–357. [Google Scholar] [CrossRef]
- Yilmaz, Y.; Younossi, Z.M. Obesity-associated nonalcoholic fatty liver disease. Clin. Liver Dis. 2014, 18, 19–31. [Google Scholar] [CrossRef] [PubMed]
- Schwimmer, J.B.; Deutsch, R.; Kahen, T.; Lavine, J.E.; Stanley, C.; Behling, C. Prevalence of fatty liver in children and adolescents. Pediatrics 2006, 118, 1388–1393. [Google Scholar] [CrossRef]
- Leoni, S.; Tovoli, F.; Napoli, L.; Serio, I.; Ferri, S.; Bolondi, L. Current guidelines for the management of non-alcoholic fatty liver disease: A systematic review with comparative analysis. World J. Gastroenterol. 2018, 24, 3361–3373. [Google Scholar] [CrossRef] [PubMed]
- Stern, C.; Castera, L. Non-invasive diagnosis of hepatic steatosis. Hepatol. Int. 2017, 11, 70–78. [Google Scholar] [CrossRef] [PubMed]
- Khullar, V.; Dolganiuc, A.; Firpi, R.J. Pre-and-post transplant considerations in patients with nonalcoholic fatty liver disease. World J. Transpl. 2014, 4, 81–92. [Google Scholar] [CrossRef]
- Di Martino, M.; Pacifico, L.; Bezzi, M.; Di Miscio, R.; Sacconi, B.; Chiesa, C.; Catalano, C. Comparison of magnetic resonance spectroscopy, proton density fat fraction and histological analysis in the quantification of liver steatosis in children and adolescents. World J. Gastroenterol. 2016, 22, 8812. [Google Scholar] [CrossRef]
- Bohte, A.E.; van Werven, J.R.; Bipat, S.; Stoker, J. The diagnostic accuracy of US, CT, MRI and 1 H-MRS for the evaluation of hepatic steatosis compared with liver biopsy: A meta-analysis. Eur. Radiol. 2011, 21, 87–97. [Google Scholar] [CrossRef]
- Kühn, J.P.; Hernando, D.; Mensel, B.; Krüger, P.C.; Ittermann, T.; Mayerle, J.; Hosten, N.; Reeder, S.B. Quantitative chemical shift-encoded MRI is an accurate method to quantify hepatic steatosis. J. Magn. Reson. Imaging 2014, 39, 1494–1501. [Google Scholar] [CrossRef]
- Calzadilla Bertot, L.; Adams, L.A. The Natural Course of Non-Alcoholic Fatty Liver Disease. Int. J. Mol. Sci. 2016, 17, 774. [Google Scholar] [CrossRef]
- Starekova, J.; Reeder, S.B. Liver fat quantification: Where do we stand? Abdom. Radiol. (NY) 2020, 45, 3386–3399. [Google Scholar] [CrossRef]
- Wong, R.J.; Aguilar, M.; Cheung, R.; Perumpail, R.B.; Harrison, S.A.; Younossi, Z.M.; Ahmed, A. Nonalcoholic Steatohepatitis Is the Second Leading Etiology of Liver Disease Among Adults Awaiting Liver Transplantation in the United States. Gastroenterology 2015, 148, 547–555. [Google Scholar] [CrossRef]
- Targher, G.; Byrne, C.D. Non-alcoholic fatty liver disease: An emerging driving force in chronic kidney disease. Nat. Rev. Nephrol. 2017, 13, 297–310. [Google Scholar] [CrossRef] [PubMed]
- Puchner, S.B.; Lu, M.T.; Mayrhofer, T.; Liu, T.; Pursnani, A.; Ghoshhajra, B.B.; Truong, Q.A.; Wiviott, S.D.; Fleg, J.L.; Hoffmann, U. High-risk coronary plaque at coronary CT angiography is associated with nonalcoholic fatty liver disease, independent of coronary plaque and stenosis burden: Results from the ROMICAT II trial. Radiology 2015, 274, 693–701. [Google Scholar] [CrossRef]
- Byrne, C.D.; Targher, G. NAFLD: A multisystem disease. J. Hepatol. 2015, 62, S47–S64. [Google Scholar] [CrossRef] [PubMed]
- Benedict, M.; Zhang, X. Non-alcoholic fatty liver disease: An expanded review. World J. Hepatol. 2017, 9, 715. [Google Scholar] [CrossRef] [PubMed]
- Ozturk, A.; Grajo, J.R.; Gee, M.S.; Benjamin, A.; Zubajlo, R.E.; Thomenius, K.E.; Anthony, B.W.; Samir, A.E.; Dhyani, M. Quantitative Hepatic Fat Quantification in Non-alcoholic Fatty Liver Disease Using Ultrasound-Based Techniques: A Review of Literature and Their Diagnostic Performance. Ultrasound Med. Biol. 2018, 44, 2461–2475. [Google Scholar] [CrossRef]
- Goceri, E.; Shah, Z.K.; Layman, R.; Jiang, X.; Gurcan, M.N. Quantification of liver fat: A comprehensive review. Comput. Biol. Med. 2016, 71, 174. [Google Scholar] [CrossRef] [PubMed]
- Bedossa, P.; Patel, K. Biopsy and Noninvasive Methods to Assess Progression of Nonalcoholic Fatty Liver Disease. Gastroenterology 2016, 150, 1811–1822.e1814. [Google Scholar] [CrossRef]
- Kleiner, D.E.; Brunt, E.M.; Van Natta, M.; Behling, C.; Contos, M.J.; Cummings, O.W.; Ferrell, L.D.; Liu, Y.C.; Torbenson, M.S.; Unalp-Arida, A. Design and validation of a histological scoring system for nonalcoholic fatty liver disease. Hepatology 2005, 41, 1313–1321. [Google Scholar] [CrossRef] [PubMed]
- Ma, X.; Holalkere, N.-S.; R, A.K.; Mino-Kenudson, M.; Hahn, P.F.; Sahani, D.V. Imaging-based Quantification of Hepatic Fat: Methods and Clinical Applications. RadioGraphics 2009, 29, 1253–1277. [Google Scholar] [CrossRef]
- Lee, D.H. Imaging evaluation of non-alcoholic fatty liver disease: Focused on quantification. Clin. Mol. Hepatol. 2017, 23, 290. [Google Scholar] [CrossRef]
- Dulai, P.S.; Sirlin, C.B.; Loomba, R. MRI and MRE for non-invasive quantitative assessment of hepatic steatosis and fibrosis in NAFLD and NASH: Clinical trials to clinical practice. J. Hepatol. 2016, 65, 1006–1016. [Google Scholar] [CrossRef] [PubMed]
- Tyagi, A.; Yeganeh, O.; Levin, Y.; Hooker, J.C.; Hamilton, G.C.; Wolfson, T.; Gamst, A.; Zand, A.K.; Heba, E.; Loomba, R. Intra-and inter-examination repeatability of magnetic resonance spectroscopy, magnitude-based MRI, and complex-based MRI for estimation of hepatic proton density fat fraction in overweight and obese children and adults. Abdom. Imaging 2015, 40, 3070–3077. [Google Scholar] [CrossRef]
- Pydyn, N.; Miękus, K.; Jura, J.; Kotlinowski, J. New therapeutic strategies in nonalcoholic fatty liver disease: A focus on promising drugs for nonalcoholic steatohepatitis. Pharmacol. Rep. 2020, 72, 1–12. [Google Scholar] [CrossRef]
- Noureddin, M.; Loomba, R. Nonalcoholic fatty liver disease: Indications for liver biopsy and noninvasive biomarkers. Clin. Liver Dis. 2012, 1, 104. [Google Scholar] [CrossRef]
- Hamer, O.W.; Aguirre, D.A.; Casola, G.; Lavine, J.E.; Woenckhaus, M.; Sirlin, C.B. Fatty liver: Imaging patterns and pitfalls. Radiographics 2006, 26, 1637–1653. [Google Scholar] [CrossRef] [PubMed]
- Guiu, B. Other Diffuse Liver Diseases: Steatosis, Hemochromatosis, etc. In Abdominal Imaging; Hamm, B., Ros, P.R., Eds.; Springer: Berlin/Heidelberg, Germany, 2013; pp. 1027–1044. [Google Scholar]
- Reeder, S.B.; Sirlin, C.B. Quantification of liver fat with magnetic resonance imaging. Magn. Reson. Imaging Clin. 2010, 18, 337–357. [Google Scholar] [CrossRef] [PubMed]
- Özcan, H.N.; Oğuz, B.; Haliloğlu, M.; Orhan, D.; Karçaaltıncaba, M. Imaging patterns of fatty liver in pediatric patients. Diagn. Interv. Radiol. 2015, 21, 355. [Google Scholar] [CrossRef] [PubMed]
- Lv, S.; Jiang, S.; Liu, S.; Dong, Q.; Xin, Y.; Xuan, S. Noninvasive Quantitative Detection Methods of Liver Fat Content in Nonalcoholic Fatty Liver Disease. J. Clin. Transl. Hepatol. 2018, 6, 217–221. [Google Scholar] [CrossRef] [PubMed]
- Ferraioli, G.; Soares Monteiro, L.B. Ultrasound-based techniques for the diagnosis of liver steatosis. World J. Gastroenterol. 2019, 25, 6053–6062. [Google Scholar] [CrossRef]
- Zhang, X.; Wong, G.L.; Wong, V.W. Application of transient elastography in nonalcoholic fatty liver disease. Clin. Mol. Hepatol. 2020, 26, 128–141. [Google Scholar] [CrossRef]
- Sandrin, L.; Fourquet, B.; Hasquenoph, J.-M.; Yon, S.; Fournier, C.; Mal, F.; Christidis, C.; Ziol, M.; Poulet, B.; Kazemi, F. Transient elastography: A new noninvasive method for assessment of hepatic fibrosis. Ultrasound Med. Biol. 2003, 29, 1705–1713. [Google Scholar] [CrossRef] [PubMed]
- Kennedy, P.; Wagner, M.; Castéra, L.; Hong, C.W.; Johnson, C.L.; Sirlin, C.B.; Taouli, B. Quantitative elastography methods in liver disease: Current evidence and future directions. Radiology 2018, 286, 738–763. [Google Scholar] [CrossRef]
- Carvalho-Furtado, A.C.L.; Carvalho-Louro, D.M.; Regattieri, N.A.T.; Rodrigues, M.P.; Montenegro, M.L.R.N.; Ferro, A.M.; Pirangi, P.S.; Naves, L.A. Transient Elastography and Controlled Attenuation Parameter (CAP) in the Assessment of Liver Steatosis in Severe Adult Growth Hormone Deficiency. Front. Endocrinol. 2019, 10. [Google Scholar] [CrossRef] [PubMed]
- Mikolasevic, I.; Orlic, L.; Franjic, N.; Hauser, G.; Stimac, D.; Milic, S. Transient elastography (FibroScan(®)) with controlled attenuation parameter in the assessment of liver steatosis and fibrosis in patients with nonalcoholic fatty liver disease - Where do we stand? World J. Gastroenterol. 2016, 22, 7236–7251. [Google Scholar] [CrossRef] [PubMed]
- Shen, F.; Zheng, R.-D.; Mi, Y.-Q.; Wang, X.-Y.; Pan, Q.; Chen, G.-Y.; Cao, H.-X.; Chen, M.-L.; Xu, L.; Chen, J.-N.; et al. Controlled attenuation parameter for non-invasive assessment of hepatic steatosis in Chinese patients. World J. Gastroenterol. 2014, 20, 4702–4711. [Google Scholar] [CrossRef]
- Myers, R.P.; Pollett, A.; Kirsch, R.; Pomier-Layrargues, G.; Beaton, M.; Levstik, M.; Duarte-Rojo, A.; Wong, D.; Crotty, P.; Elkashab, M. Controlled Attenuation Parameter (CAP): A noninvasive method for the detection of hepatic steatosis based on transient elastography. Liver Int. 2012, 32, 902–910. [Google Scholar] [CrossRef] [PubMed]
- Pu, K.; Wang, Y.; Bai, S.; Wei, H.; Zhou, Y.; Fan, J.; Qiao, L. Diagnostic accuracy of controlled attenuation parameter (CAP) as a non-invasive test for steatosis in suspected non-alcoholic fatty liver disease: A systematic review and meta-analysis. BMC Gastroenterol. 2019, 19, 51. [Google Scholar] [CrossRef]
- Semmler, G.; Wöran, K.; Scheiner, B.; Unger, L.W.; Paternostro, R.; Stift, J.; Schwabl, P.; Bucsics, T.; Bauer, D.; Simbrunner, B.; et al. Novel reliability criteria for controlled attenuation parameter assessments for non-invasive evaluation of hepatic steatosis. United Eur. Gastroenterol. J. 2020, 8, 321–331. [Google Scholar] [CrossRef]
- de Lédinghen, V.; Vergniol, J.; Foucher, J.; El-Hajbi, F.; Merrouche, W.; Rigalleau, V. Feasibility of liver transient elastography with FibroScan using a new probe for obese patients. Liver Int. 2010, 30, 1043–1048. [Google Scholar] [CrossRef] [PubMed]
- Li, Q.; Dhyani, M.; Grajo, J.R.; Sirlin, C.; Samir, A.E. Current status of imaging in nonalcoholic fatty liver disease. World J. Hepatol. 2018, 10, 530–542. [Google Scholar] [CrossRef]
- Kramer, H.; Pickhardt, P.J.; Kliewer, M.A.; Hernando, D.; Chen, G.-H.; Zagzebski, J.A.; Reeder, S.B. Accuracy of Liver Fat Quantification with Advanced CT, MRI, and Ultrasound Techniques: Prospective Comparison With MR Spectroscopy. Am. J. Roentgenol. 2016, 208, 92–100. [Google Scholar] [CrossRef]
- Lee, S.S.; Park, S.H.; Kim, H.J.; Kim, S.Y.; Kim, M.Y.; Kim, D.Y.; Suh, D.J.; Kim, K.M.; Bae, M.H.; Lee, J.Y.; et al. Non-invasive assessment of hepatic steatosis: Prospective comparison of the accuracy of imaging examinations. J. Hepatol. 2010, 52, 579–585. [Google Scholar] [CrossRef]
- Limanond, P.; Raman, S.S.; Lassman, C.; Sayre, J.; Ghobrial, R.M.; Busuttil, R.W.; Saab, S.; Lu, D.S. Macrovesicular hepatic steatosis in living related liver donors: Correlation between CT and histologic findings. Radiology 2004, 230, 276–280. [Google Scholar] [CrossRef]
- Cassidy, F.H.; Yokoo, T.; Aganovic, L.; Hanna, R.F.; Bydder, M.; Middleton, M.S.; Hamilton, G.; Chavez, A.D.; Schwimmer, J.B.; Sirlin, C.B. Fatty liver disease: MR imaging techniques for the detection and quantification of liver steatosis. Radiographics 2009, 29, 231–260. [Google Scholar] [CrossRef]
- Venkatesh, S.K.; Hennedige, T.; Johnson, G.B.; Hough, D.M.; Fletcher, J.G. Imaging patterns and focal lesions in fatty liver: A pictorial review. Abdom. Radiol. 2017, 42, 1374–1392. [Google Scholar] [CrossRef] [PubMed]
- Reeder, S.B.; Robson, P.M.; Yu, H.; Shimakawa, A.; Hines, C.D.; McKenzie, C.A.; Brittain, J.H. Quantification of hepatic steatosis with MRI: The effects of accurate fat spectral modeling. J. Magn. Reson. Imaging 2009, 29, 1332–1339. [Google Scholar] [CrossRef]
- Hines, C.D.; Yu, H.; Shimakawa, A.; McKenzie, C.A.; Brittain, J.H.; Reeder, S.B. T1 independent, T2* corrected MRI with accurate spectral modeling for quantification of fat: Validation in a fat-water-SPIO phantom. J. Magn. Reson. Imaging 2009, 30, 1215–1222. [Google Scholar] [CrossRef]
- Simchick, G.; Yin, A.; Yin, H.; Zhao, Q. Fat spectral modeling on triglyceride composition quantification using chemical shift encoded magnetic resonance imaging. Magn. Reson. Imaging 2018, 52, 84–93. [Google Scholar] [CrossRef] [PubMed]
- Hong, C.W.; Mamidipalli, A.; Hooker, J.C.; Hamilton, G.; Wolfson, T.; Chen, D.H.; Fazeli Dehkordy, S.; Middleton, M.S.; Reeder, S.B.; Loomba, R.; et al. MRI proton density fat fraction is robust across the biologically plausible range of triglyceride spectra in adults with nonalcoholic steatohepatitis. J. Magn. Reson. Imaging 2018, 47, 995–1002. [Google Scholar] [CrossRef]
- Gu, J.; Liu, S.; Du, S.; Zhang, Q.; Xiao, J.; Dong, Q.; Xin, Y. Diagnostic value of MRI-PDFF for hepatic steatosis in patients with non-alcoholic fatty liver disease: A meta-analysis. Eur. Radiol. 2019, 29, 3564–3573. [Google Scholar] [CrossRef] [PubMed]
- Henninger, B.; Plaikner, M.; Zoller, H.; Viveiros, A.; Kannengiesser, S.; Jaschke, W.; Kremser, C. Performance of different Dixon-based methods for MR liver iron assessment in comparison to a biopsy-validated R2* relaxometry method. Eur. Radiol. 2021, 31, 2252–2262. [Google Scholar] [CrossRef] [PubMed]
- Hu, F.; Yang, R.; Huang, Z.; Wang, M.; Yuan, F.; Xia, C.; Wei, Y.; Song, B. 3D Multi-Echo Dixon technique for simultaneous assessment of liver steatosis and iron overload in patients with chronic liver diseases: A feasibility study. Quant. Imaging Med. Surg. 2019, 9, 1014–1024. [Google Scholar] [CrossRef]
- Henninger, B.; Zoller, H.; Kannengiesser, S.; Zhong, X.; Jaschke, W.; Kremser, C. 3D Multiecho Dixon for the Evaluation of Hepatic Iron and Fat in a Clinical Setting. J. Magn. Reson. Imaging 2017, 46, 793–800. [Google Scholar] [CrossRef] [PubMed]
- Zhan, C.; Olsen, S.; Zhang, H.C.; Kannengiesser, S.; Chandarana, H.; Shanbhogue, K.P. Detection of hepatic steatosis and iron content at 3 Tesla: Comparison of two-point Dixon, quantitative multi-echo Dixon, and MR spectroscopy. Abdom. Radiol. 2019, 44, 3040–3048. [Google Scholar] [CrossRef] [PubMed]
- Caussy, C.; Reeder, S.B.; Sirlin, C.B.; Loomba, R. Noninvasive, Quantitative Assessment of Liver Fat by MRI-PDFF as an Endpoint in NASH Trials. Hepatology 2018, 68, 763–772. [Google Scholar] [CrossRef] [PubMed]
- Petitclerc, L.; Sebastiani, G.; Gilbert, G.; Cloutier, G.; Tang, A. Liver fibrosis: Review of current imaging and MRI quantification techniques. J. Magn. Reson. Imaging 2017, 45, 1276–1295. [Google Scholar] [CrossRef]
- Cowin, G.; Jonsson, J.; Bauer, J.; Ash, S.; Ali, A.; Osland, E.; Purdie, D.; Clouston, A.; Powell, E.; Galloway, G. Magnetic resonance imaging and spectroscopy for monitoring liver steatosis. J. Magn. Reson. Imaging 2008, 28, 937–945. [Google Scholar] [CrossRef]
- van Werven, J.R.; Marsman, H.A.; Nederveen, A.J.; Smits, N.J.; ten Kate, F.J.; van Gulik, T.M.; Stoker, J. Assessment of hepatic steatosis in patients undergoing liver resection: Comparison of US, CT, T1-weighted dual-echo MR imaging, and point-resolved 1H MR spectroscopy. Radiology 2010, 256, 159–168. [Google Scholar] [CrossRef]
- Kang, B.-K.; Yu, E.S.; Lee, S.S.; Lee, Y.; Kim, N.; Sirlin, C.B.; Cho, E.Y.; Yeom, S.K.; Byun, J.H.; Park, S.H. Hepatic fat quantification: A prospective comparison of magnetic resonance spectroscopy and analysis methods for chemical-shift gradient echo magnetic resonance imaging with histologic assessment as the reference standard. Investig. Radiol. 2012, 47, 368–375. [Google Scholar] [CrossRef]
- Runge, J.H.; Smits, L.P.; Verheij, J.; Depla, A.; Kuiken, S.D.; Baak, B.C.; Nederveen, A.J.; Beuers, U.; Stoker, J. MR Spectroscopy–derived Proton Density Fat Fraction Is Superior to Controlled Attenuation Parameter for Detecting and Grading Hepatic Steatosis. Radiology 2018, 286, 547–556. [Google Scholar] [CrossRef]
- Fischbach, F.; Bruhn, H. Assessment of in vivo 1H magnetic resonance spectroscopy in the liver: A review. Liver Int. 2008, 28, 297–307. [Google Scholar] [CrossRef]
- ter Voert, E.G.W.; Heijmen, L.; van Laarhoven, H.W.M.; Heerschap, A. In vivo magnetic resonance spectroscopy of liver tumors and metastases. World J. Gastroenterol. 2011, 17, 5133–5149. [Google Scholar] [CrossRef]
- De Graaf, R.A. In Vivo NMR Spectroscopy: Principles and Techniques; John Wiley & Sons: Hoboken, NJ, USA, 2019. [Google Scholar]
- Saadeh, S.; Younossi, Z.M.; Remer, E.M.; Gramlich, T.; Ong, J.P.; Hurley, M.; Mullen, K.D.; Cooper, J.N.; Sheridan, M.J. The utility of radiological imaging in nonalcoholic fatty liver disease. Gastroenterology 2002, 123, 745–750. [Google Scholar] [CrossRef] [PubMed]
- Shannon, A.; Alkhouri, N.; Carter-Kent, C.; Monti, L.; Devito, R.; Lopez, R.; Feldstein, A.E.; Nobili, V. Ultrasonographic quantitative estimation of hepatic steatosis in children with NAFLD. J. Pediatr. Gastroenterol. Nutr. 2011, 53, 190–195. [Google Scholar] [CrossRef]
- Weiskirchen, R.; Tacke, F. The Role of Radiologic Modalities in Diagnosing Nonalcoholic Steatohepatitis (NASH) and Fibrosis. Curr. Hepatol. Rep. 2018, 17, 324–335. [Google Scholar] [CrossRef]
- Mandal, P.K. Magnetic resonance spectroscopy (MRS) and its application in Alzheimer’s disease. Concepts Magn. Reson. Part. A. Educ. J. 2007, 30, 40–64. [Google Scholar] [CrossRef]
- Qayyum, A. MR spectroscopy of the liver: Principles and clinical applications. Radiographics 2009, 29, 1653–1664. [Google Scholar] [CrossRef]
- Cecil, K.M. Proton magnetic resonance spectroscopy: Technique for the neuroradiologist. Neuroimaging Clin. N. Am. 2013, 23, 381–392. [Google Scholar] [CrossRef] [PubMed]
- Hamilton, G.; Yokoo, T.; Bydder, M.; Cruite, I.; Schroeder, M.E.; Sirlin, C.B.; Middleton, M.S. In vivo characterization of the liver fat ¹H MR spectrum. NMR Biomed. 2011, 24, 784–790. [Google Scholar] [CrossRef]
- Xavier, A.; Arteaga de Castro, C.; Andia, M.E.; Luijten, P.R.; Klomp, D.W.; Fillmer, A.; Prompers, J.J. Metabolite cycled liver (1) H MRS on a 7 T parallel transmit system. NMR Biomed. 2020, 33, e4343. [Google Scholar] [CrossRef]
- Pasanta, D.; Tungjai, M.; Chancharunee, S.; Sajomsang, W.; Kothan, S. Body mass index and its effects on liver fat content in overweight and obese young adults by proton magnetic resonance spectroscopy technique. World J. Hepatol. 2018, 10, 924. [Google Scholar] [CrossRef] [PubMed]
- Reeder, S.B.; Cruite, I.; Hamilton, G.; Sirlin, C.B. Quantitative assessment of liver fat with magnetic resonance imaging and spectroscopy. J. Magn. Reson. Imaging 2011, 34, 729–749. [Google Scholar] [CrossRef] [PubMed]
- Szczepaniak, L.S.; Nurenberg, P.; Leonard, D.; Browning, J.D.; Reingold, J.S.; Grundy, S.; Hobbs, H.H.; Dobbins, R.L. Magnetic resonance spectroscopy to measure hepatic triglyceride content: Prevalence of hepatic steatosis in the general population. Am. J. Physiol. Endocrinol. Metab. 2005, 288, E462–E468. [Google Scholar] [CrossRef]
- Xu, L.; Gu, S.; Feng, Q.; Liang, C.; Xin, S.X. Quantitative study of liver magnetic resonance spectroscopy quality at 3T using body and phased array coils with physical analysis and clinical evaluation. PLoS ONE 2015, 10, e0122999. [Google Scholar] [CrossRef] [PubMed]
- Hamilton, G.; Middleton, M.S.; Bydder, M.; Yokoo, T.; Schwimmer, J.B.; Kono, Y.; Patton, H.M.; Lavine, J.E.; Sirlin, C.B. Effect of PRESS and STEAM sequences on magnetic resonance spectroscopic liver fat quantification. J. Magn. Reson. Imaging 2009, 30, 145–152. [Google Scholar] [CrossRef]
- Frahm, J.a.; Bruhn, H.; Gyngell, M.; Merboldt, K.; Hänicke, W.; Sauter, R. Localized high-resolution proton NMR spectroscopy using stimulated echoes: Initial applications to human brain in vivo. Magn. Reson. Med. 1989, 9, 79–93. [Google Scholar] [CrossRef]
- Vanhamme, L.; van den Boogaart, A.; Van Huffel, S. Improved method for accurate and efficient quantification of MRS data with use of prior knowledge. J. Magn. Reson. 1997, 129, 35–43. [Google Scholar] [CrossRef]
- Maudsley, A.A.; Darkazanli, A.; Alger, J.; Hall, L.; Schuff, N.; Studholme, C.; Yu, Y.; Ebel, A.; Frew, A.; Goldgof, D. Comprehensive processing, display and analysis for in vivo MR spectroscopic imaging. NMR Biomed. 2006, 19, 492–503. [Google Scholar] [CrossRef] [PubMed]
- Mierisová, Š.; Van Den Boogaart, A.; Tkáč, I.; Van Hecke, P.; Vanhamme, L.; Liptaj, T. New approach for quantitation of short echo time in vivo 1H MR spectra of brain using AMARES. NMR Biomed. Int. J. Devoted Dev. Appl. Magn. Reson. In Vivo 1998, 11, 32–39. [Google Scholar]
- Poullet, J.B.; Sima, D.M.; Simonetti, A.W.; De Neuter, B.; Vanhamme, L.; Lemmerling, P.; Van Huffel, S. An automated quantitation of short echo time MRS spectra in an open source software environment: AQSES. NMR Biomed. Int. J. Devoted Dev. Appl. Magn. Reson. In Vivo 2007, 20, 493–504. [Google Scholar] [CrossRef] [PubMed]
- Lee, S.S.; Park, S.H. Radiologic evaluation of nonalcoholic fatty liver disease. World J. Gastroenterol 2014, 20, 7392–7402. [Google Scholar] [CrossRef] [PubMed]
- Yokoo, T.; Serai, S.D.; Pirasteh, A.; Bashir, M.R.; Hamilton, G.; Hernando, D.; Hu, H.H.; Hetterich, H.; Kühn, J.-P.; Kukuk, G.M.; et al. Linearity, Bias, and Precision of Hepatic Proton Density Fat Fraction Measurements by Using MR Imaging: A Meta-Analysis. Radiology 2018, 286, 486–498. [Google Scholar] [CrossRef]
- Papamiltiadous, E.S.; Roberts, S.K.; Nicoll, A.J.; Ryan, M.C.; Itsiopoulos, C.; Salim, A.; Tierney, A.C. A randomised controlled trial of a Mediterranean Dietary Intervention for Adults with Non Alcoholic Fatty Liver Disease (MEDINA): Study protocol. BMC Gastroenterol. 2016, 16, 14. [Google Scholar] [CrossRef]
- Sullivan, S.; Kirk, E.P.; Mittendorfer, B.; Patterson, B.W.; Klein, S. Randomized trial of exercise effect on intrahepatic triglyceride content and lipid kinetics in nonalcoholic fatty liver disease. Hepatology 2012, 55, 1738–1745. [Google Scholar] [CrossRef] [PubMed]
- Roldan-Valadez, E.; Favila, R.; Martínez-López, M.; Uribe, M.; Ríos, C.; Méndez-Sánchez, N. In vivo 3T spectroscopic quantification of liver fat content in nonalcoholic fatty liver disease: Correlation with biochemical method and morphometry. J. Hepatol. 2010, 53, 732–737. [Google Scholar] [CrossRef]
- Urdzik, J.; Bjerner, T.; Wanders, A.; Weis, J.; Duraj, F.; Haglund, U.; Norén, A. The value of pre-operative magnetic resonance spectroscopy in the assessment of steatohepatitis in patients with colorectal liver metastasis. J. Hepatol. 2012, 56, 640–646. [Google Scholar] [CrossRef]
- Raptis, D.A.; Fischer, M.A.; Graf, R.; Nanz, D.; Weber, A.; Moritz, W.; Tian, Y.; Oberkofler, C.E.; Clavien, P.A. MRI: The new reference standard in quantifying hepatic steatosis? Gut 2012, 61, 117–127. [Google Scholar] [CrossRef]
- Artz, N.S.; Haufe, W.M.; Hooker, C.A.; Hamilton, G.; Wolfson, T.; Campos, G.M.; Gamst, A.C.; Schwimmer, J.B.; Sirlin, C.B.; Reeder, S.B. Reproducibility of MR-based liver fat quantification across field strength: Same-day comparison between 1.5T and 3T in obese subjects. J. Magn. Reson. Imaging 2015, 42, 811–817. [Google Scholar] [CrossRef]
- Thomas, E.L.; Hamilton, G.; Patel, N.; O’Dwyer, R.; Doré, C.J.; Goldin, R.D.; Bell, J.D.; Taylor-Robinson, S.D. Hepatic triglyceride content and its relation to body adiposity: A magnetic resonance imaging and proton magnetic resonance spectroscopy study. Gut 2005, 54, 122–127. [Google Scholar] [CrossRef] [PubMed]
- Sarwar, R.; Pierce, N.; Koppe, S. Obesity and nonalcoholic fatty liver disease: Current perspectives. Diabetes Metab. Syndr. Obes. 2018, 11, 533–542. [Google Scholar] [CrossRef]
- Cioffi, C.E.; Narayan, K.M.V.; Liu, K.; Uppal, K.; Jones, D.P.; Tran, V.; Yu, T.; Alvarez, J.A.; Bellissimo, M.P.; Maner-Smith, K.M.; et al. Hepatic fat is a stronger correlate of key clinical and molecular abnormalities than visceral and abdominal subcutaneous fat in youth. BMJ Open Diabetes Res. AMP Care 2020, 8, e001126. [Google Scholar] [CrossRef]
- Sberna, A.L.; Bouillet, B.; Rouland, A.; Brindisi, M.C.; Nguyen, A.; Mouillot, T.; Duvillard, L.; Denimal, D.; Loffroy, R.; Vergès, B.; et al. European Association for the Study of the Liver (EASL), European Association for the Study of Diabetes (EASD) and European Association for the Study of Obesity (EASO) clinical practice recommendations for the management of non-alcoholic fatty liver disease: Evaluation of their application in people with Type 2 diabetes. Diabet. Med. 2018, 35, 368–375. [Google Scholar] [CrossRef] [PubMed]
- Modi, N.; Murgasova, D.; Ruager-Martin, R.; Thomas, E.L.; Hyde, M.J.; Gale, C.; Santhakumaran, S.; Doré, C.J.; Alavi, A.; Bell, J.D. The Influence of Maternal Body Mass Index on Infant Adiposity and Hepatic Lipid Content. Pediatric Res. 2011, 70, 287–291. [Google Scholar] [CrossRef]
- Johnson, N.A.; Walton, D.W.; Sachinwalla, T.; Thompson, C.H.; Smith, K.; Ruell, P.A.; Stannard, S.R.; George, J. Noninvasive assessment of hepatic lipid composition: Advancing understanding and management of fatty liver disorders. Hepatology 2008, 47, 1513–1523. [Google Scholar] [CrossRef] [PubMed]
- Erickson, M.L.; Haus, J.M.; Malin, S.K.; Flask, C.A.; McCullough, A.J.; Kirwan, J.P. Non-invasive assessment of hepatic lipid subspecies matched with non-alcoholic fatty liver disease phenotype. Nutr. Metab. Cardiovasc Dis. 2019, 29, 1197–1204. [Google Scholar] [CrossRef]
- Haus, J.M.; Solomon, T.P.J.; Kelly, K.R.; Fealy, C.E.; Kullman, E.L.; Scelsi, A.R.; Lu, L.; Pagadala, M.R.; McCullough, A.J.; Flask, C.A.; et al. Improved Hepatic Lipid Composition Following Short-Term Exercise in Nonalcoholic Fatty Liver Disease. J. Clin. Endocrinol. Metab. 2013, 98, E1181–E1188. [Google Scholar] [CrossRef]
- Alkhouri, N.; Dixon, L.J.; Feldstein, A.E. Lipotoxicity in nonalcoholic fatty liver disease: Not all lipids are created equal. Expert Rev. Gastroenterol. Hepatol. 2009, 3, 445–451. [Google Scholar] [CrossRef]
- Peterson, P.; Trinh, L.; Månsson, S. Quantitative 1H MRI and MRS of fatty acid composition. Magn. Reson. Med. 2021, 85, 49–67. [Google Scholar] [CrossRef]
- Martel, D.; Leporq, B.; Bruno, M.; Regatte, R.R.; Honig, S.; Chang, G. Chemical shift-encoded MRI for assessment of bone marrow adipose tissue fat composition: Pilot study in premenopausal versus postmenopausal women. Magn. Reson. Imaging 2018, 53, 148–155. [Google Scholar] [CrossRef] [PubMed]
- Nemeth, A.; Segrestin, B.; Leporq, B.; Seyssel, K.; Faraz, K.; Sauvinet, V.; Disse, E.; Valette, P.J.; Laville, M.; Ratiney, H. 3D chemical shift-encoded MRI for volume and composition quantification of abdominal adipose tissue during an overfeeding protocol in healthy volunteers. J. Magn. Reson. Imaging 2019, 49, 1587–1599. [Google Scholar] [CrossRef] [PubMed]
- Roumans, K.H.M.; Lindeboom, L.; Veeraiah, P.; Remie, C.M.E.; Phielix, E.; Havekes, B.; Bruls, Y.M.H.; Brouwers, M.C.G.J.; Ståhlman, M.; Alssema, M.; et al. Hepatic saturated fatty acid fraction is associated with de novo lipogenesis and hepatic insulin resistance. Nat. Commun. 2020, 11, 1891. [Google Scholar] [CrossRef] [PubMed]
- Hamilton, G.; Schlein, A.N.; Wolfson, T.; Cunha, G.M.; Fowler, K.J.; Middleton, M.S.; Loomba, R.; Sirlin, C.B. The relationship between liver triglyceride composition and proton density fat fraction as assessed by 1H MRS. NMR Biomed. 2020, 33, e4286. [Google Scholar] [CrossRef] [PubMed]
- Noureddin, M.; Lam, J.; Peterson, M.R.; Middleton, M.; Hamilton, G.; Le, T.A.; Bettencourt, R.; Changchien, C.; Brenner, D.A.; Sirlin, C.; et al. Utility of magnetic resonance imaging versus histology for quantifying changes in liver fat in nonalcoholic fatty liver disease trials. Hepatology 2013, 58, 1930–1940. [Google Scholar] [CrossRef]
- Safadi, R.; Konikoff, F.M.; Mahamid, M.; Zelber-Sagi, S.; Halpern, M.; Gilat, T.; Oren, R. The fatty acid-bile acid conjugate Aramchol reduces liver fat content in patients with nonalcoholic fatty liver disease. Clin. Gastroenterol. Hepatol. 2014, 12, 2085–2091.e2081. [Google Scholar] [CrossRef]
- Kim, W.; Kim, B.G.; Lee, J.S.; Lee, C.K.; Yeon, J.E.; Chang, M.S.; Kim, J.H.; Kim, H.; Yi, S.; Lee, J.; et al. Randomised clinical trial: The efficacy and safety of oltipraz, a liver X receptor alpha-inhibitory dithiolethione in patients with non-alcoholic fatty liver disease. Aliment. Pharm. 2017, 45, 1073–1083. [Google Scholar] [CrossRef]
- Scorletti, E.; Afolabi, P.R.; Miles, E.A.; Smith, D.E.; Almehmadi, A.; Alshathry, A.; Childs, C.E.; Del Fabbro, S.; Bilson, J.; Moyses, H.E.; et al. Synbiotics Alter Fecal Microbiomes, But Not Liver Fat or Fibrosis, in a Randomized Trial of Patients With Nonalcoholic Fatty Liver Disease. Gastroenterology 2020, 158, 1597–1610.e1597. [Google Scholar] [CrossRef]
- Luukkonen, P.K.; Sädevirta, S.; Zhou, Y.; Kayser, B.; Ali, A.; Ahonen, L.; Lallukka, S.; Pelloux, V.; Gaggini, M.; Jian, C.; et al. Saturated Fat Is More Metabolically Harmful for the Human Liver Than Unsaturated Fat or Simple Sugars. Diabetes Care 2018, 41, 1732–1739. [Google Scholar] [CrossRef]
- Le, T.-A.; Chen, J.; Changchien, C.; Peterson, M.R.; Kono, Y.; Patton, H.; Cohen, B.L.; Brenner, D.; Sirlin, C.; Loomba, R.; et al. Effect of colesevelam on liver fat quantified by magnetic resonance in nonalcoholic steatohepatitis: A randomized controlled trial. Hepatology 2012, 56, 922–932. [Google Scholar] [CrossRef]
- Han, M.A.T.; Altayar, O.; Hamdeh, S.; Takyar, V.; Rotman, Y.; Etzion, O.; Lefebvre, E.; Safadi, R.; Ratziu, V.; Prokop, L.J.; et al. Rates of and Factors Associated with Placebo Response in Trials of Pharmacotherapies for Nonalcoholic Steatohepatitis: Systematic Review and Meta-analysis. Clin. Gastroenterol. Hepatol. 2019, 17, 616–629.e626. [Google Scholar] [CrossRef] [PubMed]
- Noureddin, N.; Han, M.A.T.; Alkhouri, N.; Noureddin, M. Accounting for the Placebo Effect and Optimizing Outcomes in Clinical Trials of Nonalcoholic Steatohepatitis (NASH). Curr. Hepatol. Rep. 2020, 19, 63–69. [Google Scholar] [CrossRef]
- Chang, M.-L.; Hsu, C.-M.; Tseng, J.-H.; Tsou, Y.-K.; Chen, S.-C.; Shiau, S.-S.; Yeh, C.-T.; Chiu, C.-T. Plasminogen activator inhibitor-1 is independently associated with non-alcoholic fatty liver disease whereas leptin and adiponectin vary between genders. J. Gastroenterol. Hepatol. 2015, 30, 329–336. [Google Scholar] [CrossRef] [PubMed]
- Taouli, B.; Ehman, R.L.; Reeder, S.B. Advanced MRI Methods for Assessment of Chronic Liver Disease. Am. J. Roentgenol. 2009, 193, 14–27. [Google Scholar] [CrossRef] [PubMed]
- Krššák, M.; Hofer, H.; Wrba, F.; Meyerspeer, M.; Brehm, A.; Lohninger, A.; Steindl-Munda, P.; Moser, E.; Ferenci, P.; Roden, M. Non-invasive assessment of hepatic fat accumulation in chronic hepatitis C by 1H magnetic resonance spectroscopy. Eur. J. Radiol. 2010, 74, e60–e66. [Google Scholar] [CrossRef]
- Bondini, S.; Younossi, Z.M. Non-alcoholic fatty liver disease and hepatitis C infection. Minerva Gastroenterol. Dietol. 2006, 52, 135–143. [Google Scholar] [PubMed]
- Noureddin, M.; Wong, M.M.; Todo, T.; Lu, S.C.; Sanyal, A.J.; Mena, E.A. Fatty liver in hepatitis C patients post-sustained virological response with direct-acting antivirals. World J. Gastroenterol. 2018, 24, 1269–1277. [Google Scholar] [CrossRef]
- Adinolfi, L.E.; Gambardella, M.; Andreana, A.; Tripodi, M.f.; Utili, R.; Ruggiero, G. Steatosis accelerates the progression of liver damage of chronic hepatitis C patients and correlates with specific HCV genotype and visceral obesity. Hepatology 2001, 33, 1358–1364. [Google Scholar] [CrossRef]
- Jayaswal, A.N.A.; Levick, C.; Collier, J.; Tunnicliffe, E.M.; Kelly, M.D.; Neubauer, S.; Barnes, E.; Pavlides, M. Liver cT1 decreases following direct-acting antiviral therapy in patients with chronic hepatitis C virus. Abdom. Radiol. 2020. [Google Scholar] [CrossRef]
- Price, J.C.; Ma, Y.; Scherzer, R.; Korn, N.; Tillinghast, K.; Peters, M.G.; Noworolski, S.M.; Tien, P.C. Human immunodeficiency virus–infected and uninfected adults with non–genotype 3 hepatitis C virus have less hepatic steatosis than adults with neither infection. Hepatology 2017, 65, 853–863. [Google Scholar] [CrossRef]
- Cheng, Y.F.; Chen, C.L.; Lai, C.-Y.; Chen, T.Y.; Huang, T.L.; Lee, T.Y.; Lin, C.L.; Lord, R.; Chen, Y.; Eng, H.L. ASSESSMENT OF DONOR FATTY LIVERS FOR LIVER TRANSPLANTATION1. Transplantation 2001, 71, 1221–1225. [Google Scholar] [CrossRef]
- Chiang, H.J.; Chang, W.P.; Chiang, H.W.; Lazo, M.Z.; Chen, T.Y.; Ou, H.Y.; Tsang, L.L.C.; Huang, T.L.; Chen, C.L.; Cheng, Y.F. Magnetic Resonance Spectroscopy in Living-Donor Liver Transplantation. Transplant. Proc. 2016, 48, 1003–1006. [Google Scholar] [CrossRef] [PubMed]
- Perez-Daga, J.A.; Santoyo, J.; Suárez, M.A.; Fernández-Aguilar, J.A.; Ramírez, C.; Rodríguez-Cañete, A.; Aranda, J.M.; Sánchez-Pérez, B.; Montiel, C.; Palomo, D.; et al. Influence of degree of hepatic steatosis on graft function and postoperative complications of liver transplantation. Transpl. Proc. 2006, 38, 2468–2470. [Google Scholar] [CrossRef]
- Goodman, Z.D. Grading and staging systems for inflammation and fibrosis in chronic liver diseases. J. Hepatol. 2007, 47, 598–607. [Google Scholar] [CrossRef]
- Flemming, J.A.; Yang, J.D.; Vittinghoff, E.; Kim, W.R.; Terrault, N.A. Risk prediction of hepatocellular carcinoma in patients with cirrhosis: The ADRESS-HCC risk model. Cancer 2014, 120, 3485–3493. [Google Scholar] [CrossRef] [PubMed]
- Wang, D.; Li, Y. 1H Magnetic Resonance Spectroscopy Predicts Hepatocellular Carcinoma in a Subset of Patients with Liver Cirrhosis: A Randomized Trial. Medicine 2015, 94, e1066. [Google Scholar] [CrossRef] [PubMed]
- Cho, S.G.; Kim, M.Y.; Kim, H.J.; Kim, Y.S.; Choi, W.; Shin, S.H.; Hong, K.C.; Kim, Y.B.; Lee, J.H.; Suh, C.H. Chronic hepatitis: In vivo proton MR spectroscopic evaluation of the liver and correlation with histopathologic findings. Radiology 2001, 221, 740–746. [Google Scholar] [CrossRef] [PubMed]
- Sirlin, C.B.; Reeder, S.B. Magnetic resonance imaging quantification of liver iron. Magn. Reson. Imaging Clin. N. Am. 2010, 18, 359-ix. [Google Scholar] [CrossRef]
- Ruiz-Cabello, J.; Cohen, J.S. Phospholipid metabolites as indicators of cancer cell function. NMR Biomed. 1992, 5, 226–233. [Google Scholar] [CrossRef] [PubMed]
- Tang, Z.-y.; Zhao, J.-n.; Zhong, W.-j.; Luo, Y.-d.; Wu, W.; Chen, W.-j.; Dai, Y.-b. The Value of Proton Magnetic Resonance Spectroscopy in High-Intensity Focused Ultrasound Treatment of Experimental Liver Cancer. Transl. Oncol. 2015, 8, 163–168. [Google Scholar] [CrossRef][Green Version]
- Bell, J.D.; Jane Cox, I.; Sargentoni, J.; Peden, C.J.; Menon, D.K.; Foster, C.S.; Watanapa, P.; Ales, R.A.; Urenjak, J. A 31P and 1H-NMR investigation in vitro of normal and abnormal human liver. Biochim. Et Biophys. Acta Mol. Basis Dis. 1993, 1225, 71–77. [Google Scholar] [CrossRef]
- Kuo, Y.-T.; Li, C.-W.; Chen, C.-Y.; Jao, J.; Wu, D.-K.; Liu, G.-C. In Vivo Proton Magnetic Resonance Spectroscopy of Large Focal Hepatic Lesions and Metabolite Change of Hepatocellular Carcinoma before and after Transcatheter Arterial Chemoembolization Using 3.0-T MR Scanner. J. Magn. Reson. Imaging Jmri 2004, 19, 598–604. [Google Scholar] [CrossRef]
- Zhang, L.; Zhao, X.; Ouyang, H.; Wang, S.; Zhou, C. Diagnostic value of 3.0T 1H MRS with choline-containing compounds ratio (∆CCC) in primary malignant hepatic tumors. Cancer Imaging 2016, 16, 25. [Google Scholar] [CrossRef][Green Version]
- Moon, C.-M.; Shin, S.S.; Heo, S.H.; Jeong, Y.Y. Metabolic Alterations Associated with Early-Stage Hepatocellular Carcinoma and Their Correlation with Aging and Enzymatic Activity in Patients with Viral Hepatitis-Induced Liver Cirrhosis: A Preliminary Study. J. Clin. Med. 2020, 9, 765. [Google Scholar] [CrossRef]
- Li, C.-W.; Kuo, Y.C.; Chen, C.-Y.; Kuo, Y.-T.; Chiu, Y.-Y.; She, F.-O.; Liu, G.-C. Quantification of choline compounds in human hepatic tumors by proton MR spectroscopy at 3 T. Magn. Reson. Med. 2005, 53, 770–776. [Google Scholar] [CrossRef] [PubMed]
- Dzik-Jurasz, A.; Murphy, P.; George, M.; Prock, T.; Collins, D.; Swift, I.; Leach, M.; Rowland, I. Human rectal adenocarcinoma: Demonstration of 1H-MR spectra in vivo at 1.5 T. Magn. Reson. Med. Off. J. Int. Soc. Magn. Reson. Med. 2002, 47, 809–811. [Google Scholar] [CrossRef]
- Gajdošík, M.; Chmelík, M.; Halilbasic, E.; Pfleger, L.; Klepochová, R.; Trauner, M.; Trattnig, S.; Krššák, M. In Vivo 1H MR Spectroscopy of Biliary Components of Human Gallbladder at 7T. J. Magn. Reson. Imaging 2021, 53, 98–107. [Google Scholar] [CrossRef]
- Sharma, P.; Martin, D.R.; Pineda, N.; Xu, Q.; Vos, M.; Anania, F.; Hu, X. Quantitative analysis of T2-correction in single-voxel magnetic resonance spectroscopy of hepatic lipid fraction. J. Magn. Reson. Imaging 2009, 29, 629–635. [Google Scholar] [CrossRef] [PubMed]
- Kühn, J.-P.; Jahn, C.; Hernando, D.; Siegmund, W.; Hadlich, S.; Mayerle, J.; Pfannmöller, J.; Langner, S.; Reeder, S. T1 bias in chemical shift-encoded liver fat-fraction: Role of the flip angle. J. Magn. Reson. Imaging 2014, 40, 875–883. [Google Scholar] [CrossRef] [PubMed]
- Gajdošík, M.; Chmelík, M.; Just-Kukurová, I.; Bogner, W.; Valkovič, L.; Trattnig, S.; Krššák, M. In vivo relaxation behavior of liver compounds at 7 tesla, measured by single-voxel proton MR spectroscopy. J. Magn. Reson. Imaging 2014, 40, 1365–1374. [Google Scholar] [CrossRef]
- Bydder, M.; Yokoo, T.; Hamilton, G.; Middleton, M.S.; Chavez, A.D.; Schwimmer, J.B.; Lavine, J.E.; Sirlin, C.B. Relaxation effects in the quantification of fat using gradient echo imaging. Magn. Reson. Imaging 2008, 26, 347–359. [Google Scholar] [CrossRef] [PubMed]
- Yokoo, T.; Bydder, M.; Hamilton, G.; Middleton, M.S.; Gamst, A.C.; Wolfson, T.; Hassanein, T.; Patton, H.M.; Lavine, J.E.; Schwimmer, J.B.; et al. Nonalcoholic fatty liver disease: Diagnostic and fat-grading accuracy of low-flip-angle multiecho gradient-recalled-echo MR imaging at 1.5 T. Radiology 2009, 251, 67–76. [Google Scholar] [CrossRef] [PubMed]
- Gajdošík, M.; Landheer, K.; Swanberg, K.M.; Juchem, C. INSPECTOR: Free software for magnetic resonance spectroscopy data inspection, processing, simulation and analysis. Sci. Rep. 2021, 11, 2094. [Google Scholar] [CrossRef]
- Stefan, D.; Cesare, F.D.; Andrasescu, A.; Popa, E.; Lazariev, A.; Vescovo, E.; Strbak, O.; Williams, S.; Starcuk, Z.; Cabanas, M.; et al. Quantitation of magnetic resonance spectroscopy signals: The jMRUI software package. Meas. Sci. Technol. 2009, 20, 104035. [Google Scholar] [CrossRef]
- Kanowski, M.; Kaufmann, J.; Braun, J.; Bernarding, J.; Tempelmann, C. Quantitation of simulated short echo time 1H human brain spectra by LCModel and AMARES. Magn. Reson. Med. 2004, 51, 904–912. [Google Scholar] [CrossRef]
- Provencher, S.W. Automatic quantitation of localized in vivo 1H spectra with LCModel. NMR Biomed. Int. Journal Devoted Dev. Appl. Magn. Reson. In Vivo 2001, 14, 260–264. [Google Scholar]
- Mandal, P.K. In vivo proton magnetic resonance spectroscopic signal processing for the absolute quantitation of brain metabolites. Eur. J. Radiol. 2012, 81, e653–e664. [Google Scholar] [CrossRef]
- Naressi, A.; Couturier, C.; Devos, J.; Janssen, M.; Mangeat, C.; De Beer, R.; Graveron-Demilly, D. Java-based graphical user interface for the MRUI quantitation package. Magn. Reson. Mater. Phys. Biol. Med. 2001, 12, 141. [Google Scholar] [CrossRef]
- Ratiney, H.; Sdika, M.; Coenradie, Y.; Cavassila, S.; Ormondt, D.v.; Graveron-Demilly, D. Time-domain semi-parametric estimation based on a metabolite basis set. NMR Biomed. Int. J. Devoted Dev. Appl. Magn. Reson. In Vivo 2005, 18, 1–13. [Google Scholar] [CrossRef]
- Scott, J.; Underwood, J.; Garvey, L.J.; Mora-Peris, B.; Winston, A. A comparison of two post-processing analysis methods to quantify cerebral metabolites measured via proton magnetic resonance spectroscopy in HIV disease. Br. J. Radiol. 2016, 89, 20150979. [Google Scholar] [CrossRef]


| Peak | Chemical Shift (ppm) | Type | Hydrogen Atom Position (Bold) |
|---|---|---|---|
| A | 0.9 | Methyl | -CH2-CH3 |
| B | 1.3 | Methylene | -(CH2)n- |
| C | 1.59 | β-Carboxyl | -CH2-CH2-COO |
| D | 2.1 | α-olefinic | -CH2-CH=CH- |
| E | 2.25 | α-Carboxyl | -CH2-CH2-COO |
| F | 2.75 | Diacyl | -CH=CH-CH2-CH=CH- |
| - | 4.7 | Water | H2O |
Publisher’s Note: MDPI stays neutral with regard to jurisdictional claims in published maps and institutional affiliations. |
© 2021 by the authors. Licensee MDPI, Basel, Switzerland. This article is an open access article distributed under the terms and conditions of the Creative Commons Attribution (CC BY) license (https://creativecommons.org/licenses/by/4.0/).
Share and Cite
Pasanta, D.; Htun, K.T.; Pan, J.; Tungjai, M.; Kaewjaeng, S.; Kim, H.; Kaewkhao, J.; Kothan, S. Magnetic Resonance Spectroscopy of Hepatic Fat from Fundamental to Clinical Applications. Diagnostics 2021, 11, 842. https://doi.org/10.3390/diagnostics11050842
Pasanta D, Htun KT, Pan J, Tungjai M, Kaewjaeng S, Kim H, Kaewkhao J, Kothan S. Magnetic Resonance Spectroscopy of Hepatic Fat from Fundamental to Clinical Applications. Diagnostics. 2021; 11(5):842. https://doi.org/10.3390/diagnostics11050842
Chicago/Turabian StylePasanta, Duanghathai, Khin Thandar Htun, Jie Pan, Montree Tungjai, Siriprapa Kaewjaeng, Hongjoo Kim, Jakrapong Kaewkhao, and Suchart Kothan. 2021. "Magnetic Resonance Spectroscopy of Hepatic Fat from Fundamental to Clinical Applications" Diagnostics 11, no. 5: 842. https://doi.org/10.3390/diagnostics11050842
APA StylePasanta, D., Htun, K. T., Pan, J., Tungjai, M., Kaewjaeng, S., Kim, H., Kaewkhao, J., & Kothan, S. (2021). Magnetic Resonance Spectroscopy of Hepatic Fat from Fundamental to Clinical Applications. Diagnostics, 11(5), 842. https://doi.org/10.3390/diagnostics11050842