
Comparative Analysis of the Differences in Dentofacial Morphology According to the Tongue and Lip Pressure

 , and
, and 
Abstract
1. Introduction
2. Materials and Methods
2.1. Subjects
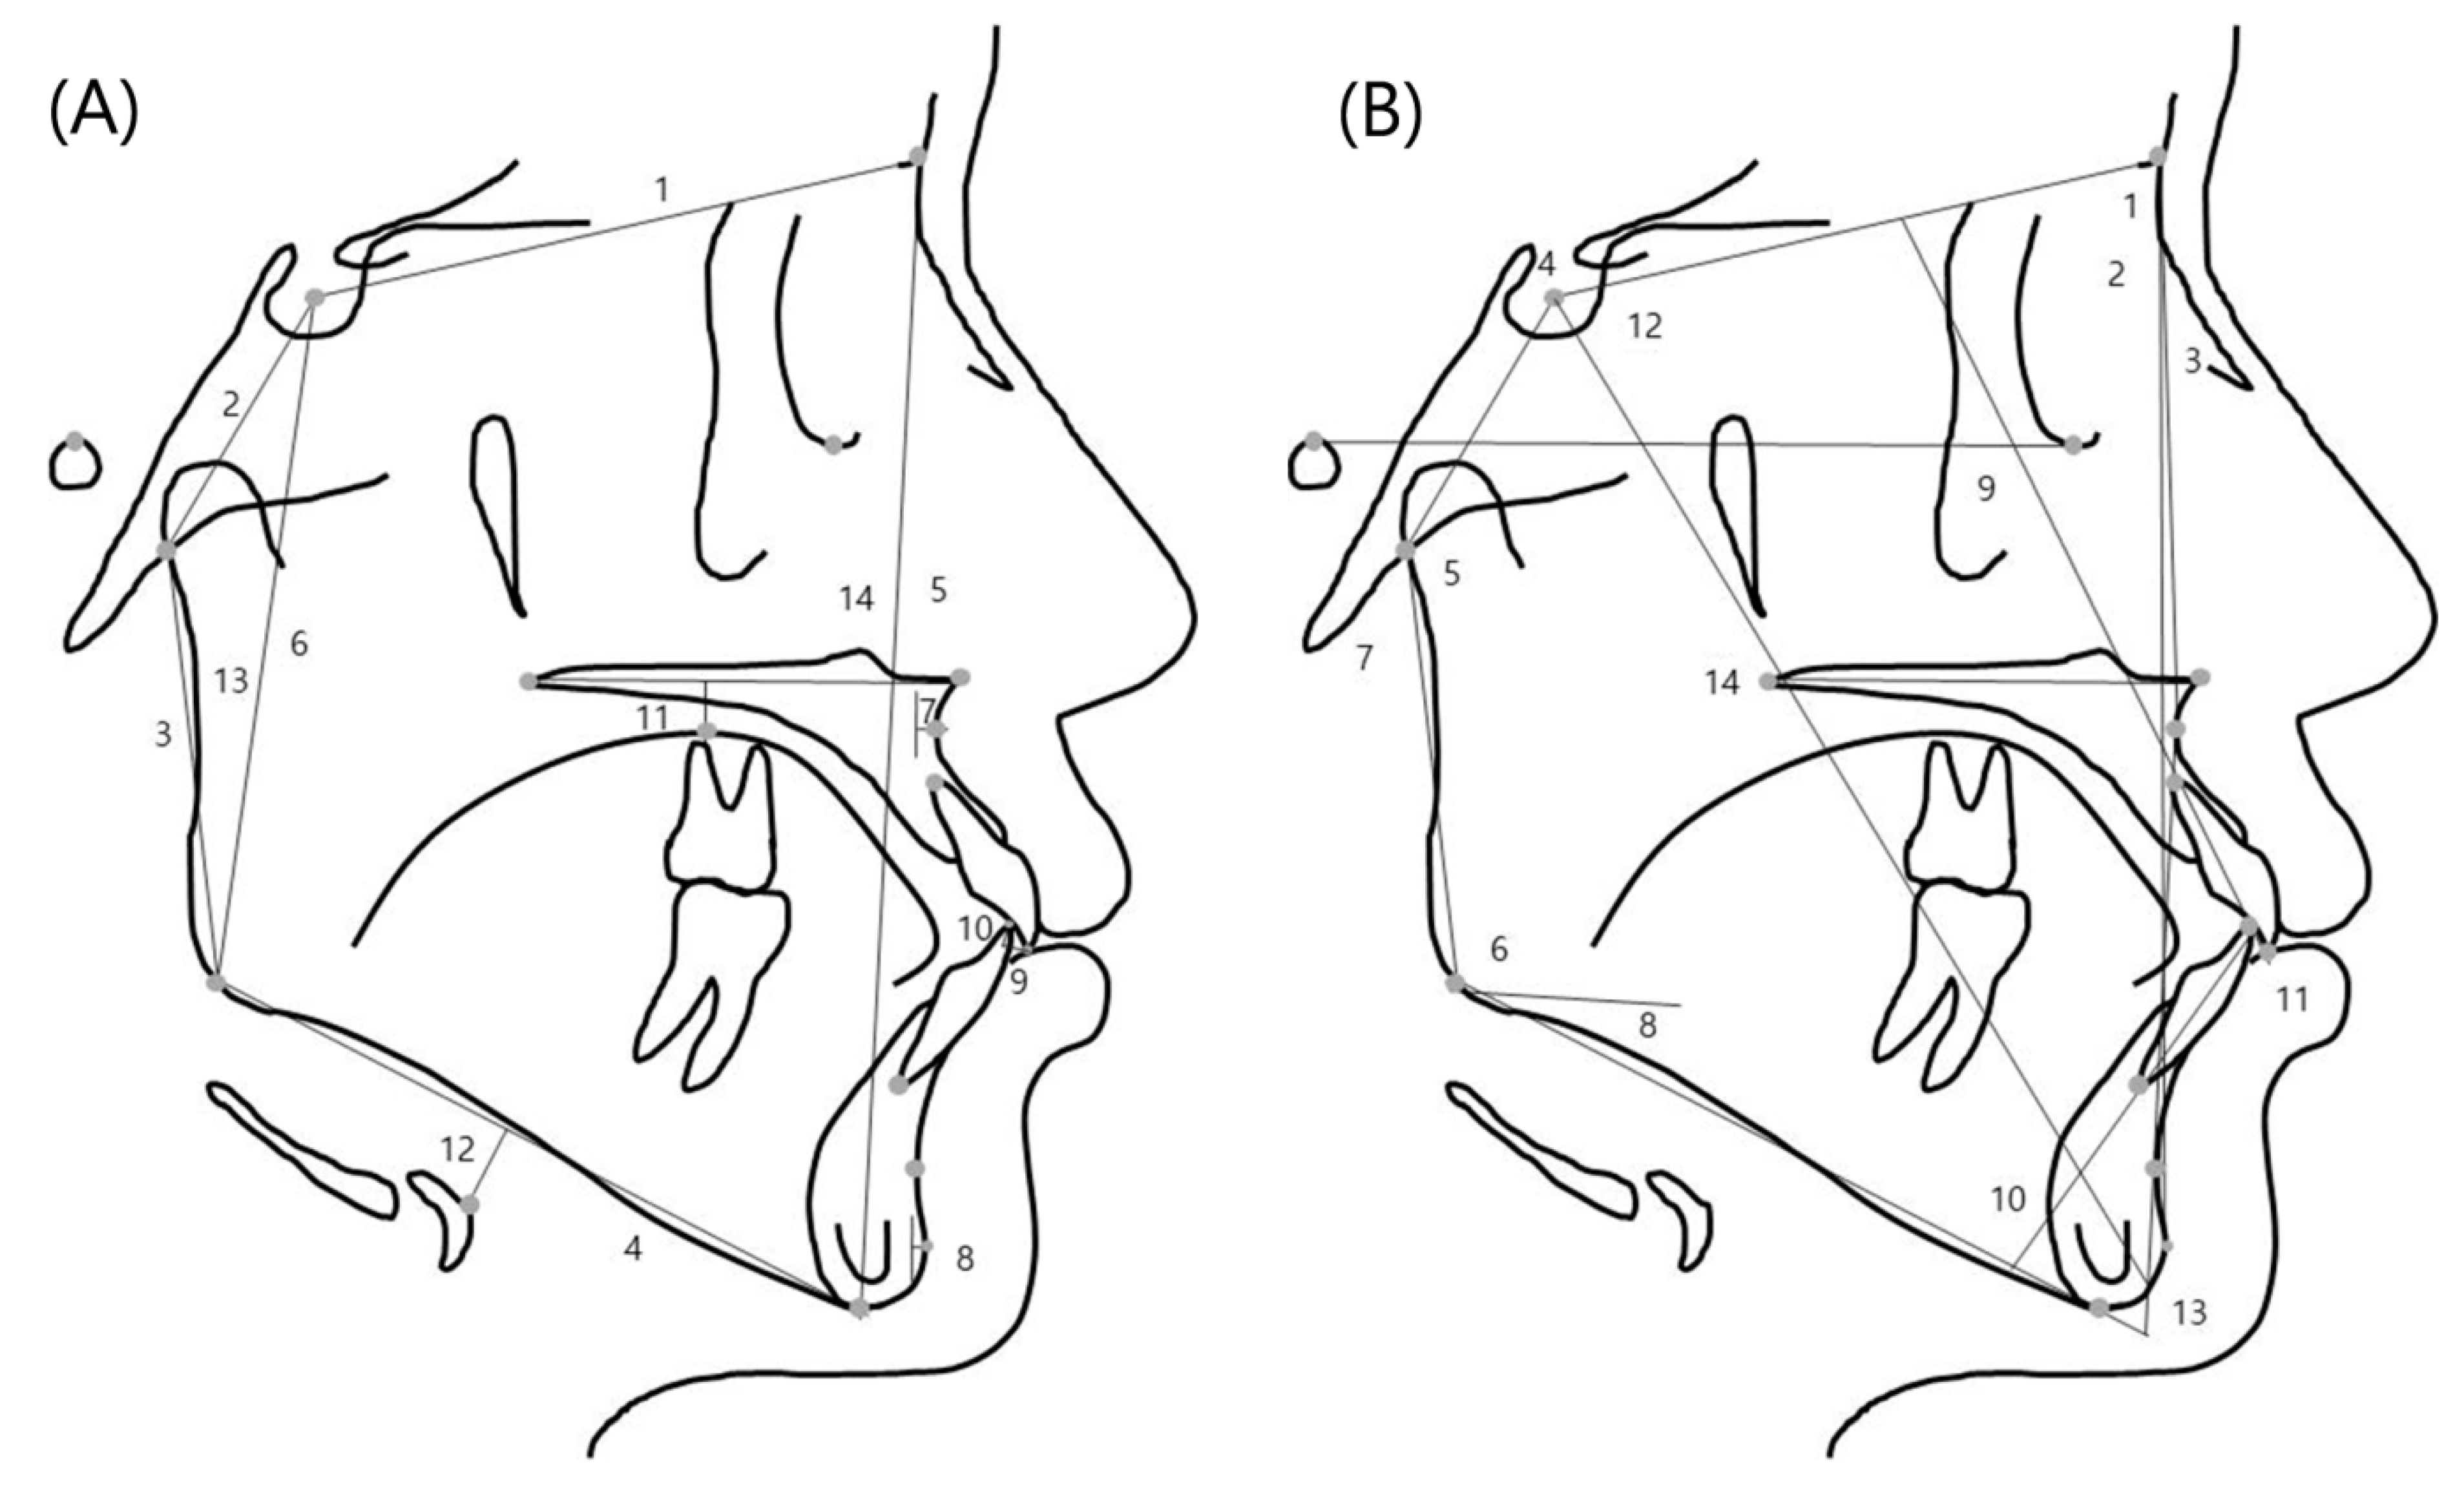
2.2. Measurement Methods of the Lateral Cephalometric Radiographs
2.3. Tongue and Lip Pressure Measurements
2.4. Statistical Analysis
3. Results
4. Discussion
5. Conclusions
Author Contributions
Funding
Institutional Review Board Statement
Informed Consent Statement
Data Availability Statement
Conflicts of Interest
References
- Brodie, A.G. Consideration of musculature in diagnosis, treatment, and retention. Am. J. Orthod. 1952, 38, 823–835. [Google Scholar] [CrossRef]
- Lambrechts, H.; De Baets, E.; Fieuws, S.; Willems, G. Lip and tongue pressure in orthodontic patients. Eur. J. Orthod. 2010, 32, 466–471. [Google Scholar] [CrossRef] [PubMed]
- Primozic, J.; Farčnik, F.; Perinetti, G.; Richmond, S.; Ovsenik, M. The association of tongue posture with the dentoalveolar maxillary and mandibular morphology in Class III malocclusion: A controlled study. Eur. J. Orthod. 2012, 35, 388–393. [Google Scholar] [CrossRef] [PubMed]
- Weinstein, S.; Haack, D.C.; Morris, L.Y.; Snyder, B.B.; Attaway, H.E. On an equilibrium theory of tooth position. Angle Orthod. 1963, 33, 1–26. [Google Scholar]
- Jung, M.-H.; Yang, W.-S.; Nahm, D.-S. Maximum Closing Force of Mentolabial Muscles and Type of Malocclusion. Angle Orthod. 2010, 80, 72–79. [Google Scholar] [CrossRef] [PubMed]
- Kuroda, T.; Ono, T. Diagnosis and management of oral dysfunction. World J. Orthod. 2000, 1, 125–133. [Google Scholar]
- Fröhlich, K.; Ingervall, B.; Thüer, U.; Hlich, K.F.; Er, U.T. Further studies of the pressure from the tongue on the teeth in young adults. Eur. J. Orthod. 1992, 14, 229–239. [Google Scholar] [CrossRef] [PubMed]
- Ackerman, J.L.; Proffit, W.R. Soft tissue limitations in orthodontics: Treatment planning guidelines. Angle Orthod. 1997, 67, 327–336. [Google Scholar]
- Ruan, W.-H.; Chen, M.-D.; Gu, Z.-Y.; Lu, Y.; Su, J.-M.; Guo, Q. Muscular forces exerted on the normal deciduous dentition. Angle Orthod. 2005, 75, 785–790. [Google Scholar]
- Adesina, B.A.; Otuyemi, O.D.; Kolawole, K.A.; Adeyemi, A.T. Assessment of the impact of tongue size in patients with bi-maxillary protrusion. Int. Orthod. 2013, 11, 221–232. [Google Scholar]
- Proffit, W.R. Equilibrium theory revisited: Factors influencing position of the teeth. Angle Orthod. 1978, 48, 175–186. [Google Scholar]
- Kurabeishi, H.; Tatsuo, R.; Makoto, N.; Kazunori, F. Relationship between tongue pressure and maxillofacial morphology in Japanese children based on skeletal classification. J. Oral Rehabil. 2018, 45, 684–691. [Google Scholar] [CrossRef]
- Doto, N.; Yamada, K. The relationship between maximum lip closing force and tongue pressure according to lateral craniofacial morphology. Orthod. Waves 2015, 74, 69–75. [Google Scholar] [CrossRef]
- Posen, A.L. The influence of maximum perioral and tongue force on the incisor teeth. Angle Orthod. 1972, 42, 285–309. [Google Scholar] [PubMed]
- Azevedo, N.D.; Lima, J.C.; Furlan, R.M.M.M.; Motta, A.R. Tongue pressure measurement in children with mouth-breathing behaviour. J. Oral Rehabil. 2018, 45, 612–617. [Google Scholar] [CrossRef] [PubMed]
- Ruan, W.-H.; Su, J.-M.; Ye, X.-W. Pressure from the lips and the tongue in children with class III malocclusion. J. Zhejiang Univ. Sci. B 2007, 8, 296–301. [Google Scholar] [CrossRef]
- Posen, A.L. The application of quantitative perioral assessment to orthodontic case analysis and treatment planning. Angle Orthod. 1976, 46, 118–143. [Google Scholar]
- Jung, M.-H.; Yang, W.-S.; Nahm, D.-S. Effects of upper lip closing force on craniofacial structures. Am. J. Orthod. Dentofac. Orthop. 2003, 123, 58–63. [Google Scholar] [CrossRef]
- Adams, V.; Mathisen, B.; Baines, S.; Lazarus, C.; Callister, R. A Systematic Review and Meta-analysis of Measurements of Tongue and Hand Strength and Endurance Using the Iowa Oral Performance Instrument (IOPI). Dysphagia 2013, 28, 350–369. [Google Scholar] [CrossRef]
- Youmans, S.R.; Stierwalt, J.A.G. Measures of Tongue Function Related to Normal Swallowing. Dysphagia 2006, 21, 102–111. [Google Scholar] [CrossRef] [PubMed]
- Youmans, S.R.; Youmans, G.L.; Stierwalt, J.A.G. Differences in Tongue Strength Across Age and Gender: Is There a Diminished Strength Reserve? Dysphagia 2008, 24, 57–65. [Google Scholar] [CrossRef]
- Park, J.-S.; You, S.-J.; Jeong, C.H. Age and Sex Differences in Orofacial Strength of Healthy Korean Adult. Korean J. Occup. Ther. 2013, 21, 103–116. [Google Scholar]
- Ingervall, B.; Thüer, U.; Kuster, R. Lack of correlation between mouth-breathing and bite force. Eur. J. Orthod. 1989, 11, 43–46. [Google Scholar] [CrossRef]
- Smithpeter, J.; Covell, D. Relapse of anterior open bites treated with orthodontic appliances with and without orofacial myofunctional therapy. Am. J. Orthod. Dentofac. Orthop. 2010, 137, 605–614. [Google Scholar] [CrossRef] [PubMed]
- Meazzini, M.C.; Besana, M.; Tortora, C.; Cohen, N.; Rezzonico, A.; Ferrari, M.; Autelitano, L. Long-term longitudinal evalu-tation of mandibular growth in patients with Beckwith-Wiedemann Syndrome treated and not treated with glossectomy. J. Craniomaxillofac. Surg. 2020, 48, 1126–1131. [Google Scholar] [CrossRef] [PubMed]


| TAP (kPa) | TPP (kPa) | LP (kPa) | |||||
|---|---|---|---|---|---|---|---|
| Low (<42) | High (≥42) | Low (<40) | High (≥40) | Low (<24) | High (≥24) | ||
| Sex | Male | 45 | 59 | 46 | 58 | 57 | 47 |
| Female | 55 | 35 | 57 | 33 | 62 | 28 | |
| Age (y) | Mean | 23.2 | 24.2 | 22.6 | 24.8 | 23.3 | 24.2 |
| SD | 6.9 | 7.7 | 6.6 | 7.8 | 7.2 | 7.4 | |
| TAP | TPP | LP | ||||
|---|---|---|---|---|---|---|
| Cephalometric Variable | Correlation | p-Value | Correlation | p-Value | Correlation | p-Value |
| ACB | 0.151 | 0.035 * | NS | NS | NS | NS |
| PCB | 0.277 | <0.001 *** | 0.229 | 0.001 ** | NS | NS |
| RH | 0.205 | 0.004 ** | 0.147 | 0.041 * | NS | NS |
| PFH | 0.251 | <0.001 *** | 0.201 | 0.005 ** | NS | NS |
| Pog to N-perp | 0.147 | 0.04 * | NS | NS | NS | NS |
| OJ | −0.202 | 0.005 ** | NS | NS | NS | NS |
| FHR | 0.183 | 0.011 * | 0.19 | 0.008 ** | NS | NS |
| SNA | NS | NS | 0.149 | 0.038 * | NS | NS |
| SNB | 0.161 | 0.025 * | 0.16 | 0.026 * | NS | NS |
| ANB | −0.151 | 0.035 * | NS | NS | NS | NS |
| Articular angle | −0.151 | 0.036 * | NS | NS | NS | NS |
| Björk sum | −0.153 | 0.033 * | −0.174 | 0.015 * | NS | NS |
| U1 to FH | NS | NS | NS | NS | −0.231 | 0.001 ** |
| IIA | NS | NS | NS | NS | 0.211 | 0.003 ** |
| Y axis to SN | −0.146 | 0.042 * | −0.146 | 0.042 * | NS | NS |
| Cephalometric Variables | TAP_Low | TAP_High | Significance | Comparisons |
|---|---|---|---|---|
| Articular angle (°) | 148.2 ± 8.0 | 146.0 ± 7.4 | 0.022 * | TAP_low > TAP_high |
| PCB (mm) | 38.6 ± 3.6 | 39.7 ± 4.2 | 0.027 * | TAP_low < TAP_high |
| OJ (mm) | 2.5 ± 4.0 | 1.3 ± 3.8 | 0.016 * | TAP_low > TAP_high |
| H to MP (mm) | 13.0 ± 5.6 | 14.7 ± 5.9 | 0.019 * | TAP_low < TAP_high |
| Cephalometric Variables | TPP_Low | TPP_High | Significance | Comparisons |
|---|---|---|---|---|
| Björk sum (°) | 398.2 ± 7.4 | 396.4 ± 7.2 | 0.045 * | TPP_low > TPP_high |
| PCB (mm) | 38.5 ± 3.6 | 39.8 ± 4.3 | 0.011 * | TPP_low < TPP_high |
| PFH (mm) | 87.2 ± 8.8 | 90.2 ± 9.0 | 0.010 * | TPP_low < TPP_high |
| FHR | 63.9 ± 5.6 | 65.6 ± 5.9 | 0.021 * | TPP_low < TPP_high |
| RH (mm) | 52.5 ± 7.1 | 54.5 ± 7.7 | 0.031 * | TPP_low < TPP_high |
| Cephalometric Variables | LP_Low | LP_High | Significance | Comparisons |
|---|---|---|---|---|
| IIA (°) | 125.3 ± 11.9 | 128.8 ± 13.7 | 0.034 * | LP_low < LP_high |
| PCB (mm) | 38.7 ± 3.8 | 39.7 ± 4.1 | 0.045 * | LP_low < LP_high |
| OJ (mm) | 2.4 ± 3.9 | 1.1 ± 3.9 | 0.013 * | LP_low > LP_high |
| Dependent Variable | Statistically Significant Independent Variables | B | SE B | p-Value | Adjusted R-Quared | F-Statistic |
|---|---|---|---|---|---|---|
| TAP | PCB (mm) | 0.86 | 0.24 | <0.001 *** | 0.091 | 10.62 |
| OJ (mm) | −0.55 | 0.25 | 0.027 * | |||
| TPP | PCB (mm) | 0.92 | 0.25 | <0.001 *** | 0.099 | 6.28 |
| Tp to PP (mm) | −0.56 | 0.21 | 0.01 * | |||
| OJ (mm) | −0.53 | 0.26 | 0.04 * | |||
| age | 0.29 | 0.13 | 0.03 * | |||
| LP | U1 to FH (°) | −0.48 | 0.11 | <0.001 *** | 0.095 | 11.14 |
| FMA (°) | −0.45 | 0.14 | 0.001 ** |
Publisher’s Note: MDPI stays neutral with regard to jurisdictional claims in published maps and institutional affiliations. |
© 2021 by the authors. Licensee MDPI, Basel, Switzerland. This article is an open access article distributed under the terms and conditions of the Creative Commons Attribution (CC BY) license (http://creativecommons.org/licenses/by/4.0/).
Share and Cite
Lee, Y.-S.; Ryu, J.; Baek, S.-H.; Lim, W.H.; Yang, I.-H.; Kim, T.-W.; Jung, S.-K. Comparative Analysis of the Differences in Dentofacial Morphology According to the Tongue and Lip Pressure. Diagnostics 2021, 11, 503. https://doi.org/10.3390/diagnostics11030503
Lee Y-S, Ryu J, Baek S-H, Lim WH, Yang I-H, Kim T-W, Jung S-K. Comparative Analysis of the Differences in Dentofacial Morphology According to the Tongue and Lip Pressure. Diagnostics. 2021; 11(3):503. https://doi.org/10.3390/diagnostics11030503
Chicago/Turabian StyleLee, Yoo-Sun, Jiho Ryu, Seung-Hak Baek, Won Hee Lim, Il-Hyung Yang, Tae-Woo Kim, and Seok-Ki Jung. 2021. "Comparative Analysis of the Differences in Dentofacial Morphology According to the Tongue and Lip Pressure" Diagnostics 11, no. 3: 503. https://doi.org/10.3390/diagnostics11030503
APA StyleLee, Y.-S., Ryu, J., Baek, S.-H., Lim, W. H., Yang, I.-H., Kim, T.-W., & Jung, S.-K. (2021). Comparative Analysis of the Differences in Dentofacial Morphology According to the Tongue and Lip Pressure. Diagnostics, 11(3), 503. https://doi.org/10.3390/diagnostics11030503