
Automatic Pharyngeal Phase Recognition in Untrimmed Videofluoroscopic Swallowing Study Using Transfer Learning with Deep Convolutional Neural Networks


Abstract
1. Introduction
2. Materials and Methods
2.1. Experimental Design
2.2. Datasets
2.3. CNN
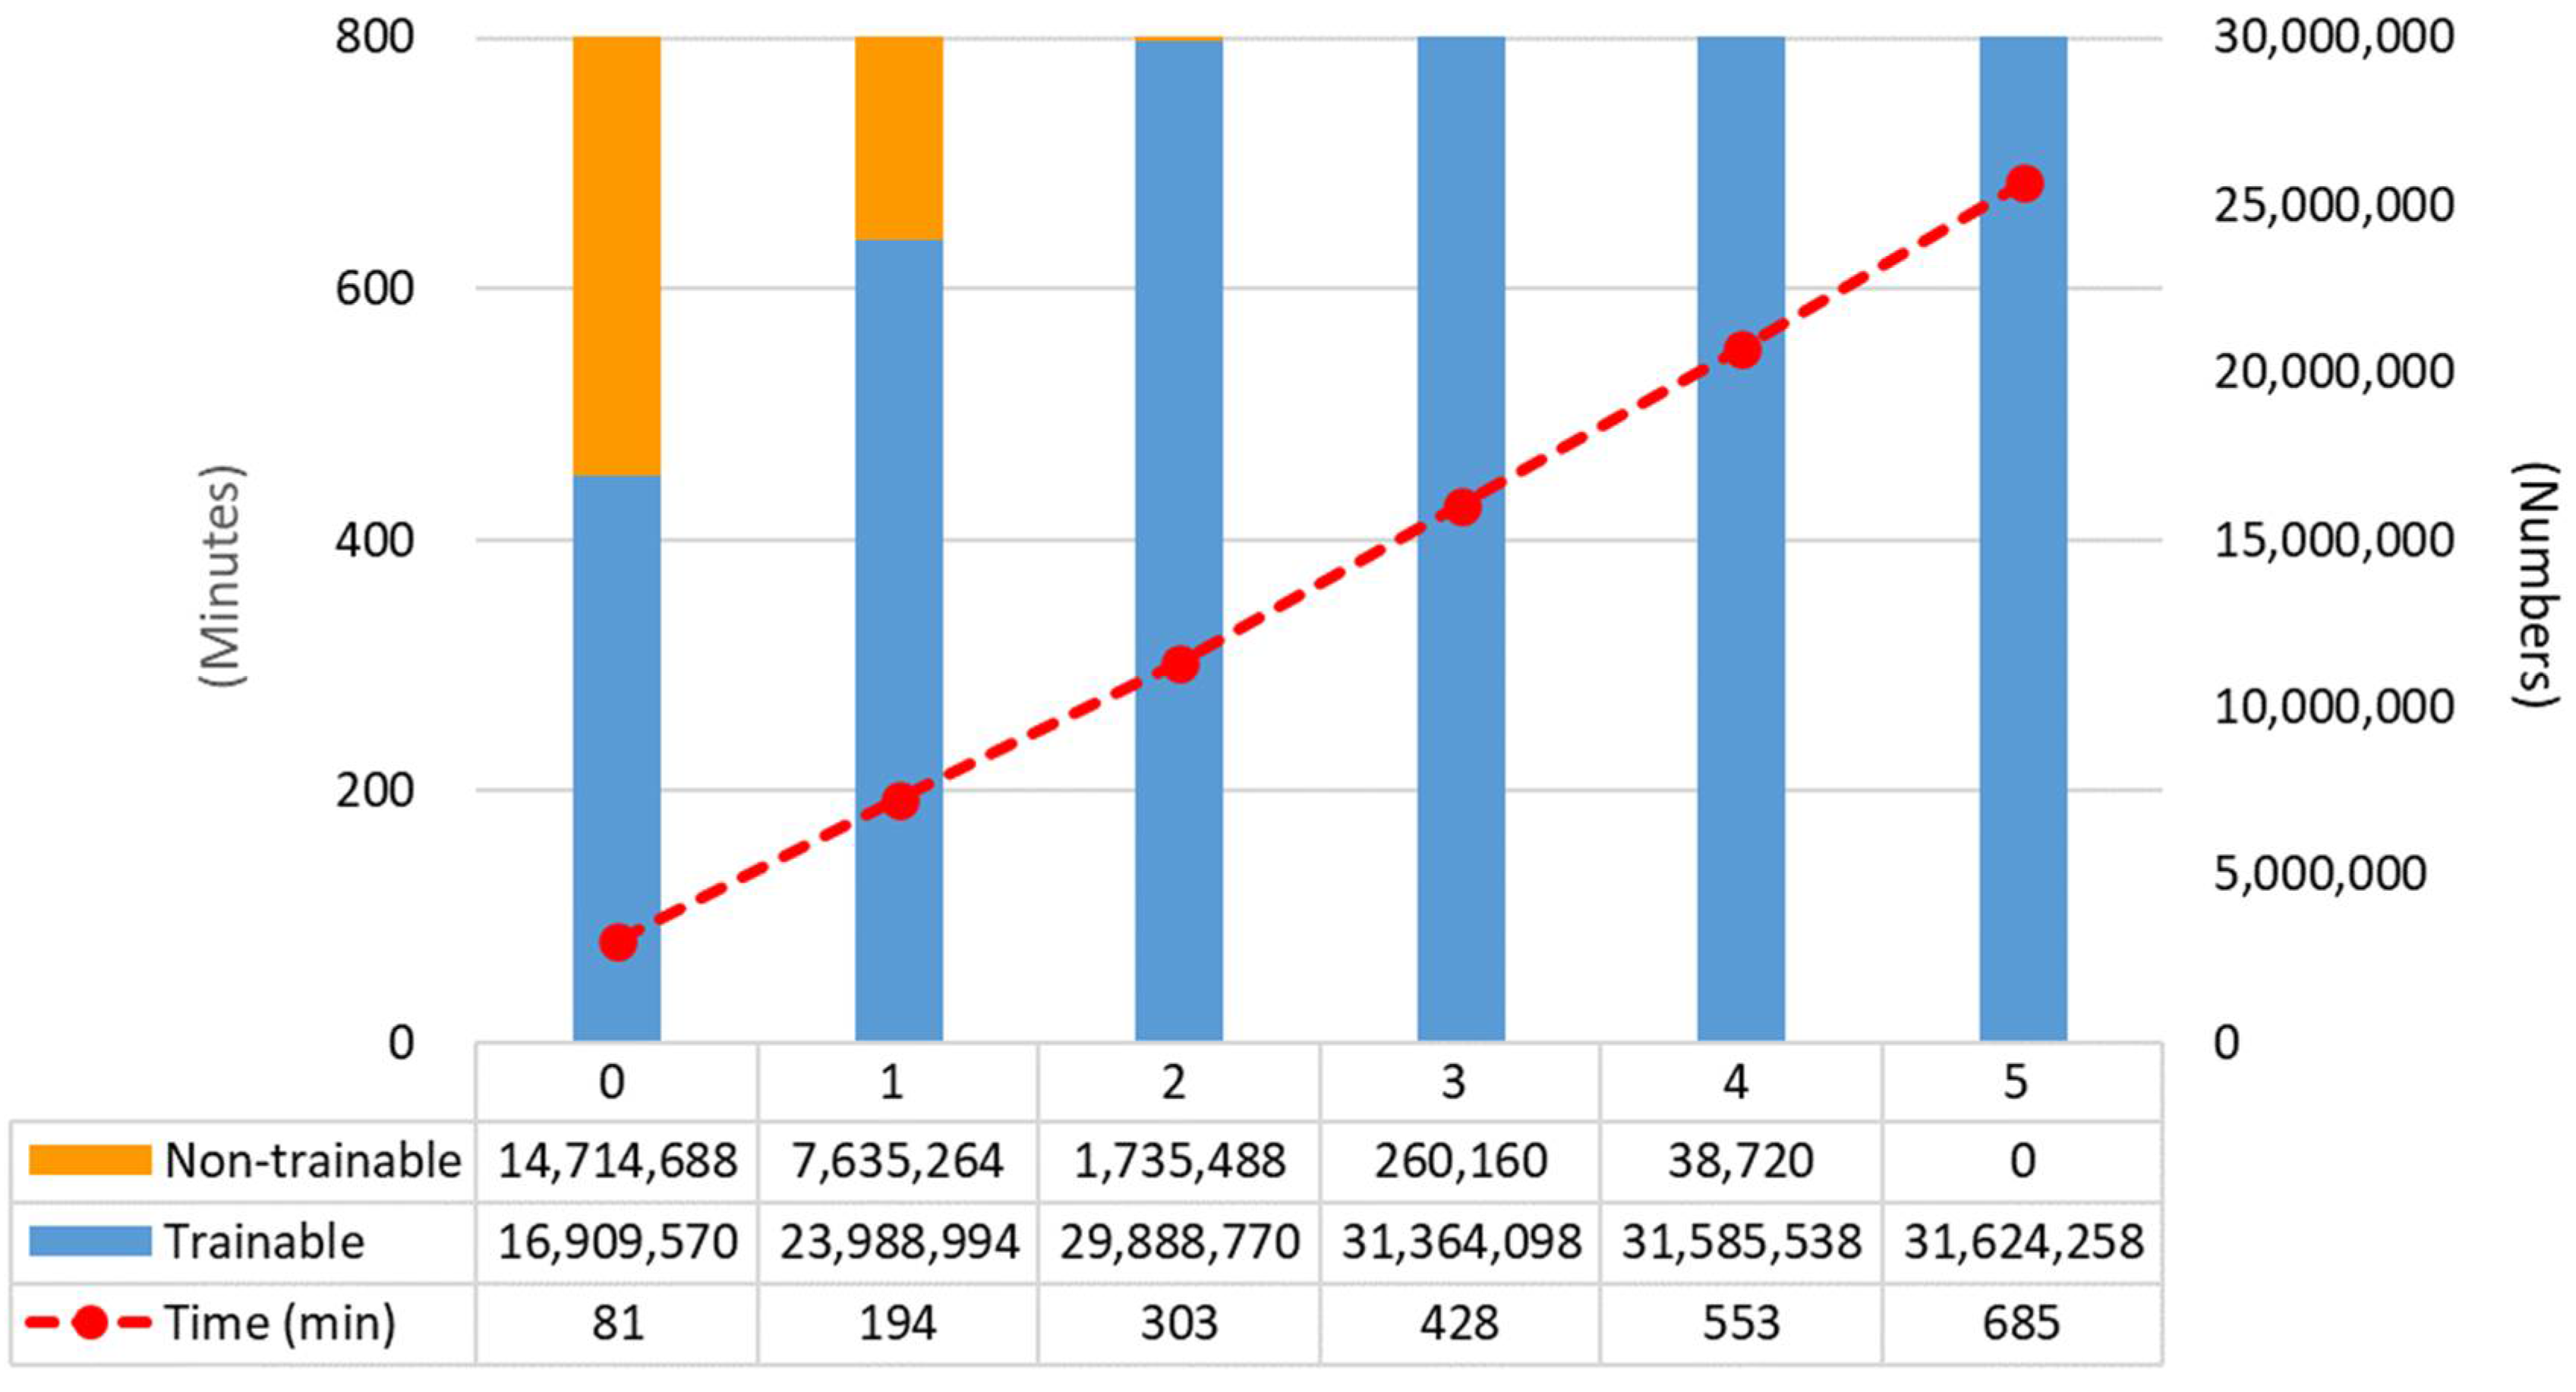
2.4. Training
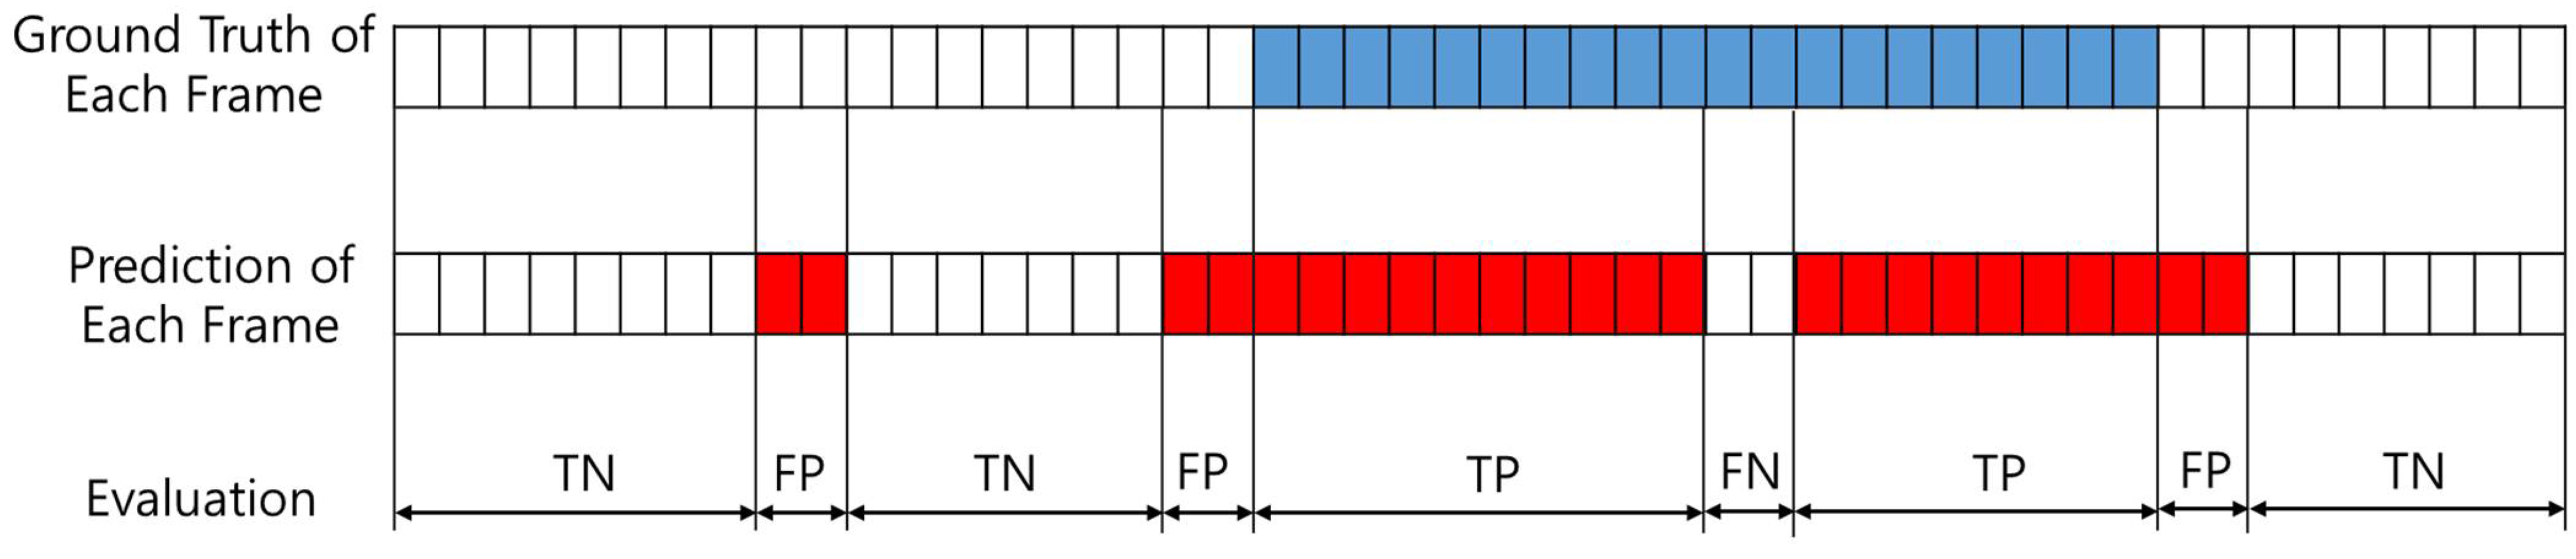
2.5. Performance Evaluation
3. Results
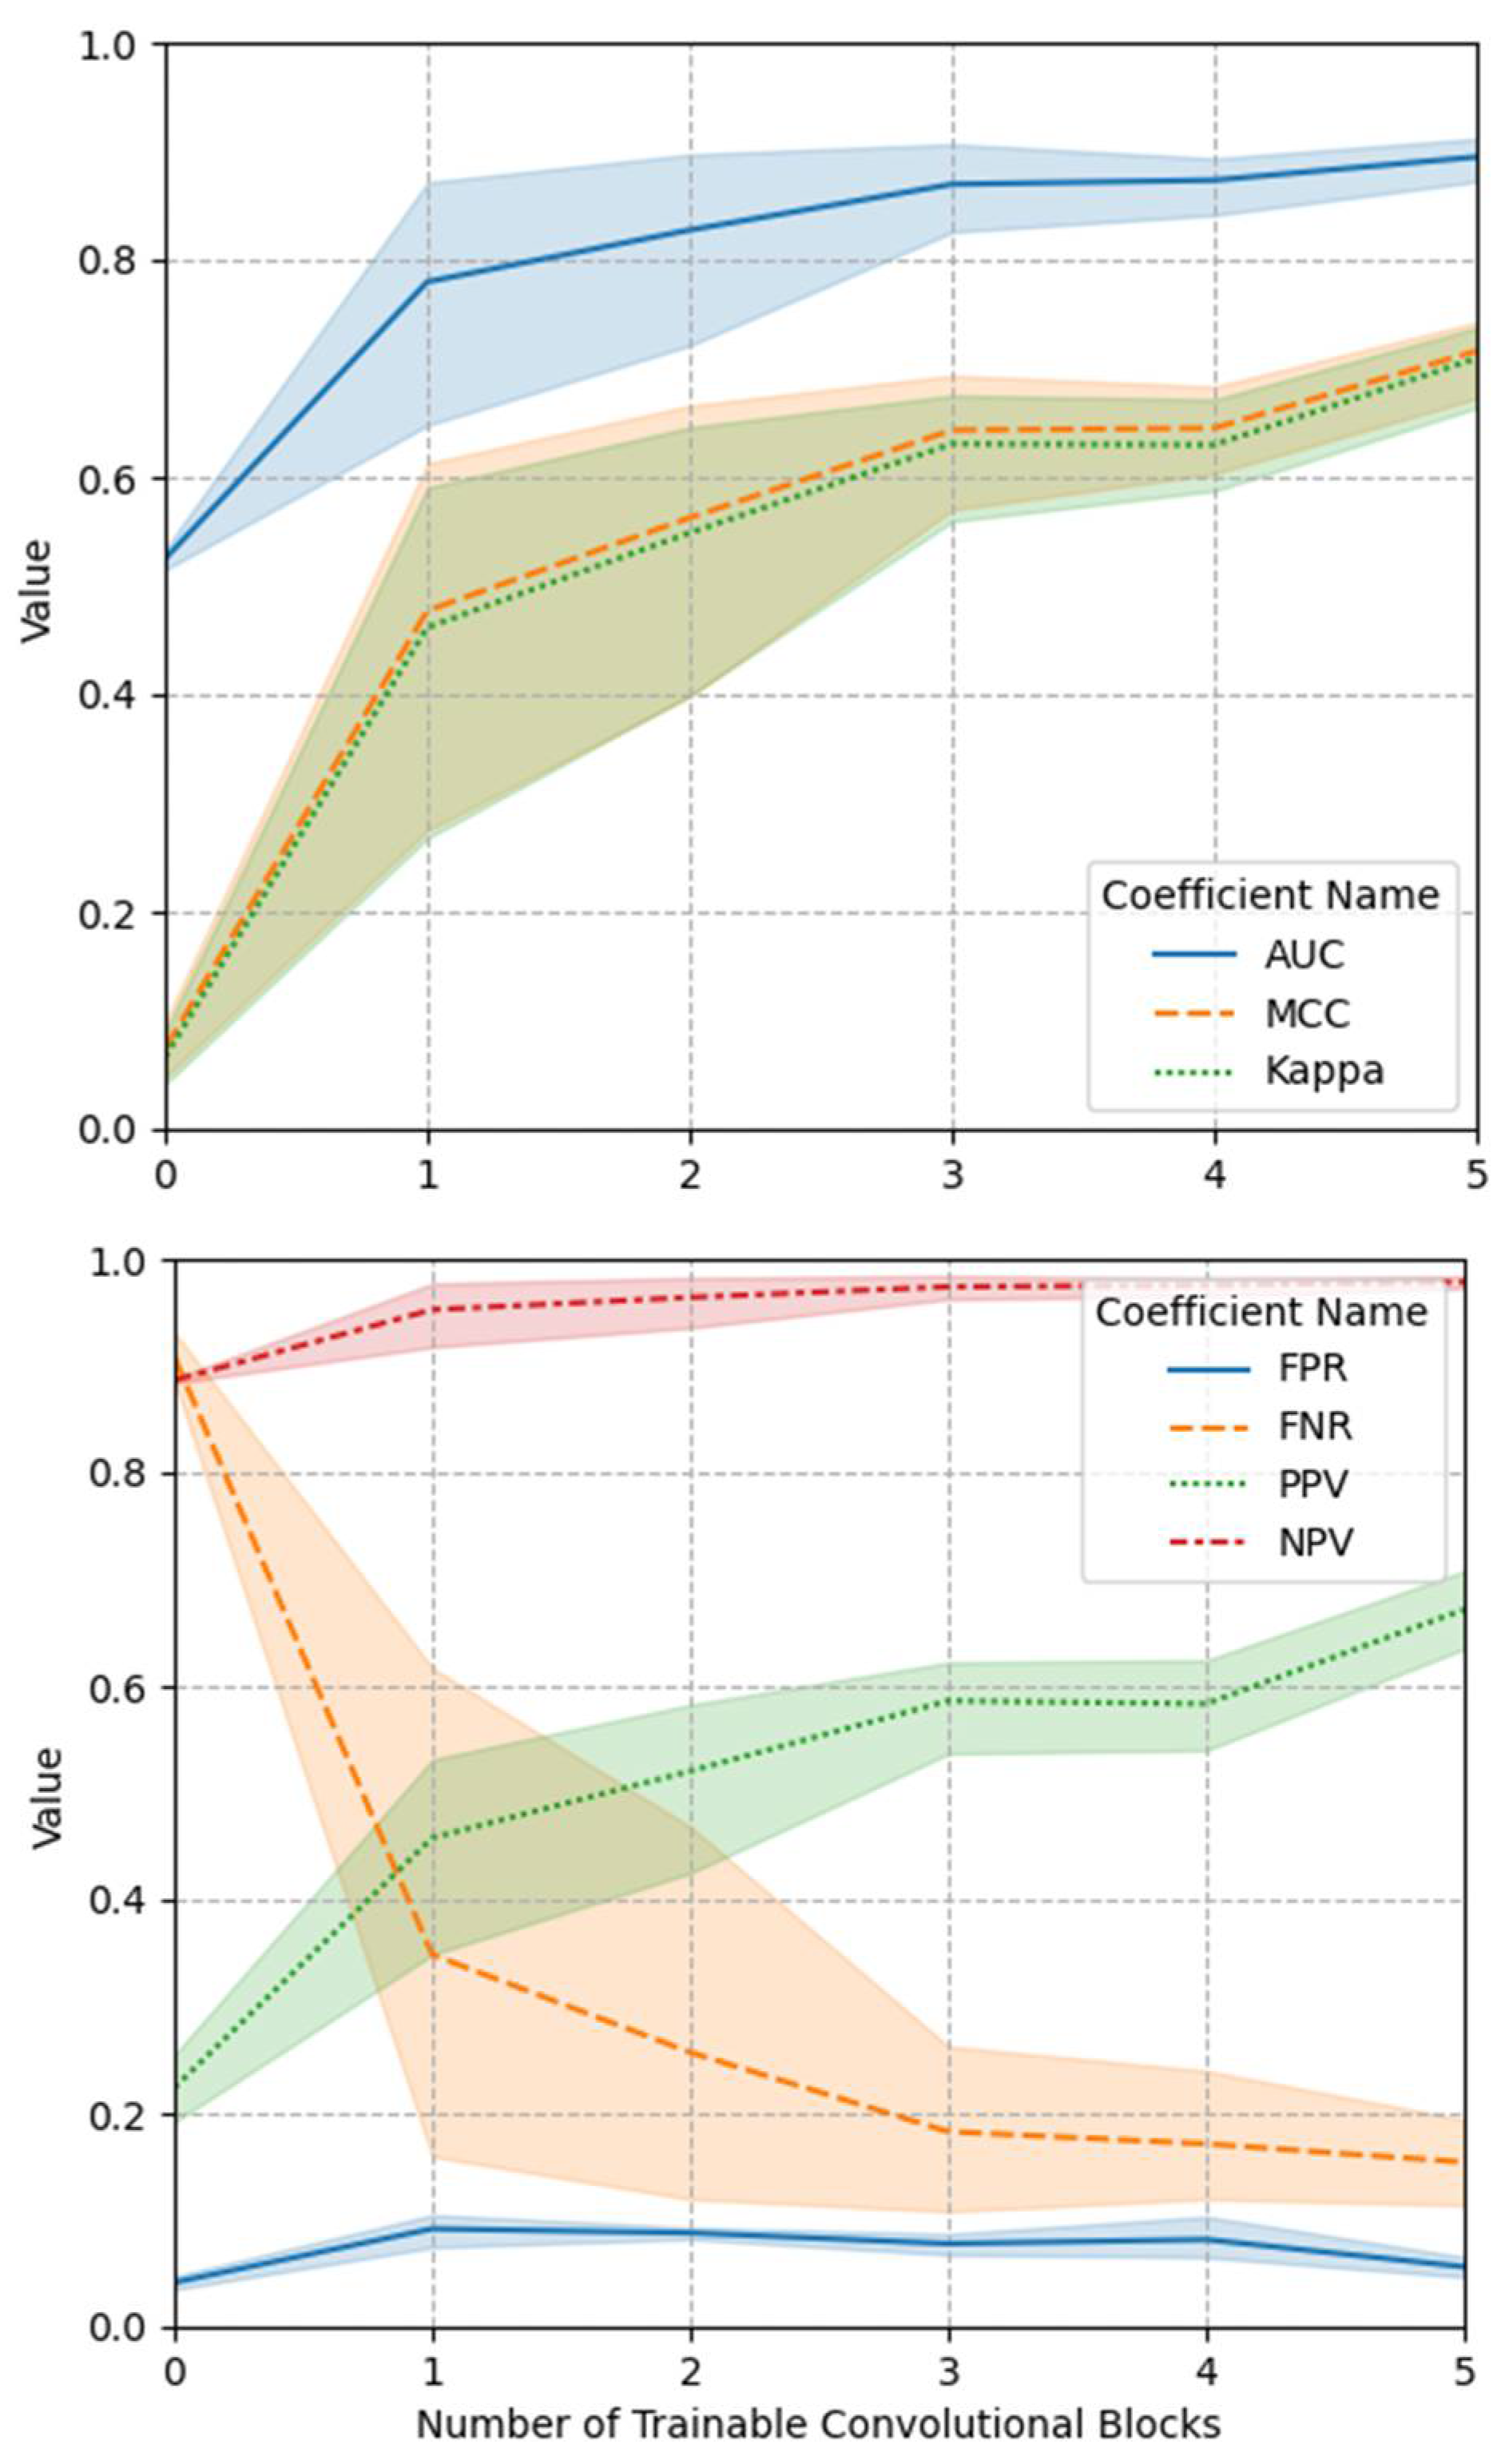
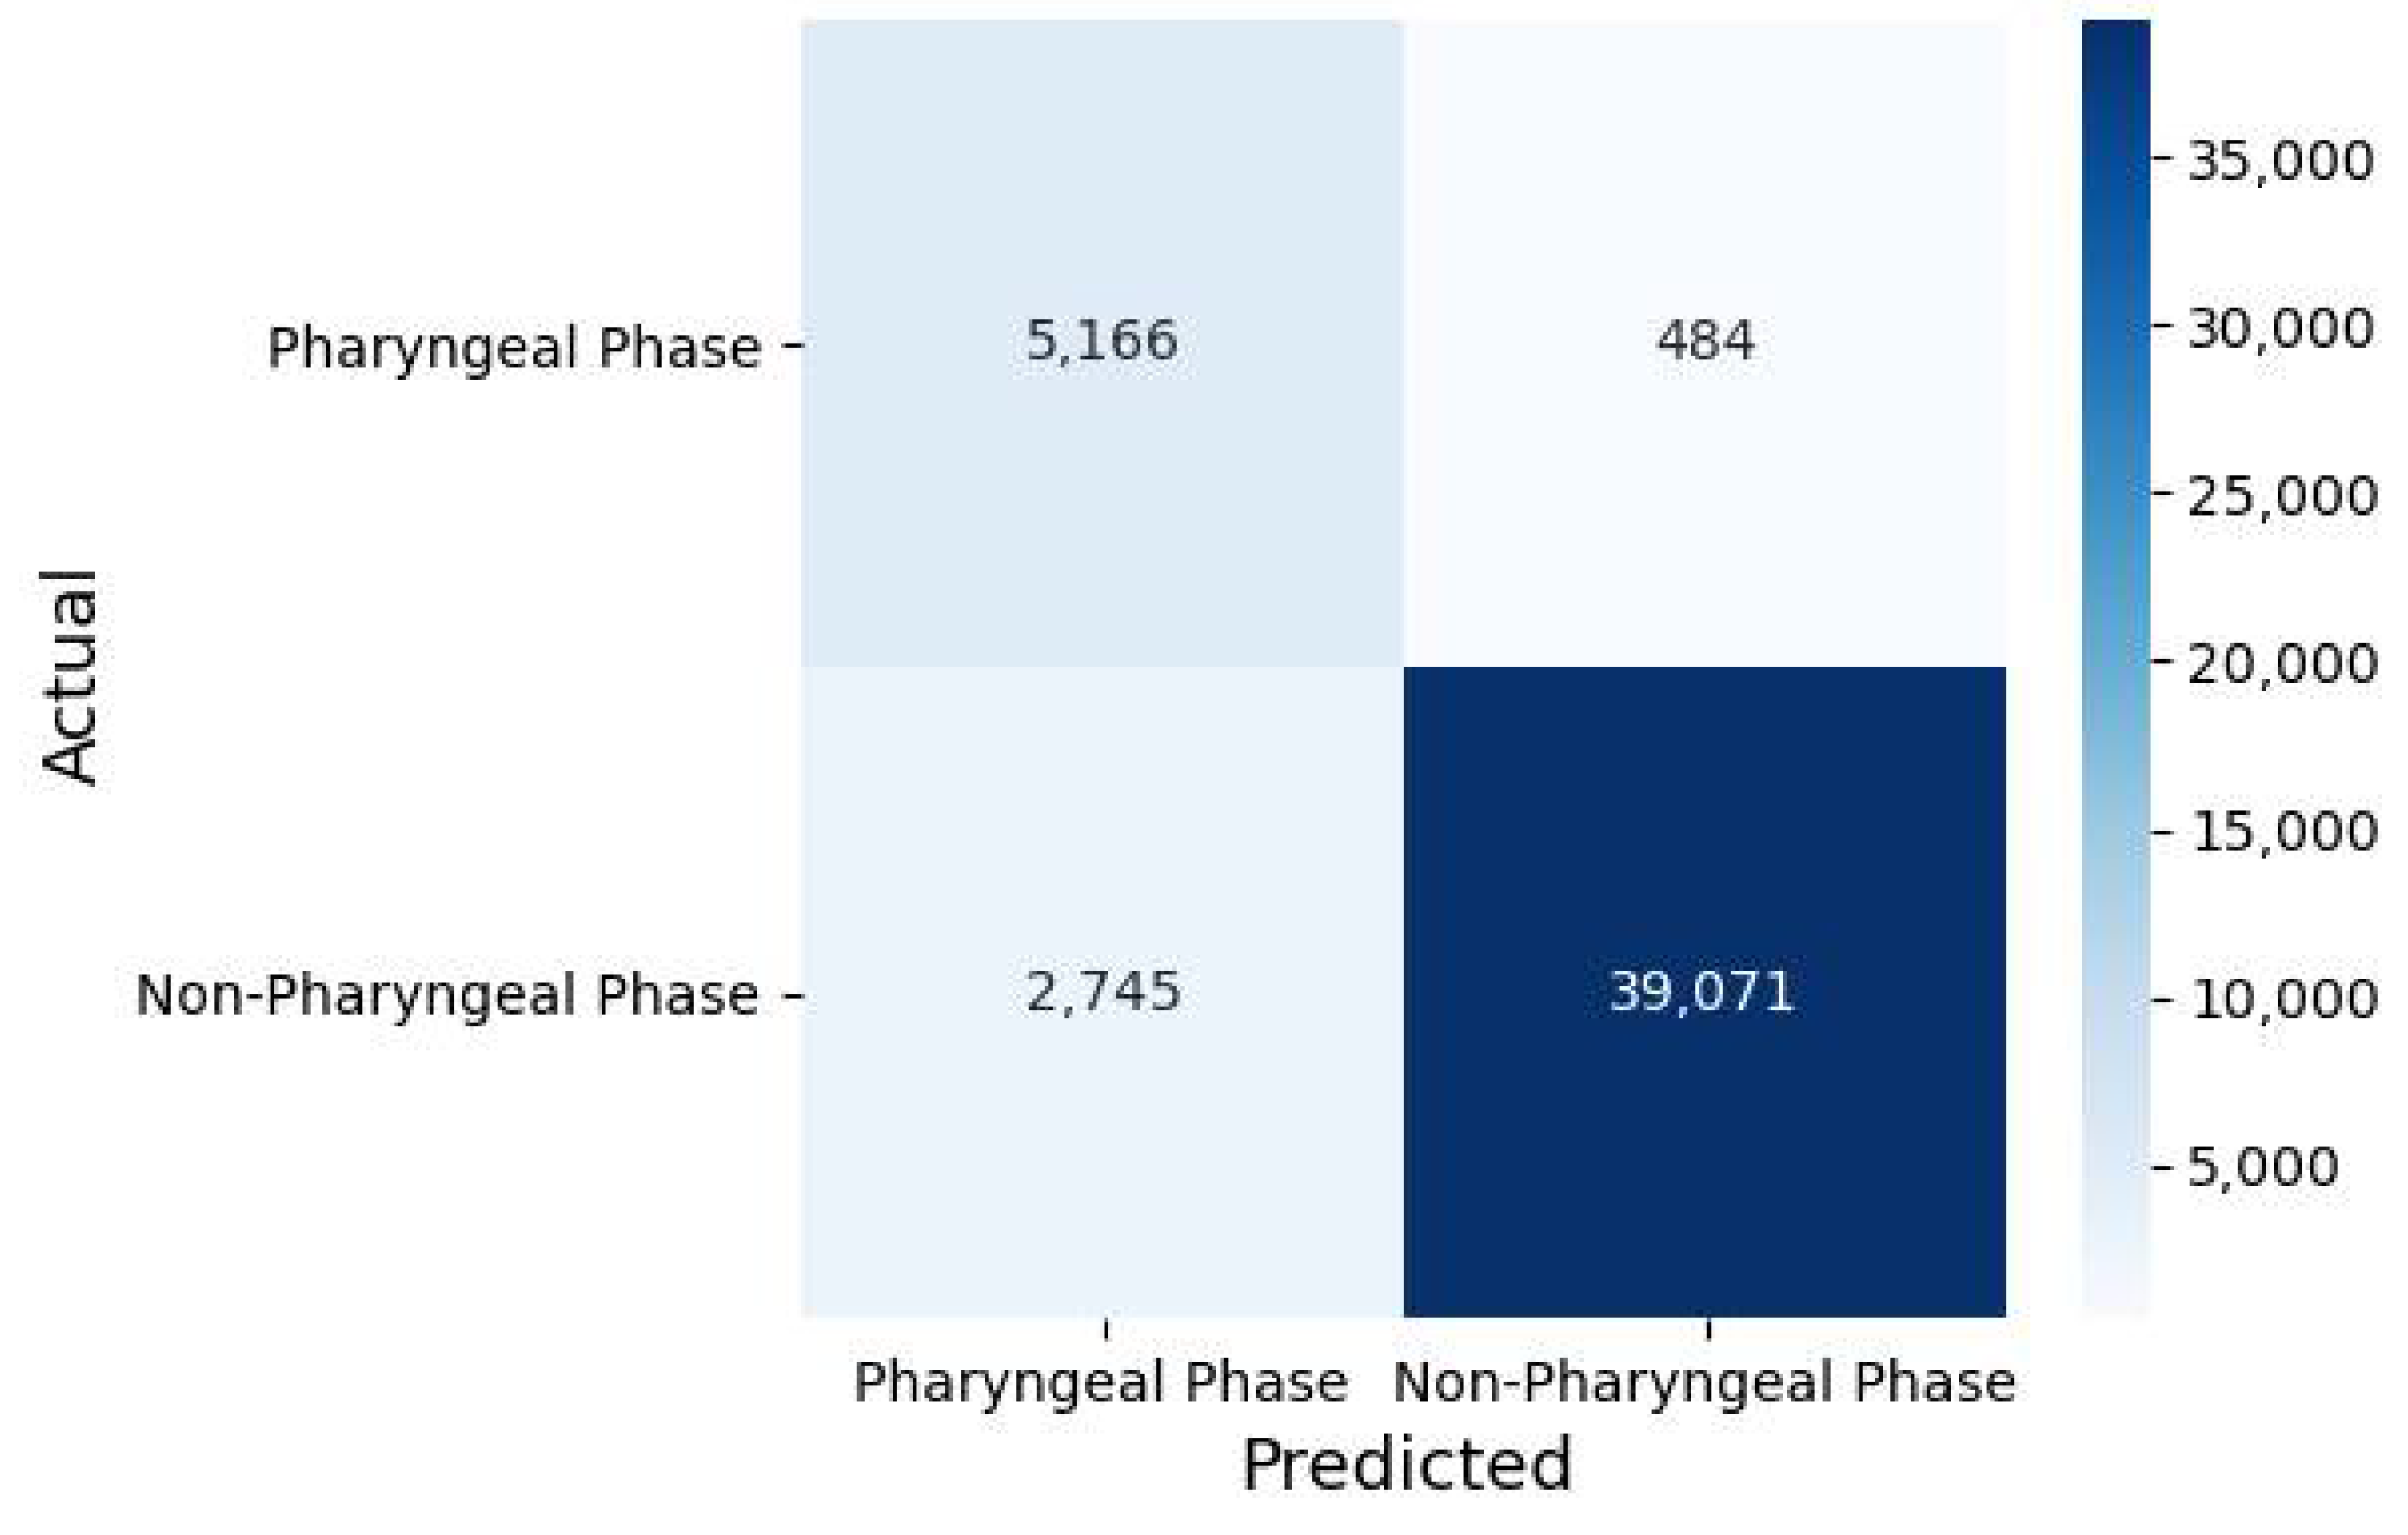
3.1. Classification Performance
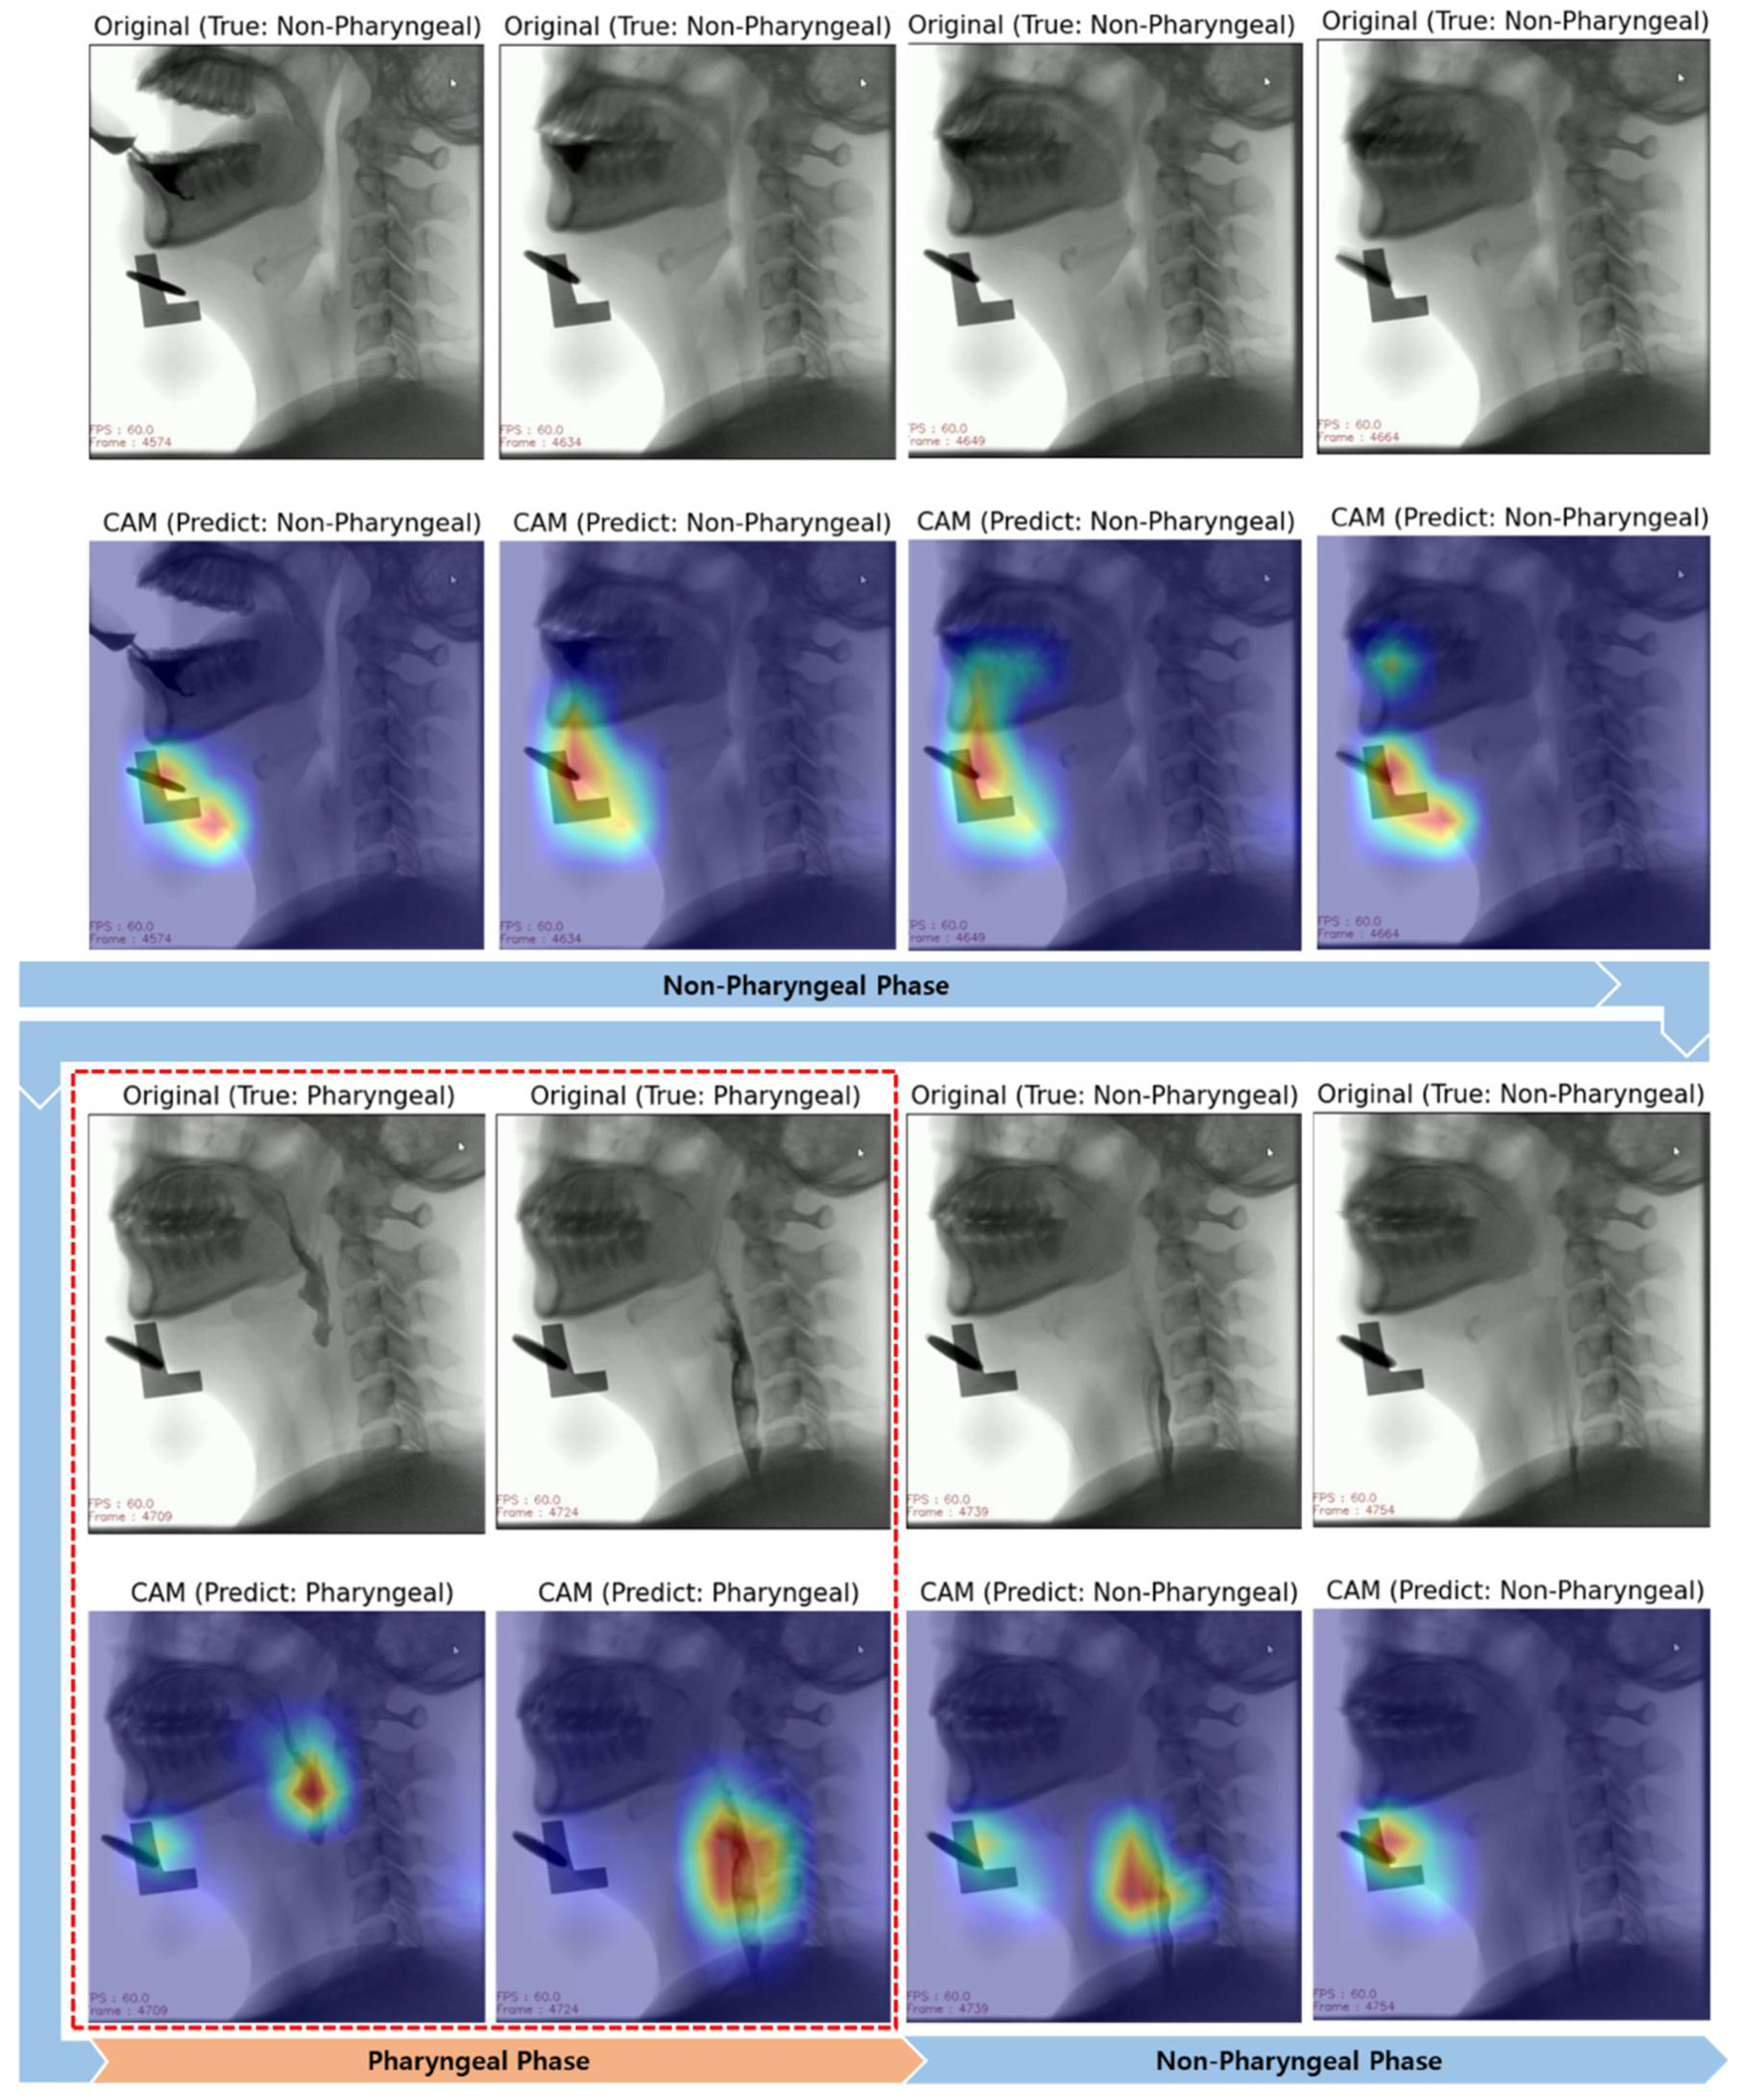
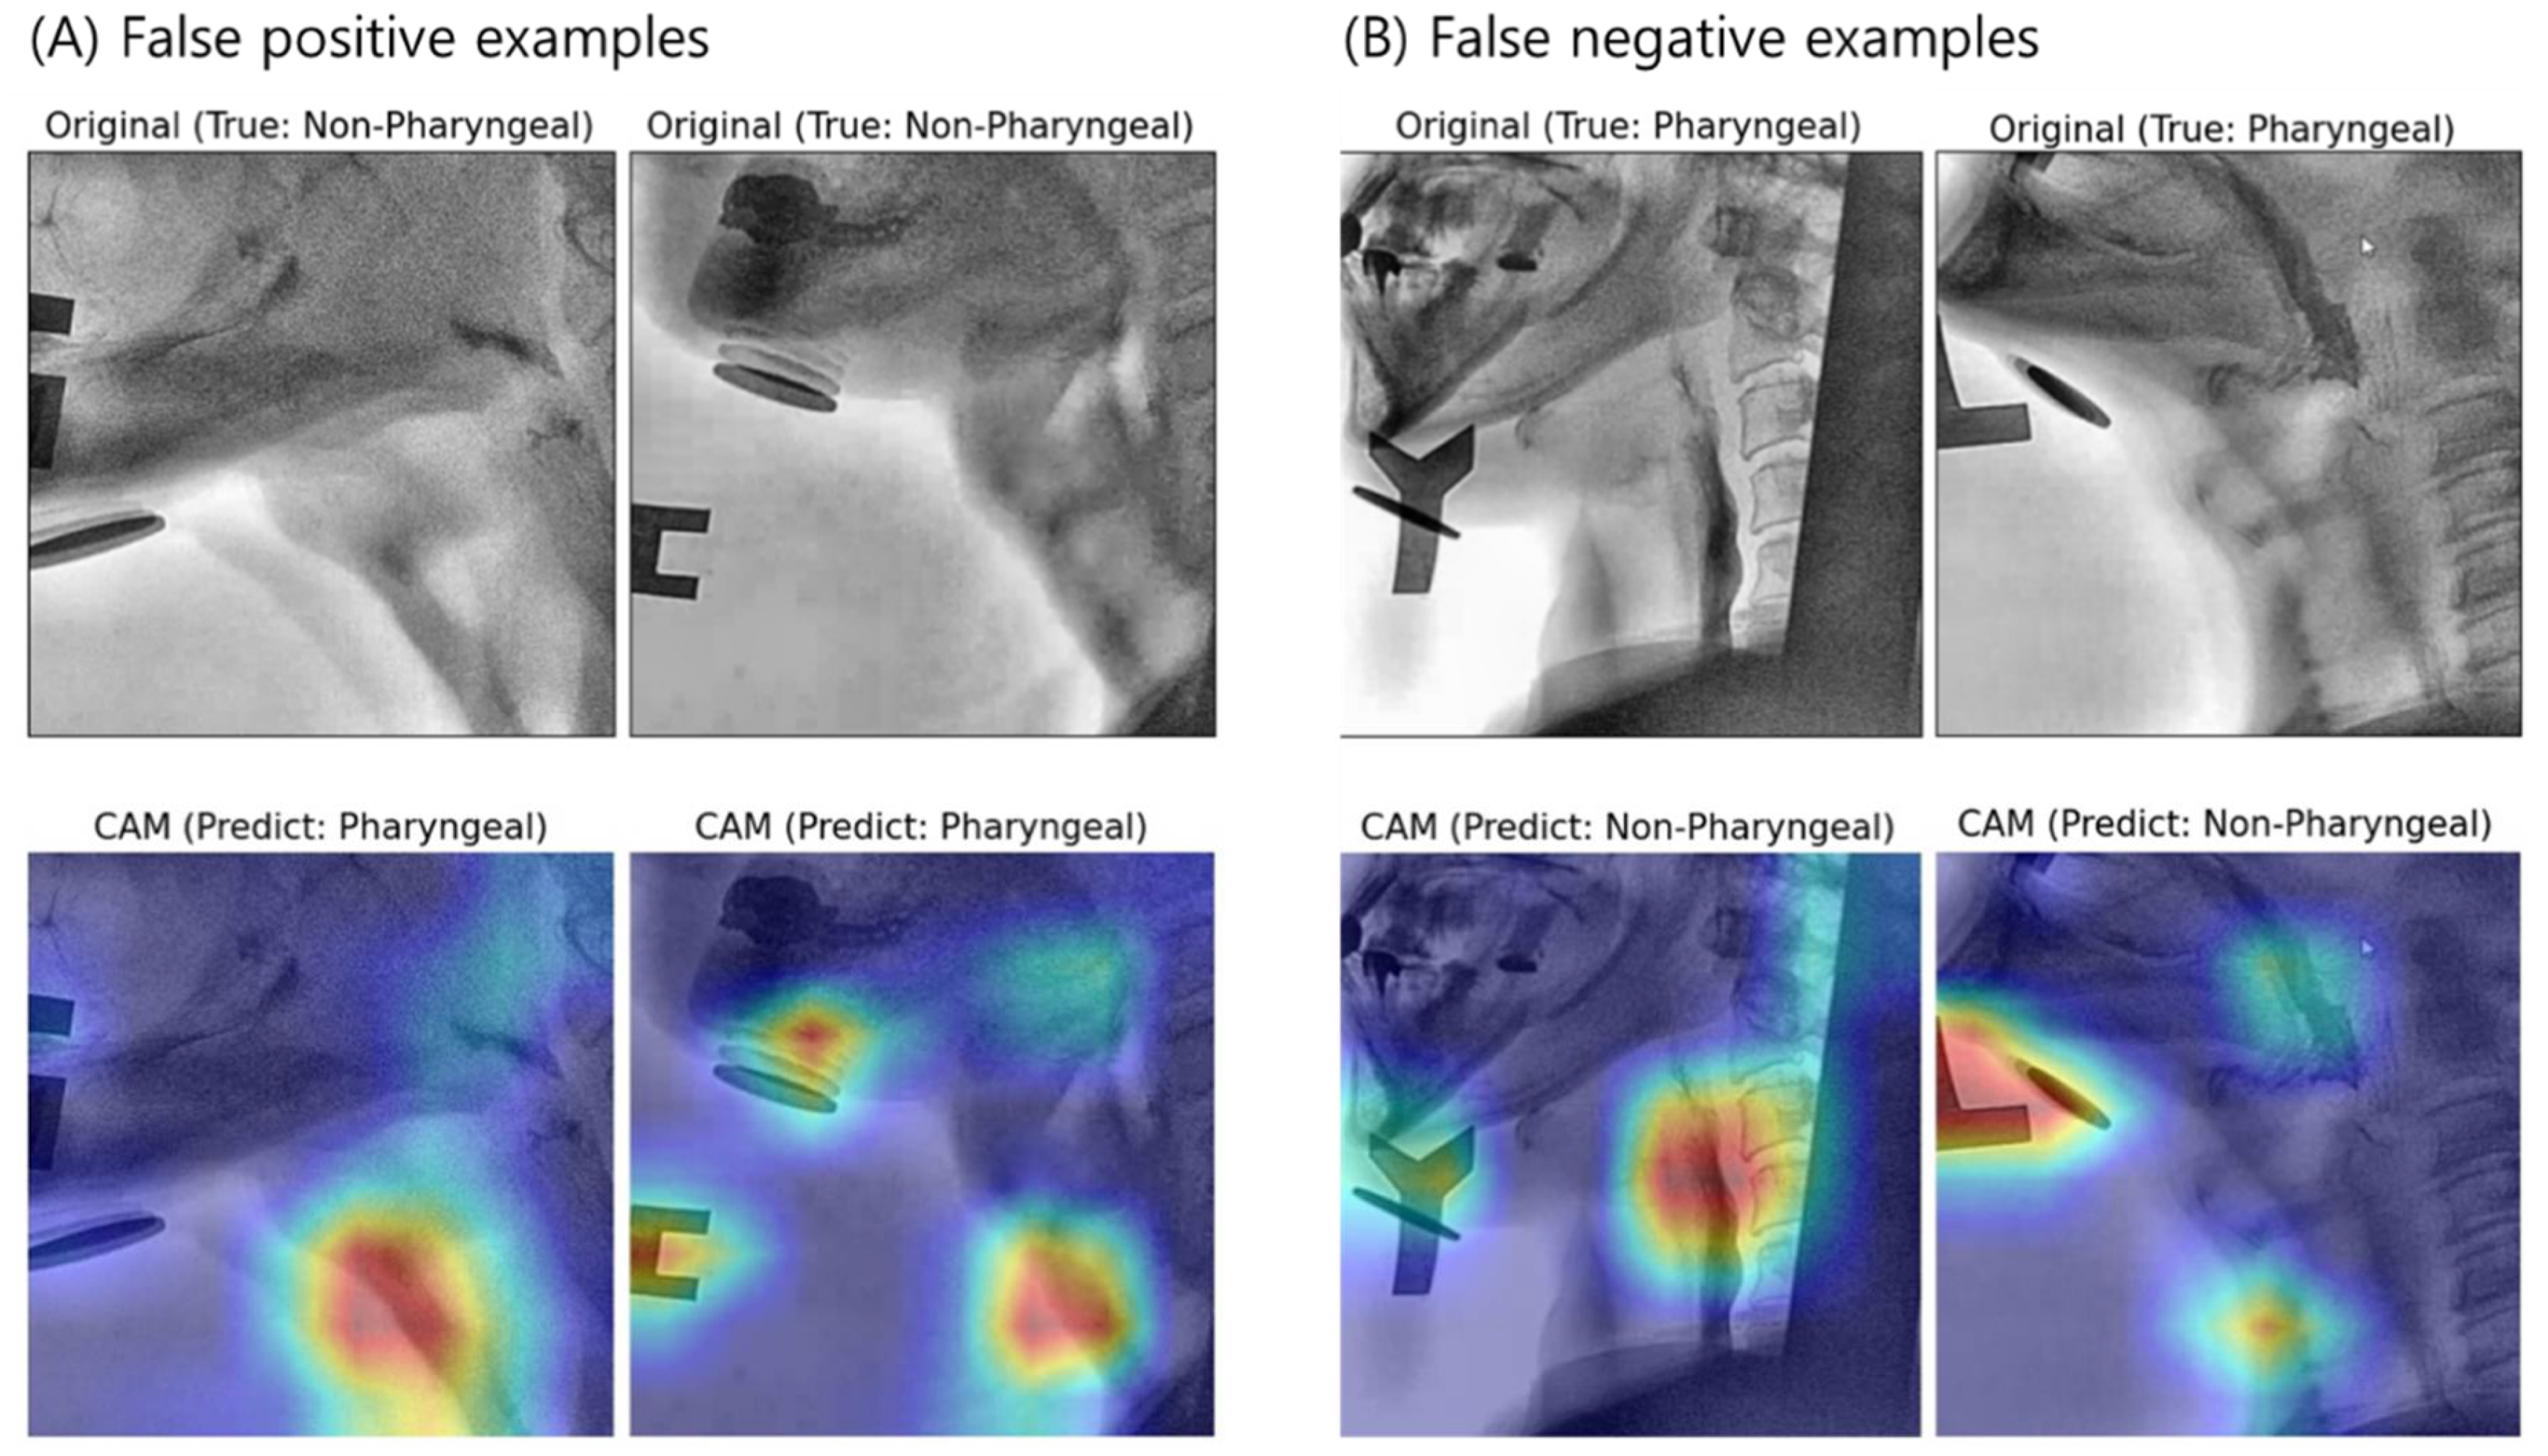
3.2. Interpretation of Model Decision Using Grad-CAM
4. Discussion
4.1. Fine-Tuning Degree of Deep CNN
4.2. Visual Interpretation Using Grad-CAM
4.3. Limitations
5. Conclusions
Supplementary Materials
Author Contributions
Funding
Institutional Review Board Statement
Informed Consent Statement
Conflicts of Interest
References
- Wieseke, A.; Bantz, D.; Siktberg, L.; Dillard, N. Assessment and early diagnosis of dysphagia. Geriatr. Nurs. 2008, 29, 376–383. [Google Scholar] [CrossRef]
- Gordon, C.; Hewer, R.L.; Wade, D.T. Dysphagia in acute stroke. Br. Med. J. Clin. Res. Ed. 1987, 295, 411–414. [Google Scholar] [CrossRef] [PubMed]
- Horiguchi, S.; Suzuki, Y. Screening tests in evaluating swallowing function. JMAJ 2011, 54, 31–34. [Google Scholar]
- Moraes, D.; Sassi, F.; Mangilli, L.; Zilberstein, B.; De Andrade, C. Clinical prognostic indicators of dysphagia following prolonged orotracheal intubation in ICU patients. Crit. Care 2013, 17, R243. [Google Scholar] [CrossRef]
- Heffner, J.E. Swallowing complications after endotracheal extubation: Moving from “whether” to “how”. Chest 2010, 137, 509–510. [Google Scholar] [CrossRef]
- Macht, M.; Wimbish, T.; Bodine, C.; Moss, M. ICU-acquired swallowing disorders. Crit. Care Med. 2013, 41, 2396–2405. [Google Scholar] [CrossRef]
- Martino, R.; Pron, G.; Diamant, N. Screening for oropharyngeal dysphagia in stroke: Insufficient evidence for guidelines. Dysphagia 2000, 15, 19–30. [Google Scholar] [CrossRef]
- Cook, I.J.; Kahrilas, P.J. AGA technical review on management of oropharyngeal dysphagia. Gastroenterology 1999, 116, 455–478. [Google Scholar] [CrossRef]
- Palmer, J.B.; Kuhlemeier, K.V.; Tippett, D.C.; Lynch, C. A protocol for the videofluorographic swallowing study. Dysphagia 1993, 8, 209–214. [Google Scholar] [CrossRef] [PubMed]
- Shem, K.L.; Castillo, K.; Wong, S.L.; Chang, J.; Kao, M.C.; Kolakowsky-Hayner, S.A. Diagnostic accuracy of bedside swallow evaluation versus videofluoroscopy to assess dysphagia in individuals with tetraplegia. PMR 2012, 4, 283–289. [Google Scholar] [CrossRef]
- Zhang, Z.; Coyle, J.L.; Sejdić, E. Automatic hyoid bone detection in fluoroscopic images using deep learning. Sci. Rep. 2018, 8, 12310. [Google Scholar] [CrossRef]
- McCullough, G.H.; Wertz, R.T.; Rosenbek, J.C.; Mills, R.H.; Webb, W.G.; Ross, K.B. Inter-and intrajudge reliability for videofluoroscopic swallowing evaluation measures. Dysphagia 2001, 16, 110–118. [Google Scholar] [CrossRef]
- Han, H.; Shin, G.; Jun, A.; Park, T.; Ko, D.; Choi, E.; Kim, Y. The relation between the presence of aspiration or penetration and the clinical indicators of dysphagia in poststroke survivors. Ann. Rehabil. Med. 2016, 40, 88. [Google Scholar] [CrossRef] [PubMed]
- Tran, D.; Bourdev, L.; Fergus, R.; Torresani, L.; Paluri, M. Learning spatiotemporal features with 3d convolutional networks. In Proceedings of the IEEE International Conference on Computer Vision, Las Condes, Chile, 11–18 December 2015; pp. 4489–4497. [Google Scholar]
- Zhang, L.; Zhu, G.; Shen, P.; Song, J.; Afaq Shah, S.; Bennamoun, M. Learning spatiotemporal features using 3dcnn and convolutional lstm for gesture recognition. In Proceedings of Proceedings of the IEEE International Conference on Computer Vision Workshops, Venice, Italy, 22–29 October 2017; pp. 3120–3128. [Google Scholar]
- Lee, J.T.; Park, E.; Jung, T.-D. Automatic detection of the pharyngeal phase in raw videos for the videofluoroscopic swallowing study using efficient data collection and 3d convolutional networks. Sensors 2019, 19, 3873. [Google Scholar] [CrossRef] [PubMed]
- Xiong, Y.; Zhao, Y.; Wang, L.; Lin, D.; Tang, X. A pursuit of temporal accuracy in general activity detection. arXiv 2017, arXiv:1703.02716. [Google Scholar]
- Lee, J.T.; Park, E.; Hwang, J.-M.; Jung, T.-D.; Park, D. Machine learning analysis to automatically measure response time of pharyngeal swallowing reflex in videofluoroscopic swallowing study. Sci. Rep. 2020, 10, 14735. [Google Scholar] [CrossRef]
- Karpathy, A.; Toderici, G.; Shetty, S.; Leung, T.; Sukthankar, R.; Fei-Fei, L. Large-scale video classification with convolutional neural networks. In Proceedings of the IEEE Conference on Computer Vision and Pattern Recognition, Columbus, OH, USA, 23–28 June 2014; pp. 1725–1732. [Google Scholar]
- Valueva, M.V.; Nagornov, N.; Lyakhov, P.A.; Valuev, G.V.; Chervyakov, N.I. Application of the residue number system to reduce hardware costs of the convolutional neural network implementation. Math. Comput. Simul. 2020, 177, 232–243. [Google Scholar] [CrossRef]
- Simonyan, K.; Zisserman, A. Very deep convolutional networks for large-scale image recognition. arXiv 2014, arXiv:1409.1556. [Google Scholar]
- Litjens, G.; Kooi, T.; Bejnordi, B.E.; Setio, A.A.A.; Ciompi, F.; Ghafoorian, M.; Van Der Laak, J.A.; Van Ginneken, B.; Sánchez, C.I. A survey on deep learning in medical image analysis. Med. Image Anal. 2017, 42, 60–88. [Google Scholar] [CrossRef]
- Yosinski, J.; Clune, J.; Bengio, Y.; Lipson, H. How transferable are features in deep neural networks? In Proceedings of the Advances in Neural Information Processing Systems, Montreal, QC, Canada, 8–13 December 2014; pp. 3320–3328. [Google Scholar]
- Pan, S.J.; Yang, Q. A survey on transfer learning. IEEE Trans. Knowl. Data Eng. 2009, 22, 1345–1359. [Google Scholar] [CrossRef]
- Stone, M. Cross-validatory choice and assessment of statistical predictions. J. R. Stat. Soc. Ser. B Methodol. 1974, 36, 111–133. [Google Scholar] [CrossRef]
- Chollet, F. Keras: The Python Deep Learning Library. Available online: https://ui.adsabs.harvard.edu/abs/2018ascl.soft06022C (accessed on 14 November 2020).
- Abadi, M.; Agarwal, A.; Barham, P.; Brevdo, E.; Chen, Z.; Citro, C.; Corrado, G.S.; Davis, A.; Dean, J.; Devin, M. Tensorflow: Large-scale machine learning on heterogeneous distributed systems. arXiv 2016, arXiv:1603.04467. [Google Scholar]
- Ott, D.J.; Pikna, L.A. Clinical and videofluoroscopic evaluation of swallowing disorders. AJR Am. J. Roentgenol. 1993, 161, 507–513. [Google Scholar] [CrossRef] [PubMed]
- Rademaker, A.W.; Pauloski, B.R.; Logemann, J.A.; Shanahan, T.K. Oropharyngeal swallow efficiency as a representative measure of swallowing function. J. Speech Lang. Hear. Res. 1994, 37, 314–325. [Google Scholar] [CrossRef]
- Ertekin, C.; Aydogdu, I. Neurophysiology of swallowing. Clin. Neurophysiol. 2003, 114, 2226–2244. [Google Scholar] [CrossRef]
- Tajbakhsh, N.; Shin, J.Y.; Gurudu, S.R.; Hurst, R.T.; Kendall, C.B.; Gotway, M.B.; Liang, J. Convolutional neural networks for medical image analysis: Full training or fine tuning? IEEE Trans. Med. Imaging 2016, 35, 1299–1312. [Google Scholar] [CrossRef]
- Xiao, T.; Liu, L.; Li, K.; Qin, W.; Yu, S.; Li, Z. Comparison of transferred deep neural networks in ultrasonic breast masses discrimination. BioMed Res. Int. 2018, 2018, 4605191. [Google Scholar] [CrossRef] [PubMed]
- Lee, K.-S.; Jung, S.-K.; Ryu, J.-J.; Shin, S.-W.; Choi, J. Evaluation of Transfer Learning with Deep Convolutional Neural Networks for Screening Osteoporosis in Dental Panoramic Radiographs. J. Clin. Med. 2020, 9, 392. [Google Scholar] [CrossRef] [PubMed]
- Lee, K.-S.; Kim, J.Y.; Jeon, E.-T.; Choi, W.S.; Kim, N.H.; Lee, K.Y. Evaluation of Scalability and Degree of Fine-Tuning of Deep Convolutional Neural Networks for COVID-19 Screening on Chest X-ray Images Using Explainable Deep-Learning Algorithm. J. Pers. Med. 2020, 10, 213. [Google Scholar] [CrossRef]
- Selvaraju, R.R.; Cogswell, M.; Das, A.; Vedantam, R.; Parikh, D.; Batra, D. Grad-cam: Visual explanations from deep networks via gradient-based localization. In Proceedings of the IEEE International Conference on Computer Vision, Venice, Italy, 22–29 October 2017; pp. 618–626. [Google Scholar]
- Oakden-Rayner, L. Exploring large-scale public medical image datasets. Acad. Radiol. 2020, 27, 106–112. [Google Scholar] [CrossRef]
- Jager, J.; Putnick, D.L.; Bornstein, M.H., II. More than just convenient: The scientific merits of homogeneous convenience samples. Monogr. Soc. Res. Child Dev. 2017, 82, 13–30. [Google Scholar] [CrossRef] [PubMed]


| Number of Fine-Tuning Blocks | 0 | 1 | 2 | 3 | 4 | 5 |
|---|---|---|---|---|---|---|
| Accuracy (ACC) | 0.8551 (±0.0046) | 0.8776 (±0.0214) | 0.8918 (±0.0298) | 0.9095 (±0.0184) | 0.9075 (±0.0176) | 0.9320 (±0.0125) |
| Sensitivity (TPR) | 0.0914 (±0.0313) | 0.6514 (±0.3040) | 0.7429 (±0.2312) | 0.8171 (±0.1061) | 0.8286 (±0.0833) | 0.8457 (±0.0519) |
| Specificity (TNR) | 0.9583 (±0.0079) | 0.9081 (±0.0207) | 0.9120 (±0.0069) | 0.9220 (±0.0129) | 0.9181 (±0.0242) | 0.9436 (±0.0121) |
| FPR | 0.0417 (±0.0079) | 0.0919 (±0.0207) | 0.0880 (±0.0069) | 0.0780 (±0.0129) | 0.0819 (±0.0242) | 0.0564 (±0.0121) |
| FNR | 0.9086 (±0.0313) | 0.3486 (±0.3040) | 0.2571 (±0.2312) | 0.1829 (±0.1061) | 0.1714 (±0.0833) | 0.1543 (±0.0519) |
| PPV | 0.2240 (±0.0437) | 0.4580 (±0.1224) | 0.5204 (±0.1064) | 0.5863 (±0.0576) | 0.5835 (±0.0561) | 0.6719 (±0.0498) |
| NPV | 0.8864 (±0.0028) | 0.9526 (±0.0378) | 0.9641 (±0.0308) | 0.9740 (±0.0149) | 0.9756 (±0.0111) | 0.9784 (±0.0072) |
| DOR | 2.29 (±0.64) | 32.40 (±23.87) | 52.27 (±34.02) | 74.00 (±44.04) | 63.63 (±20.95) | 104.91 (±36.92) |
| AUC | 0.5249 (±0.0127) | 0.7798 (±0.1428) | 0.8274 (±0.1166) | 0.8696 (±0.0546) | 0.8734 (±0.0361) | 0.8947 (±0.0269) |
| MCC | 0.0739 (±0.0343) | 0.4771 (±0.2185) | 0.5626 (±0.1803) | 0.6432 (±0.0836) | 0.6452 (±0.0500) | 0.7161 (±0.0482) |
| Kappa | 0.0661 (±0.0323) | 0.4616 (±0.2107) | 0.5487 (±0.1720) | 0.6305 (±0.0796) | 0.6297 (±0.0528) | 0.7093 (±0.0488) |
Publisher’s Note: MDPI stays neutral with regard to jurisdictional claims in published maps and institutional affiliations. |
© 2021 by the authors. Licensee MDPI, Basel, Switzerland. This article is an open access article distributed under the terms and conditions of the Creative Commons Attribution (CC BY) license (http://creativecommons.org/licenses/by/4.0/).
Share and Cite
Lee, K.-S.; Lee, E.; Choi, B.; Pyun, S.-B. Automatic Pharyngeal Phase Recognition in Untrimmed Videofluoroscopic Swallowing Study Using Transfer Learning with Deep Convolutional Neural Networks. Diagnostics 2021, 11, 300. https://doi.org/10.3390/diagnostics11020300
Lee K-S, Lee E, Choi B, Pyun S-B. Automatic Pharyngeal Phase Recognition in Untrimmed Videofluoroscopic Swallowing Study Using Transfer Learning with Deep Convolutional Neural Networks. Diagnostics. 2021; 11(2):300. https://doi.org/10.3390/diagnostics11020300
Chicago/Turabian StyleLee, Ki-Sun, Eunyoung Lee, Bareun Choi, and Sung-Bom Pyun. 2021. "Automatic Pharyngeal Phase Recognition in Untrimmed Videofluoroscopic Swallowing Study Using Transfer Learning with Deep Convolutional Neural Networks" Diagnostics 11, no. 2: 300. https://doi.org/10.3390/diagnostics11020300
APA StyleLee, K.-S., Lee, E., Choi, B., & Pyun, S.-B. (2021). Automatic Pharyngeal Phase Recognition in Untrimmed Videofluoroscopic Swallowing Study Using Transfer Learning with Deep Convolutional Neural Networks. Diagnostics, 11(2), 300. https://doi.org/10.3390/diagnostics11020300