1. Introduction
Retinopathy of Prematurity (ROP) impacts preterm infants and could cause blindness. Screening and Diagnosing procedures of ROP have several barriers in developing countries [
1]. Initially, there are inadequate amounts of medical screening/imaging equipment for ROP. Also, the number of staff for airing retinal images for ROP is relatively small. Moreover, ophthalmologists’ training procedure is not consistent, and the qualified ophthalmologists are of few numbers. In addition, the application of the ROP screening policy is insufficient in developing countries. Thus, in developing countries, numerous premature neonates become blind because of the absence of early screening and timely treatments [
2]. Another obstacle that occurs worldwide is that imaging of the infants’ retina is very hard and limited due to the shortage of equipment that offers a fast and simple scanning process, specially designed for uncooperative and unanesthetized cases like premature neonates [
3]. However, the latest imaging instrumentation advancements have considerably enhanced and facilitated the capacity to attain high-quality images from premature infants.
The enhancement in digital imaging delivered new strategies for the diagnosis, monitoring, and treatments of ROP. Though the typical binocular indirect ophthalmoscopy (BIO) is considered the gold standard for imaging infants with ROP, it needs proper and extensive training by qualified and skilled staff. Currently, the wide-angle digital retinal imaging (Retcam) system is extensively used for examining premature neonates with ROP. This is because it is simpler and faster to function compared to BIO. Moreover, the Retcam system can capture, store, and transmit fundus images from several angles. Additionally, it is more favorable for medical examination and monitoring, education, and scientific research. All these benefits confirm acceptable results when using it along with digital image analysis techniques to diagnose ROP [
4].
In recent years, several diagnostic tools based on artificial intelligence (AI) techniques have been proposed to diagnose medical conditions [
5]. Examples of such conditions are as cancer [
6,
7,
8,
9], eye abnormalities [
10,
11], brain tumors and mental disorders [
12,
13], heart problems [
14,
15,
16,
17,
18], gastrointestinal diseases [
19], motor disabilities [
20,
21], and lung diseases [
22,
23]. With the latest advancements in digital imaging of ROP such as Retcam, fundus retinal images may be analyzed effectively with AI methods. The AI methods include traditional machine learning (ML) and modern Deep Learning approaches (DL). In the former methods, conventional image processing and feature extraction techniques identify pathological patterns such as fundus lesions and blood vessels [
24]. Also, they involve manual outlining of chosen features, and hence systemic bias can occur from handcrafted extraction [
4]. On the other hand, the DL approaches do not need any image processing or feature extraction steps for performing the diagnosis [
25], Therefore, they are preferred over ML approaches. Moreover, diagnostics tools based on DL have numerous advantages over manual diagnosis. First, they are effective and faster than manual diagnosis. In addition, they are easier and prevent the error caused by fatigue or emotions [
26]. Also, they are more accurate, especially with large data. For these reasons, this paper aims to propose a robust and reliable diagnostic tool called DIAROP based on DL techniques for the automatic diagnosis of ROP in its early stages with high accuracy. This tool is constructed using fundus images for preterm infants acquired using Retcam. It uses an ensemble of DL techniques to perform classification. DIAROP has the potential to help ophthalmologists in the early and accurate diagnosis of ROP. The study also aims to present a diagnostic tool to differentiate normal images and those with ROP. DIAROP can reduce the time and labor caused by manual diagnosis and conventional ML approaches.
The key contributions of this study are as follows:
Four state-of-the-art pre-trained CNNs models of different architectures are investigated; these pre-trained CNNs varied in their convolutional layers amount and principal building block.
The performance of the four pre-trained models is compared. Considerable alteration in performance is noticed.
Features extracted from these networks are of high dimension, so they are reduced using Fast Walsh Hadamard transform (FWHT).
Due to the difference in performance across the different CNNs, feature integration is utilized to merge each of the CNN architecture’s benefits.
Integrated features extracted from the four pre-trained CNNs are examined to select the integrated features set with the highest impact.
Feature integration is achieved using three fusion techniques, including auto-encoder (AE), principal component analysis (PCA), and discrete wavelet transform (DWT), to investigate the best technique which improves the performance.
This paper is organized as follows;
Section 2 illustrates the previous diagnostic tools for ROP diagnosis.
Section 3 presents the methodology and materials. It also introduces the description of DIAROP; the proposed diagnostic tool.
Section 4 provides the performance metrics and parameter settings.
Section 5 delivers the results of DIAROP.
Section 6 introduces a discussion of the main settings and results of DIAROP.
Section 7 concludes the paper.
2. Previous Diagnostic Tools
Several ROP diagnostic tools based on Retcam imaging modality have been proposed in the literature during the past few years based on traditional machine learning techniques (TML) or Deep Learning techniques (DL). The criteria behind the selection of the related works are based on recent studies that focused on diagnosing only ROP. In other words, those studies built diagnostic tools for identifying diabetic retinopathy for premature infants, not adults or children. Regarding TML, the authors of Ref. [
27] employed several ML classifiers to diagnose pre-plus, plus, and non-plus ROP disease using 87 images. They achieved an average accuracy of 80.15%. In 2018, an ROP tool was constructed using 20 images to differentiate between pre-plus and plus ROP diseases [
28]. Oloumi et al. utilized Gabor filters to distinguish between plus and non-plus ROP disease using 110 images of 41 patients [
24,
29]. Ataer-Cansizoglu et al. [
30] proposed a diagnostic tool called “i-ROP” to classify healthy, pre-plus and plus ROP disease based on 77 images. They employed a support vector machine (SVM) classifier and achieved an accuracy of 95%. Nevertheless, the previous tools used low-quality images, a small number of images to construct the classification model. They required manual feature extraction and segmentation of the vessels, which might reduce the accuracy of diagnosis because of the probable faults and professional bias that could occur while choosing the target vessels. Also, the time needed for image processing like segmentation and feature extraction is high. This necessitate the need for a more automated tools that can be reliable such as those based on DL techniques.
Lately, numerous ROP diagnostic tools based on DL techniques have been introduced. These systems utilized transfer learning (TL) which reemploys pre-trained Convolutional Neural Networks (CNNs) trained with large datasets such as ImageNet on another similar classification problem but with a lower number of images like the one on hand [
31]. Since the pre-trained CNN has been previously learned image features from a massive dataset with many diverse images, TL has been proven to enhance diagnostic accuracy [
32,
33,
34]. Brown et al. [
35] proposed a tool called “i-ROP “ based on two CNNs, the first one for segmentation and the second for classifying healthy, pre-plus and plus ROP disease. The authors used 5511 retinal images and attained an average sensitivity of 96.5% and an average specificity of 94%. Another automated system based on DL was presented called “DeepROP” [
36]. The authors employed 11,707 images. The system first diagnosed images into normal or ROP, and then ROP images were classified into severe or minor. The system achieved a 96.64% sensitivity, 99.33% specificity for classifying normal versus ROP, and an 88.46% sensitivity, 92.31% specificity for severe versus minor. An automatic tool was introduced called “ROP.AI” to diagnose normal and plus diseases [
37].The classification model achieved 96.6% sensitivity and 98.0% specificity. Lei et al. [
38] employed ResNet-50 and added an attention module and channel to diagnose ROP. Similarly, Zhang et al. [
39] employed several versions of ResNet to build their model. On the other hand, Rani et al. [
40] introduced a tool based on DL and multiple instance learning (MIL) where images were split into equal patches, and then a CNN was employed to extract features from these patches. Features of the same image are combined to distinguish between normal and ROP cases. The system obtained an accuracy of diagnosis of 83.33%, sensitivity and specificity of 100%, and 71.43%, correspondingly. Later the authors of [
41] proposed a pipeline called “I-ROP ASSIST” to differentiate among healthy and plus ROP diseases. The authors segmented the images using U-Net CNN and extracted handcrafted features from these segmented images to train several machine learning classifiers. The highest accuracy achieved was 94%.
Huang et al. [
42] presented an automatic tool based on five CNNs, including VGG-13, VGG-16, MobileNet, Inception, and DenseNet to detect ROP in preterm infants. The authors first distinguished between normal and ROP cases and then classified ROP severity into mild and severe. As described in [
43,
44], the several stages of ROP were categorized as Stage 1, Stage 2, and Stage 3. The ophthalmologists classified the severity of ROP as mild-ROP, in case the eye condition refers to Stage 1 and Stage 2 ROP. Otherwise, if the eye condition refers to Stage 3 ROP, then it is a severe ROP. The authors compared the performance of the 5 CNNs and showed that VGG-16 has the highest performance. For normal versus ROP, the VGG-16 reached 96% accuracy, 96.6% sensitivity, and 95.2% specificity. For severity classification, the VGG-16 model attained 98.82% accuracy, 100% sensitivity, and 98.41% specificity. Similarly, in Ref. [
45] an automated model was constructed based on VGG-16, ResNet-50, and Inception CNNs. The model first recognized ROP cases and then classified their severity into mild and severe. Maximum accuracy of 97% was achieved using the Inception CNN for healthy versus ROP and 84% for mild versus severe. Another automated system based on DL called “DeepDR” was proposed in [
46]. The system employed an ensemble of CNNs to identify ROP and then its severity. DeepDR consists of two fusion stages; the first stage is feature-based fusion, whereas the second is a probability-based fusion. The results showed that fusing the average probabilities of Xception, Inception, and InceptionResNet CNNs attained the highest sensitivity of 97.5%, a specificity of 97.7% for identifying ROP. While identifying the severity level, the same CNNs achieved a sensitivity of 98.1% and a specificity of 98.9%. The results achieved by diagnostic tools based on DL have shown that these tools are comparable and can produce higher accuracy than experts in diagnosing ROP disease. Therefore, they have the potential to be employed for ROP diagnosis [
4]. However, they have some limitations; the majority of the previous techniques were based on only spatial DL features, however, merging spatial DL features with other types of features such as spectral or temporal can boost the accuracy of image classification [
47,
48,
49,
50]. Besides, almost all of them utilized a single convolution neural network (CNN) to perform classification, but it was proven that fusing features of several CNN are capable of enhancing the classification performance [
51,
52,
53,
54]. Furthermore, they employed private datasets which makes it difficult to use these datasets for comparison purposes and reproducing their works. This study proposed an automated diagnostic tool called “DIAROP” based on DL techniques. It can be considered as a reliable diagnostic tool that can classify ROP with high accuracy using a large number of images. It consists of ensembles of DL approaches that are fused using several integration techniques. DIAROP utilizes TL to four convolution neural networks (CNNs) and compares their performance for diagnosing ROP. These CNNs include ResNet-50, Inception, Inception-ResNet, and Xception. It is assessed on a public freely available dataset.
6. Discussion
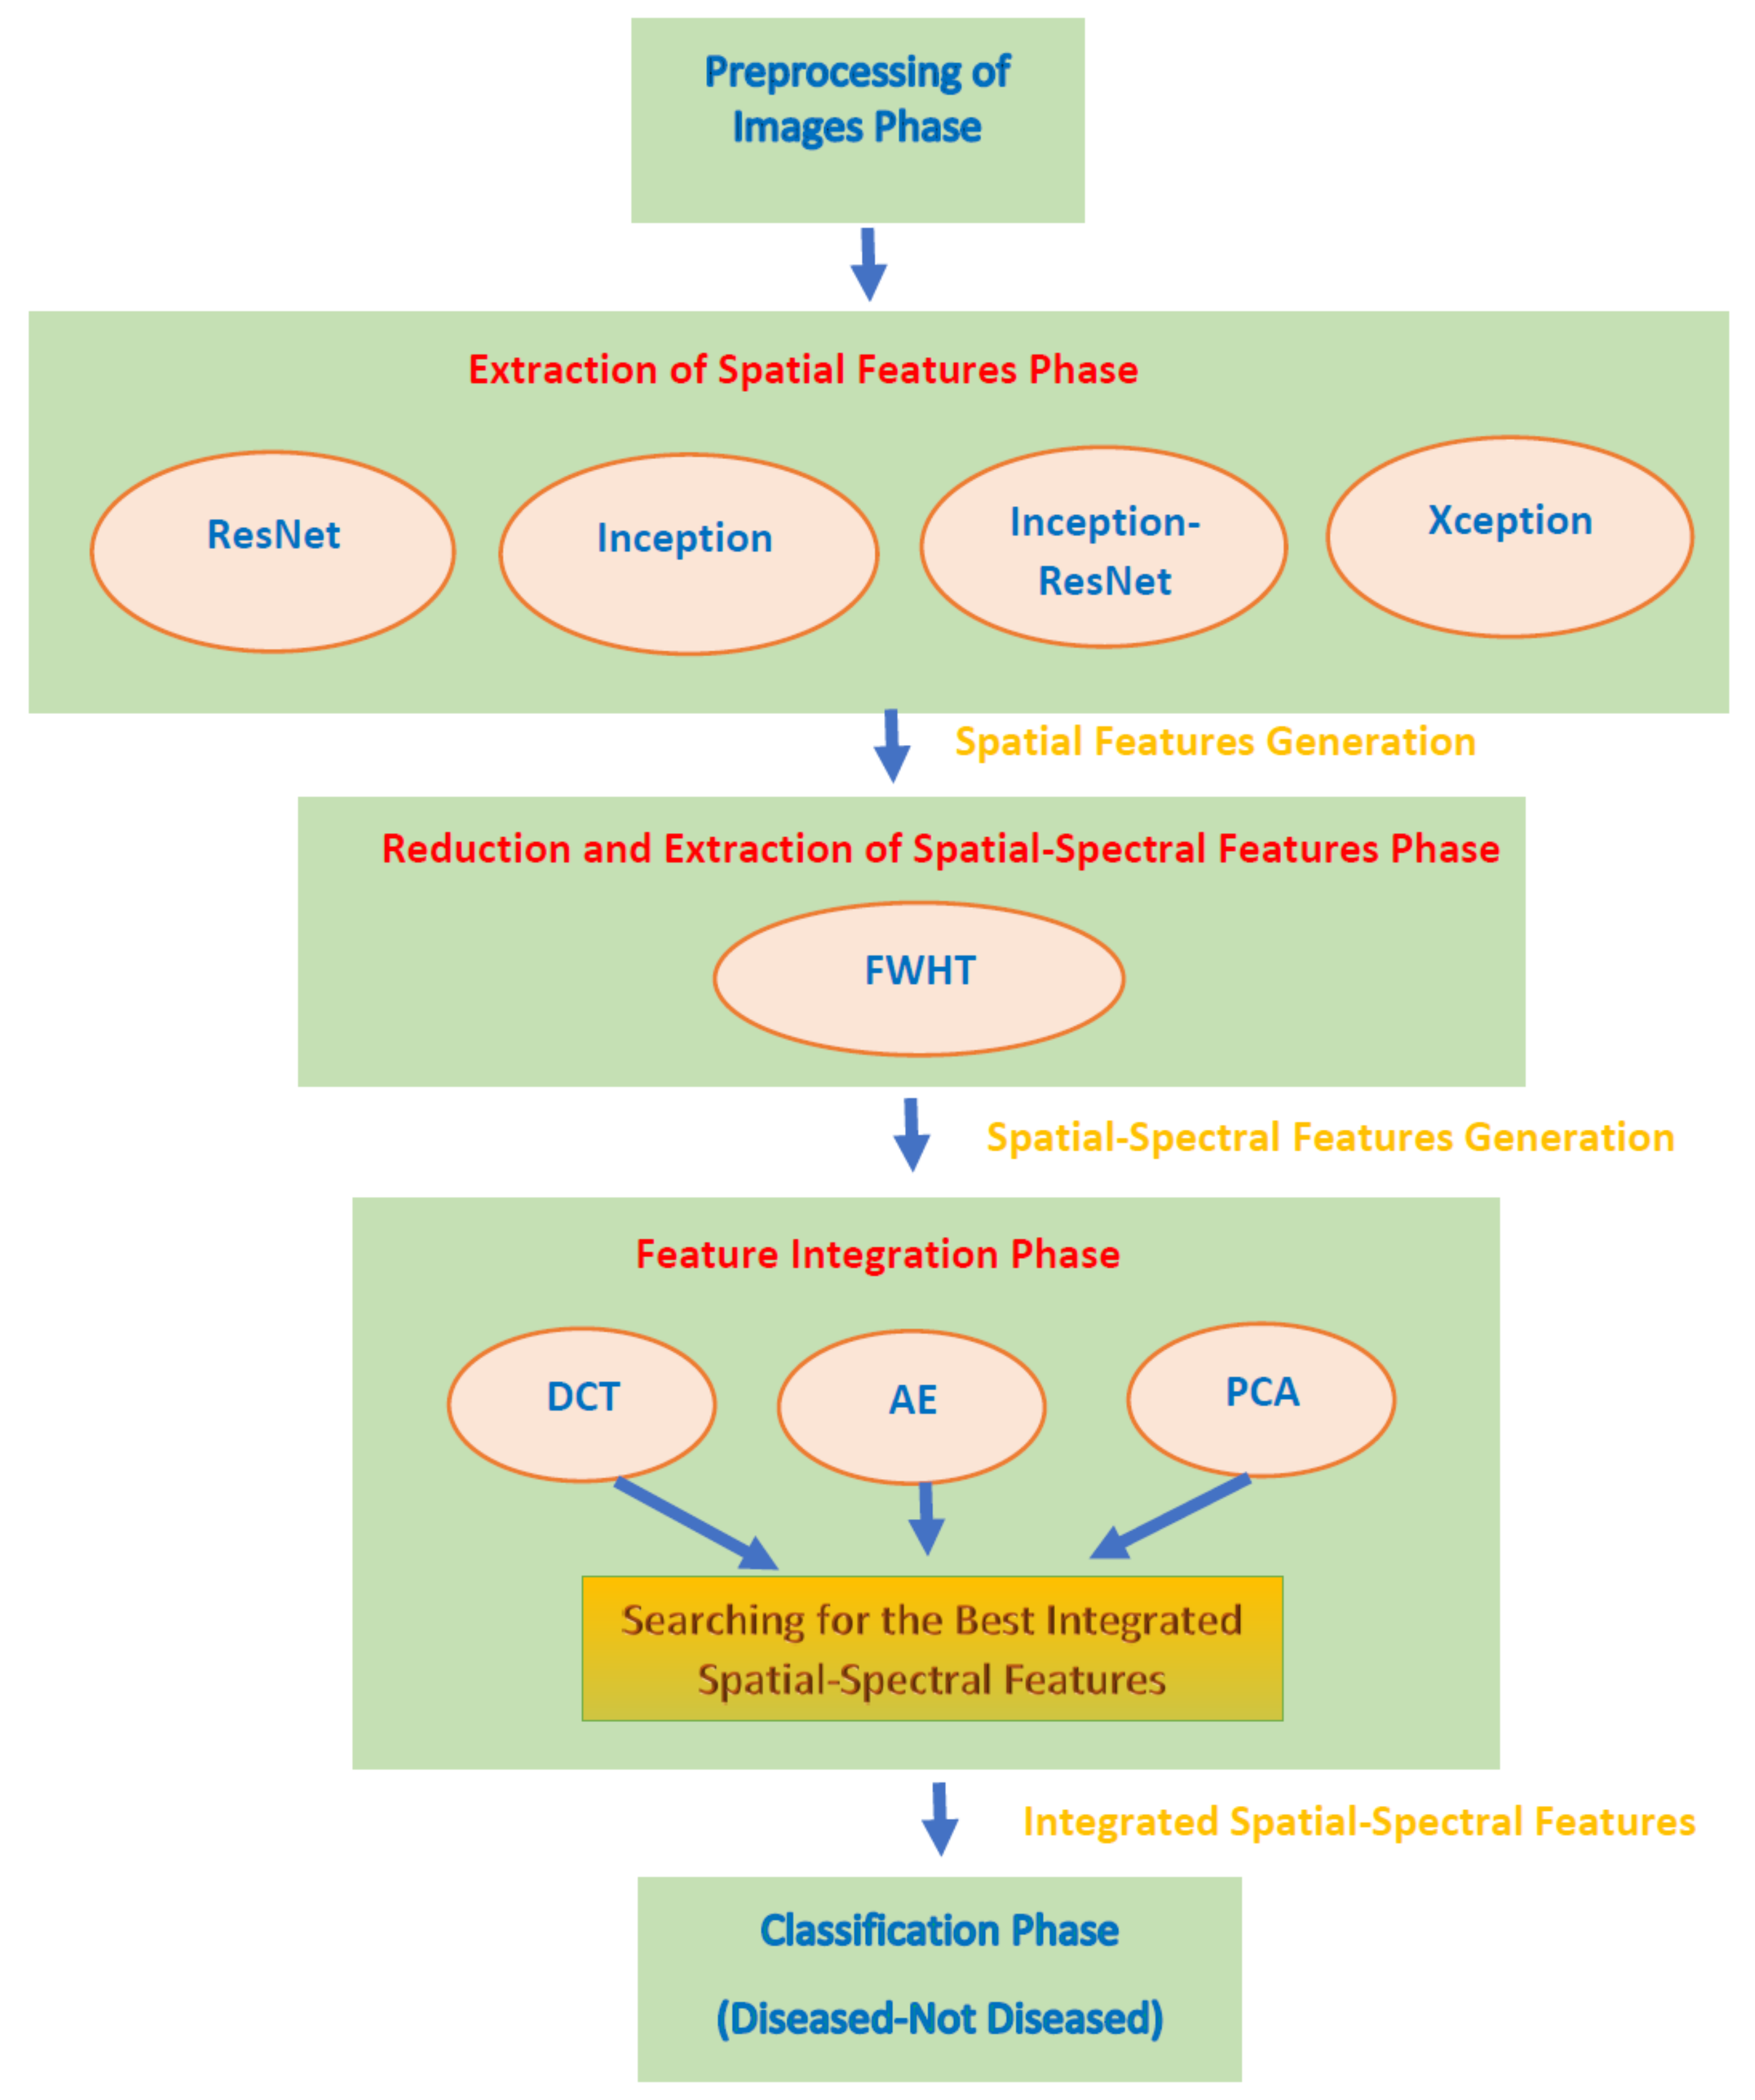
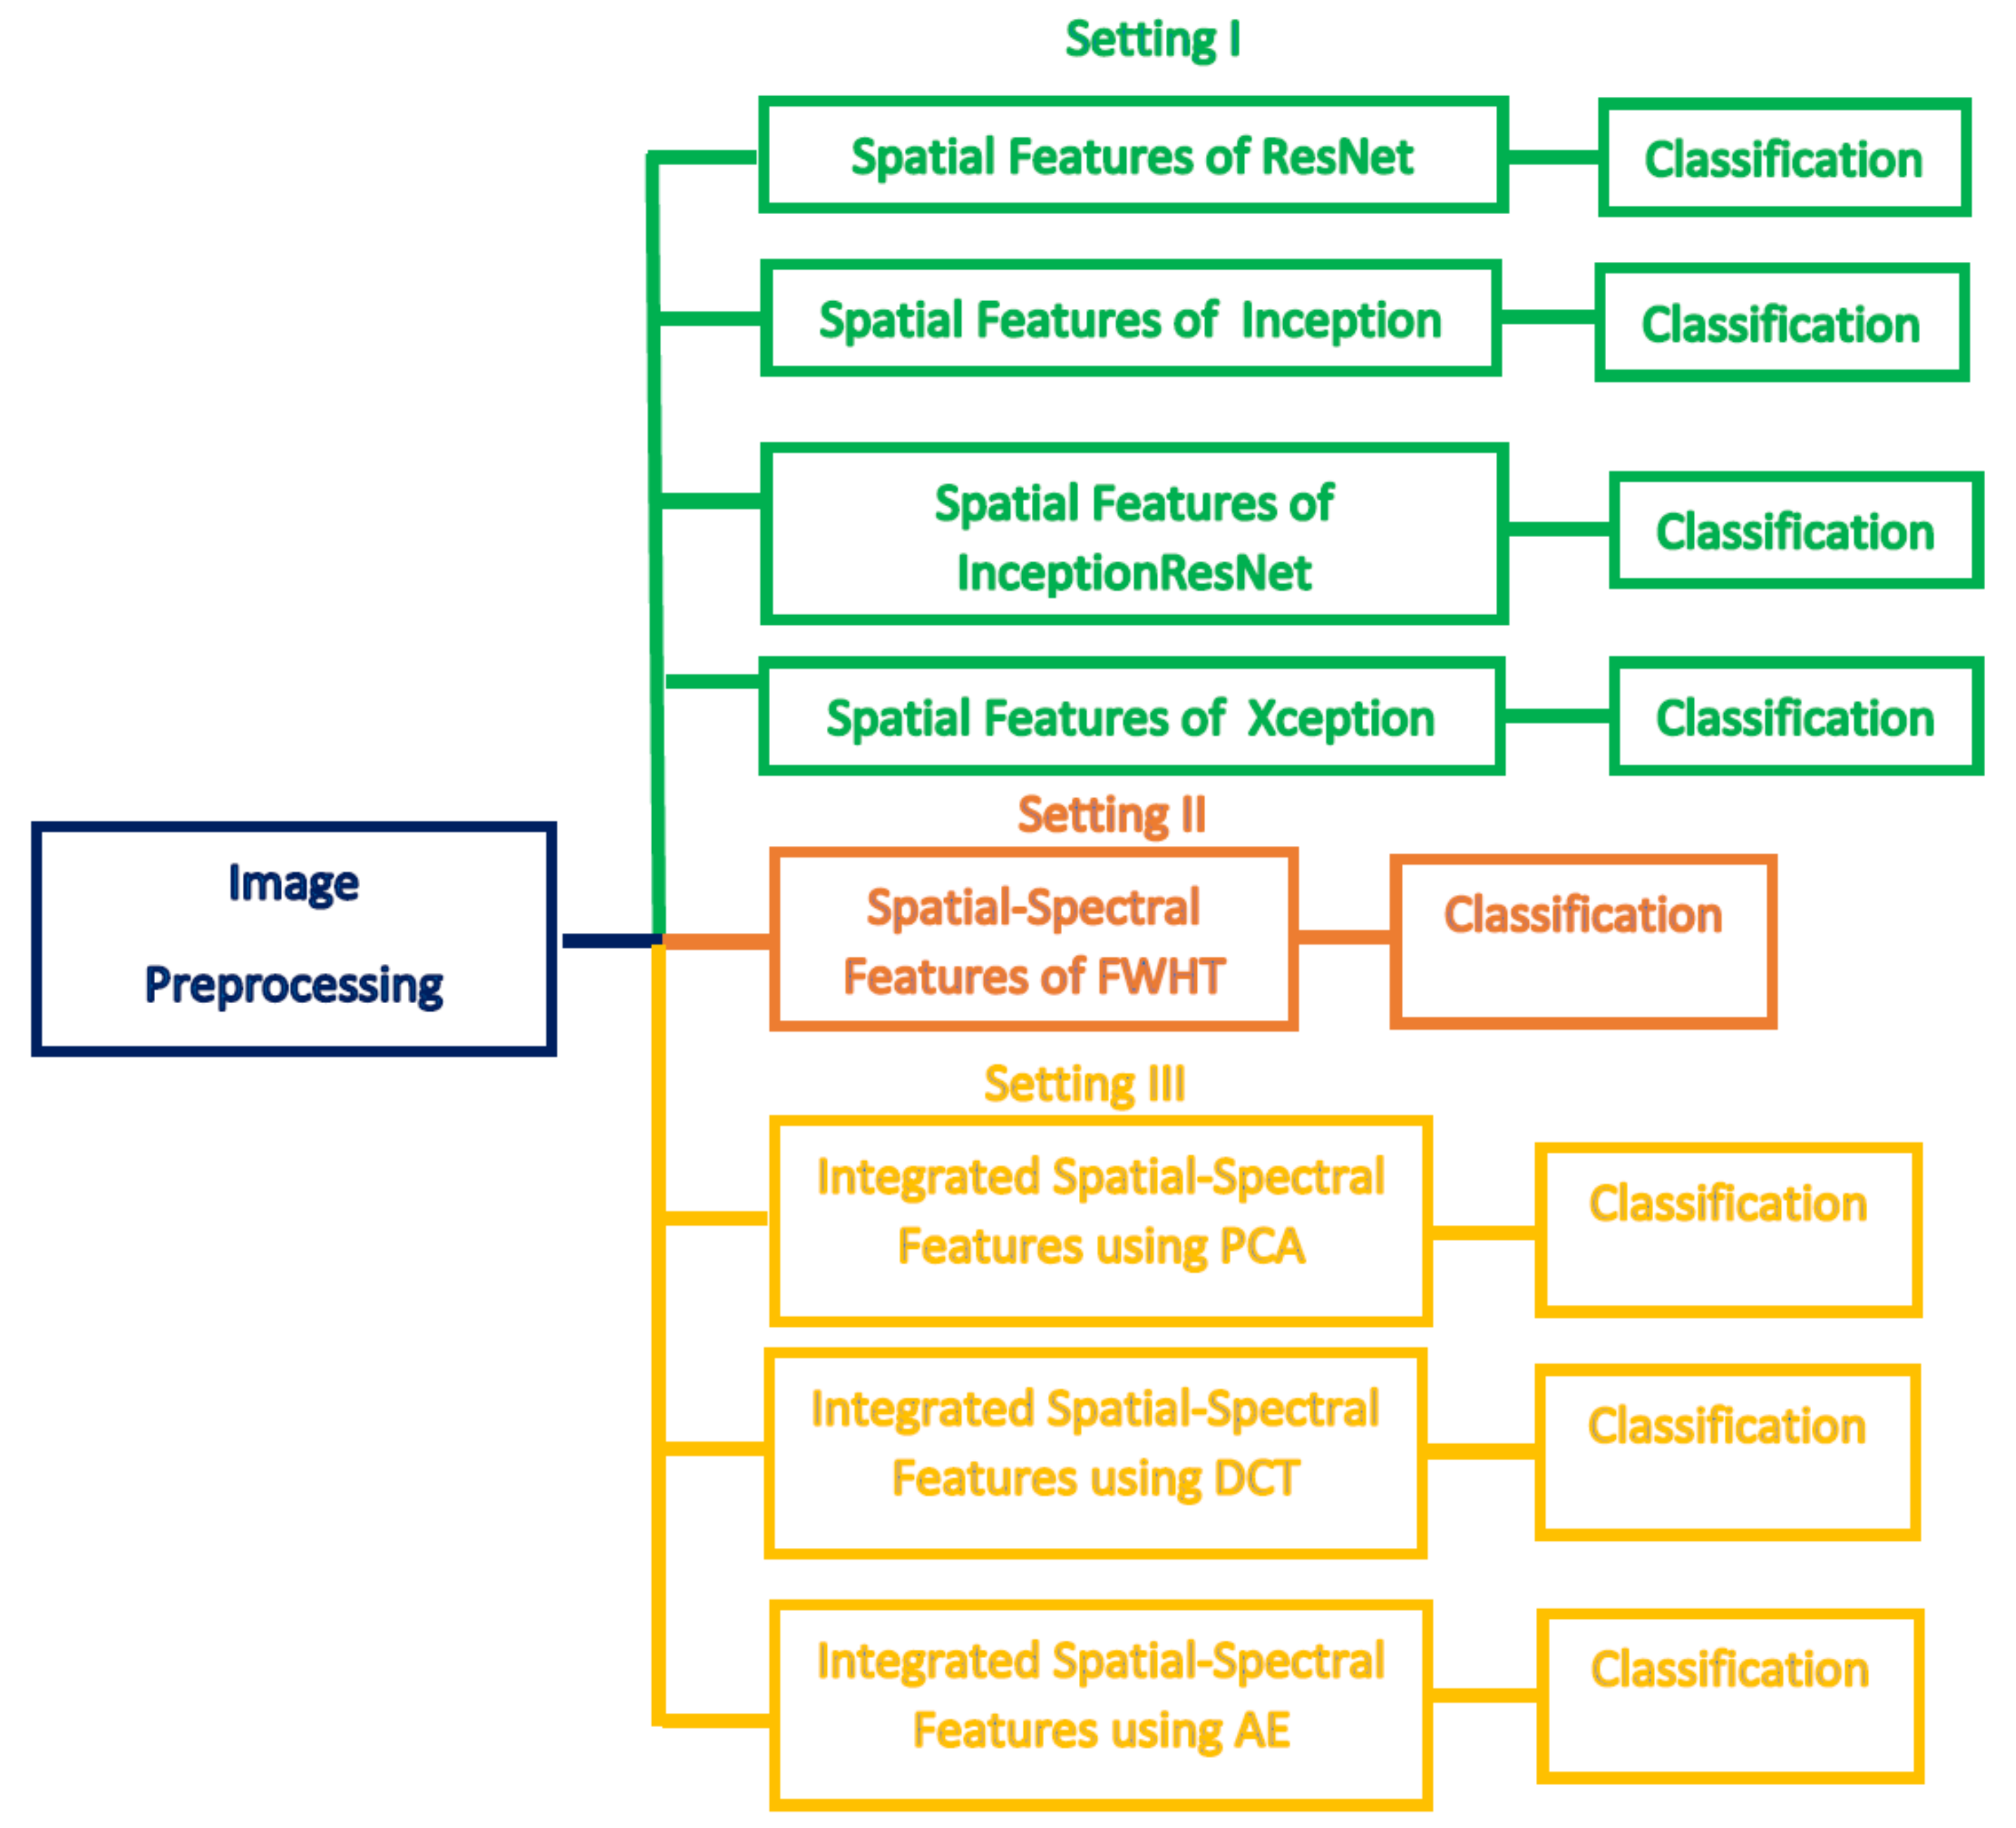
This paper proposed an automated diagnostic tool called DIAROP to diagnose ROP based on DL techniques. It consists of several DL approaches based on TL. DIAROP involves three settings. In the first setting, TL is used to obtain spatial features from four pre-trained CNNs. These spatial features are utilized separately to train LDA, L-SVM, and Q-SVM classifiers. Setting II, presents the extraction of spectral features from the spatial features obtained from each CNN. These spectral features are extracted using FWHT after applying it to the previous setting’s spatial features, ending up producing spatial-spectral features. FWHT is also utilized to reduce these spatial-spectral features’ dimensions. The last setting presents the feature integration phase using three integration techniques. It searches for the best integrated spatial-spectral features extracted from the four CNNs.
Figure 5 shows the highest accuracy attained in each setting. In setting I, an accuracy of 91.6% was obtained using the spatial features of ResNet-50. On the other hand, an accuracy of 91.8% was achieved using the spatial-spectral features of ResNet-50. Finally, in the last setting, the spatial-spectral features of ResNet50+Inception+InceptionResNet integrated using DWT attained an accuracy of 93.2% using the Q-SVM classifier. The final architecture of DIAROP is displayed in
Figure 6.
The training time achieved by DIAROP is compared with those attained by end-to-end DL CNNs, including ResNet-50, Inception V3, Xception, and Inception-ResNet V2. The training execution times of DIAROP and end-to-end DL CNNs are illustrated in
Table 8. This table proves the competence of DIAROP as the training execution time of DIAROP is 404.17 s, much lower than that executed by other end-to-end DL CNNs.
Combining several features extracted from different Deep Learning models, increase the complexity and the computational time of the classification process. However, the proposed DIAROP diagnostic tool tried to reduce this side effect by performing two feature reduction steps. The first is using the FWHT to reduce the dimension of the spatial Deep Learning feature extracted from each CNN. Next, it employs several integration techniques which are also well-known feature reduction methods such as PCA, AE, and DWT. It can be noted in the results that they have reduced the number of features as shown in
Table 7 and reduced the classification time compared to end-to-end models as shown in
Table 8.
Regarding the CNNs employed in this study, they were chosen as they were previously used in the ROP’s literature such as [
39,
45,
46] and achieved good performance. For feature extraction, TL has been employed as it is a well-known technique commonly used in several ways, one of the most ways is to use it to extract deep features from specific layers of a CNN [
33,
69]. On the other hand, the FWHT is a common technique used for dimensionality reduction [
57]. It is also a well-known method for time-frequency representation [
58]. The results section has proved that FWHT has successfully reduced the number of features while enhancing performance. (Please refer to
Table 1 and
Table 2). PCA [
70], AE [
71], and DWT [
72,
73] techniques are employed for the integration process as they are popular feature reduction methods that have been extensively used in the machine learning literature. SVM performs well with large dimension space and as it uses kernel function which maps the feature space into a new domain that can easily separate between classes of a dataset. Therefore, it is commonly used with the huge dimension of DL features extracted from CNNs [
74] achieving outperforming results.
The main challenge of this study is the availability of ROP datasets. To our knowledge, all datasets that have been used in the literature are private; therefore, it was hard to compare the performance of DIAROP with related previous diagnostic tools. The only article that used the same dataset employed to construct DIAROP is [
26], where the authors used three CNNs individually to construct their diagnostic tool. In contrast, DIAROP integrates the spatial-spectral features of several CNNs instead of using only one CNN individually. The performance of DIAROP is compared with the AlexNet, VGG-16, and GoogleNet CNNs’ performance, as shown in
Table 9. Also, it was compared with other end-to-end models used in the literature. The table confirms the competitiveness of DIAROP over the other methods, as the accuracy (93.2%) of DIAROP is higher than the accuracy of the AlexNet (77.9%), VGG-16 (80.4%,), and GoogleNet (73.9%) used in [
26]. The outperformance of DIAROP over end-to-end CNNs as the accuracy accomplished using DIAROP is 93.2% which is higher than the 86.5%, 90.9%, 91.42%, and 91.48% achieved using Xception, Inception-ResNet V2, Inception V3, and ResNet-50 CNNs. The outperformance of DIAROP ensures that it can be used as a diagnostic tool that helps ophthalmologists diagnose the ROP disease more accurately. It is a reliable automated tool that can lower examination time and ophthalmologists’ exertion in the diagnosis procedure.
It was proven in several studies the great training capacity of Deep Learning with large datasets without the necessity to identify significant features by professionals, to automatically diagnose ROP disease in retinal scans accurately [
36]. Deep Learning could deliver similar diagnostic results on a given retinal scan each time, which is hard to be achieved by ophthalmologists as the diagnosis achieved by them is subjective. The key findings of this study are: (1) DIAROP can assist ophthalmic experts to achieve high ROP diagnostic accuracy avoiding challenges of the manual diagnosis; (2) the diagnosis achieved by DIAROP is not subjective; (3) DIAROP offers a new vision regarding the diagnostic procedures for ophthalmologists, particularly those who are located in developing and poor countries, and finally (4) ophthalmologists in the area of ROP are limited which can affect the diagnosis procedure, however, DIAROP can help in the timely diagnosis of the ROP disease, that could help in lowering blindness caused by the misdiagnosis. This can attain a major contribution in the field of ophthalmology research, clinical, and educational applications. It may also help ophthalmologists in choosing suitable follow-up plans according to the diagnostic results.
7. Conclusions
This study introduced an automated diagnostic tool named DIAROP based on an ensemble of DL techniques to diagnose ROP disease. DIAROP involved five phases, including pre-processing of ROP images, extraction of spatial features, reduction and extraction of spatial-spectral features, integration of features, and classification phases. These phases were performed in three different settings. Setting I presents the mining of spatial DL features from four pre-trained CNNs using TL. Whereas setting II describes the extraction of spatial-spectral features using FWHT after being operated on the spatial features of setting I. FWHT is also applied to reduce the extracted features’ size. Finally, in the last setting, the feature integration process is performed where each combination of the integrated feature set is investigated to select the best set of integrated spatial-spectral features extracted from several CNNs. The results of setting II showed that using spatial-spectral features is better than using spatial features only. The reason is that setting II accuracy is higher than setting I. Also, the number of features in setting II is lower than setting I. Moreover, setting III’s results proved that the integrated spatial-spectral features of several CNNs could enhance ROP disease’s diagnostic accuracy. The results were compared with end-to-end DL CNNs and a recent related diagnostic tool that verified the competence of DIAROP. Therefore, DIAROP is considered a robust and reliable diagnostic tool that can automatically diagnose ROP disease with high accuracy. DIAROP can reduce the manual labor and the time of examination accomplished during the diagnosis procedure. The limitations of this study are; first, it did not apply segmentation techniques. Also, it did not consider categorizing the severity of the ROP disease. Moreover, the real ROP diagnosis includes Aggressive posterior ROP, acute ROP, plus disease ROP, pre-threshold ROP, and ROP Zones and stages that were not addressed in the paper. Future work will address these limitations. Future work will also consider using more CNNs. Furthermore, upcoming work will apply DIAROP to detect the severity of the ROP disease.


