
Metabolomic Profiles of Men and Women Ischemic Stroke Patients

 , ,
, ,
Abstract

1. Introduction
2. Methods
Data Analysis
3. Results
4. Discussion
5. Conclusions
Author Contributions
Funding
Institutional Review Board Statement
Informed Consent Statement
Data Availability Statement
Acknowledgments
Conflicts of Interest
References
- Bushnell, C.D.; Chaturvedi, S.; Gage, K.R.; Herson, P.S.; Hurn, P.D.; Jiménez, M.C.; Kittner, S.J.; Madsen, T.E.; McCullough, L.D.; McDermott, M.; et al. Sex differences in stroke: Challenges and opportunities. J. Cereb. Blood Flow Metab. 2018, 38, 2179–2191. [Google Scholar] [CrossRef]
- Avan, A.; Digaleh, H.; Di Napoli, M.; Stranges, S.; Behrouz, R.; Shojaeianbabaei, G.; Amiri, A.; Tabrizi, R.; Mokhber, N.; Spence, J.D.; et al. Socioeconomic status and stroke incidence, prevalence, mortality, and worldwide burden: An ecological analysis from the Global Burden of Disease Study 2017. BMC Med. 2019, 17, 1–30. [Google Scholar] [CrossRef]
- Persky, R.W.; Turtzo, L.C.; McCullough, L.D. Stroke in Women: Disparities and Outcomes. Curr. Cardiol. Rep. 2010, 12, 6–13. [Google Scholar] [CrossRef] [PubMed]
- Blum, B.; Penwell, A.; Wormack, L.; Walker, B.; Lari, S.; Nathaniel, T.I. Gender and thrombolysis therapy in acute ischemic stroke patients with incidence of obesity. Neurol. Sci. 2019, 40, 1829–1839. [Google Scholar] [CrossRef] [PubMed]
- Gainey, J.; Brechtel, L.; Konklin, S.; Madeline, L.; Lowther, E.; Blum, B.; Nathaniel, T.I. In a stroke cohort with incident hypertension; are more women than men likely to be excluded from recombinant tissue-type Plasminogen Activator (rtPA)? J. Neurol. Sci. 2018, 387, 139–146. [Google Scholar] [CrossRef] [PubMed]
- Hiraga, A. Gender Differences and Stroke Outcomes. Neuroepidemiology 2017, 48, 61–62. [Google Scholar] [CrossRef] [PubMed]
- Gainey, J.; Wormack, L.; Brechtel, L.; Nathaniel, T.I. Abstract WP89: A Functional Outcome Model for a Telestroke-guided Tissue Plasminogen Activator Treatment of Stroke Patients. Stroke 2018, 49, 89. [Google Scholar] [CrossRef]
- Wassertheil-Smoller, S. Stroke in Women. Nutr. Metab. Cardiovasc. Dis. 2010, 20, 419–425. [Google Scholar] [CrossRef][Green Version]
- Reeves, M.J.; Bushnell, C.D.; Howard, G.; Gargano, J.W.; Duncan, P.; Lynch, G.; Khatiwoda, A.; Lisabeth, L. Sex differences in stroke: Epidemiology, clinical presentation, medical care, and outcomes. Lancet Neurol. 2008, 7, 915–926. [Google Scholar] [CrossRef]
- Nathaniel, T.I.; Gainey, J.; Blum, B.; Montgomery, C.; Ervin, L.; Madeline, L. Clinical Risk Factors in Thrombolysis therapy: Telestroke Versus Nontelestroke. J. Stroke Cerebrovasc. Dis. 2018, 27, 2524–2533. [Google Scholar] [CrossRef]
- Wilson, M.E. Stroke: Understanding the differences between males and females. Pflügers Archiv Eur. J. Physiol. 2013, 465, 595–600. [Google Scholar] [CrossRef]
- McCullough, L.D.; Alkayed, N.J.; Traystman, R.J.; Williams, M.J.; Hurn, P.D. Postischemic Estrogen Reduces Hypoperfusion and Secondary Ischemia After Experimental Stroke. Stroke 2001, 32, 796–802. [Google Scholar] [CrossRef]
- Sun, D.; Tiedt, S.; Yu, B.; Jian, X.; Gottesman, R.F.; Mosley, T.H.; Boerwinkle, E.; Dichgans, M.; Fornage, M. A prospective study of serum metabolites and risk of ischemic stroke. Neurology 2019, 92, e1890–e1898. [Google Scholar] [CrossRef] [PubMed]
- Sidorov, E.; Sanghera, D.K.; Vanamala, J.K.P. Biomarker for Ischemic Stroke Using Metabolome: A Clinician Perspective. J. Stroke 2019, 21, 31–41. [Google Scholar] [CrossRef]
- Vojinovic, D.; Kalaoja, M.; Trompet, S.; Fischer, K.; Shipley, M.J.; Li, S.; Havulinna, A.S.; Perola, M.; Salomaa, V.; Yang, Q.; et al. Association of Circulating Metabolites in Plasma or Serum and Risk of Stroke. Neurology 2021, 96, e1110–e1123. [Google Scholar] [CrossRef] [PubMed]
- Delgado, P.; Chacón, P.; Penalba, A.; Pelegri, D.; García-Berrocoso, T.; Giralt, D.; Santamarina, E.; Ribó, M.; Maisterra, O.; Alvarez-Sabín, J.; et al. Lipoprotein-Associated Phospholipase a2 Activity Is Associated with Large-Artery Atherosclerotic Etiology and Recurrent Stroke in Tia Patients. Cerebrovasc. Dis. 2012, 33, 150–158. [Google Scholar] [CrossRef] [PubMed]
- Thompson, A.; Gao, P.; Orfei, L.; Watson, S.; Di Angelantonio, E.; Kaptoge, S.; Ballantyne, C.M.; Cannon, C.P.; Criqui, M.H.; Cushman, M.; et al. Lipoprotein-associated phospholipase A2 and risk of coronary disease, stroke, and mortality: Collaborative analysis of 32 prospective studies. Lancet 2010, 375, 1536–1544. [Google Scholar] [CrossRef]
- Jové, M.; Mauri-Capdevila, G.; Suárez, I.; Cambray, S.; Sanahuja, J.; Quílez, A.; Farré, J.; Benabdelhak, I.; Pamplona, R.; Portero-Otín, M.; et al. Metabolomics predicts stroke recurrence after transient ischemic attack. Neurology 2015, 84, 36–45. [Google Scholar] [CrossRef]
- Sun, H.; Kaplan, B.S.; Guan, M.; Zhang, G.; Ye, J.; Long, L.-P.; Blackmon, S.; Yang, C.-K.; Chiang, M.-J.; Xie, H.; et al. Pathogenicity and Transmission of a Swine Influenza a(H6n6) Virus. Emerg. Microbes Infect. 2017, 6, 1–13. [Google Scholar] [CrossRef]
- Floegel, A.; Kühn, T.; Sookthai, D.; Johnson, T.; Prehn, C.; Rolle-Kampczyk, U.; Otto, W.; Weikert, C.; Illig, T.; Von Bergen, M.; et al. Serum metabolites and risk of myocardial infarction and ischemic stroke: A targeted metabolomic approach in two German prospective cohorts. Eur. J. Epidemiol. 2018, 33, 55–66. [Google Scholar] [CrossRef]
- Harpaz, D.; Bajpai, R.; Ng, G.J.; Soljak, M.; Marks, R.S.; Cheung, C.; Arumugam, T.V.; Quek, A.M.; Tok, A.I.; Seet, R.C. Blood biomarkers to detect new-onset atrial fibrillation and cardioembolism in ischemic stroke patients. Heart Rhythm. 2021, 18, 855–861. [Google Scholar] [CrossRef] [PubMed]
- Nathaniel, T.I.; Otukonyong, E.E.; Okon, M.; Chaves, J.; Cochran, T.; Nathaniel, A.I. Metabolic Regulatory Clues from the Naked Mole Rat: Toward Brain Regulatory Functions During Stroke. Brain Res. Bull. 2013, 98, 44–52. [Google Scholar] [CrossRef] [PubMed]
- Ormstad, H.; Aass, H.C.D.; Amthor, K.-F.; Lund-Sørensen, N.; Sandvik, L. Serum cytokine and glucose levels as predictors of poststroke fatigue in acute ischemic stroke patients. J. Neurol. 2011, 258, 670–676. [Google Scholar] [CrossRef]
- Crimmins, E.M.; Shim, H.; Zhang, Y.S.; Kim, J.K. Differences between Men and Women in Mortality and the Health Dimensions of the Morbidity Process. Clin. Chem. 2019, 65, 135–145. [Google Scholar] [CrossRef] [PubMed]
- Redekop, W.K.; Mladsi, D. The Faces of Personalized Medicine: A Framework for Understanding Its Meaning and Scope. Value Health 2013, 16, S4–S9. [Google Scholar] [CrossRef]
- Au, A. Metabolomics and Lipidomics of Ischemic Stroke. Int. Rev. Cytol. 2018, 85, 31–69. [Google Scholar] [CrossRef]
- Guo, X.; Li, Z.; Zhou, Y.; Yu, S.; Yang, H.; Zheng, L.; Liu, Y.; Sun, Y. Metabolic Profile for Prediction of Ischemic Stroke in Chinese Hypertensive Population. J. Stroke Cerebrovasc. Dis. 2019, 28, 1062–1069. [Google Scholar] [CrossRef]
- Colello, M.J.; Ivey, L.E.; Gainey, J.; Faulkner, R.V.; Johnson, A.; Brechtel, L.; Madeline, L.; Nathaniel, T.I. Pharmacological Thrombolysis for Acute Ischemic Stroke Treatment: Gender Differences in Clinical Risk Factors. Adv. Med. Sci. 2018, 63, 100–106. [Google Scholar] [CrossRef]
- Lee, Y.; Khan, A.; Hong, S.; Jee, S.H.; Park, Y.H. A metabolomic study on high-risk stroke patients determines low levels of serum lysine metabolites: A retrospective cohort study. Mol. BioSyst. 2017, 13, 1109–1120. [Google Scholar] [CrossRef]
- Liu, P.; Li, R.; Antonov, A.A.; Wang, L.; Li, W.; Hua, Y.; Guo, H.; Wang, L.; Liu, P.; Chen, L.; et al. Discovery of Metabolite Biomarkers for Acute Ischemic Stroke Progression. J. Proteome Res. 2017, 16, 773–779. [Google Scholar] [CrossRef]
- Tiedt, S.; Brandmaier, S.; Kollmeier, H.; Duering, M.; Artati, A.; Adamski, J.; Klein, M.; Liebig, T.; Holdt, L.M.; Teupser, D.; et al. Circulating Metabolites Differentiate Acute Ischemic Stroke from Stroke Mimics. Ann. Neurol. 2020, 88, 736–746. [Google Scholar] [CrossRef]
- Wang, X.; Liu, T.; Song, H.; Cui, S.; Liu, G.; Christoforou, A.; Flaherty, P.; Luo, X.; Wood, L.; Wang, Q.M. Targeted Metabolomic Profiling Reveals Association Between Altered Amino Acids and Poor Functional Recovery After Stroke. Front. Neurol. 2020, 10, 1425. [Google Scholar] [CrossRef] [PubMed]
- Wang, X.; Zhang, L.; Sun, W.; Pei, L.-L.; Tian, M.; Liang, J.; Liu, X.; Zhang, R.; Fang, H.; Wu, J.; et al. Changes of Metabolites in Acute Ischemic Stroke and Its Subtypes. Front. Neurosci. 2021, 14, 1346. [Google Scholar] [CrossRef] [PubMed]
- Jickling, G.C.; Sharp, F.R. Blood Biomarkers of Ischemic Stroke. Neurotherapeutics 2011, 8, 349–360. [Google Scholar] [CrossRef] [PubMed]
- Weng, H.; Shen, C.; Hirokawa, G.; Ji, X.; Takahashi, R.; Shimada, K.; Kishimoto, C.; Naoharu, I. Plasma Mir-124 as a Biomarker for Cerebral Infarction. Biomed. Res. 2011, 32, 135–141. [Google Scholar] [CrossRef] [PubMed]
- Wang, Z.; Lu, G.; Sze, J.; Liu, Y.; Lin, S.; Yao, H.; Zhang, J.; Xie, D.; Liu, Q.; Kung, H.-F.; et al. Plasma miR-124 Is a Promising Candidate Biomarker for Human Intracerebral Hemorrhage Stroke. Mol. Neurobiol. 2018, 55, 5879–5888. [Google Scholar] [CrossRef]
- He, X.-W.; Shi, Y.-H.; Liu, Y.-S.; Li, G.-F.; Zhao, R.; Hu, Y.; Lin, C.-C.; Zhuang, M.-T.; Su, J.-J.; Liu, J.-R. Increased Plasma Levels of Mir-124-3p, Mir-125b-5p and Mir-192-5p Are Associated with Outcomes in Acute Ischaemic Stroke Patients Receiving Thrombolysis. J. Atheroscler. 2019, 289, 36–43. [Google Scholar] [CrossRef] [PubMed]
- Misra, S.; Kumar, A.; Kumar, P.; Yadav, A.K.; Mohania, D.; Pandit, A.K.; Prasad, K.; Vibha, D. Blood-Based Protein Biomarkers for Stroke Differentiation: A Systematic Review. J. Proteomics 2017, 11, 1700007. [Google Scholar] [CrossRef]
- Farooqi, I.; Collet, T.; Sonoyama, T.; Henning, E.; Keogh, J.; Ingram, B.; Kelway, S.; Guo, L. A Metabolomic Signature of Acute Caloric Restriction. J. Clin. Endocrinol. Metab. 2018, 102, 4486–4495. [Google Scholar] [CrossRef]
- Stettin, D.; Poulin, R.X.; Pohnert, G. Metabolomics Benefits from Orbitrap Gc-Ms-Comparison of Low- and High-Resolution Gc-Ms. Metabolites 2020, 10, 4. [Google Scholar] [CrossRef]
- DeHaven, C.D.; Evans, A.M.; Dai, H.; A Lawton, K. Organization of GC/MS and LC/MS metabolomics data into chemical libraries. J. Cheminformatics 2010, 2, 9. [Google Scholar] [CrossRef]
- Kaare, P.D.; Andersen, G.; Ingeman, A.; Krog, B.R.; Bartels, P.; Søren, P. Sex-Related Differences in Quality of Care and Short-Term Mortality among Patients with Acute Stroke in Denmark: A Nationwide Follow-up Study. J. Stroke 2009, 40, 1134–1139. [Google Scholar]
- George, M.G.; Tong, X.; Kuklina, E.V.; Darwin, R. Trends in Stroke Hospitalizations and Associated Risk Factors among Children and Young Adults, 1995–2008. J. Ann. Neurol. 2011, 70, 713–721. [Google Scholar] [CrossRef] [PubMed]
- Barber, P.A.; Demchuk, A.M.; Zhang, J.; Buchan, A.M. Validity and reliability of a quantitative computed tomography score in predicting outcome of hyperacute stroke before thrombolytic therapy. Lancet 2000, 355, 1670–1674. [Google Scholar] [CrossRef]
- Kamtchum-Tatuene, J.; Jickling, G.C. Blood Biomarkers for Stroke Diagnosis and Management. NeuroMolecular Med. 2019, 21, 344–368. [Google Scholar] [CrossRef]
- Johnson, C.; Ivanisevic, J.; Siuzdak, G. Metabolomics: Beyond biomarkers and towards mechanisms. Nat. Rev. Mol. Cell Biol. 2016, 17, 451–459. [Google Scholar] [CrossRef]
- Tate, M.J.; Shugart, R.M.; Moraney, R.A.; Bechtel, L.E.; Blum, B.; Nathaniel, I.T. Gender and functional outcomes in pre-stroke depressive patients treated with thrombolytic therapy. Future Neurol. 2020, 15, 28–35. [Google Scholar] [CrossRef]
- Rotimi, O.R.; Ajani, I.F.; Penwell, A.; Lari, S.; Walker, B.; I Nathaniel, T. In acute ischemic stroke patients with smoking incidence, are more women than men more likely to be included or excluded from thrombolysis therapy? Women’s Health 2020, 16, 1745506520922760. [Google Scholar] [CrossRef]
- Syme, C.; Czajkowski, S.; Shin, J.; Abrahamowicz, M.; Leonard, G.; Perron, M.; Richer, L.; Veillette, S.; Gaudet, D.; Strug, L.; et al. Glycerophosphocholine Metabolites and Cardiovascular Disease Risk Factors in Adolescents: A Cohort Study. Circulation 2016, 134, 1629–1636. [Google Scholar] [CrossRef] [PubMed]
- Marathe, G.K.; Pandit, C.; Lakshmikanth, C.L.; Chaithra, V.H.; Jacob, S.P.; D’Souza, C.J.M. To hydrolyze or not to hydrolyze: The dilemma of platelet-activating factor acetylhydrolase. J. Lipid Res. 2014, 55, 1847–1854. [Google Scholar] [CrossRef]
- Stegemann, C.; Pechlaner, R.; Willeit, P.; Langley, S.R.; Mangino, M.; Mayr, U.; Menni, C.; Moayyeri, A.; Santer, P.; Rungger, G.; et al. Lipidomics Profiling and Risk of Cardiovascular Disease in the Prospective Population-Based Bruneck Study. Circulation 2014, 129, 1821–1831. [Google Scholar] [CrossRef] [PubMed]
- Cheng, M.; Bhujwalla, Z.M.; Glunde, K. Targeting Phospholipid Metabolism in Cancer. Front. Oncol. 2016, 6, 266. [Google Scholar] [CrossRef] [PubMed]
- Van Der Kemp, W.J.M.; Stehouwer, B.L.; Runge, J.H.; Wijnen, J.P.; Nederveen, A.J.; Luijten, P.R.; Klomp, D.W.J. Glycerophosphocholine and Glycerophosphoethanolamine Are Not the Main Sources of the In Vivo31P MRS Phosphodiester Signals from Healthy Fibroglandular Breast Tissue at 7 T. Front. Oncol. 2016, 6, 29. [Google Scholar] [CrossRef]
- Wigle, T.J.; Tsvetkova, E.V.; Welch, S.A.; Kim, R.B. DPYD and Fluorouracil-Based Chemotherapy: Mini Review and Case Report. Pharmaceutics 2019, 11, 199. [Google Scholar] [CrossRef]
- Detailleur, S.; Segelov, E.; Re, M.D.; Prenen, H. Dihydropyrimidine Dehydrogenase Deficiency in Patients with Severe Toxicity after 5-Fluorouracil: A Retrospective Single-Center Study. Ann. Gastroenterol. 2021, 34, 68–72. [Google Scholar]
- Loriot, M.A.; Ciccolini, J.; Thomas, F.; Barin-Le-Guellec, C.; Royer, B.; Milano, G.; Picard, N.; Becquemont, L.; Verstuyft, C.; Narjoz, C.; et al. Dihydropyrimidine Déhydrogenase (Dpd) Deficiency Screening and Securing of Fluoropyrimidine-Based Chemotherapies: Update and Recommendations of the French Gpco-Unicancer and Rnpgx Networks. Bull. Cancer 2018, 105, 397–407. [Google Scholar] [CrossRef]
- Kristensen, M.; Pedersen, P.; Mejer, J. The Value of Dihydrouracil/Uracil Plasma Ratios in Predicting 5-Fluorouracil-Related Toxicity in Colorectal Cancer Patients. J. Int. Med. Res. 2010, 38, 1313–1323. [Google Scholar] [CrossRef]
- Sistonen, J.; Büchel, B.; Froehlich, T.K.; Kummer, D.; Fontana, S.; Joerger, M.; van Kuilenburg, A.B.; Largiadèr, C.R. Predicting 5-fluorouracil toxicity: DPD genotype and 5,6-dihydrouracil:uracil ratio. Pharmacogenomics 2014, 15, 1653–1666. [Google Scholar] [CrossRef]
- Basbous, J.; Aze, A.; Chaloin, L.; Lebdy, R.; Hodroj, D.; Ribeyre, C.; Larroque, M.; Shepard, C.; Kim, B.; Pruvost, A.; et al. Dihydropyrimidinase Protects from DNA Replication Stress Caused by Cytotoxic Metabolites. Immunol. Cancer Biol. 2021, 48, 1886–1904. [Google Scholar] [CrossRef] [PubMed]
- Handa, R.J.; Sharma, D.; Uht, R. A Role for the Androgen Metabolite, 5alpha Androstane 3beta, 17beta Diol (3β-Diol) in the Regulation of the Hypothalamo-Pituitary-Adrenal Axis. Front. Endocrinol. (Lausanne) 2011, 2, 65. [Google Scholar] [CrossRef]
- Handa, R.J.; Weiser, M.J.; Zuloaga, D.G. A Role for the Androgen Metabolite, 5alpha-Androstane-3beta,17beta-Diol, in Modulating Oestrogen Receptor Beta-Mediated Regulation of Hormonal Stress Reactivity. J. Neuroendocrinol. 2009, 21, 351–358. [Google Scholar] [CrossRef]
- Mero, A.A.; Ojala, T.; Hulmi, J.J.; Puurtinen, R.; Karila, T.A.; Seppälä, T. Effects of alfa-hydroxy-isocaproic acid on body composition, DOMS and performance in athletes. J. Int. Soc. Sports Nutr. 2010, 7, 1. [Google Scholar] [CrossRef]
- Ojala, T.; Wilson, J.M.; Hulmi, J.J.; Karila, T.; Seppälä, T.A.; Mero, A.A. Chapter 21—A-Hydroxy-Isocaproic Acid (Hica)—Effects on Body Composition, Muscle Soreness and Athletic Performance. In Nutrition and Enhanced Sports Performance; Bagchi, D., Nair, S., Sen, C.K., Eds.; Academic Press: San Diego, CA, USA, 2013; pp. 213–216. [Google Scholar]
- Sakko, M.; Tjäderhane, L.; Sorsa, T.; Hietala, P.; Järvinen, A.; Bowyer, P.; Rautemaa, R. 2-Hydroxyisocaproic acid (HICA): A new potential topical antibacterial agent. Int. J. Antimicrob. Agents 2012, 39, 539–540. [Google Scholar] [CrossRef]
- Kuhara, T.; Shinka, T.; Inoue, Y.; Matsumoto, M.; Yoshino, M.; Sakaguchi, Y.; Matsumoto, I. Studies of Urinary Organic Acid Profiles of a Patient with Dihydrolipoyl Dehydrogenase Deficiency. Clin. Chim. Acta 1983, 133, 133–140. [Google Scholar]
- Sumi, K.; Sakuda, M.; Munakata, K.; Nakamura, K.; Ashida, K. α-Hydroxyisocaproic Acid Decreases Protein Synthesis but Attenuates TNFα/IFNγ Co-Exposure-Induced Protein Degradation and Myotube Atrophy via Suppression of iNOS and IL-6 in Murine C2C12 Myotube. Nutrients 2021, 13, 2391. [Google Scholar] [CrossRef]
- Nathaniel, T.I.; Stewart, B.; Williams, J.; Hood, M.; Imeh-Nathaniel, A. A New Insight into the Ability to Resist Ischemic Brain Injury: Does Hibernation Matter?: An Editorial Comment for ‘Arctic Ground Squirrel Hippocampus Tolerates Oxygen Glucose Deprivation Independent of Hibernation Season Even When Not Hibernating and after Atp Depletion, Acidosis and Glutamate Efflux’. J. Neurochem. 2017, 142, 10–13. [Google Scholar] [PubMed]
- Salminen, A.; Hyttinen, J.M.; Kaarniranta, K. Amp-Activated Protein Kinase Inhibits Nf-Κb Signaling and Inflammation: Impact on Healthspan and Lifespan. J. Mol. Med. (Berlin) 2011, 89, 667–676. [Google Scholar] [CrossRef] [PubMed]
- Ebner, N.; Sliziuk, V.; Scherbakov, N.; Sandek, A. Muscle wasting in ageing and chronic illness. ESC Hear. Fail. 2015, 2, 58–68. [Google Scholar] [CrossRef]
- Zhao, C.; Huang, H.; Pan, Q.; Huang, W.; Peng, W.; Xu, H.; Feng, Z.; Du, Y.; Nie, Y.; Zhou, Y. Unconjugated Bilirubin Attenuates DSS-Induced Colitis Potentially via Enhancement of Bilirubin Reabsorption. Front. Pharmacol. 2021, 12. [Google Scholar] [CrossRef]
- Liu, Y.; Li, P.; Lu, J.; Xiong, W.; Oger, J.; Tetzlaff, W.; Cynader, M. Bilirubin Possesses Powerful Immunomodulatory Activity and Suppresses Experimental Autoimmune Encephalomyelitis. J. Immunol. 2008, 181, 1887–1897. [Google Scholar] [CrossRef] [PubMed]
- Allen, C.L.; Bayraktutan, U. Oxidative Stress and Its Role in the Pathogenesis of Ischaemic Stroke. Int. J. Stroke 2009, 4, 461–470. [Google Scholar] [CrossRef] [PubMed]
- Dohi, K.; Mochizuki, Y.; Satoh, K.; Jimbo, H.; Hayashi, M.; Toyoda, I.; Ikeda, Y.; Abe, T.; Aruga, T. Transient elevation of serum bilirubin (a heme oxygenase-1 metabolite) level in hemorrhagic stroke: Bilirubin is a marker of oxidant stress. Brain Edema XII 2003, 86, 247–249. [Google Scholar] [CrossRef]
- Ohira, T.; Peacock, J.M.; Iso, H.; Chambless, L.E.; Rosamond, W.D.; Folsom, A.R. Serum and Dietary Magnesium and Risk of Ischemic Stroke: The Atherosclerosis Risk in Communities Study. Am. J. Epidemiol. 2009, 169, 1437–1444. [Google Scholar] [CrossRef] [PubMed]
- Zhao, B.; Hu, L.; Dong, Y.; Xu, J.; Wei, Y.; Yu, D.; Xu, J.; Zhang, W. The Effect of Magnesium Intake on Stroke Incidence: A Systematic Review and Meta-Analysis with Trial Sequential Analysis. Front. Neurol. 2019, 10, 852. [Google Scholar] [CrossRef]
- Fleming, T.; Blum, B.; Averkamp, B.; Sullivan, J.; Nathaniel, T. Effect of Antihypertensive Medications on Thrombolysis Therapy and Outcomes in Acute Ischemic Stroke Patients. J. Clin. Hypertens. 2019, 21, 271–279. [Google Scholar] [CrossRef] [PubMed]


| Biochemical | Super Pathway | Sub Pathway | Control | Ischemic | p-Value |
|---|---|---|---|---|---|
| Alanine | Amino Acid | Alanine and Aspartate Metabolism | 1.29 ± 0.3 | 1.04 ± 0.16 | 0.043 |
| Indoleacetate | Amino Acid | Tryptophan Metabolism | 1.62 ± 1 | 0.82 ± 0.39 | 0.039 |
| Isovalerate (C5) | Amino Acid | Leucine, Isoleucine and Valine Metabolism | 2.11 ± 1.57 | 0.72 ± 0.28 | 0.03 |
| 3-sulfo-L-alanine | Amino Acid | Methionine, Cysteine, SAM and Taurine Metabolism | 1.23 ± 0.48 | 0.78 ± 0.31 | 0.03 |
| Retinol (Vitamin A) | Cofactors and Vitamins | Vitamin A Metabolism | 1.37 ± 0.55 | 0.88 ± 0.29 | 0.037 |
| Arachidate (20:0) | Lipid | Long Chain Saturated Fatty Acid | 1.25 ± 0.26 | 0.97 ± 0.28 | 0.041 |
| Palmitoloelycholine | Lipid | Fatty Acid Metabolism (Acyl Choline) | 2.33 ± 2.23 | 0.54 ± 0.49 | 0.044 |
| Dihomo-linolenoyl-choline | Lipid | Fatty Acid Metabolism (Acyl Choline) | 4.06 ± 4.39 | 0.74 ± 0.77 | 0.04 |
| Dtearoyl ethanolamide | Lipid | Endocannabinoid | 0.88 ± 0.35 | 1.21 ± 0.3 | 0.045 |
| N-oleoyltaurine | Lipid | Endocannabinoid | 0.57 ± 0.35 | 1.11 ± 0.64 | 0.042 |
| Glycerophosphorylcholine (GPC) | Lipid | Phospholipid Metabolism | 1.43 ± 0.58 | 0.94 ± 0.32 | 0.041 |
| 1-myristoyl-2-palmitoyl-GPC (14:0/16:0) | Lipid | Phosphatidylcholine (PC) | 1.92 ± 0.79 | 1.12 ± 0.6 | 0.028 |
| 1-palmitoyl-2-palmitoleoyl-GPC (16:0/16:1) | Lipid | Phosphatidylcholine (PC) | 2.14 ± 1.17 | 1.13 ± 0.48 | 0.035 |
| 1-palmitoyl-2-linoleoyl-GPC (16:0/18:2) | Lipid | Phosphatidylcholine (PC) | 1.17 ± 0.11 | 1 ± 0.14 | 0.014 |
| 1-palmitoyl-2-dihomo-linolenoyl-GPC (16:0/20:3n3 or 6) | Lipid | Phosphatidylcholine (PC) | 1.35 ± 0.24 | 1 ± 0.2 | 0.003 |
| 1-palmitoyl-2-linoleoyl-GPE (16:0/18:2) | Lipid | Phosphatidylethanolamine (PE) | 1.96 ± 0.75 | 1.05 ± 0.55 | 0.009 |
| 1-stearoyl-2-linoleoyl-GPE (18:0/18:2) | Lipid | Phosphatidylethanolamine (PE) | 1.9 ± 0.77 | 1.14 ± 0.5 | 0.025 |
| 1-oleoyl-2-linoleoyl-GPE (18:1/18:2) | Lipid | Phosphatidylethanolamine (PE) | 2.54 ± 1.18 | 1.29 ± 0.73 | 0.016 |
| 1-palmitoyl-2-oleoyl-GPI (16:0/18:1) | Lipid | Phosphatidylinositol (PI) | 1.97 ± 0.56 | 1.33 ± 0.55 | 0.026 |
| 1-palmitoyl-2-linoleoyl-GPI (16:0/18:2) | Lipid | Phosphatidylinositol (PI) | 1.83 ± 0.58 | 1.23 ± 0.44 | 0.026 |
| 1-palmitoyl-2-arachidonoyl-GPI (16:0/20:4) | Lipid | Phosphatidylinositol (PI) | 1.65 ± 0.57 | 1.04 ± 0.36 | 0.016 |
| 1-linoleoyl-GPA (18:2) | Lipid | Lysophospholipid | 2.2 ± 1.04 | 1.13 ± 0.62 | 0.017 |
| 1-palmitoyl-GPC (16:0) | Lipid | Lysophospholipid | 1.17 ± 0.17 | 0.93 ± 0.11 | 0.003 |
| 2-palmitoyl-GPC (16:0) | Lipid | Lysophospholipid | 1.28 ± 0.37 | 0.9 ± 0.36 | 0.041 |
| 1-palmitoleoyl-GPC (16:1) | Lipid | Lysophospholipid | 1.79 ± 0.68 | 1.01 ± 0.32 | 0.006 |
| 2-palmitoleoyl-GPC (16:1) | Lipid | Lysophospholipid | 1.63 ± 0.9 | 0.75 ± 0.47 | 0.02 |
| 1-palmitoyl-GPI (16:0) | Lipid | Lysophospholipid | 1.92 ± 0.96 | 0.86 ± 0.64 | 0.015 |
| 1-stearoyl-GPI (18:0) | Lipid | Lysophospholipid | 1.36 ± 0.43 | 0.89 ± 0.5 | 0.048 |
| 1-linoleoyl-GPI (18:2) | Lipid | Lysophospholipid | 1.54 ± 0.59 | 1 ± 0.49 | 0.048 |
| 1-(1-enyl-palmitoyl)-2-palmitoyl-GPC (P-16:0/16:0) | Lipid | Plasmalogen | 0.92 ± 0.21 | 1.27 ± 0.29 | 0.01 |
| 1-(1-enyl-palmitoyl)-2-arachidonoyl-GPC (P-16:0/20:4) | Lipid | Plasmalogen | 0.86 ± 0.23 | 1.25 ± 0.27 | 0.005 |
| 1-palmitoylglycerol (16:0) | Lipid | Monoacylglycerol | 2.12 ± 1.1 | 0.7 ± 0.31 | 0.004 |
| 1-palmitoleoylglycerol (16:1) | Lipid | Monoacylglycerol | 2.6 ± 2.06 | 0.72 ± 0.44 | 0.026 |
| 1-oleoylglycerol (18:1) | Lipid | Monoacylglycerol | 1.69 ± 1.01 | 0.83 ± 0.5 | 0.035 |
| 1-linoleoylglycerol (18:2) | Lipid | Monoacylglycerol | 1.65 ± 0.92 | 0.85 ± 0.53 | 0.037 |
| 1-linolenoylglycerol (18:3) | Lipid | Monoacylglycerol | 1.76 ± 1 | 0.86 ± 0.52 | 0.034 |
| 1-dihomo-linolenylglycerol (20:3) | Lipid | Monoacylglycerol | 2.69 ± 2.15 | 0.87 ± 0.63 | 0.027 |
| 2-palmitoylglycerol (16:0) | Lipid | Monoacylglycerol | 1.35 ± 1.11 | 0.39 ± 0.35 | 0.034 |
| 2-palmitoleoylglycerol (16:1) | Lipid | Monoacylglycerol | 2.17 ± 1.99 | 0.31 ± 0.51 | 0.024 |
| 1-heptadecenoylglycerol (17:1) | Lipid | Monoacylglycerol | 1.49 ± 1.04 | 0.61 ± 0.31 | 0.037 |
| Palmitoyl-oleoyl-glycerol (16:0/18:1) | Lipid | Diacylglycerol | 3.07 ± 2.59 | 0.95 ± 0.8 | 0.032 |
| Palmitoyl-linoleoyl-glycerol (16:0/18:2) | Lipid | Diacylglycerol | 1.94 ± 1.26 | 0.92 ± 0.53 | 0.046 |
| Palmitoyl-docosahexaenoyl-glycerol (16:0/22:6) | Lipid | Diacylglycerol | 1.63 ± 1.06 | 0.67 ± 0.46 | 0.03 |
| Oleoyl-oleoyl-glycerol (18:1/18:1) | Lipid | Diacylglycerol | 3.03 ± 2.4 | 1.09 ± 0.64 | 0.044 |
| Sphingomyelin (d17:1/14:0, d16:1/15:0) | Lipid | Sphingomyelins | 1.63 ± 0.52 | 1.13 ± 0.47 | 0.047 |
| Sphingomyelin (d18:2/24:1, d18:1/24:2) | Lipid | Sphingomyelins | 1.04 ± 0.2 | 1.27 ± 0.23 | 0.038 |
| 5,6-dihydrouracil | Nucleotide | Pyrimidine Metabolism, Uracil containing | 0.89 ± 0.29 | 1.43 ± 0.6 | 0.027 |
| Gamma-glutamylalanine | Peptide | Gamma-glutamyl Amino Acid | 1.57 ± 0.59 | 0.82 ± 0.32 | 0.004 |
| Gamma-glutamylhistidine | Peptide | Gamma-glutamyl Amino Acid | 1.23 ± 0.37 | 0.81 ± 0.32 | 0.021 |
| Gamma-glutamyl-epsilon-lysine | Peptide | Gamma-glutamyl Amino Acid | 1.17 ± 0.29 | 0.9 ± 0.25 | 0.049 |
| Metabolonic lactone sulfate | Partially Characterized Molecules | Partially Characterized Molecules | 2 ± 1.34 | 0.47 ± 0.49 | 0.009 |
| 4-allylcatechol sulfate | Xenobiotics | Benzoate Metabolism | 1.21 ± 0.79 | 0.52 ± 0.42 | 0.032 |
| S-allylcysteine | Xenobiotics | Food Component/Plant | 2.49 ± 2.47 | 0.32 ± 0.38 | 0.03 |
| 2,6-dihydroxybenzoic acid | Xenobiotics | Drug—Topical Agents | 2.31 ± 1.2 | 1 ± 0.58 | 0.009 |
| Thioproline | Xenobiotics | Chemical | 1.13 ± 0.36 | 0.8 ± 0.27 | 0.048 |
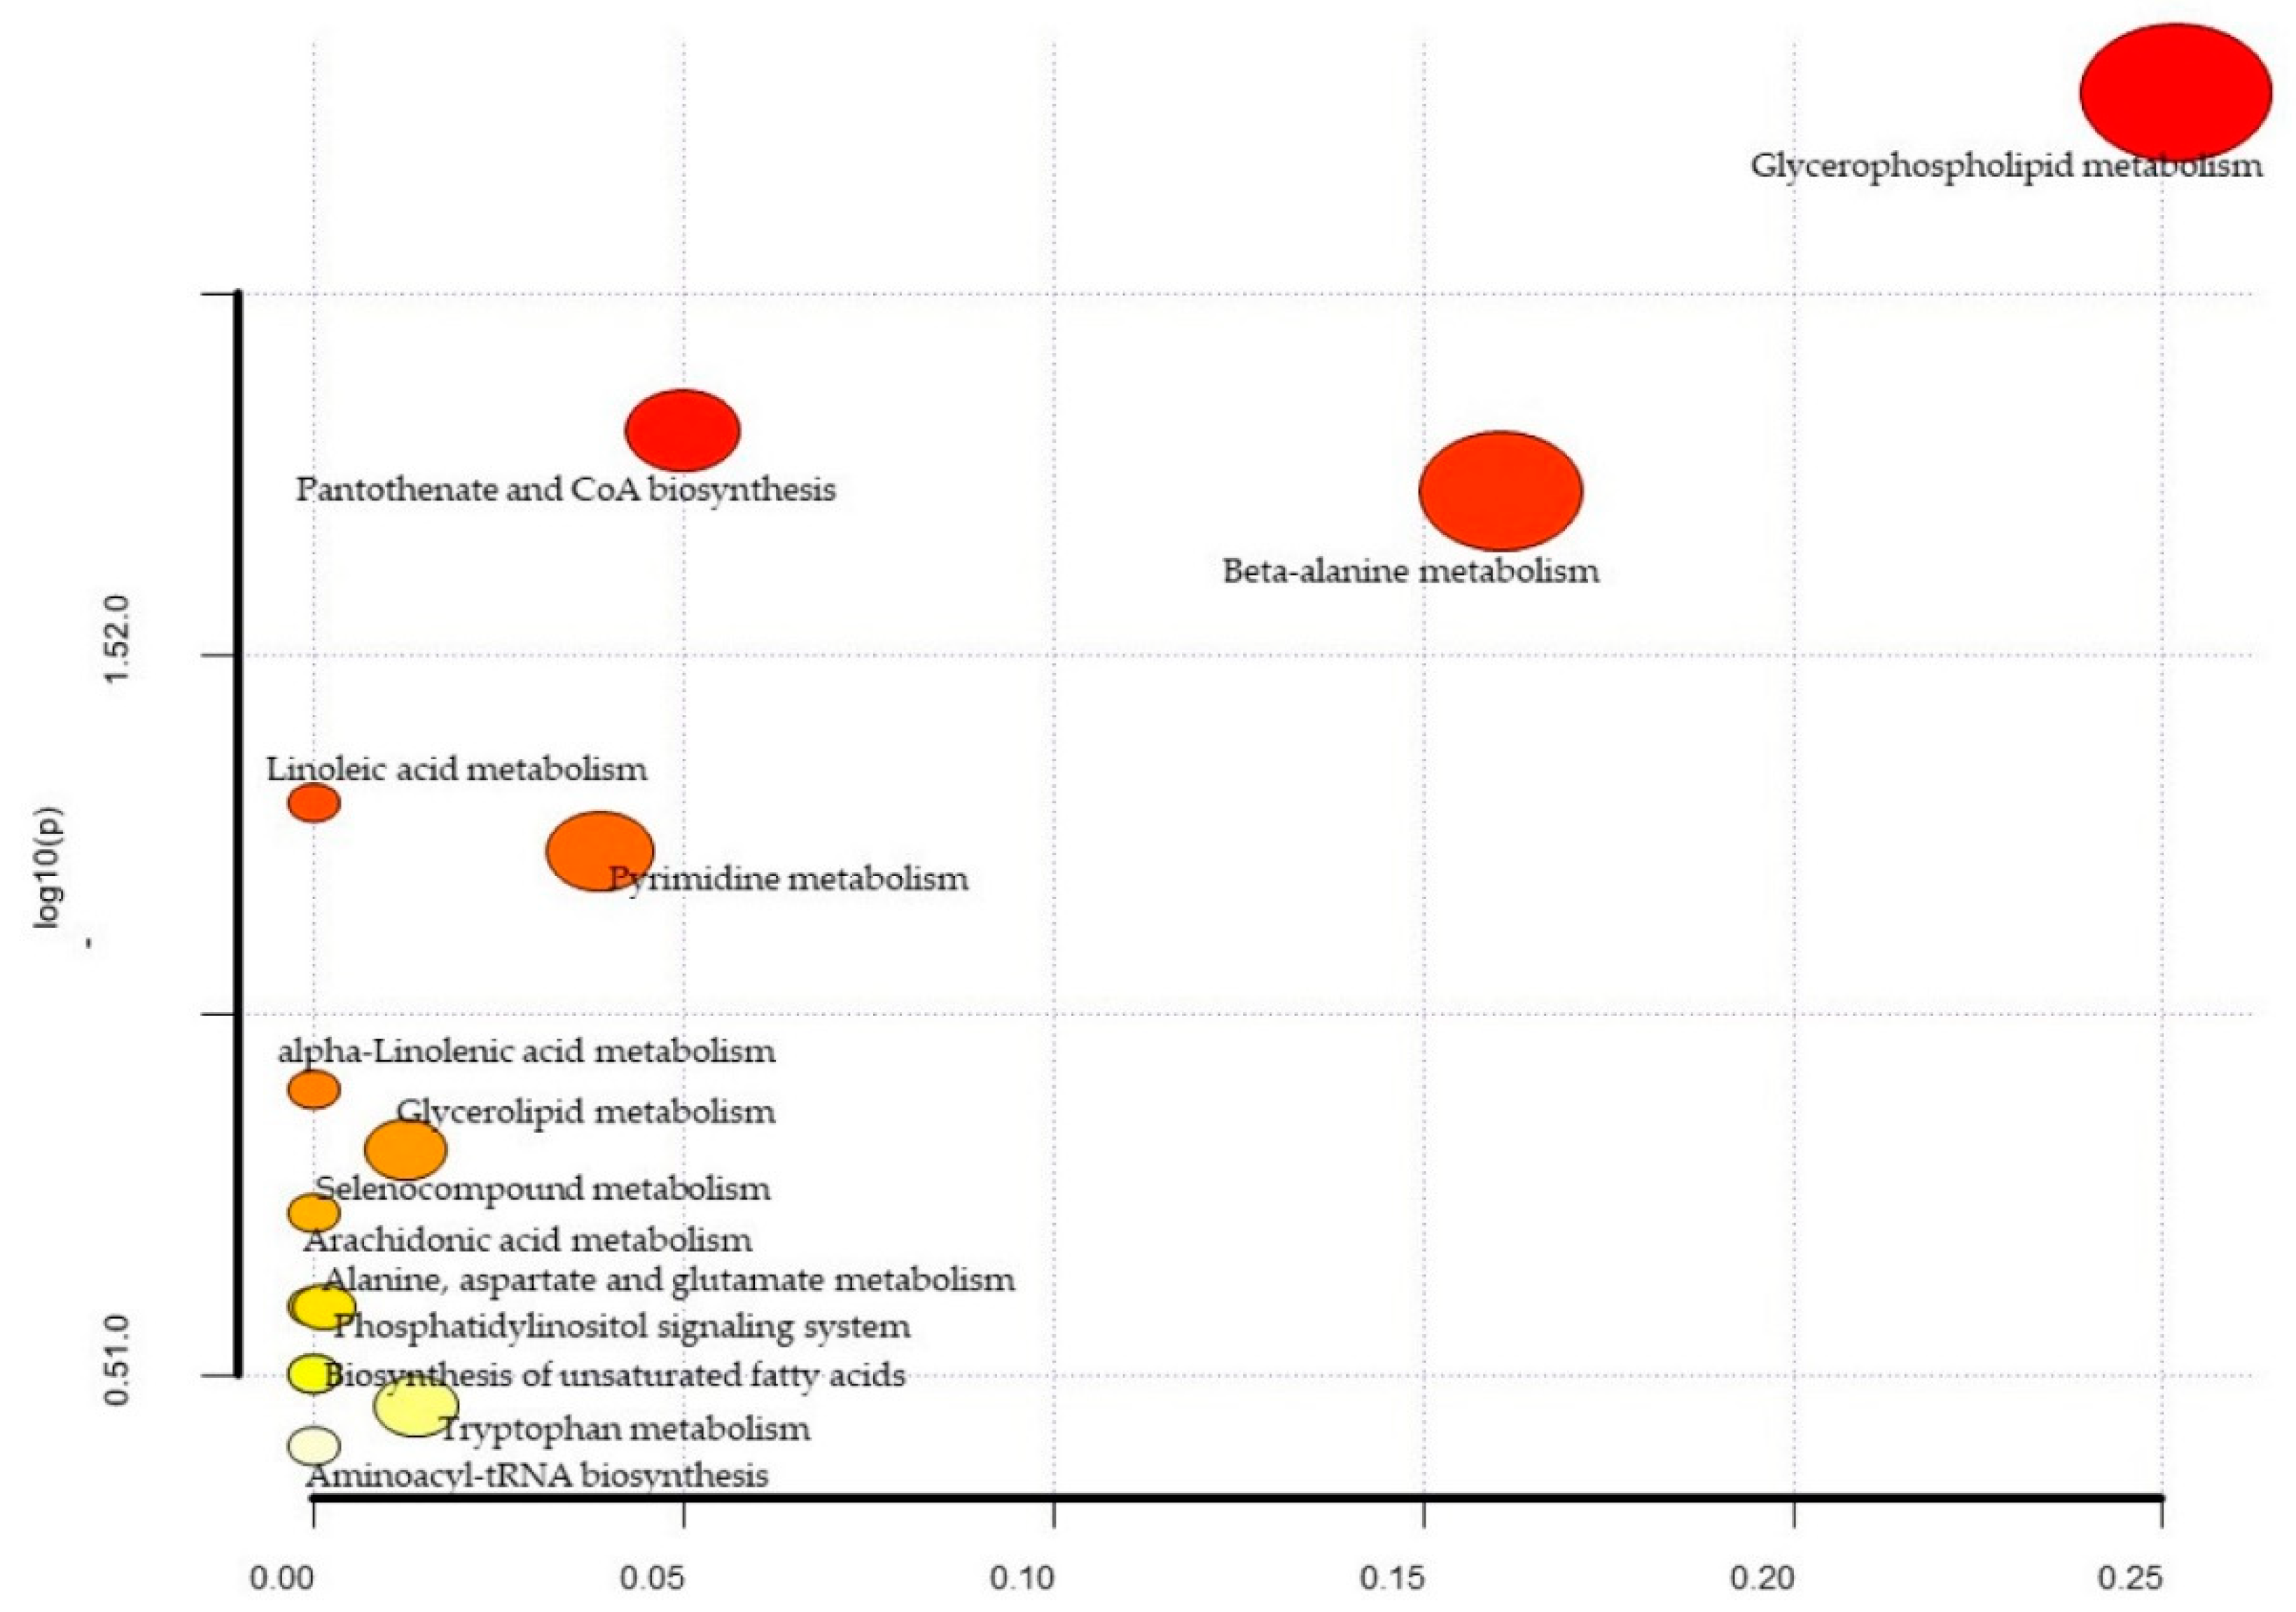
| Metabolites | Total | Expected | Hits | Raw p | −log10(p) | Holm Adjust | FDR | Impact |
|---|---|---|---|---|---|---|---|---|
| Glycerophospholipid metabolism | 36 | 0.37 | 3 | 5.24 × 10⁻³ | 2.28 × 100 | 4.40 × 10⁻¹ | 4.40 × 101 | 0.25 |
| Pantothenate and CoA biosynthesis | 19 | 0.20 | 2 | 1.54 × 10⁻² | 1.81 × 100 | 1.00 × 100 | 5.24 × 101 | 0.05 |
| beta-Alanine metabolism | 21 | 0.22 | 2 | 1.87 × 10⁻² | 1.73 × 100 | 1.00 × 100 | 5.24 × 101 | 0.16 |
| Linoleic acid metabolism | 5 | 0.05 | 1 | 5.06 × 10⁻² | 1.30 × 100 | 1.00 × 100 | 9.96 × 101 | 0.00 |
| Pyrimidine metabolism | 39 | 0.40 | 2 | 5.93 × 10⁻² | 1.23 × 100 | 1.00 × 100 | 9.96 × 101 | 0.04 |
| alpha-Linolenic acid metabolism | 13 | 0.13 | 1 | 1.27 × 10⁻¹ | 8.97 × 10⁻¹ | 1.00 × 100 | 1.00 × 100 | 0.00 |
| Glycerolipid metabolism | 16 | 0.17 | 1 | 1.54 × 10⁻¹ | 8.13 × 10⁻¹ | 1.00 × 100 | 1.00 × 100 | 0.01 |
| Selenocompound metabolism | 20 | 0.21 | 1 | 1.88 × 10⁻¹ | 7.25 × 10⁻¹ | 1.00 × 100 | 1.00 × 100 | 0.00 |
| Alanine, aspartate and glutamate metabolism | 28 | 0.29 | 1 | 2.54 × 10⁻¹ | 5.95 × 10⁻¹ | 1.00 × 100 | 11.00 × 100 | 0.00 |
| Phosphatidylinositol signaling system | 28 | 0.29 | 1 | 2.54 × 10⁻¹ | 5.95 × 10⁻¹ | 1.00 × 100 | 1.00 × 100 | 0.00 |
| Arachidonic acid metabolism | 36 | 0.37 | 1 | 3.15 × 10⁻¹ | 5.02 × 10⁻¹ | 1.00 × 100 | 1.00 × 100 | 0.00 |
| Biosynthesis of unsaturated fatty acids | 36 | 0.37 | 1 | 3.15 × 10⁻¹ | 5.02 × 10⁻¹ | 1.00 × 100 | 1.00 × 100 | 0.00 |
| Tryptophan metabolism | 41 | 0.42 | 1 | 3.50 × 10⁻¹ | 4.56 × 10⁻¹ | 1.00 × 100 | 1.00 × 100 | 0.01 |
| Aminoacyl-tRNA biosynthesis | 48 | 0.50 | 1 | 3.97 × 10⁻¹ | 4.01 × 10⁻¹ | 1.00 × 100 | 1.00 × 100 | 0.00 |
| Biochemical. | Super Pathway | Sub Pathway | Control | Ischemic | p-Value |
|---|---|---|---|---|---|
| N6-acetyllysine | Amino Acid | Lysine Metabolism | 1.13 ± 0.34 | 0.69 ± 0.21 | 0.004 |
| Fructosyllysine | Amino Acid | Lysine Metabolism | 0.79 ± 0.25 | 1.52 ± 0.93 | 0.037 |
| 4-methyl-2-oxopentanoate | Amino Acid | Leucine, Isoleucine and Valine Metabolism | 0.8 ± 0.32 | 1.73 ± 1.07 | 0.033 |
| Alpha-hydroxyisocaproate | Amino Acid | Leucine, Isoleucine and Valine Metabolism | 0.71 ± 0.3 | 1.75 ± 0.68 | 0.001 |
| 3-methyl-2-oxovalerate | Amino Acid | Leucine, Isoleucine and Valine Metabolism | 0.77 ± 0.37 | 1.41 ± 0.77 | 0.045 |
| 3-methyl-2-oxobutyrate | Amino Acid | Leucine, Isoleucine and Valine Metabolism | 0.89 ± 0.25 | 1.36 ± 0.57 | 0.048 |
| N-acetylmethionine sulfoxide | Amino Acid | Methionine, Cysteine, SAM and Taurine Metabolism | 1.81 ± 1.27 | 0.59 ± 0.24 | 0.02 |
| Threonate | Cofactors and Vitamins | Ascorbate and Aldarate Metabolism | 0.58 ± 0.34 | 1.12 ± 0.3 | 0.003 |
| Oxalate (ethanedioate) | Cofactors and Vitamins | Ascorbate and Aldarate Metabolism | 0.53 ± 0.36 | 1.17 ± 0.42 | 0.003 |
| Bilirubin (E,Z or Z,E) | Cofactors and Vitamins | Hemoglobin and Porphyrin Metabolism | 1.03 ± 0.65 | 1.79 ± 0.85 | 0.049 |
| Erucate (22:1n9) | Lipid | Long Chain Monounsaturated Fatty Acid | 0.92 ± 0.28 | 1.2 ± 0.28 | 0.049 |
| Linolenoylcarnitine (C18:3) | Lipid | Fatty Acid Metabolism (Acyl Carnitine, Polyunsaturated) | 0.77 ± 0.42 | 1.23 ± 0.5 | 0.049 |
| 3-hydroxyoleoylcarnitine | Lipid | Fatty Acid Metabolism (Acyl Carnitine, Hydroxy) | 0.7 ± 0.4 | 1.18 ± 0.54 | 0.047 |
| 3-hydroxydecanoate | Lipid | Fatty Acid, Monohydroxy | 0.86 ± 0.38 | 1.39 ± 0.5 | 0.021 |
| 3-hydroxylaurate | Lipid | Fatty Acid, Monohydroxy | 0.76 ± 0.45 | 1.38 ± 0.61 | 0.026 |
| 3-hydroxymyristate | Lipid | Fatty Acid, Monohydroxy | 0.74 ± 0.31 | 1.41 ± 0.56 | 0.006 |
| 3-hydroxyoleate | Lipid | Fatty Acid, Monohydroxy | 0.75 ± 0.41 | 1.95 ± 1.2 | 0.018 |
| 1-linoleoyl-GPG (18:2) | Lipid | Lysophospholipid | 0.71 ± 0.35 | 1.18 ± 0.36 | 0.013 |
| Glycosyl ceramide (d18:2/24:1, d18:1/24:2) | Lipid | Hexosylceramides (HCER) | 1.2 ± 0.42 | 0.76 ± 0.23 | 0.014 |
| 5alpha-pregnan-3beta,20alpha-diol monosulfate (2) | Lipid | Progestin Steroids | 0.51 ± 0.4 | 1.14 ± 0.71 | 0.039 |
| 5alpha-pregnan-3beta,20alpha-diol disulfate | Lipid | Progestin Steroids | 0.78 ± 0.55 | 1.54 ± 0.58 | 0.013 |
| Cortisone | Lipid | Corticosteroids | 0.67 ± 0.43 | 1.13 ± 0.34 | 0.024 |
| Androstenediol (3beta,17beta) monosulfate (1) | Lipid | Androgenic Steroids | 0.67 ± 0.41 | 2.46 ± 1.87 | 0.021 |
| Androstenediol (3beta,17beta) disulfate | Lipid | Androgenic Steroids | 1.13 ± 0.99 | 2.39 ± 0.98 | 0.015 |
| Androstenediol (3alpha,17alpha) monosulfate | Lipid | Androgenic Steroids | 0.87 ± 0.75 | 2.48 ± 2.02 | 0.039 |
| 5alpha-androstan-3alpha,17beta-diol disulfate | Lipid | Androgenic Steroids | 0.63 ± 0.39 | 3.06 ± 2.51 | 0.02 |
| 5alpha-androstan-3alpha,17beta-diol 17-glucuronide | Lipid | Androgenic Steroids | 0.72 ± 0.74 | 1.58 ± 0.89 | 0.041 |
| 5alpha-androstan-3beta,17beta-diol disulfate | Lipid | Androgenic Steroids | 1.26 ± 1.65 | 3.95 ± 2.22 | 0.01 |
| Glycochenodeoxycholate | Lipid | Primary Bile Acid Metabolism | 1.44 ± 0.94 | 0.51 ± 0.53 | 0.022 |
| Glyco-beta-muricholate | Lipid | Primary Bile Acid Metabolism | 1.32 ± 1.32 | 0.11 ± 0.06 | 0.026 |
| Glycodeoxycholate | Lipid | Secondary Bile Acid Metabolism | 1.93 ± 1.77 | 0.19 ± 0.36 | 0.018 |
| Taurodeoxycholate | Lipid | Secondary Bile Acid Metabolism | 1.81 ± 1.9 | 0.18 ± 0.16 | 0.033 |
| Glycodeoxycholate 3-sulfate | Lipid | Secondary Bile Acid Metabolism | 1.39 ± 0.98 | 0.55 ± 0.58 | 0.044 |
| Gamma-glutamylphenylalanine | Peptide | Gamma-glutamyl Amino Acid | 1.13 ± 0.32 | 0.82 ± 0.29 | 0.048 |
| Gamma-glutamyltryptophan | Peptide | Gamma-glutamyl Amino Acid | 1.07 ± 0.41 | 0.72 ± 0.22 | 0.04 |
| Saccharin | Xenobiotics | Food Component/Plant | 1.17 ± 1.37 | 0.06 ± 0 | 0.042 |
| 4-acetamidophenylglucuronide | Xenobiotics | Drug—Analgesics, Anesthetics | 0.84 ± 0.7 | 0.26 ± 0.29 | 0.043 |
| 2-methoxyacetaminophen glucuronide | Xenobiotics | Drug—Analgesics, Anesthetics | 1.09 ± 1.06 | 0.13 ± 0.1 | 0.027 |
| 3-(methylthio)acetaminophen sulfate | Xenobiotics | Drug—Analgesics, Anesthetics | 1.97 ± 2.25 | 0.04 ± 0.07 | 0.033 |
| Total | Expected | Hits | Raw p | −log10(p) | Holm Adjust | FDR | Impact | |
|---|---|---|---|---|---|---|---|---|
| Valine, leucine and isoleucine biosynthesis | 8 | 0.07 | 3 | 3.20 × 10⁻⁵ | 4.49 × 100 | 2.69 × 10⁻³ | 2.69 × 10⁻³ | 0.00 |
| Valine, leucine and isoleucine degradation | 40 | 0.36 | 3 | 4.76 × 10³ | 2.32 × 100 | 3.95 × 10⁻¹ | 2.00 × 10⁻¹ | 0.03 |
| Pantothenate and CoA biosynthesis | 19 | 0.17 | 1 | 1.59 × 10⁻¹ | 7.98 × 10⁻¹ | 1.00 × 100 | 1.00 × 100 | 0.00 |
| Primary bile acid biosynthesis | 46 | 0.42 | 1 | 3.45 × 10⁻¹ | 4.62 × 10⁻¹ | 1.00 × 100 | 1.00 × 100 | 0.01 |
| Steroid hormone biosynthesis | 85 | 0.77 | 1 | 5.48 × 10⁻¹ | 2.62 × 10⁻¹ | 1.00 × 100 | 1.00 × 100 | 0.01 |
Publisher’s Note: MDPI stays neutral with regard to jurisdictional claims in published maps and institutional affiliations. |
© 2021 by the authors. Licensee MDPI, Basel, Switzerland. This article is an open access article distributed under the terms and conditions of the Creative Commons Attribution (CC BY) license (https://creativecommons.org/licenses/by/4.0/).
Share and Cite
Poupore, N.; Chosed, R.; Arce, S.; Rainer, R.; Goodwin, R.L.; Nathaniel, T.I. Metabolomic Profiles of Men and Women Ischemic Stroke Patients. Diagnostics 2021, 11, 1786. https://doi.org/10.3390/diagnostics11101786
Poupore N, Chosed R, Arce S, Rainer R, Goodwin RL, Nathaniel TI. Metabolomic Profiles of Men and Women Ischemic Stroke Patients. Diagnostics. 2021; 11(10):1786. https://doi.org/10.3390/diagnostics11101786
Chicago/Turabian StylePoupore, Nicolas, Renee Chosed, Sergio Arce, Robert Rainer, Richard L. Goodwin, and Thomas I. Nathaniel. 2021. "Metabolomic Profiles of Men and Women Ischemic Stroke Patients" Diagnostics 11, no. 10: 1786. https://doi.org/10.3390/diagnostics11101786
APA StylePoupore, N., Chosed, R., Arce, S., Rainer, R., Goodwin, R. L., & Nathaniel, T. I. (2021). Metabolomic Profiles of Men and Women Ischemic Stroke Patients. Diagnostics, 11(10), 1786. https://doi.org/10.3390/diagnostics11101786