Associations between Statin/Omega3 Usage and MRI-Based Radiomics Signatures in Prostate Cancer

 ,
, 
 and
and
Abstract
1. Introduction
2. Materials and Methods
2.1. Patient Selection and Clinical Data Collection
2.2. ROI Contouring and Image Processing
2.3. Radiomic Feature Extraction
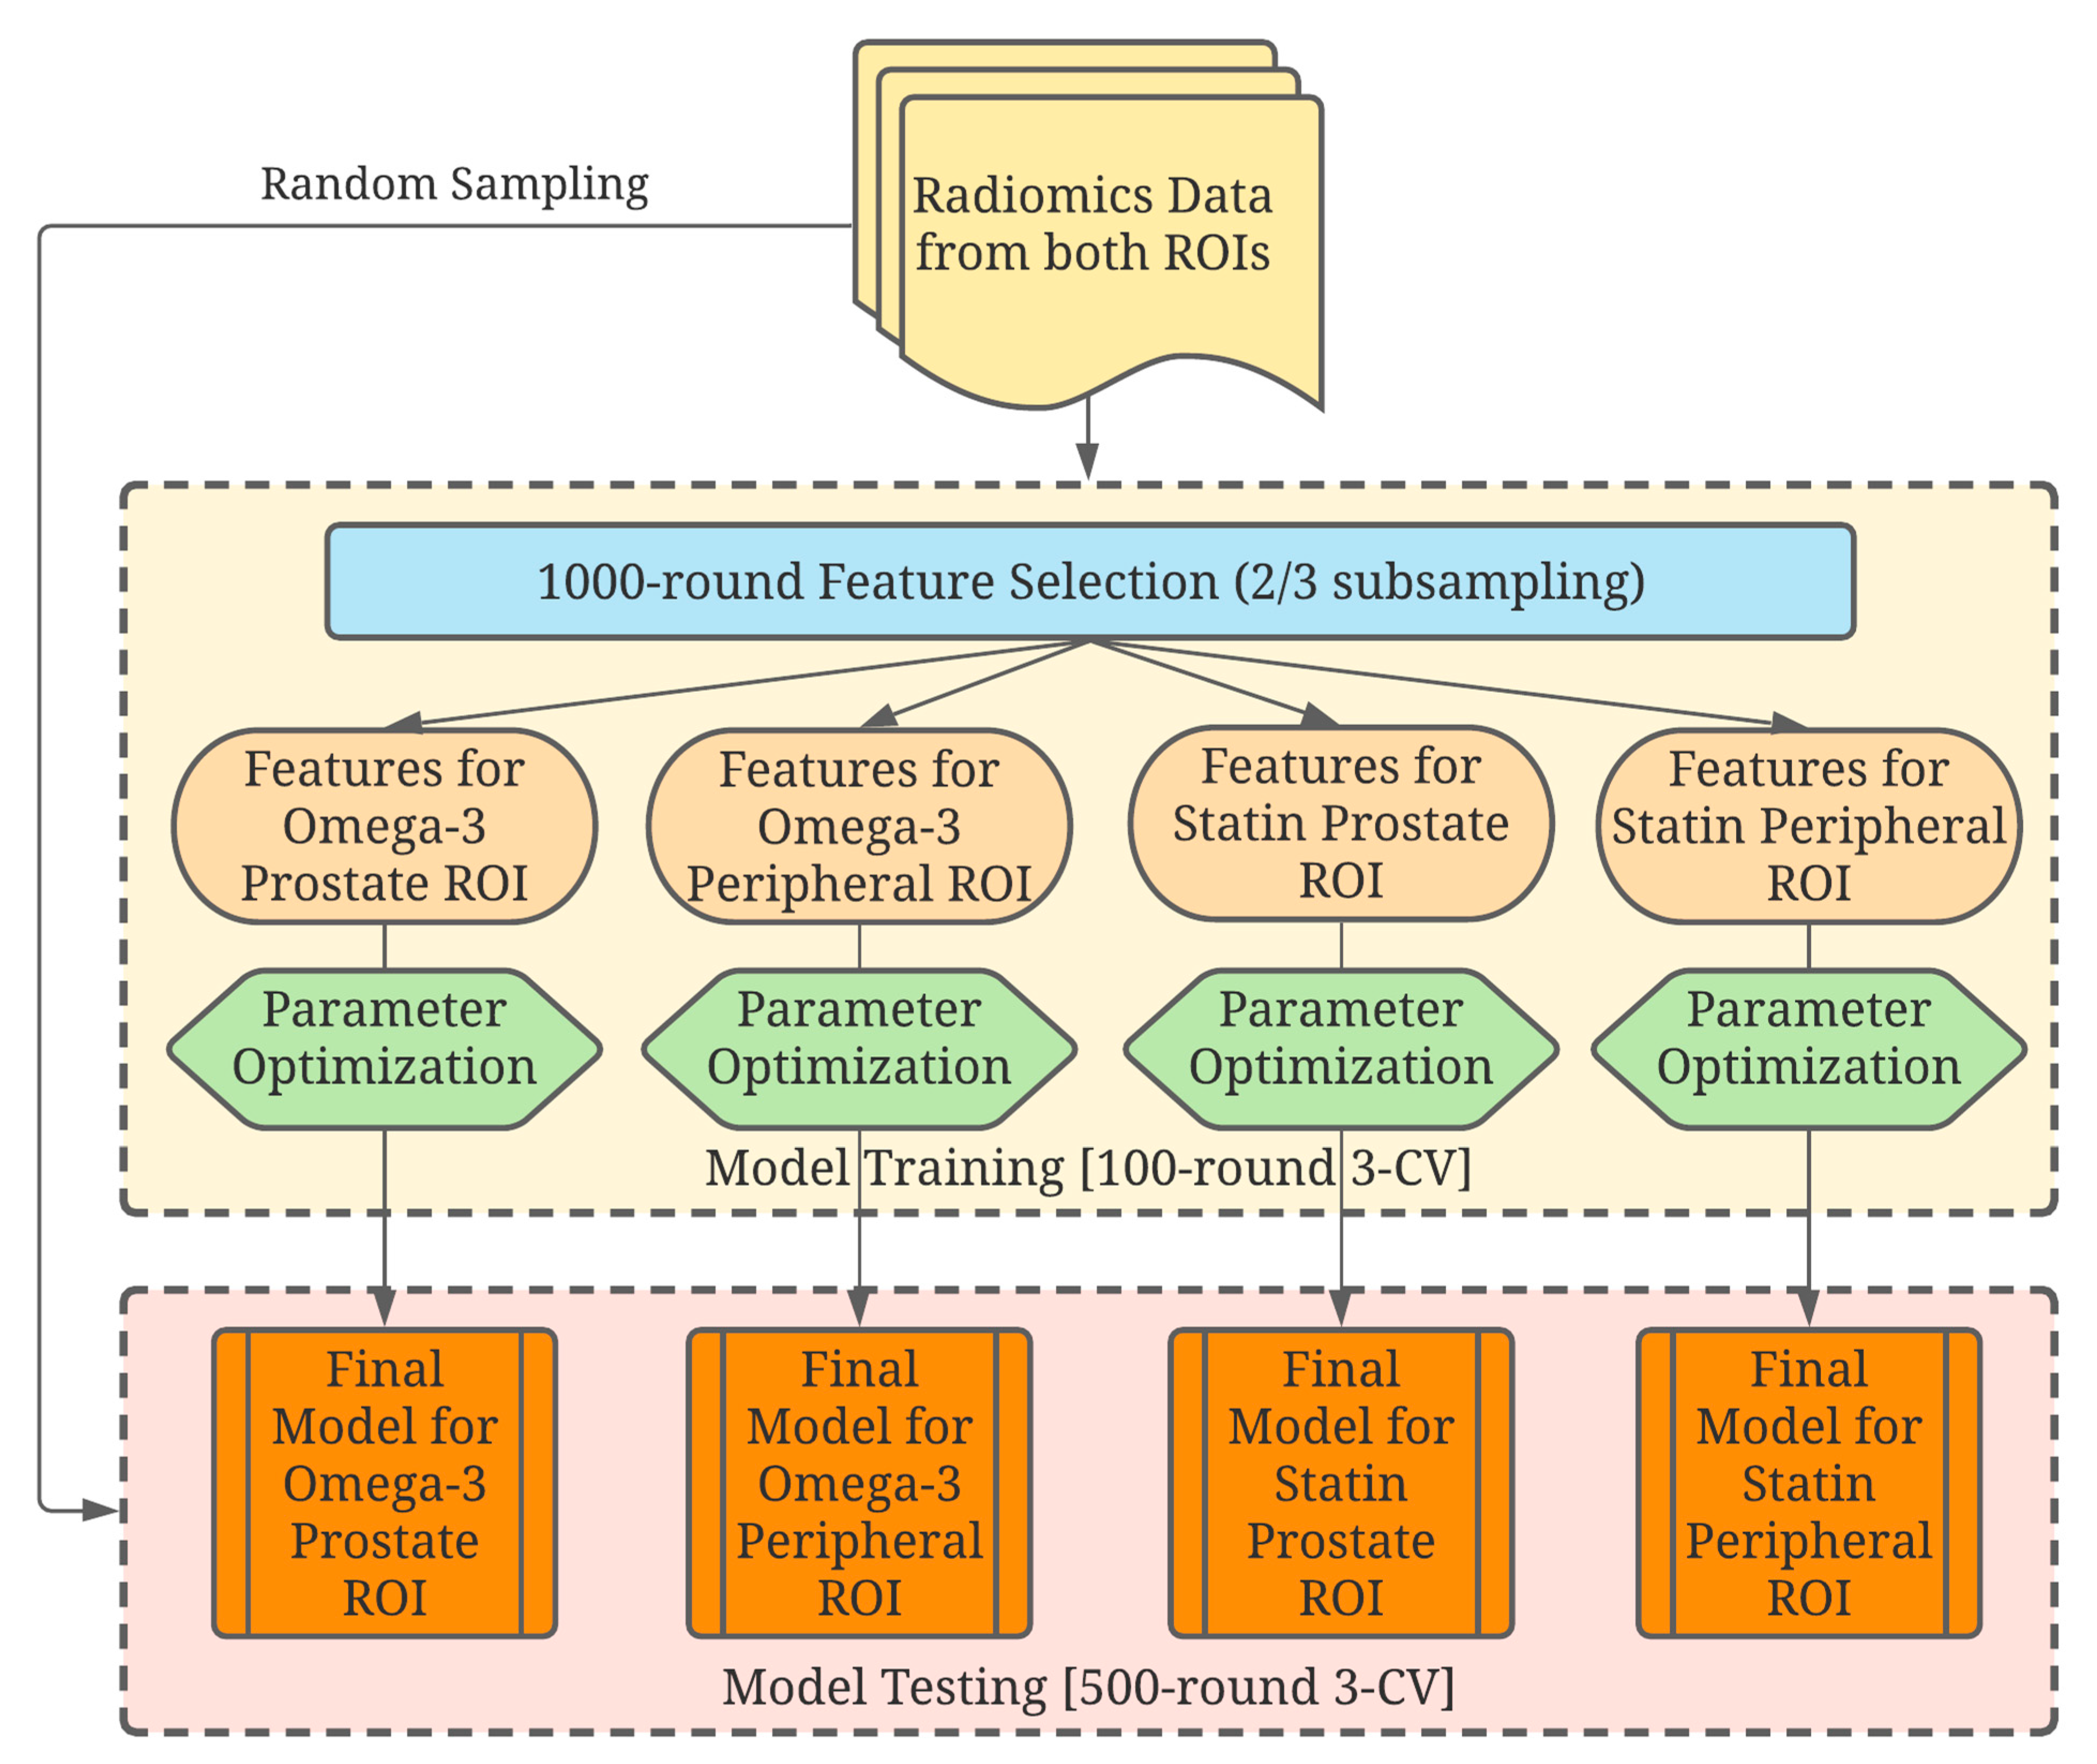
2.4. Data Analysis
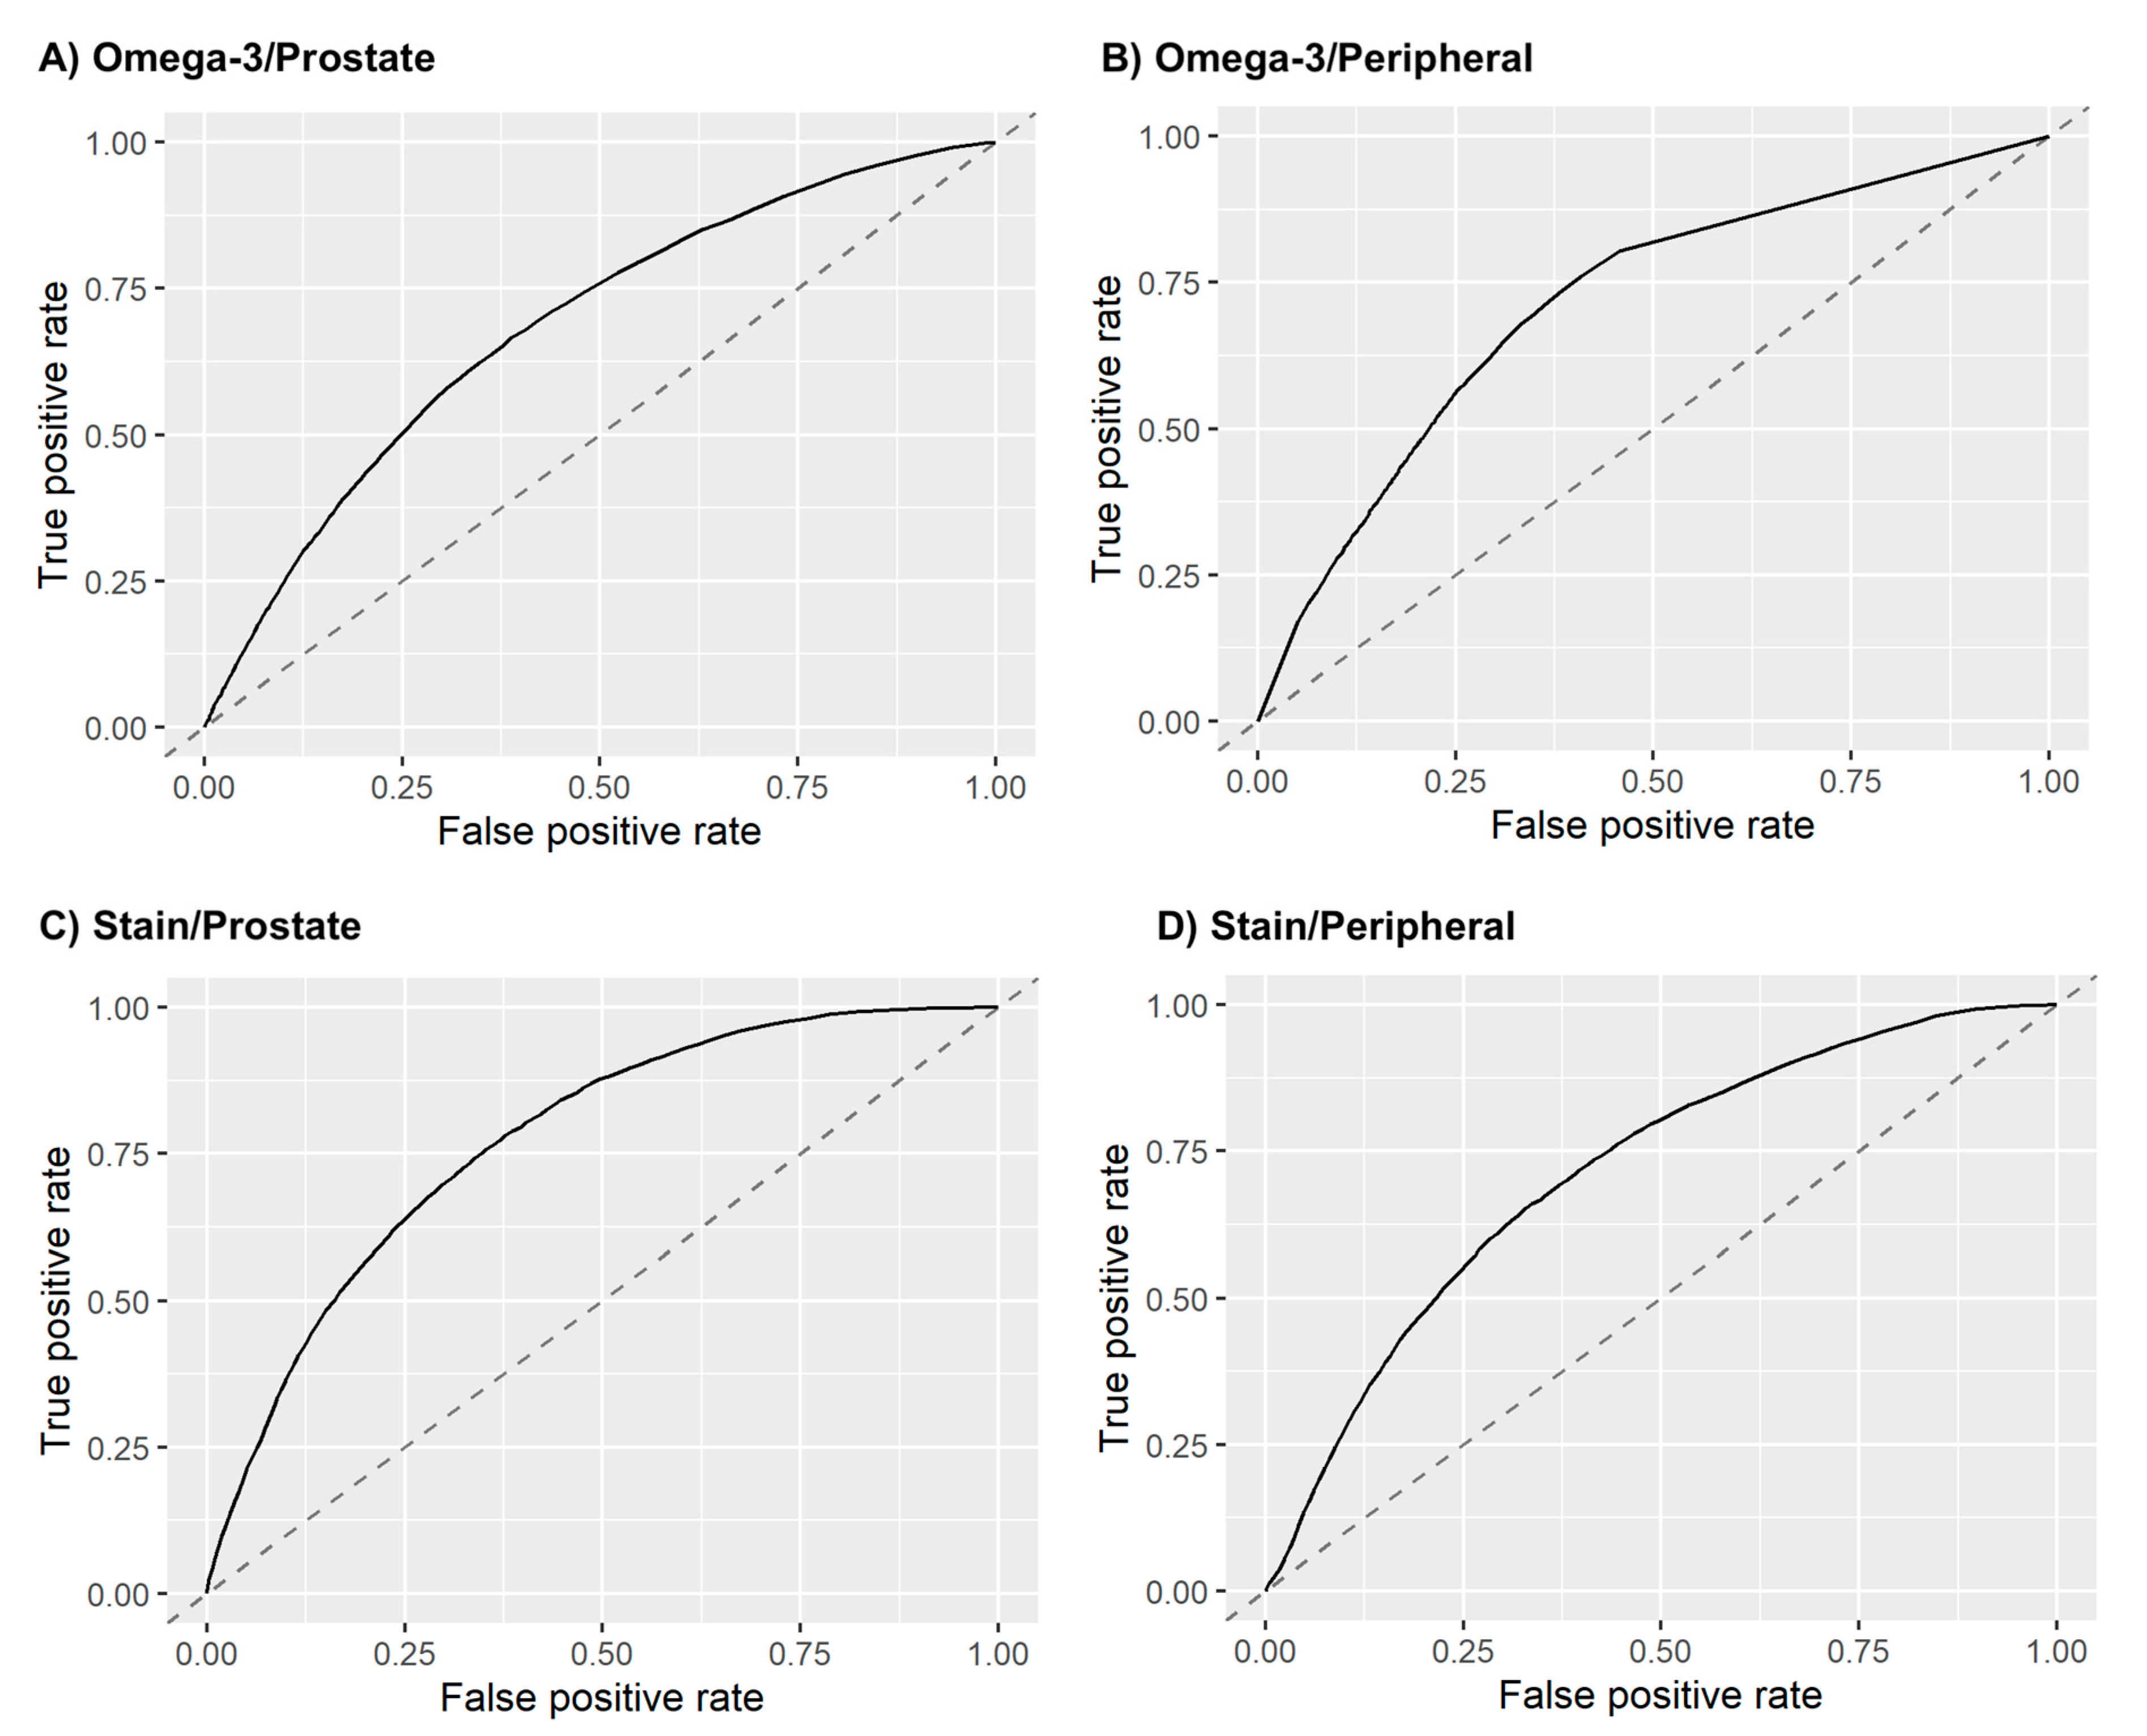
3. Results
4. Discussion
5. Conclusions
Author Contributions
Funding
Institutional Review Board Statement
Informed Consent Statement
Data Availability Statement
Conflicts of Interest
References
- Siegel, R.L.; Miller, K.D.; Jemal, A. Cancer statistics, 2020. CA Cancer J. Clin. 2020, 70, 7–30. [Google Scholar] [CrossRef]
- Allott, E.H.; Freeman, M.R.; Freedland, S.J. Statin therapy to improve prostate cancer outcomes: Who, when, and for how long? Eur. Urol. 2018, 74, 702–703. [Google Scholar] [CrossRef]
- Gevariya, N.; Besancon, M.; Robitaille, K.; Picard, V.; Diabaté, L.; Alesawi, A.; Julien, P.; Fradet, Y.; Bergeron, A.; Fradet, V.; et al. Omega-3 fatty acids decrease prostate cancer progression 0.586associated with an anti-tumor immune response in eugonadal and castrated mice. Prostate 2019, 79, 9–20. [Google Scholar] [CrossRef]
- Aucoin, M.; Cooley, K.; Knee, C.; Fritz, H.; Balneaves, L.G.; Breau, R.; Fergusson, D.; Skidmore, B.; Wong, R.; Seely, D.; et al. Fish-derived omega-3 fatty acids and prostate cancer: A systematic review. Integr. Cancer Ther. 2017, 16, 32–62. [Google Scholar] [CrossRef]
- Dinwiddie, M.T.; Terry, P.D.; Whelan, J.; Patzer, R.E. Omega-3 fatty acid consumption and prostate cancer: A review of exposure measures and results of epidemiological studies. J. Am. Coll. Nutr. 2016, 35, 452–468. [Google Scholar] [CrossRef]
- Guertin, M.H.; Robitaille, K.; Pelletier, J.F.; Duchesne, T.; Julien, P.; Savard, J.; Bairati, I.; Fradet, V. Effects of concentrated long-chain omega-3 polyunsaturated fatty acid supplementation before radical prostatectomy on prostate cancer proliferation, inflammation, and quality of life: Study protocol for a phase IIb, randomized, double-blind, placebo-controlled trial. BMC Cancer. 2018, 18, 1–10. [Google Scholar]
- Moussa, H.; Nguile-Makao, M.; Robitaille, K.; Guertin, M.H.; Allaire, J.; Pelletier, J.F.; Moreel, X.; Gevariya, N.; Diorio, C.; Desmeules, P.; et al. Omega-3 fatty acids survey in men under active surveillance for prostate cancer: From intake to prostate tissue level. Nutrients 2019, 11, 1616. [Google Scholar] [CrossRef]
- Tan, P.; Zhang, C.; Wei, S.Y.; Tang, Z.; Gao, L.; Yang, L.; Wei, Q. Effect of statins type on incident prostate cancer risk: A meta-analysis and systematic review. Asian J. Androl. 2017, 19, 666–671. [Google Scholar] [PubMed]
- Allott, E.H.; Csizmadi, I.; Howard, L.E.; Muller, R.L.; Moreira, D.M.; Andriole, G.L.; Roehrborn, C.G.; Freedland, S.J. Statin use and longitudinal changes in prostate volume; results from the REduction by DUtasteride of prostate cancer events (REDUCE) trial. BJU Int. 2020, 125, 226–233. [Google Scholar] [CrossRef]
- Carretero-Gonzalez, A.; Lora, D.; Manneh, R.; Lorente, D.; Castellano, D.; de Velasco, G. Combination of statin/vitamin D and metastatic castration-resistant prostate cancer (CRPC): A post hoc analysis of two randomized clinical trials. Clin. Transl. Oncol. 2020, 22, 2126–2129. [Google Scholar] [CrossRef]
- Goldberg, H.; Mohsin, F.K.; Saskin, R.; Kulkarni, G.S.; Berlin, A.; Kenk, M.; Wallis, C.J.; Klaassen, Z.; Chandrasekar, T.; Ahmad, A.E.; et al. The suggested unique association between the various statin subgroups and prostate cancer. Eur. Urol. Focus 2020. [Google Scholar] [CrossRef]
- Meijer, D.; van Moorselaar, R.J.A.; Vis, A.N.; Bijnsdorp, I.V. Prostate cancer development is not affected by statin use in patients with elevated PSA levels. Cancers 2019, 11, 953. [Google Scholar] [CrossRef]
- Moyad, M.A. Preventing lethal prostate cancer with diet, supplements, and rx: Heart healthy continues to be prostate healthy and “first do no harm” part II. Curr. Urol. Rep. 2020, 21, 15. [Google Scholar] [CrossRef]
- Yang, H.; Pang, L.; Hu, X.; Wang, W.; Xu, B.; Zhang, X.; Liu, L. The effect of statins on advanced prostate cancer patients with androgen deprivation therapy or abiraterone/enzalutamide: A systematic review and meta-analysis. J. Clin. Pharm. Ther. 2020, 45, 488–495. [Google Scholar] [CrossRef]
- Lambin, P.; Leijenaar, R.T.H.; Deist, T.M.; Peerlings, J. Radiomics: The bridge between medical imaging and personalized medicine. Nat. Rev. Clin. Oncol. 2017, 14, 749–762. [Google Scholar] [CrossRef]
- Aerts, H.J.; Velazquez, E.R.; Leijenaar, R.T.; Parmar, C.; Grossmann, P.; Carvalho, S.; Bussink, J.; Monshouwer, R.; Haibe-Kains, B.; Rietveld, D.; et al. Decoding tumour phenotype by noninvasive imaging using a quantitative radiomics approach. Nat Commun. 2014, 5, 4006. [Google Scholar] [CrossRef]
- Bernatz, S.; Ackermann, J.; Mandel, P.; Kaltenbach, B.; Zhdanovich, Y.; Harter, P.N.; Döring, C.; Hammerstingl, R.; Bodelle, B.; Smith, K.; et al. Comparison of machine learning algorithms to predict clinically significant prostate cancer of the peripheral zone with multiparametric MRI using clinical assessment categories and radiomic features. Eur. Radiol. 2020, 30, 6757–6769. [Google Scholar] [CrossRef]
- Hectors, S.J.; Cherny, M.; Yadav, K.K.; Beksaç, A.T.; Thulasidass, H.; Lewis, S.; Davicioni, E.; Wang, P.; Tewari, A.K.; Taouli, B. Radiomics features measured with multiparametric magnetic resonance imaging predict prostate cancer aggressiveness. J. Urol. 2019, 202, 498–505. [Google Scholar] [CrossRef]
- Liu, B.; Cheng, J.; Guo, D.J.; He, X.J.; Luo, Y.D.; Zeng, Y.; Li, C.M. Prediction of prostate cancer aggressiveness with a combination of radiomics and machine learning-based analysis of dynamic contrast-enhanced MRI. Clin. Radiol. 2019, 74, 896.e1–896.e8. [Google Scholar] [CrossRef]
- Ma, S.; Xie, H.; Wang, H.; Han, C.; Yang, J.; Lin, Z.; Li, Y.; He, Q.; Wang, R.; Cui, Y.; et al. MRI-based radiomics signature for the preoperative prediction of extracapsular extension of prostate cancer. J. Magn. Reson. Imaging 2019, 50, 1914–1925. [Google Scholar] [CrossRef]
- McGarry, S.D.; Bukowy, J.D.; Iczkowski, K.A.; Unteriner, J.G.; Duvnjak, P.; Lowman, A.K.; Jacobsohn, K.; Hohenwalter, M.; Griffin, M.O.; Barrington, A.W.; et al. Gleason probability maps: A radiomics tool for mapping prostate cancer likelihood in MRI space. Tomography 2019, 5, 127–134. [Google Scholar] [PubMed]
- Min, X.; Li, M.; Dong, D.; Feng, Z.; Zhang, P.; Ke, Z.; You, H.; Han, F.; Ma, H.; Tian, J.; et al. Multi-parametric MRI-based radiomics signature for discriminating between clinically significant and insignificant prostate cancer: Cross-validation of a machine learning method. Eur. J. Radiol. 2019, 115, 16–21. [Google Scholar] [CrossRef] [PubMed]
- Qi, Y.; Zhang, S.; Wei, J.; Zhang, G.; Lei, J.; Yan, W.; Xiao, Y.; Yan, S.; Xue, H.; Feng, F.; et al. Multiparametric MRI-based radiomics for prostate cancer screening with PSA in 4-10 ng/mL to reduce unnecessary biopsies. J. Magn. Reson. Imaging 2020, 51, 1890–1899. [Google Scholar] [PubMed]
- Smith, C.P.; Czarniecki, M.; Mehralivand, S.; Stoyanova, R.; Choyke, P.L.; Harmon, S.; Turkbey, B. Radiomics and radiogenomics of prostate cancer. Abdom. Radiol. 2019, 44, 2021–2029. [Google Scholar] [CrossRef]
- Sun, Y.; Reynolds, H.M.; Parameswaran, B.; Wraith, D.; Finnegan, M.E.; Williams, S.; Haworth, A. Multiparametric MRI and radiomics in prostate cancer: A review. Australas. Phys. Eng. Sci. Med. 2019, 42, 3–25. [Google Scholar] [CrossRef]
- Toivonen, J.; Montoya Perez, I.; Movahedi, P.; Merisaari, H.; Pesola, M.; Taimen, P.; Boström, P.J.; Pohjankukka, J.; Kiviniemi, A.; Pahikkala, T.; et al. Radiomics and machine learning of multisequence multiparametric prostate MRI: Towards improved non-invasive prostate cancer characterization. PLoS ONE 2019, 14, e0217702. [Google Scholar] [CrossRef]
- Woźnicki, P.; Westhoff, N.; Huber, T.; Riffel, P.; Froelich, M.F.; Gresser, E.; von Hardenberg, J.; Mühlberg, A.; Michel, M.S.; Schoenberg, S.O.; et al. Multiparametric MRI for prostate cancer characterization: Combined use of radiomics model with PI-RADS and clinical parameters. Cancers 2020, 12, 1767. [Google Scholar] [CrossRef]
- Kobayashi, T.; Shimizu, Y.; Terada, N.; Yamasaki, T.; Nakamura, E.; Toda, Y.; Nishiyama, H.; Kamoto, T.; Ogawa, O.; Inoue, T.; et al. Regulation of androgen receptor transactivity and mTOR-S6 kinase pathway by rheb in prostate cancer cell proliferation. Prostate 2010, 70, 866–874. [Google Scholar] [CrossRef]
- Müller, J.M.; Metzger, E.; Greschik, H.; Bosserhoff, A.K.; Mercep, L.; Buettner, R.; Schüle, R. The transcriptional coactivator FHL2 transmits rho signals from the cell membrane into the nucleus. EMBO J. 2002, 21, 736–748. [Google Scholar] [CrossRef]
- Alizadeh, M.; Alizadeh, S. Survey of clinical and pathological characteristics and outcomes of patients with prostate cancer. Glob. J. Health Sci. 2014, 6, 49–57. [Google Scholar] [CrossRef]
- Fedorov, A.; Beichel, R.; Kalpathy-Cramer, J.; Finet, J.; Fillion-Robin, J.C.; Pujol, S.; Bauer, C.; Jennings, D.; Fennessy, F.; Sonka, M.; et al. 3D slicer as an image computing platform for the quantitative imaging network. Magn. Reson. Imaging 2012, 30, 1323–1341. [Google Scholar] [CrossRef] [PubMed]
- Van Griethuysen, J.J.; Fedorov, A.; Parmar, C.; Hosny, A.; Aucoin, N.; Narayan, V.; Beets-Tan, R.G.; Fillion-Robin, J.C.; Pieper, S.; Aerts, H.J.; et al. Computational radiomics system to decode the radiographic phenotype. Cancer Res. 2017, 77, e104–e107. [Google Scholar] [CrossRef] [PubMed]
- Tustison, N.J.; Avants, B.B.; Cook, P.A.; Zheng, Y.; Egan, A.; Yushkevich, P.A.; Gee, J.C. N4ITK: Improved N3 bias correction. IEEE Trans Med. Imaging 2010, 29, 1310–1320. [Google Scholar] [CrossRef] [PubMed]
- Zwanenburg, A.; Leger, S.; Vallières, M.; Löck, S. Image biomarker standardisation initiative. Radiother. Oncol. 2017, 123, S914–S915. [Google Scholar] [CrossRef]
- Karl, P. Notes on regression and inheritance in the case of two parents. Proc. R. Soc. Lond. 1895, 58, 240–242. [Google Scholar]
- Friedman, J.H. Greedy function approximation: A gradient boosting machine. Ann. Stat. 2001, 29, 1189–1232. [Google Scholar] [CrossRef]
- Bischl, B.; Lang, M.; Kotthoff, L.; Schiffner, J.; Richter, J.; Studerus, E.; Casalicchio, G.; Jones, Z.M. Machine learning in R. J. Mach. Learn. Res. 2016, 17, 5938–5942. [Google Scholar]
- Gillies, R.J.; Kinahan, P.E.; Hricak, H. Radiomics: Images are more than pictures, they are data. Radiology 2016, 278, 563–577. [Google Scholar] [CrossRef]
- Aerts, H.J. The potential of radiomic-based phenotyping in precision medicine: A review. JAMA Oncol. 2016, 2, 1636–1642. [Google Scholar] [CrossRef]
- Stoyanova, R.; Takhar, M.; Tschudi, Y.; Ford, J.C.; Solórzano, G.; Erho, N.; Balagurunathan, Y.; Punnen, S.; Davicioni, E.; Gillies, R.J.; et al. Prostate cancer radiomics and the promise of radiogenomics. Transl. Cancer Res. 2016, 5, 5432–5447. [Google Scholar] [CrossRef]
- Mao, Y.; Xu, X.; Wang, X.; Zheng, X.; Xie, L. Is angiotensin-converting enzyme inhibitors/angiotensin receptor blockers therapy protective against prostate cancer? Oncotarget 2016, 7, 6765–6773. [Google Scholar] [CrossRef] [PubMed]
- Siltari, A.; Murtola, T.J.; Talala, K.; Taari, K.; Tammela, T.L.J.; Auvinen, A. Antihypertensive drug use and prostate cancer-specific mortality in finnish men. PLoS ONE 2020, 15, e0234269. [Google Scholar] [CrossRef] [PubMed]


| Parameters | Medication Usage | All | ||||
|---|---|---|---|---|---|---|
| Statin | Omega-3 | |||||
| Yes (%) | No (%) | Yes (%) | No (%) | N | % | |
| Total Number of Patients | 42 (46.2%) | 49 (53.8%) | 28 (30.8%) | 63 (69.2%) | 91 | 100% |
| Age at Diagnosis (median(range)) | 66 (54–83)y | 67 (54–84)y | 65 (57–82)y | 68 (54–84)y | 67 (54–84)y | |
| Race | ||||||
| White | 85.7% | 85.7% | 82.1% | 87.3% | 78 | 85.7% |
| Non-White | 14.3% | 14.3% | 17.9% | 12.7% | 13 | 14.3% |
| Family History of Prostate Cancer | ||||||
| No | 78.6% | 75.5% | 75.0% | 76.2% | 70 | 76.9% |
| Yes | 21.4% | 24.5% | 25.0% | 23.8% | 21 | 23.1% |
| NCCN Risk Group | ||||||
| Low/Favorable Intermediate | 14.3% | 14.3% | 17.9% | 12.7% | 13 | 14.3% |
| Unfavorable Intermediate | 21.4% | 18.4% | 17.9% | 20.6% | 18 | 19.8% |
| High | 21.4% | 24.5% | 21.5% | 23.8% | 21 | 23.1% |
| Very High | 42.9% | 42.8% | 42.9% | 42.9% | 39 | 42.9% |
| Gleason Grade, Primary | ||||||
| 3 (4+3) | 40.5% | 38.8% | 42.9% | 38.1% | 36 | 39.6% |
| 4 (8) | 54.8% | 53.1% | 50.0% | 55.6% | 49 | 53.8% |
| 5 (9, 10) | 4.8% | 8.2% | 7.1% | 6.3% | 6 | 6.6% |
| Gleason Grade, Secondary | ||||||
| 3 (4+3) | 23.8% | 22.4% | 17.9% | 25.4% | 21 | 23.1% |
| 4 (8) | 23.8% | 24.5% | 28.6% | 22.2% | 22 | 24.2% |
| 5 (9, 10) | 52.4% | 53.1% | 53.6% | 52.4% | 48 | 52.8% |
| cT | ||||||
| cT1c | 26.2% | 26.5% | 21.4% | 28.6% | 24 | 26.4% |
| cT2 | ||||||
| cT2a | 16.7% | 18.4% | 21.5% | 16.0% | 16 | 17.6% |
| cT2b | 14.3% | 8.2% | 14.3% | 9.5% | 10 | 11.0% |
| cT2c | 7.1% | 10.2% | 10.7% | 7.9% | 8 | 8.8% |
| cT3 | 21.4% | 22.4% | 17.9% | 23.8% | 20 | 22.0% |
| cT3a | 14.3% | 14.3% | 14.3% | 14.3% | 13 | 14.3% |
| cT3b | ||||||
| cN | ||||||
| 0 | 88.1% | 85.7% | 82.1% | 88.9% | 79 | 86.8% |
| 1 | 11.9% | 14.3% | 17.9% | 11.1% | 12 | 13.2% |
| PSA | ||||||
| Pretreatment PSA (median(range)) | 9.69 (1.31–52.19) | 10.00 (1.39–59.99) | 10.73 (2.00–52.19) | 9.59(1.31–59.99) | 9.69 (1.31–59.99) | |
Publisher’s Note: MDPI stays neutral with regard to jurisdictional claims in published maps and institutional affiliations. |
© 2021 by the authors. Licensee MDPI, Basel, Switzerland. This article is an open access article distributed under the terms and conditions of the Creative Commons Attribution (CC BY) license (http://creativecommons.org/licenses/by/4.0/).
Share and Cite
Shi, Y.; Wahle, E.; Du, Q.; Krajewski, L.; Liang, X.; Zhou, S.; Zhang, C.; Baine, M.; Zheng, D. Associations between Statin/Omega3 Usage and MRI-Based Radiomics Signatures in Prostate Cancer. Diagnostics 2021, 11, 85. https://doi.org/10.3390/diagnostics11010085
Shi Y, Wahle E, Du Q, Krajewski L, Liang X, Zhou S, Zhang C, Baine M, Zheng D. Associations between Statin/Omega3 Usage and MRI-Based Radiomics Signatures in Prostate Cancer. Diagnostics. 2021; 11(1):85. https://doi.org/10.3390/diagnostics11010085
Chicago/Turabian StyleShi, Yu, Ethan Wahle, Qian Du, Luke Krajewski, Xiaoying Liang, Sumin Zhou, Chi Zhang, Michael Baine, and Dandan Zheng. 2021. "Associations between Statin/Omega3 Usage and MRI-Based Radiomics Signatures in Prostate Cancer" Diagnostics 11, no. 1: 85. https://doi.org/10.3390/diagnostics11010085
APA StyleShi, Y., Wahle, E., Du, Q., Krajewski, L., Liang, X., Zhou, S., Zhang, C., Baine, M., & Zheng, D. (2021). Associations between Statin/Omega3 Usage and MRI-Based Radiomics Signatures in Prostate Cancer. Diagnostics, 11(1), 85. https://doi.org/10.3390/diagnostics11010085