Endoscopic Ultrasound vs. Computed Tomography for Gastric Cancer Staging: A Network Meta-Analysis


 ,
, 
Abstract
:1. Introduction
2. Materials and Methods
2.1. Search Methods
2.2. Selection Criteria
2.3. Data Collection and Analysis
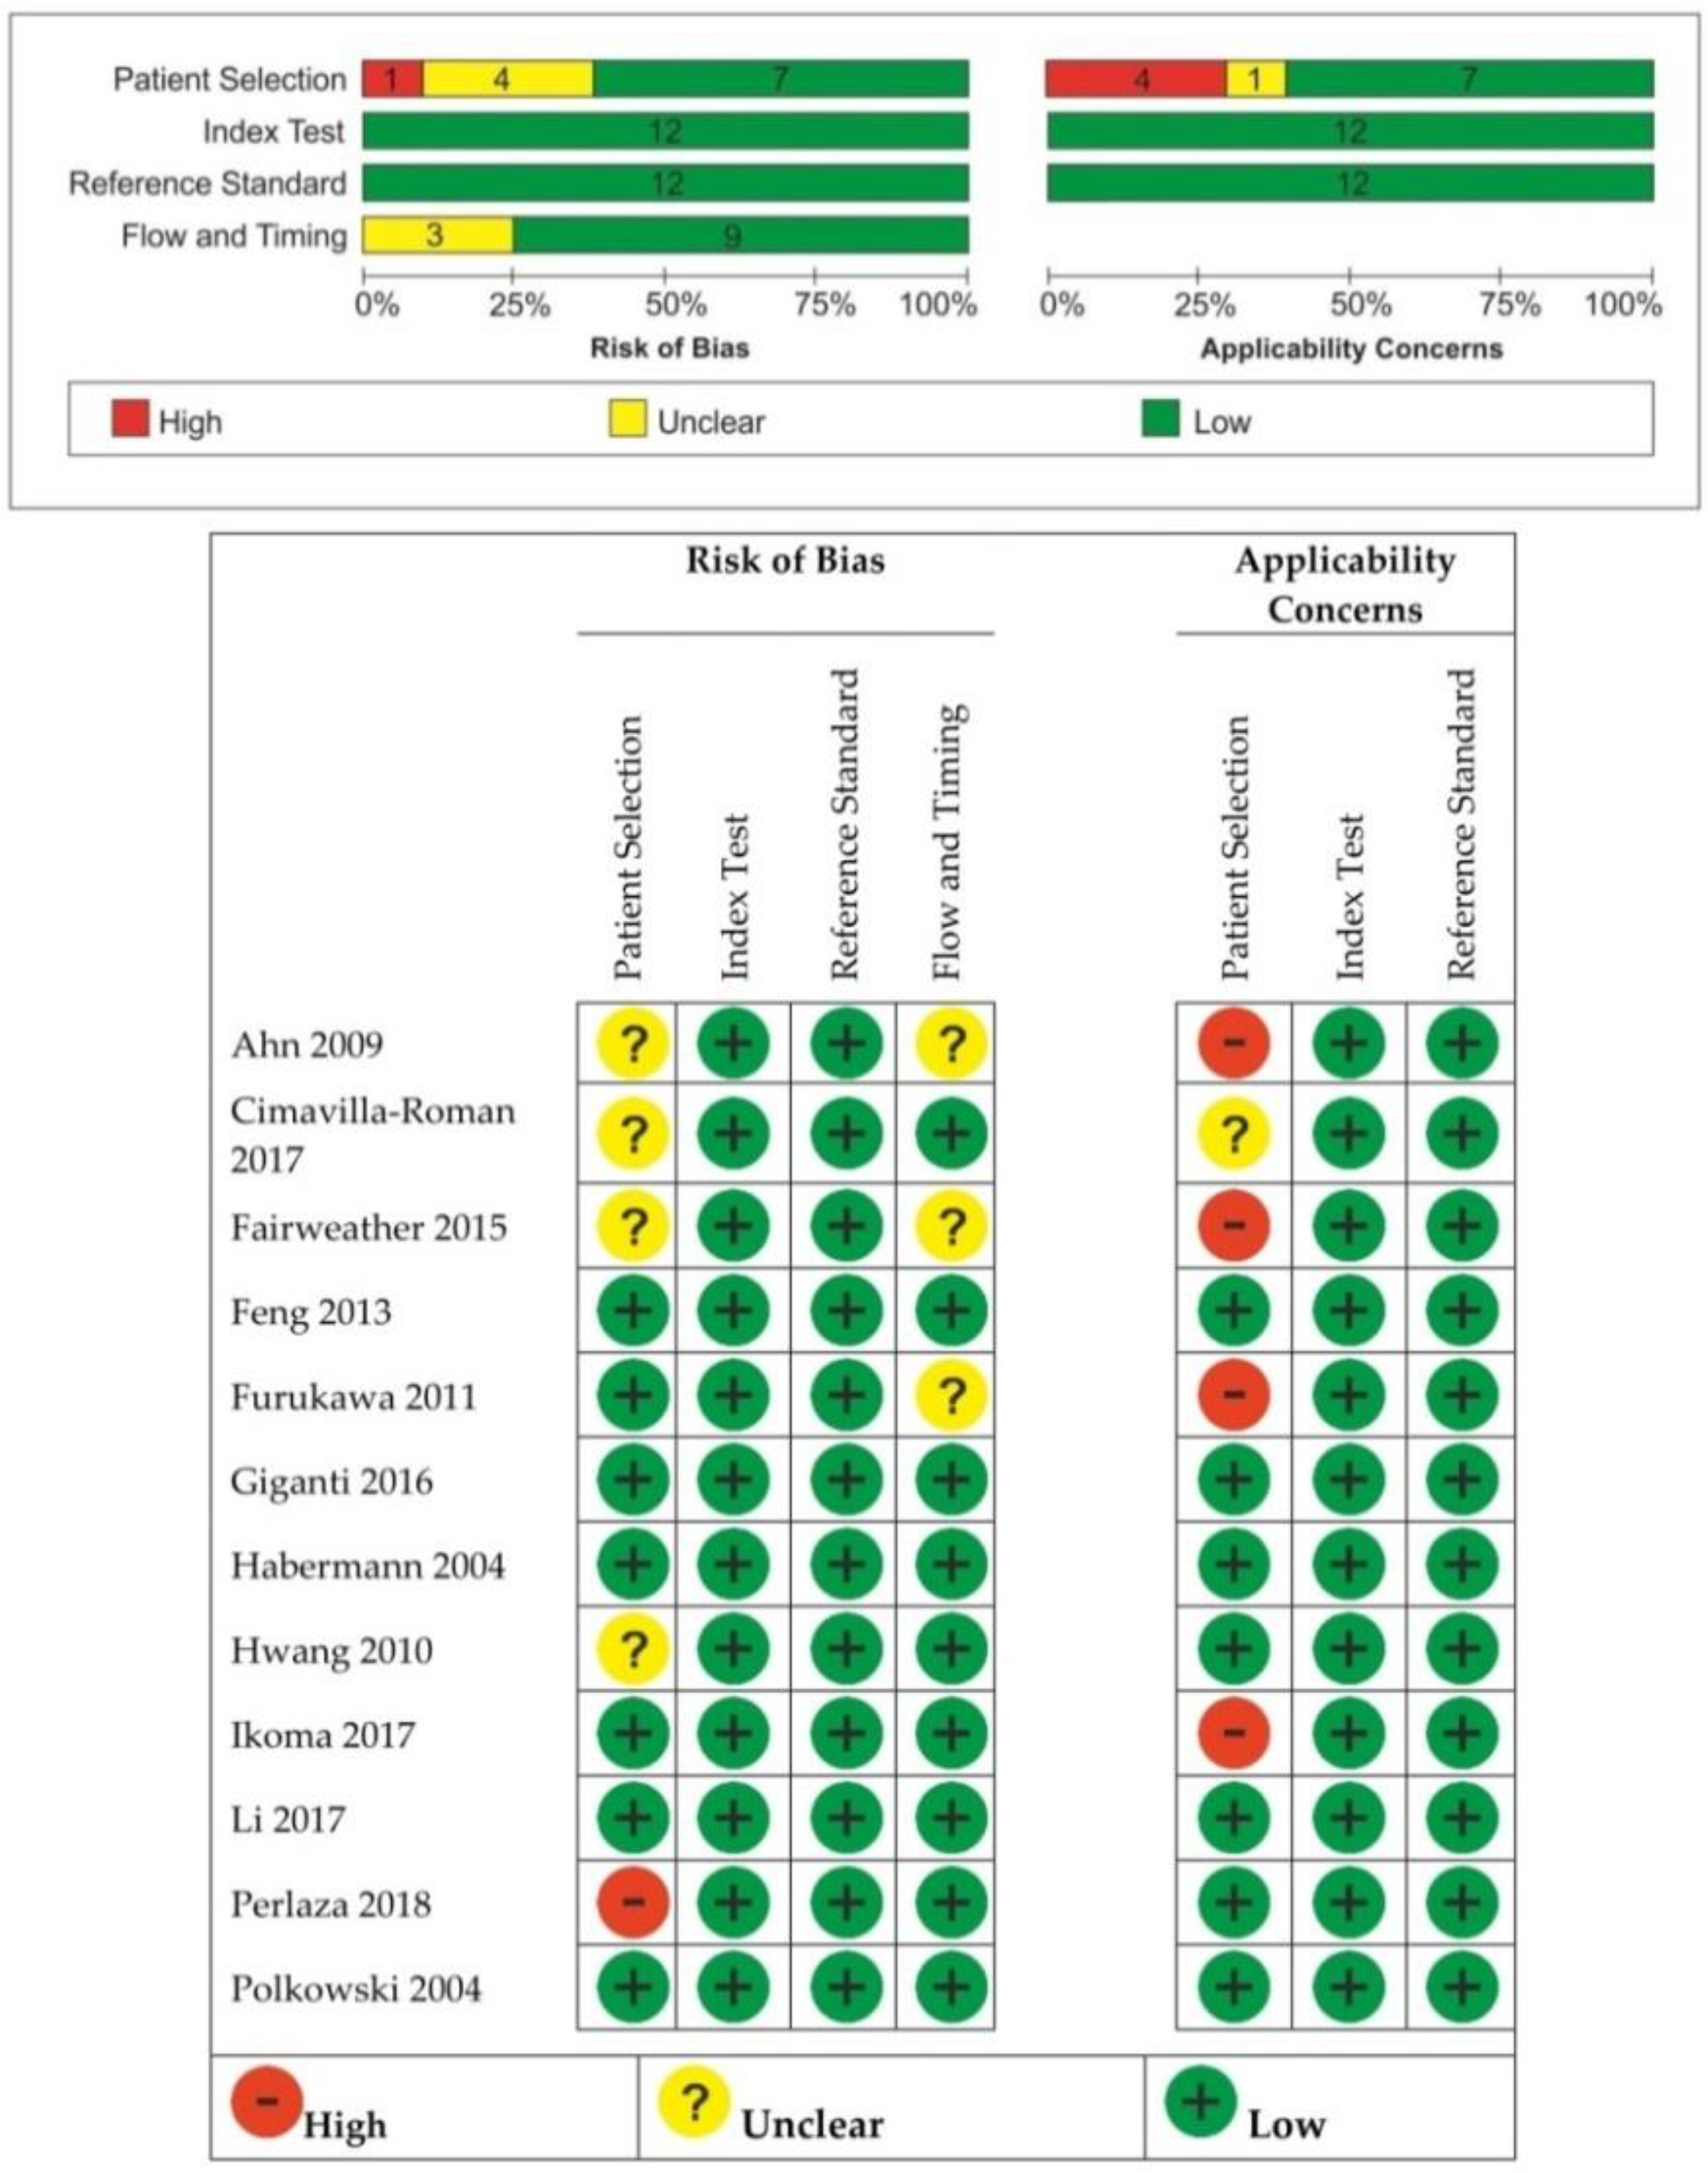
2.4. Assessment of Methodological Quality
2.5. Statistical Analysis
3. Results
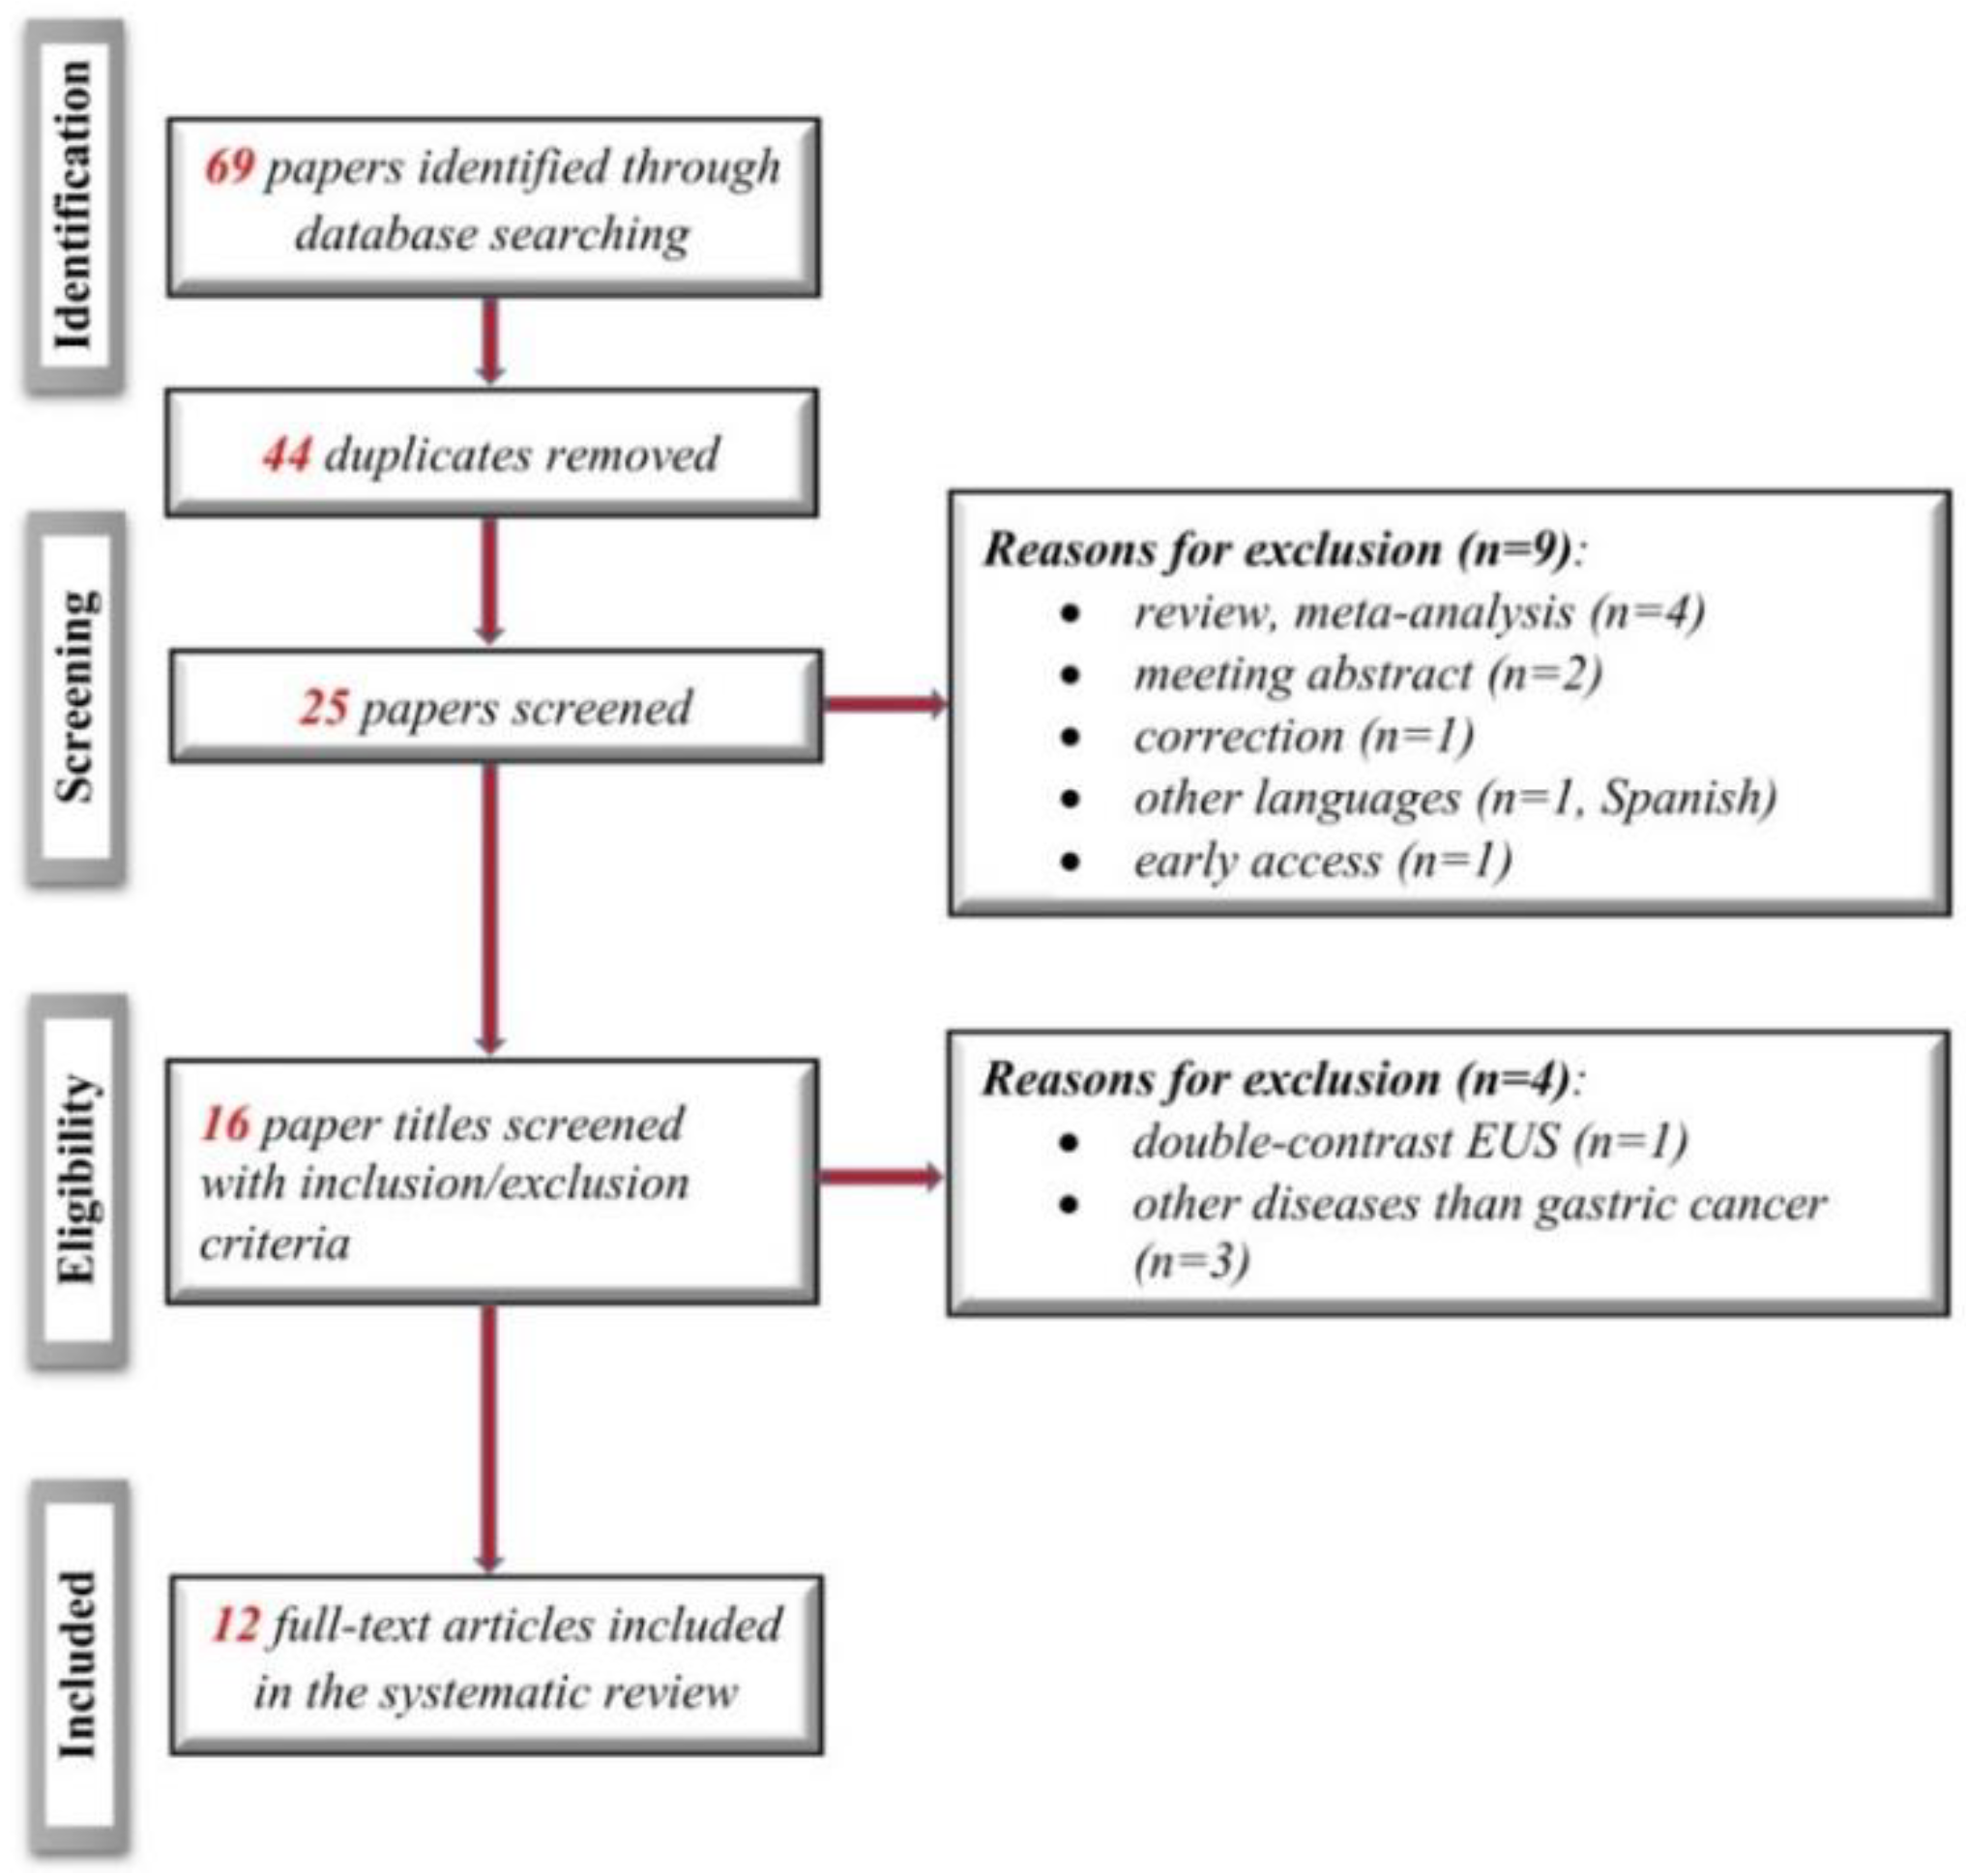
3.1. Electronic Search Results and Study Characteristics
3.2. Quality Assessment of the Included Studies
3.3. Data Synthesis
3.3.1. EUS vs. MDCT
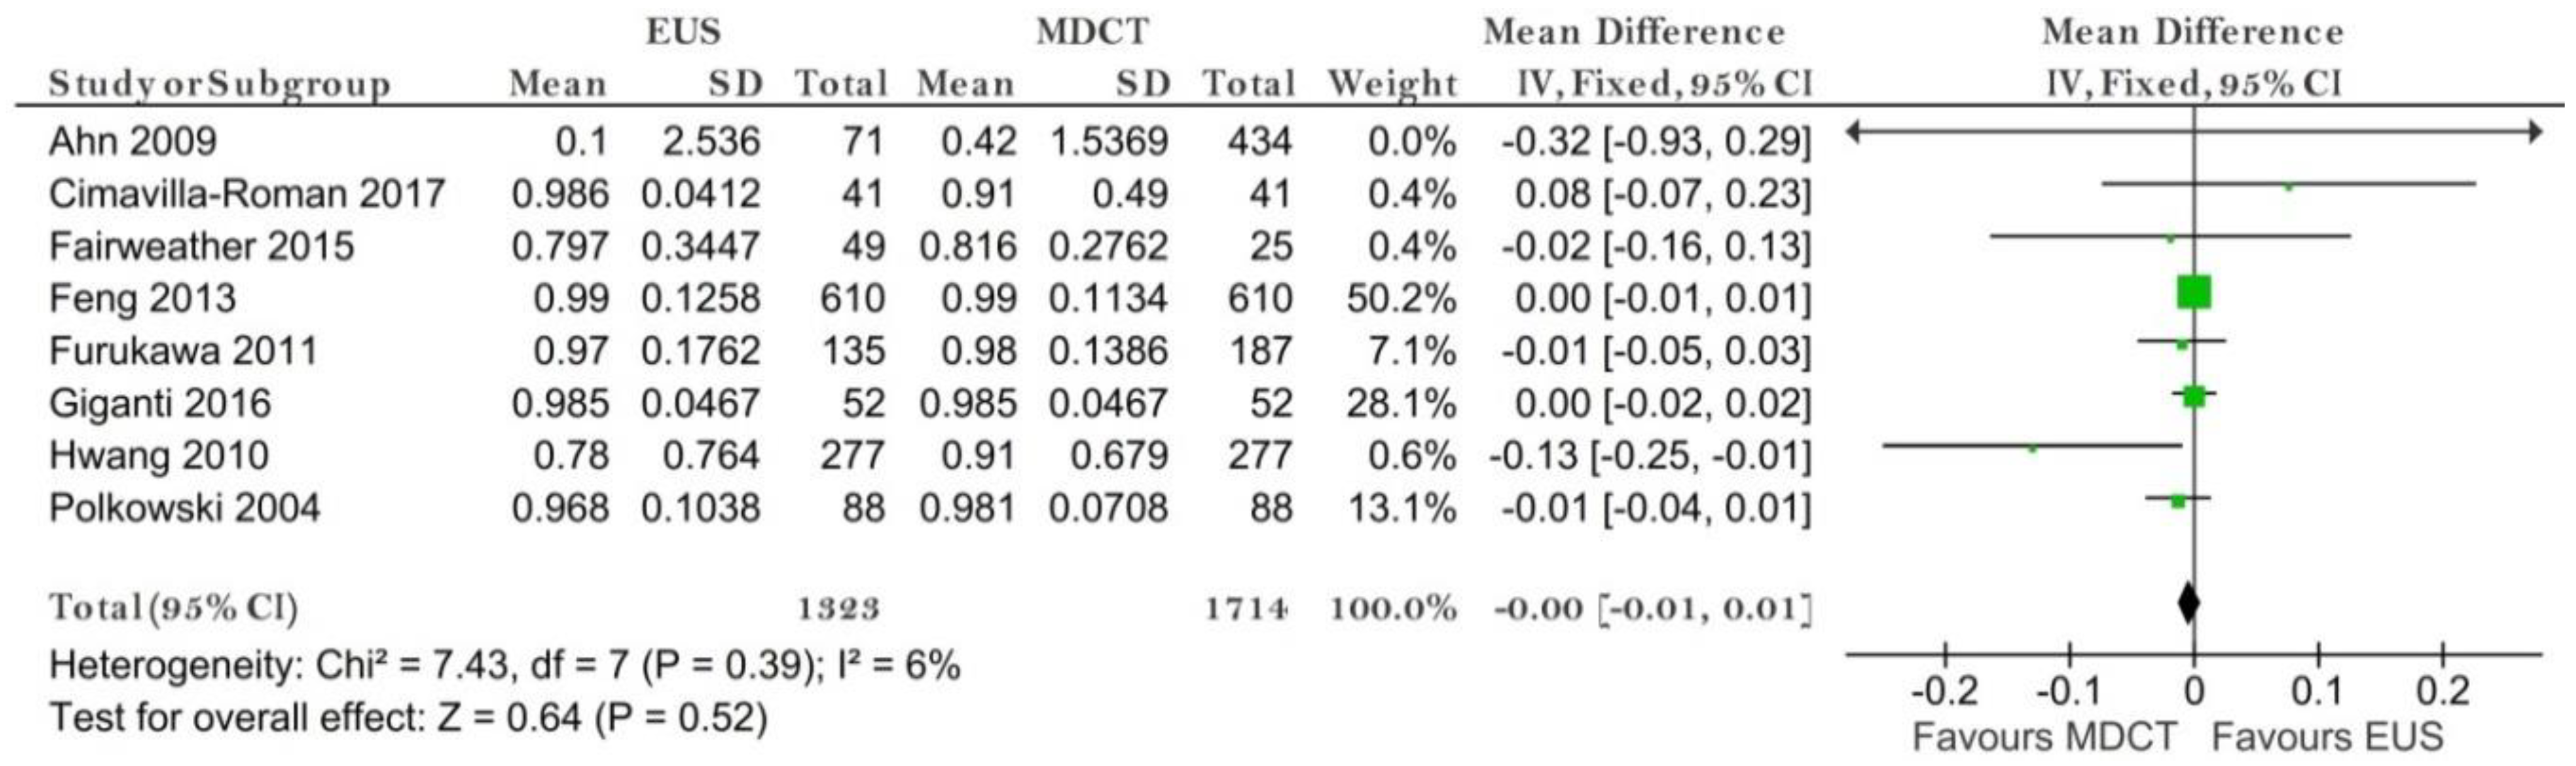
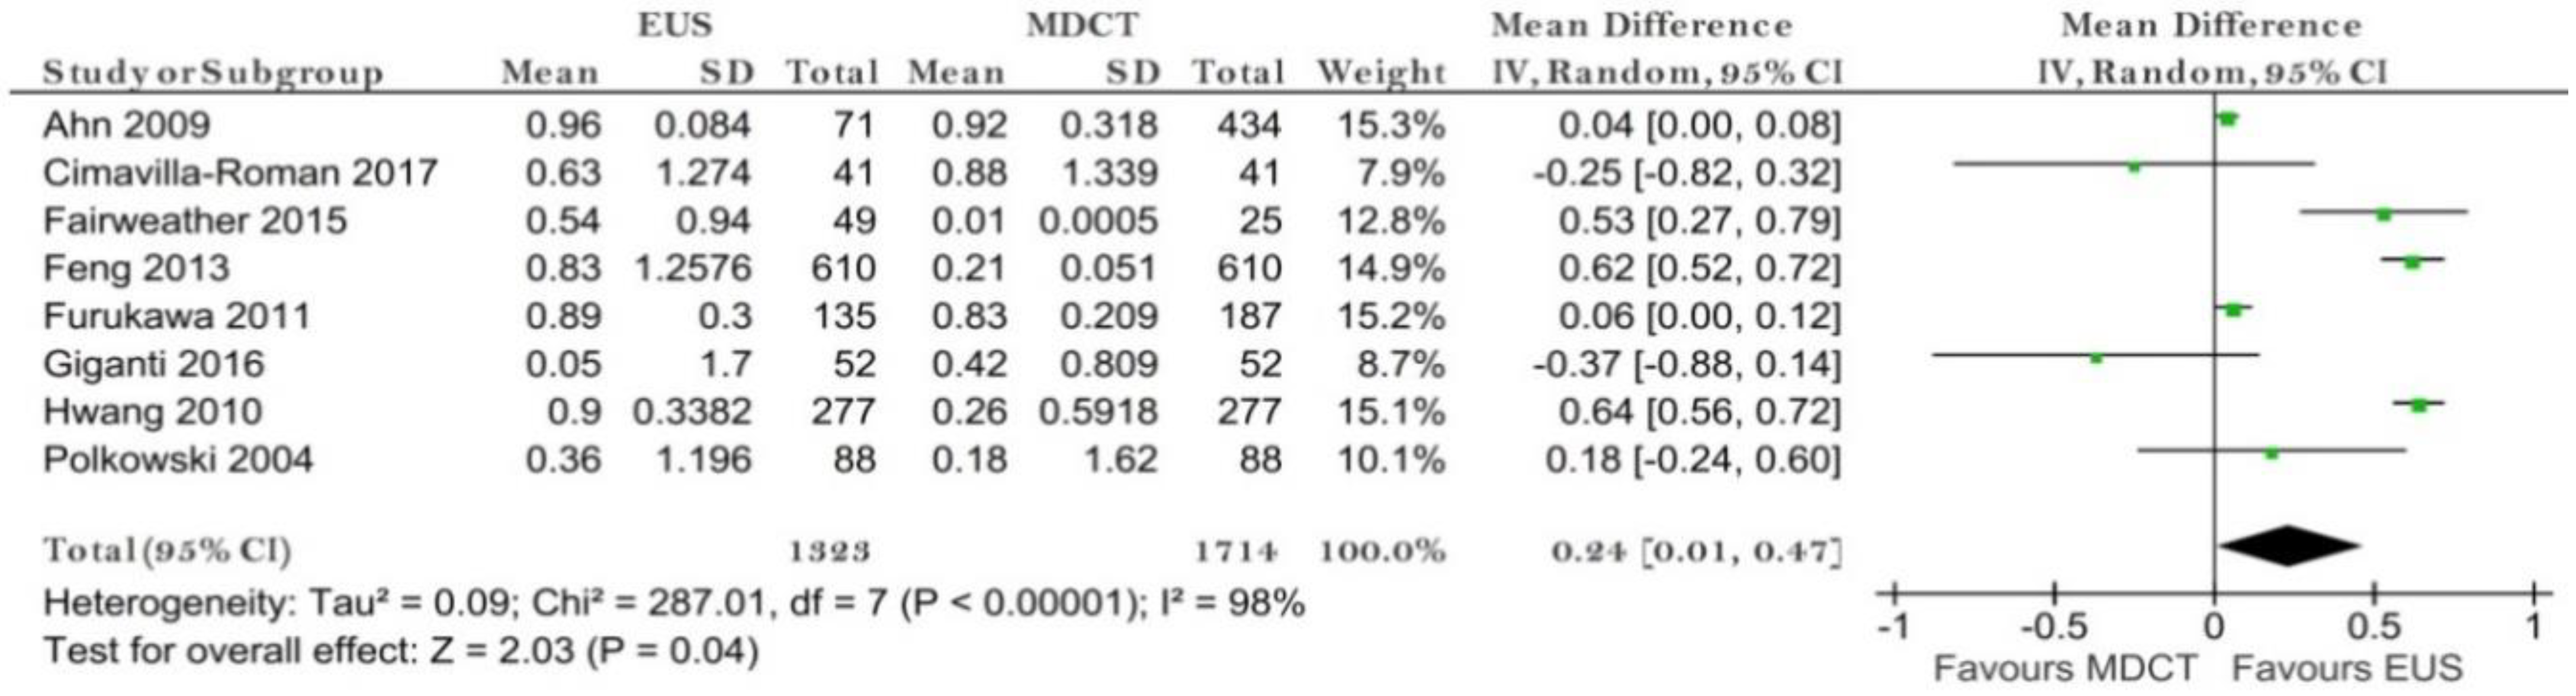
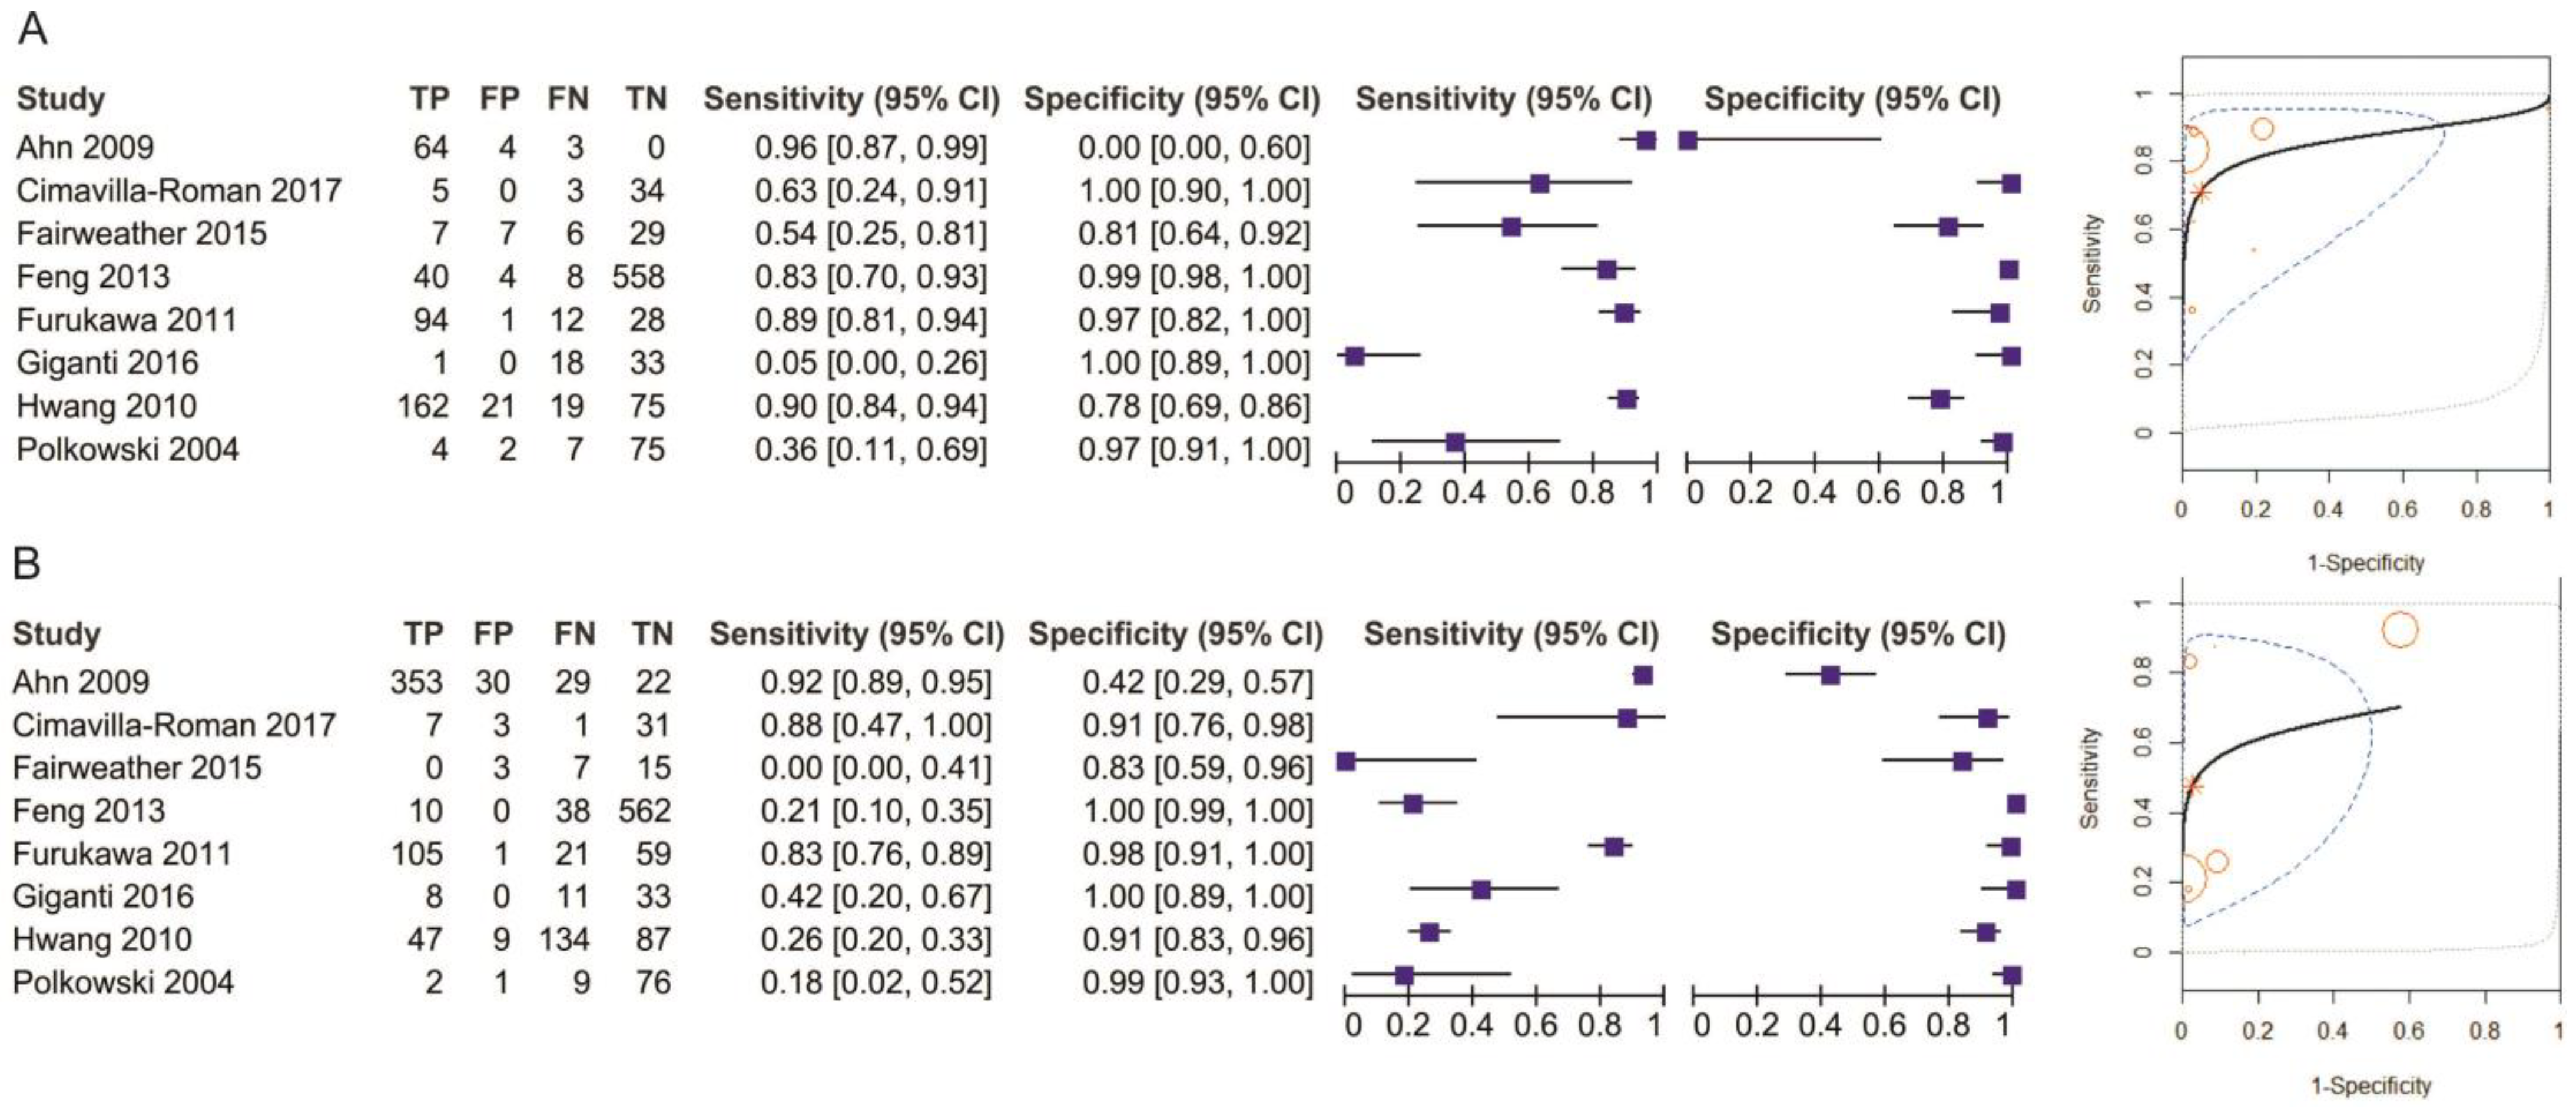
T1 Stage
T2 Stage
T3 Stage
T4 Stage
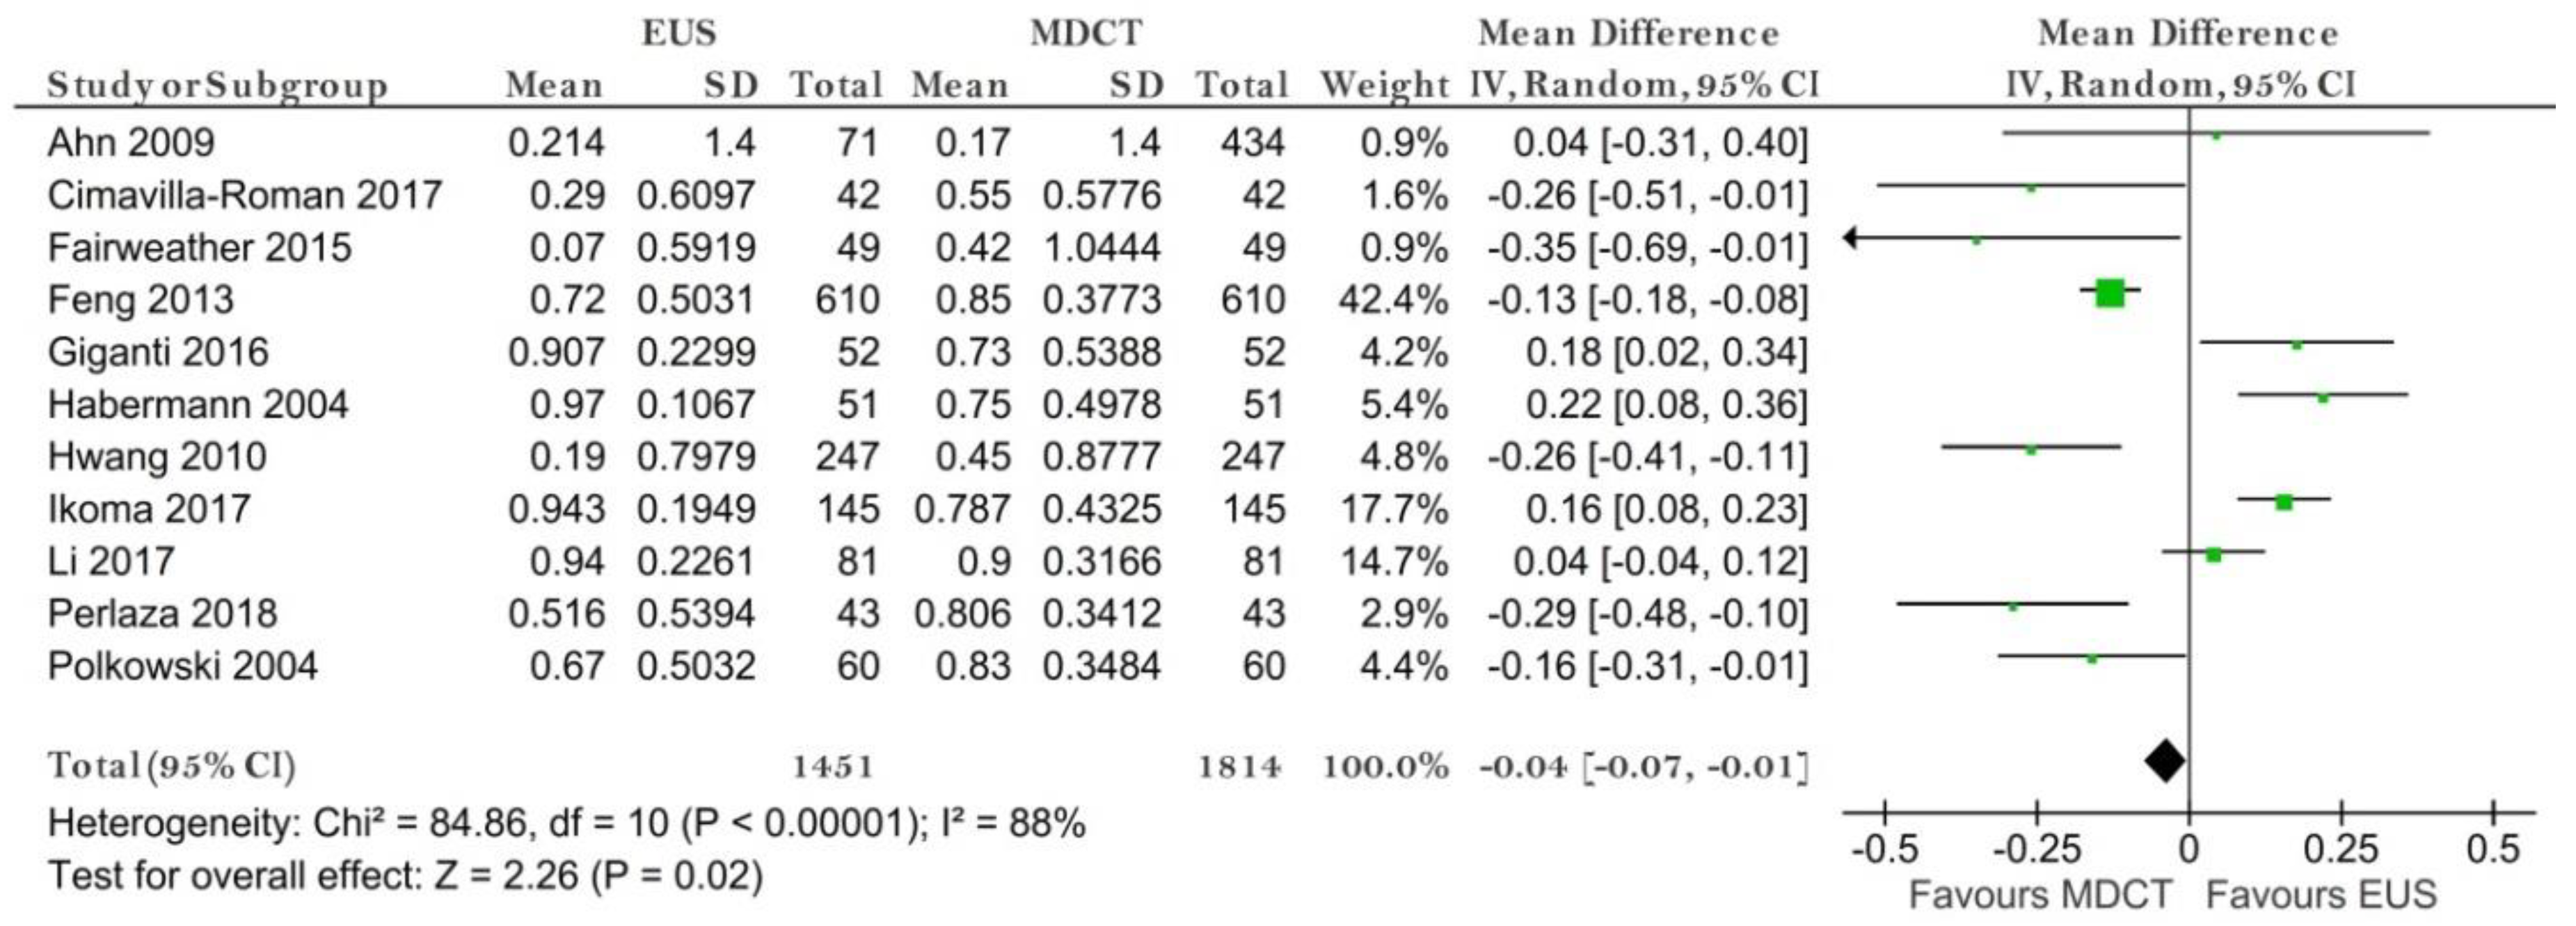
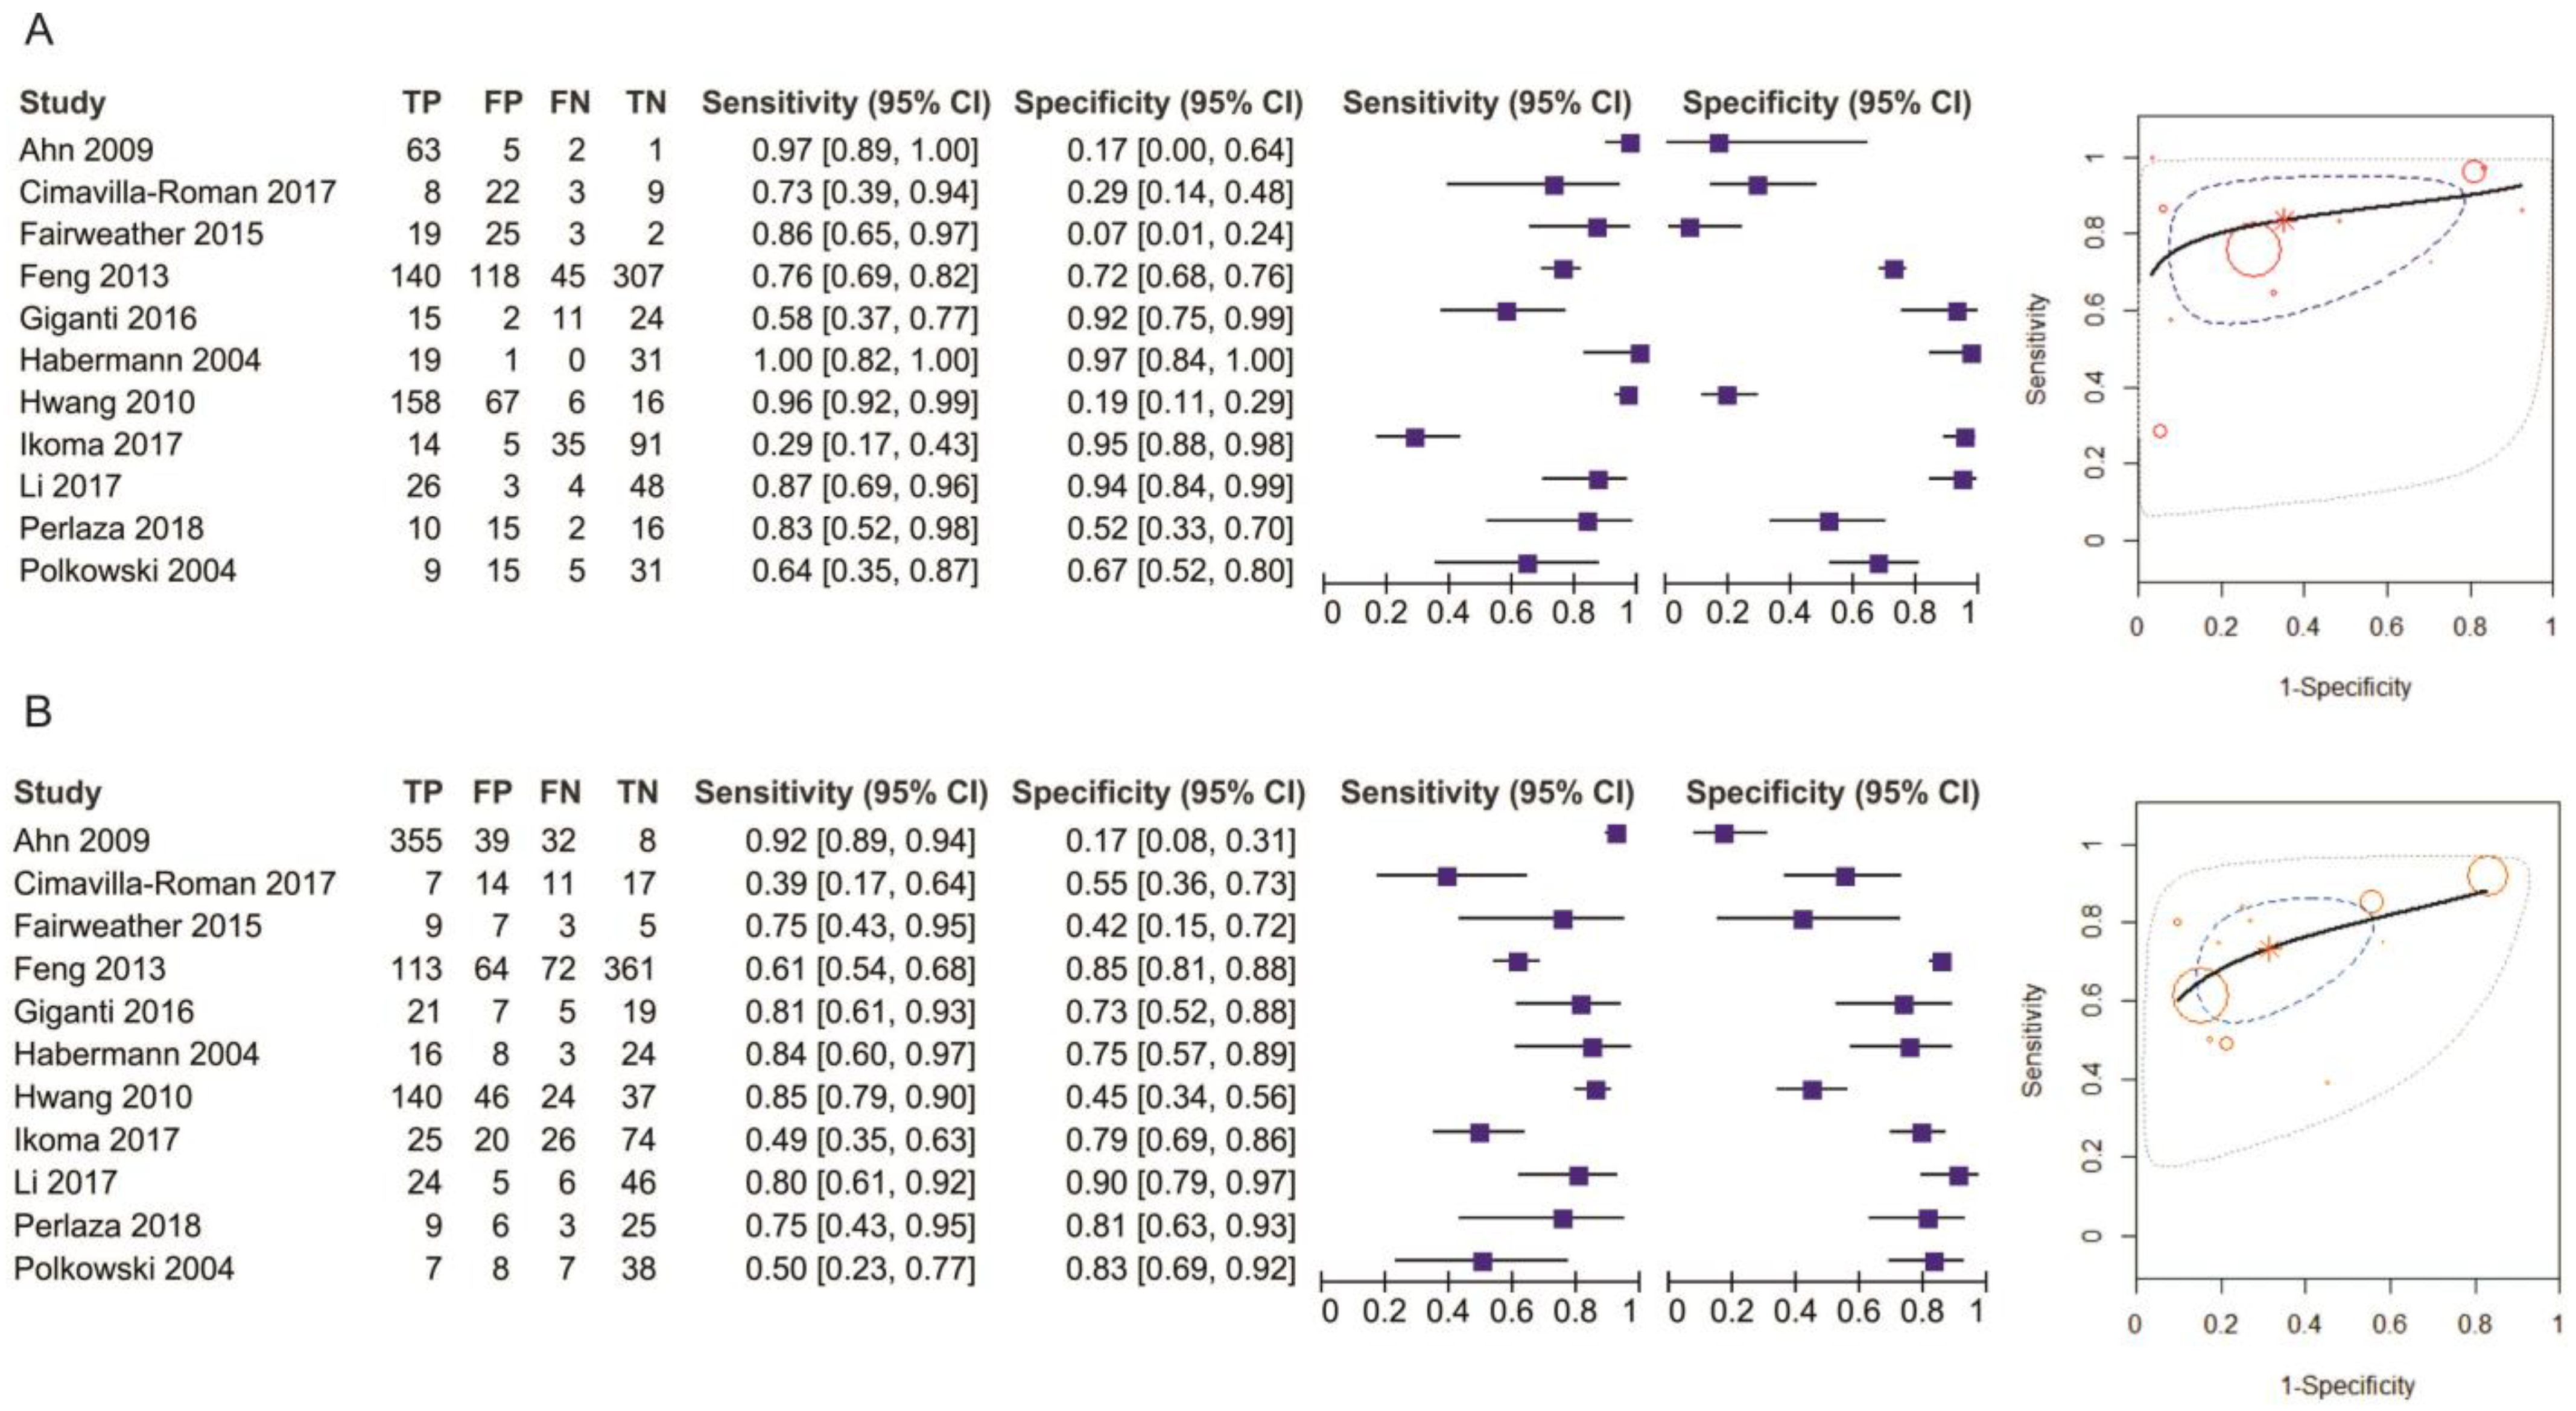
N Stage (N−/N+)
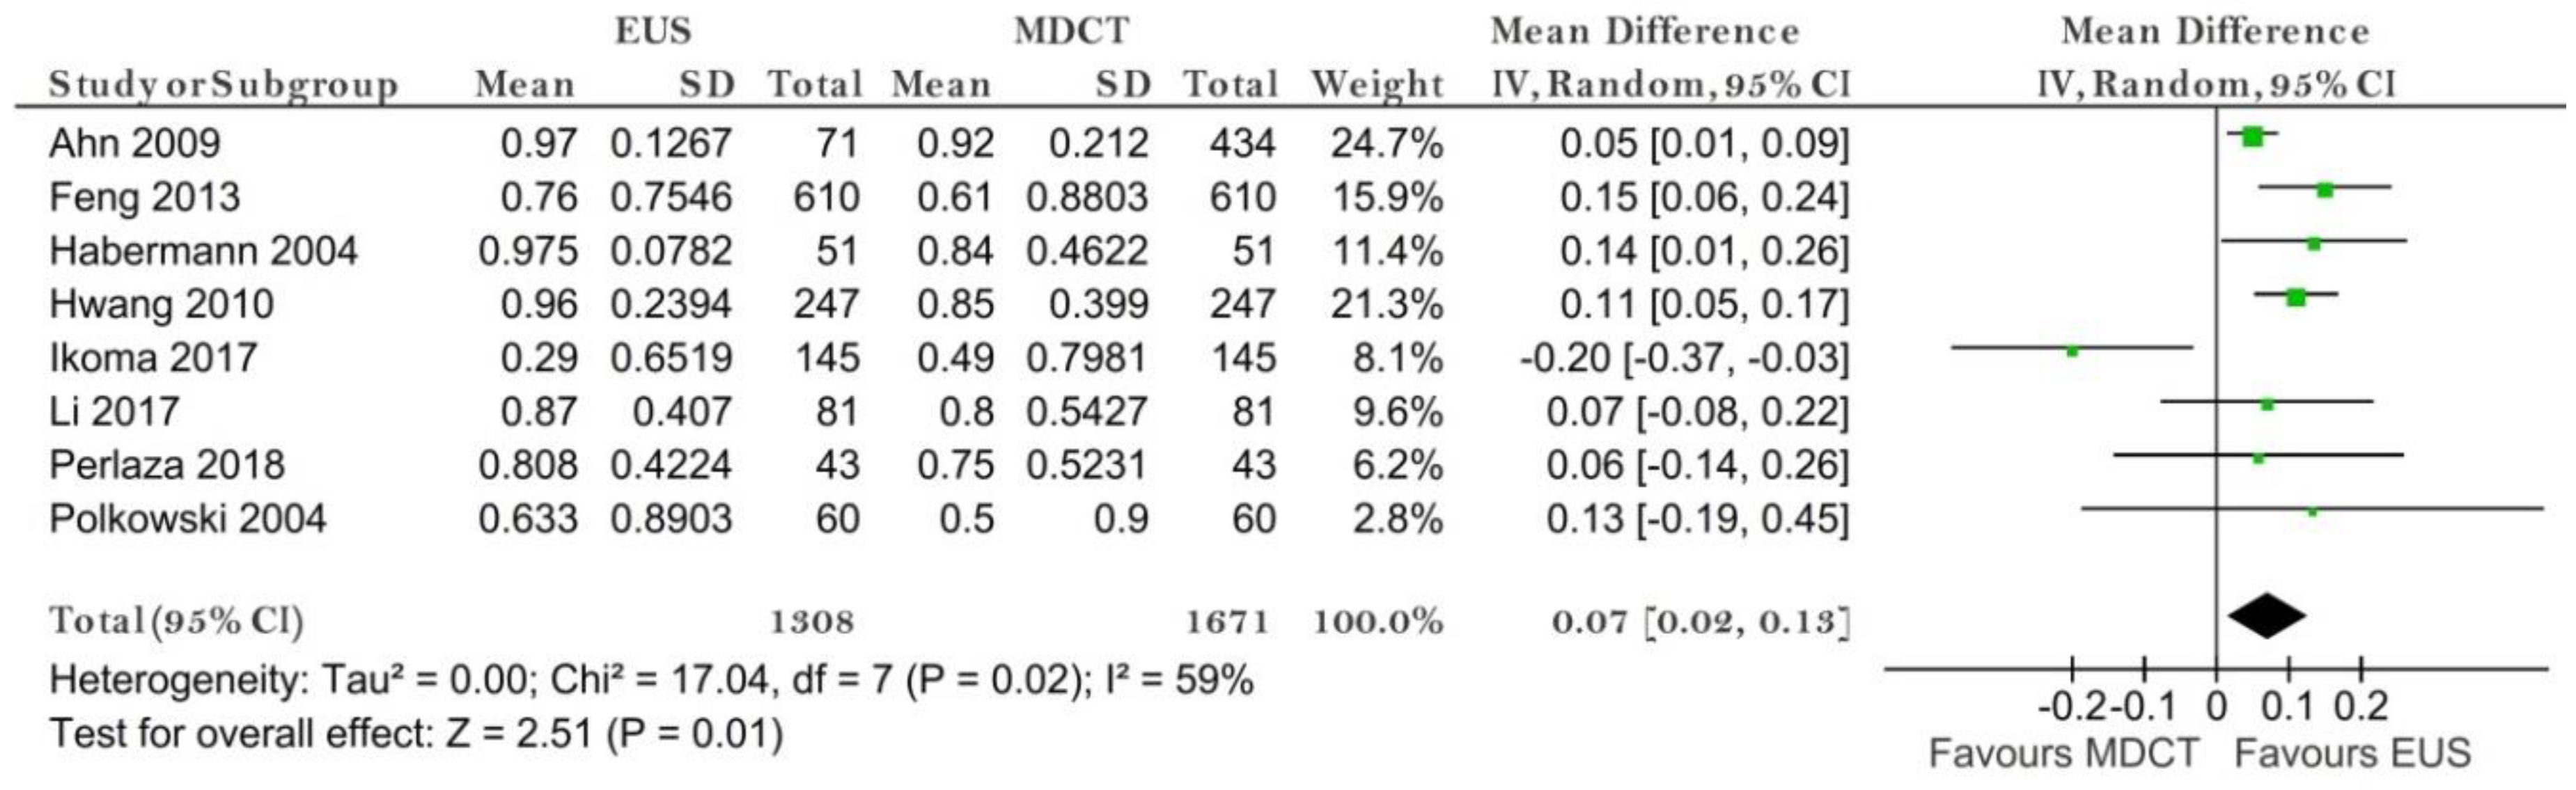
N0 Stage
N1 Stage
N2 Stage
N3 Stage
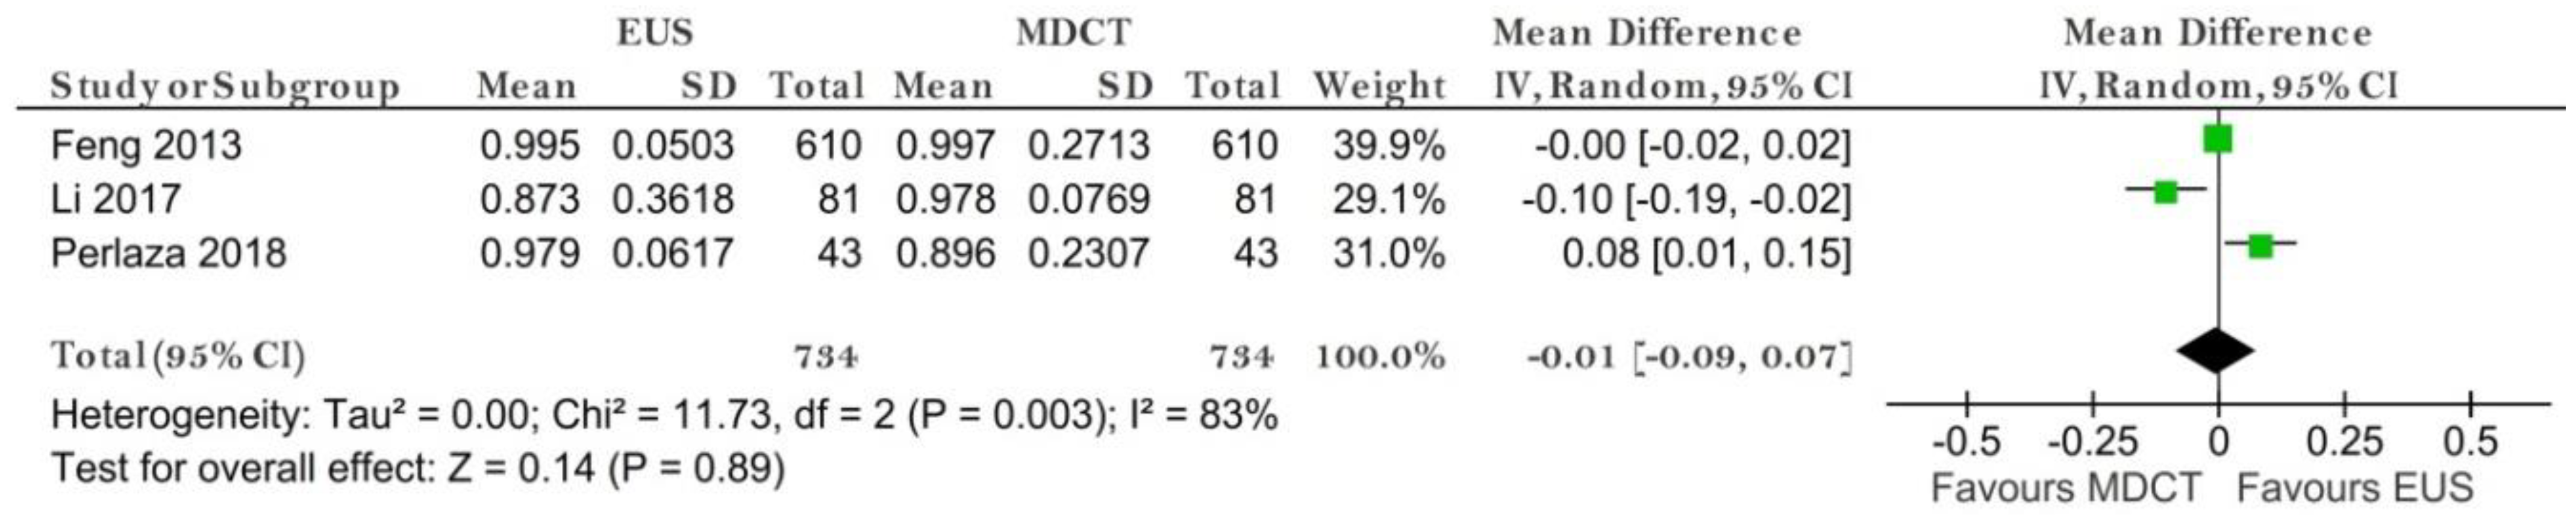
M Stage
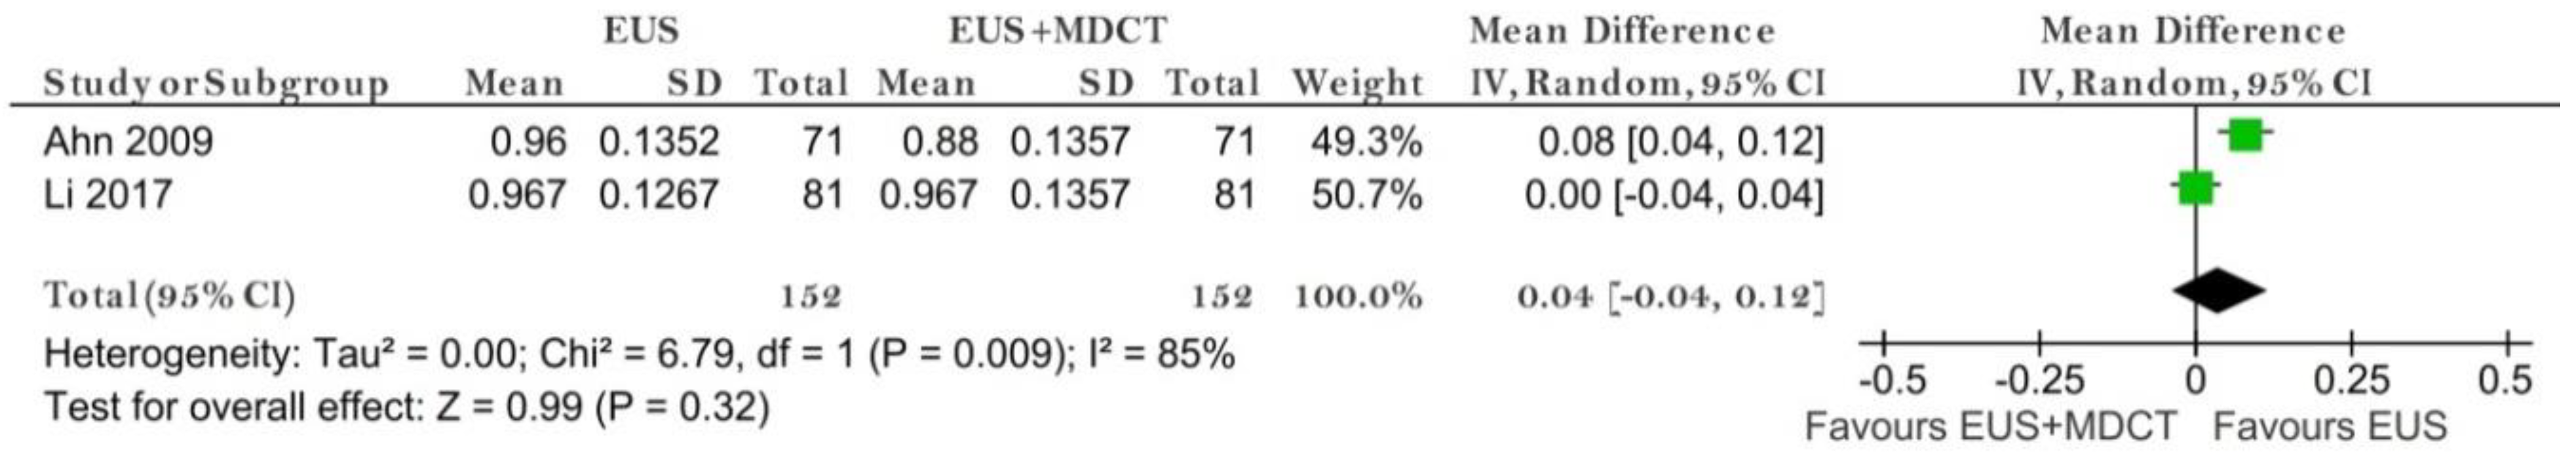
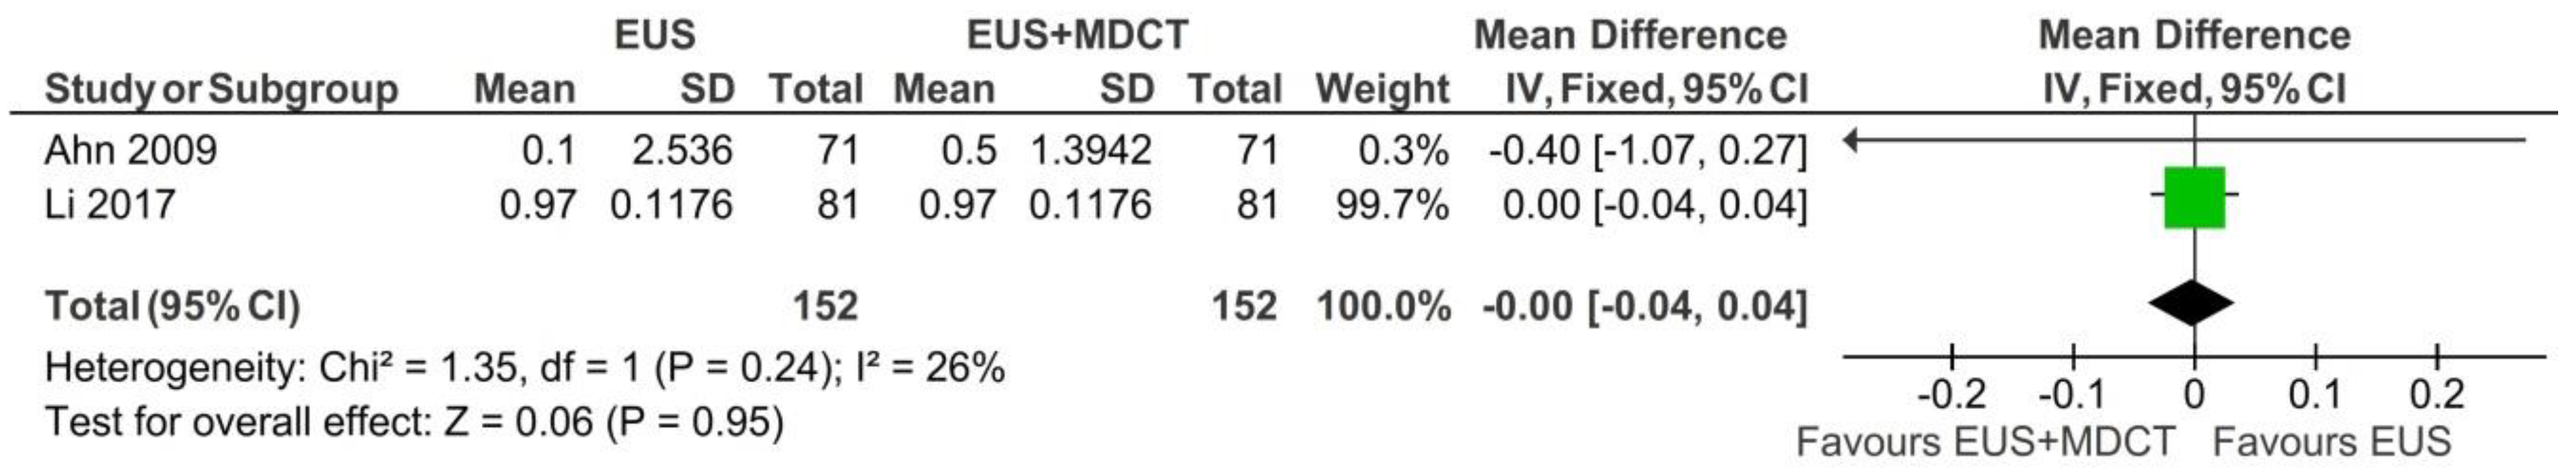
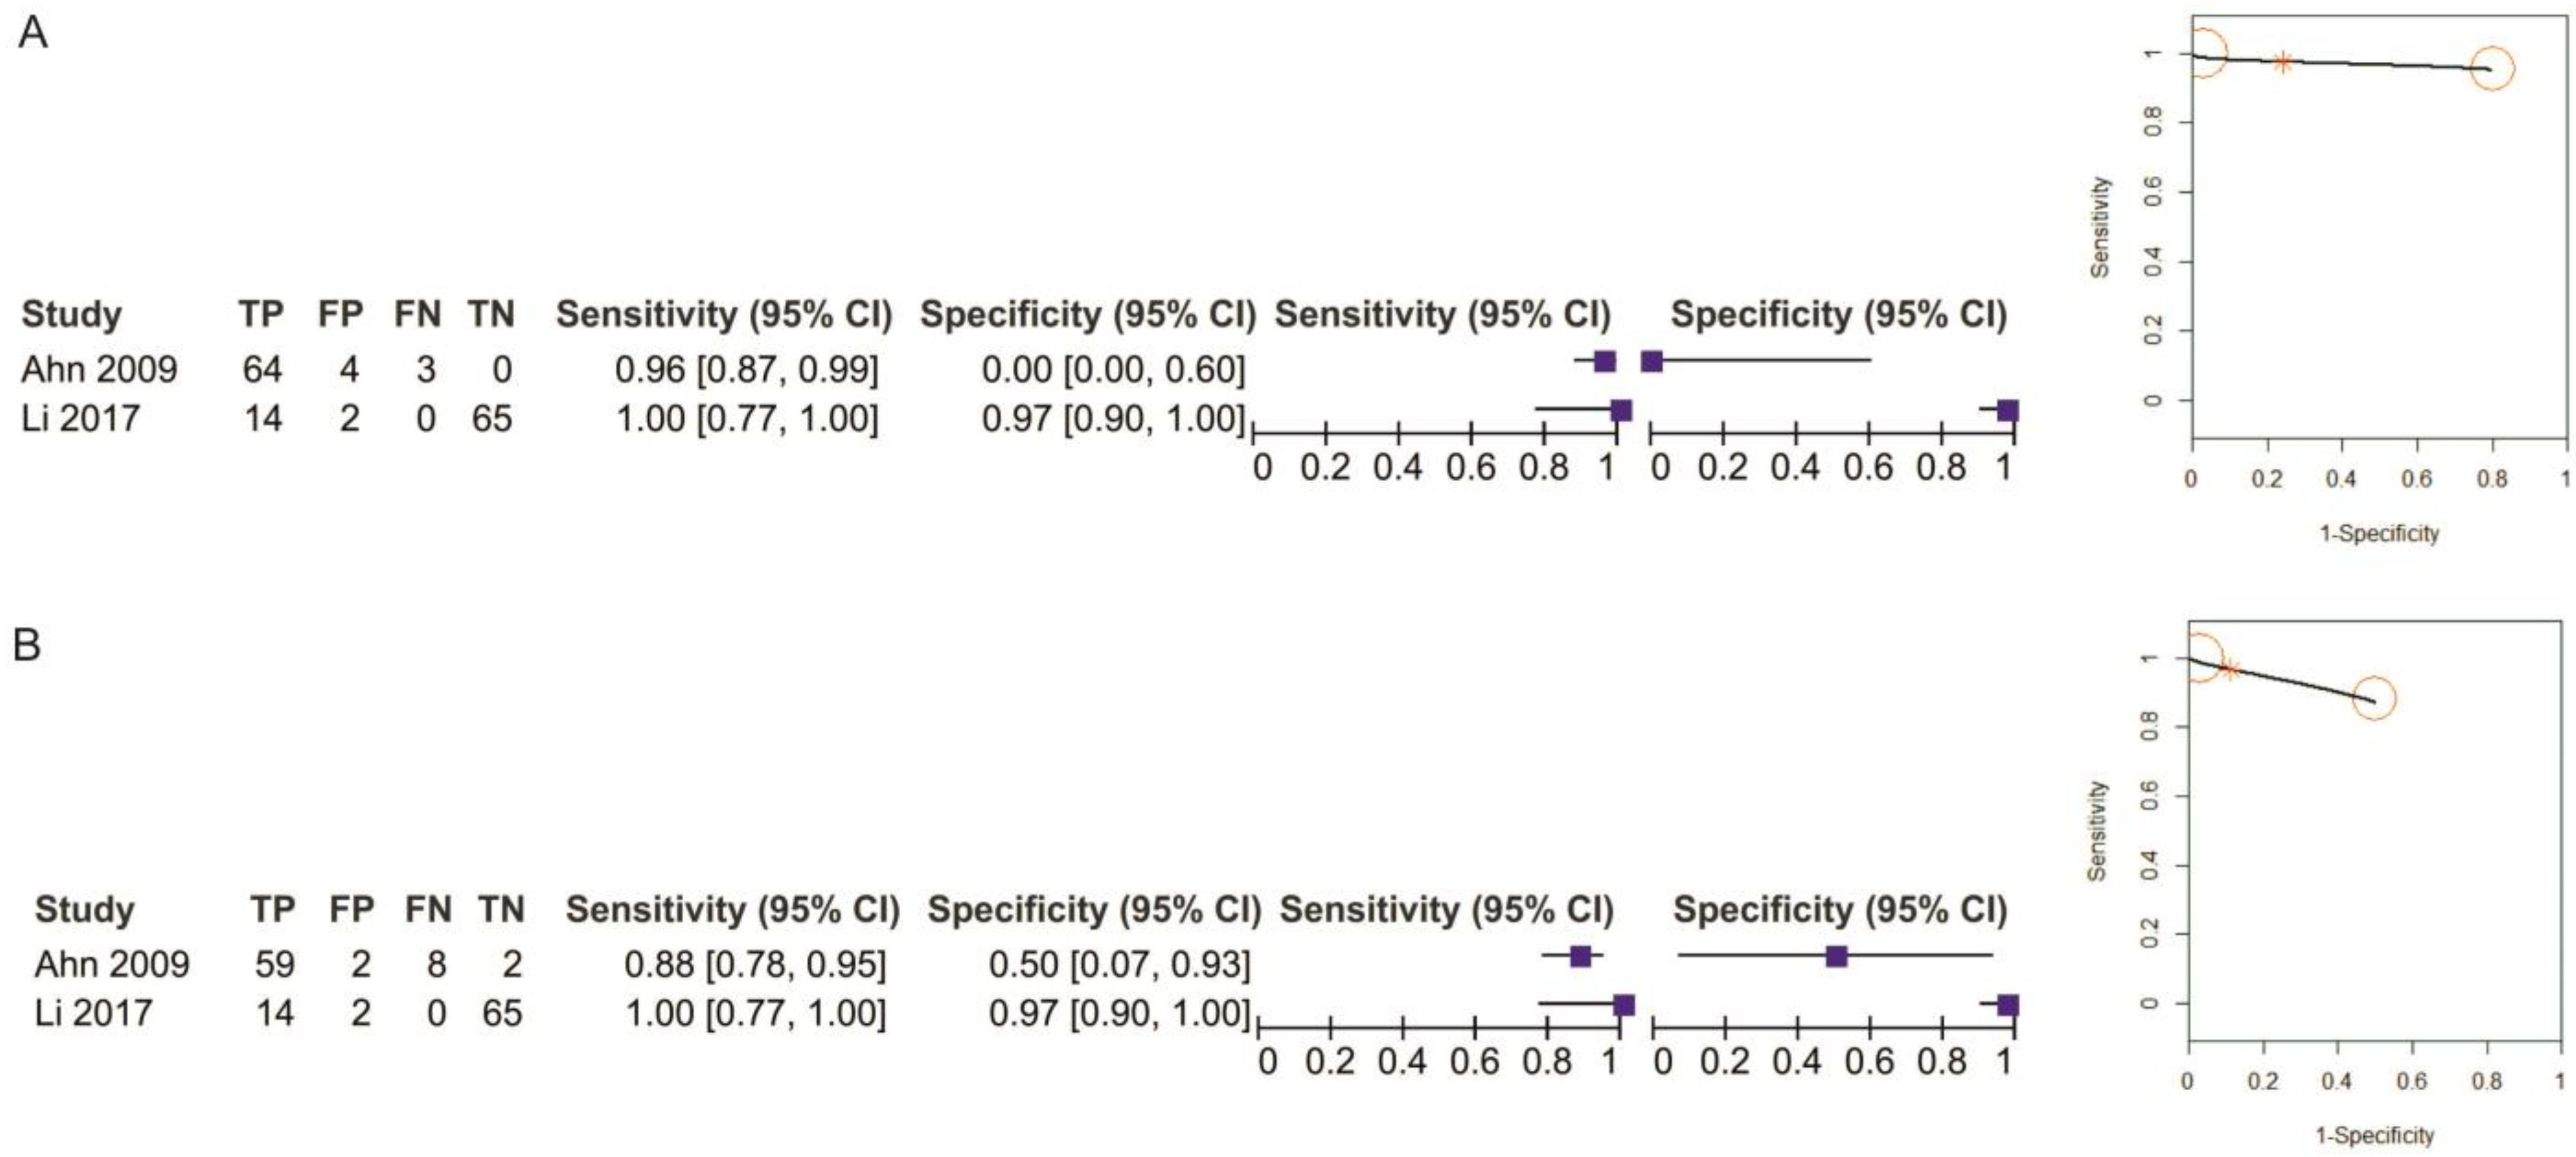
3.3.2. EUS vs. EUS + MDCT
T1 Stage
4. Discussion
5. Conclusions
Author Contributions
Funding
Institutional Review Board Statement
Informed Consent Statement
Data Availability Statement
Acknowledgments
Conflicts of Interest
References
- Smyth, E.C.; Nilsson, M.; Grabsch, H.I.; Van Grieken, N.C.; Lordick, F. Gastric cancer. Lancet 2020, 396, 635–648. [Google Scholar] [CrossRef]
- Kim, J.; Kim, S.G.; Chung, H.; Lim, J.H.; Choi, J.M.; Park, J.Y.; Yang, H.-J.; Han, S.J.; Oh, S.; Kim, M.S.; et al. Clinical efficacy of endoscopic ultrasonography for decision of treatment strategy of gastric cancer. Surg. Endosc. 2018, 32, 3789–3797. [Google Scholar] [CrossRef] [PubMed]
- Mehmedović, A.; Mesihović, R.; Saray, A.; Vanis, N. Gastric Cancer Staging: EUS and CT. Med. Arch. 2014, 68, 34–36. [Google Scholar] [CrossRef] [PubMed] [Green Version]
- Ahn, H.S.; Kim, S.H.; Kodera, Y.; Yang, H.-K. Gastric Cancer Staging with Radiologic Imaging Modalities and UICC Staging System. Dig. Surg. 2013, 30, 142–149. [Google Scholar] [CrossRef]
- Giganti, F.; Antunes, S.; Salerno, A.; Ambrosi, A.; Marra, P.; Nicoletti, R.; Orsenigo, E.; Chiari, D.; Albarello, L.; Staudacher, C.; et al. Gastric cancer: Texture analysis from multidetector computed tomography as a potential preoperative prognostic biomarker. Eur. Radiol. 2017, 27, 1831–1839. [Google Scholar] [CrossRef] [PubMed]
- Bosman, F.T.; Carneiro, F.; Hruban, R.H.; Theise, N.D. WHO Classification of Tumours of the Digestive System; World Health Organization: Geneva, Switzerland, 2010. [Google Scholar]
- Qadan, M.; Ma, Y.; Visser, B.C.; Kunz, P.L.; Fisher, G.A.; Norton, J.A.; Poultsides, G.A. Reassessment of the Current American Joint Committee on Cancer Staging System for Pancreatic Neuroendocrine Tumors. J. Am. Coll. Surg. 2014, 218, 188–195. [Google Scholar] [CrossRef]
- Kulke, M.H.; Shah, M.H.; Benson, A.B.; Bergsland, E.; Berlin, J.D.; Blaszkowsky, L.S.; Emerson, L.; Engstrom, P.F.; Fanta, P.; Giordano, T.; et al. Neuroendocrine Tumors, Version 1.2015. J. Natl. Compr. Cancer Netw. 2015, 13, 78–108. [Google Scholar] [CrossRef]
- Nie, R.-C.; Yuan, S.-Q.; Chen, X.-J.; Chen, S.; Xu, L.-P.; Chen, Y.-M.; Zhu, B.-Y.; Sun, X.-W.; Zhou, Z.-W.; Chen, Y. Endoscopic ultrasonography compared with multidetector computed tomography for the preoperative staging of gastric cancer: A meta-analysis. World J. Surg. Oncol. 2017, 15, 113. [Google Scholar] [CrossRef] [Green Version]
- McInnes, M.D.F.; Moher, D.; Thombs, B.D.; McGrath, T.A.; Bossuyt, P.M.; Clifford, T.; Cohen, J.F.; Deeks, J.J.; Gatsonis, C.; Hooft, L.; et al. Preferred Reporting Items for a Systematic Review and Meta-analysis of Diagnostic Test Accuracy Studies. JAMA 2018, 319, 388–396. [Google Scholar] [CrossRef]
- Hutton, B.; Salanti, G.; Caldwell, D.M.; Chaimani, A.; Schmid, C.H.; Cameron, C.; Ioannidis, J.P.; Straus, S.; Thorlund, K.; Jansen, J.P.; et al. The PRISMA Extension Statement for Reporting of Systematic Reviews Incorporating Network Meta-analyses of Health Care Interventions: Checklist and Explanations. Ann. Intern. Med. 2015, 162, 777–784. [Google Scholar] [CrossRef] [Green Version]
- Ahn, H.S.; Lee, H.-J.; Yoo, M.-W.; Kim, S.G.; Im, J.P.; Kim, S.H.; Kim, W.H.; Lee, K.U.; Yang, H.-K. Diagnostic accuracy of T and N stages with endoscopy, stomach protocol CT, and endoscopic ultrasonography in early gastric cancer. J. Surg. Oncol. 2009, 99, 20–27. [Google Scholar] [CrossRef] [PubMed]
- Román, M.C.; Higuera, C.D.L.S.; Vargas, L.A.L.; Fernández, C.B.; Andrés, J.B.; Rubiales, B.M.; Pérez, G.F.; Pérez-Miranda, M. Endoscopic ultrasound versus multidetector computed tomography in preoperative gastric cancer staging. Rev. Esp. Enferm. Dig. 2017, 109, 761–767. [Google Scholar] [CrossRef]
- Fairweather, M.; Jajoo, K.; Sainani, N.; Bertagnolli, M.M.; Wang, J. Accuracy of EUS and CT imaging in preoperative gastric cancer staging. J. Surg. Oncol. 2015, 111, 1016–1020. [Google Scholar] [CrossRef] [PubMed]
- Feng, X.-Y.; Wang, W.; Luo, G.-Y.; Wu, J.; Zhou, Z.-W.; Li, W.; Sun, X.-W.; Li, Y.-F.; Xu, D.-Z.; Guan, Y.-X.; et al. Comparison of Endoscopic Ultrasonography and Multislice Spiral Computed Tomography for the Preoperative Staging of Gastric Cancer Results of a Single Institution Study of 610 Chinese Patients. PLoS ONE 2013, 8, e78846. [Google Scholar] [CrossRef] [PubMed]
- Furukawa, K.; Miyahara, R.; Itoh, A.; Ohmiya, N.; Hirooka, Y.; Mori, K.; Goto, H. Diagnosis of the Invasion Depth of Gastric Cancer Using MDCT With Virtual Gastroscopy: Comparison With Staging With Endoscopic Ultrasound. Am. J. Roentgenol. 2011, 197, 867–875. [Google Scholar] [CrossRef]
- Giganti, F.; Orsenigo, E.; Arcidiacono, P.G.; Nicoletti, R.; Albarello, L.; Ambrosi, A.; Salerno, A.; Esposito, A.; Petrone, M.C.; Chiari, D.; et al. Preoperative locoregional staging of gastric cancer: Is there a place for magnetic resonance imaging? Prospective comparison with EUS and multidetector computed tomography. Gastric Cancer 2016, 19, 216–225. [Google Scholar] [CrossRef] [Green Version]
- Habermann, C.; Weiss, F.; Riecken, R.; Honarpisheh, H.; Bohnacker, S.; Staedtler, C.; Dieckmann, C.; Schoder, V.; Adam, G. Preoperative Staging of Gastric Adenocarcinoma: Comparison of Helical CT and Endoscopic US. Radiology 2004, 230, 465–471. [Google Scholar] [CrossRef]
- Hwang, S.W.; Lee, D.H.; Lee, S.H.; Park, Y.S.; Hwang, J.H.; Kim, J.-W.; Jung, S.H.; Kim, N.Y.; Kim, Y.H.; Lee, K.H.; et al. Preoperative staging of gastric cancer by endoscopic ultrasonography and multidetector-row computed tomography. J. Gastroenterol. Hepatol. 2010, 25, 512–518. [Google Scholar] [CrossRef]
- Ikoma, N.; Lee, J.H.; Bhutani, M.S.; Ross, W.A.; Weston, B.; Chiang, Y.-J.; Blum, M.A.; Sagebiel, T.; Devine, C.E.; Jr, A.M.; et al. Preoperative accuracy of gastric cancer staging in patient selection for preoperative therapy: Race may affect accuracy of endoscopic ultrasonography. J. Gastrointest. Oncol. 2017, 8, 1009–1017. [Google Scholar] [CrossRef] [Green Version]
- Li, J.; Shen, W.-Z.; Gu, X.-Q.; Hong, W.-K.; Wang, Z.-Q. Prognostic value of EUS combined with MSCT in predicting the recurrence and metastasis of patients with gastric cancer. Jpn. J. Clin. Oncol. 2017, 47, 487–493. [Google Scholar] [CrossRef] [Green Version]
- Perlaza, P.; Ortín, J.; Pagès, M.; Buxó, E.; Fernández-Esparrach, G.; Colletti, P.M.; Rubello, D.; Mayoral, M.; Sánchez, N.; Ruiz, C.; et al. Should 18F-FDG PET/CT Be Routinely Performed in the Clinical Staging of Locally Advanced Gastric Adenocarcinoma? Clin. Nucl. Med. 2018, 43, 402–410. [Google Scholar] [CrossRef] [PubMed]
- Polkowski, M.; Palucki, J.; Wronska, E.; Szawlowski, A.; Nasierowska-Guttmejer, A.; Butruk, E. Endosonography versus helical computed tomography for locoregional staging of gastric cancer. Endoscopy 2004, 36, 617–623. [Google Scholar] [CrossRef] [PubMed]
- Thakur, B.; Devkota, M.; Sharma, A.; Chaudhary, M. Evidence Based Surgical Approach to Locally Advanced Gastric Cancer. J. Nepal Heal. Res. Counc. 2019, 17, 133–140. [Google Scholar] [CrossRef] [PubMed]
- Chen, J.; Zhou, C.; He, M.; Zhen, Z.; Wang, J.; Hu, X. A Meta-Analysis and Systematic Review of Accuracy of Endoscopic Ultrasound for N Staging of Gastric Cancers. Cancer Manag. Res. 2019, 11, 8755–8764. [Google Scholar] [CrossRef] [PubMed] [Green Version]
- Lan, Z.; Hu, H.; Mandip, R.; Zhu, W.; Guo, W.; Wen, J.; Xie, F.; Qiao, W.; Venkata, A.; Huang, Y.; et al. Linear-array endoscopic ultrasound improves the accuracy of preoperative submucosal invasion prediction in suspected early gastric cancer compared with radial endoscopic ultrasound: A prospective cohort study. J. Gastroenterol. Hepatol. 2020, 35, 118–123. [Google Scholar] [CrossRef] [PubMed]
- Kim, J.; Chung, H.; Kim, J.L.; Lee, E.; Kim, S.G. Hierarchical Analysis of Factors Associated with T Staging of Gastric Cancer by Endoscopic Ultrasound. Dig. Dis. Sci. 2020. [Google Scholar] [CrossRef] [PubMed]
- Mocellin, S.; Pasquali, S. Diagnostic accuracy of endoscopic ultrasonography (EUS) for the preoperative locoregional staging of primary gastric cancer. Cochrane Database Syst. Rev. 2015, 2015, CD009944. [Google Scholar] [CrossRef]
- Amin, M.B.; Edge, S.B.; Greene, F.L. AJCC Cancer Staging Manual, 8th ed.; Springer: New York, NY, USA, 2017. [Google Scholar]
- Giganti, F.; Tang, L.; Baba, H. Gastric cancer and imaging biomarkers: Part 1—A critical review of DW-MRI and CE-MDCT findings. Eur. Radiol. 2019, 29, 1743–1753. [Google Scholar] [CrossRef] [Green Version]
- Wang, S.; Feng, C.; Dong, D.; Li, H.; Zhou, J.; Ye, Y.; Liu, Z.; Tian, J.; Wang, Y. Preoperative computed tomography-guided disease-free survival prediction in gastric cancer: A multicenter radiomics study. Med. Phys. 2020, 47, 4862–4871. [Google Scholar] [CrossRef]
- Watanabe, H.; Hayano, K.; Ohira, G.; Imanishi, S.; Hanaoka, T.; Hirata, A.; Kano, M.; Matsubara, H. Quantification of Structural Heterogeneity Using Fractal Analysis of Contrast-Enhanced CT Image to Predict Survival in Gastric Cancer Patients. Dig. Dis. Sci. 2020, 2020, 1–6. [Google Scholar] [CrossRef]


| Study | Edition of TNM Classification | Study Type | No. of Patients | Age, Years | Gender | Location, n |
|---|---|---|---|---|---|---|
| Ahn 2009 [12] | The 6th UICC | P | 434 | Mean (SD) = 55.9 (11.6) | 278 men 156 women | Upper = 39 Middle = 81 Lower = 311 Entire = 3 |
| Cimavilla-Roman 2017 [13] | The 7th AJCC | R | 42 | Mean (SD) = 70.04 (12.36) | 26 men 16 women | n/a |
| Fairweather 2015 [14] | The 7th AJCC | R | 49 | Median = 67 Range = 31–90 | 31 men 18 women | Antrum = 15 Cardia = 10 |
| Feng 2013 [15] | The 6th UICC | R | 610 | Median = 57 Range = 22–84 | 482 men 128 women | Upper = 272 Middle = 93 Lower = 232 Entire = 13 |
| Furukawa 2011 [16] | The 7th UICC | R | 175 | Mean (SD) = 66.3 (10.5) | 133 men 42 women | Upper = 28 Middle = 94 Lower = 57 Entire = 7 |
| Giganti 2016 [17] | The 7th UICC | P | 52 | Mean (SD) = 68.5 (1.35) Range: 43–85 | 33 men 19 women | Siewert II = 3 Siewert III = 4 Stomach = 45 |
| Habermann 2004 [18] | n/a | R | 51 | Mean = 62 Range = 47–76 | 34 men 17 women | Fundus = 2 Body = 14 Antrum = 29 Pyloric region = 6 |
| Hwang 2010 [19] | n/a | R | 277 | Mean = 53 IQR = 49–56 | 171 men 106 women | Cardia = 15 Body = 48 Angle = 24 Antrum = 46 Prepyloric = 8 |
| Ikoma 2017 [20] | The 7th AJCC | R | 145 | <65 = 86 ≥ 65 = 101 | 106 men 81 women | Body = 60 Antrum = 88 Gastroesophageal junction = 23 Cardia = 16 |
| Li 2017 [21] | The 5th UICC | P | 81 | Mean (SD) = 56.8 (11.51) | 58 men 23 women | n/a |
| Perlaza 2018 [22] | The 7th IUAC | P | 50 (-7 stenosis) | Mean (SD) = 65.7 (12.1) | 30 men 20 women | Fundus = 7 Body = 21 Antrum = 22 |
| Polkowski 2004 [23] | The 4th UICC | P | 88 | Mean = 63 IQR = 52.5–70 | 56 men 32 women | Upper third = 21 Upper + middle third = 21 Upper + middle + lower third = 6 Middle third = 13 Middle + lower third = 9 Lower third = 18 |
| Sensitivity (%) | Specificity (%) | |||||
|---|---|---|---|---|---|---|
| EUS Mean (95%CI) | MDCT Mean (95%CI) | Mean Difference (95%CI) p-Value | EUS Mean (95%CI) | MDCT Mean (95%CI) | Mean Difference (95%CI) p-Value | |
| T1 | 71 (43, 88) | 52 (26, 77) | 0.24 (0.01, 0.47) p = 0.04 | 93 (75, 98) | 94 (80, 98) | 0.00 (−0.01, 0.01) p = 0.52 |
| T2 | 67 (53, 79) | 59 (40, 76) | 0.06 (−0.21, 0.32) p = 0.67 | 83 (79, 87) | 80 (73, 85) | 0.03 (−0.03, 0.08) p = 0.32 |
| T3 | 64 (49, 76) | 63 (41, 82) | 0.01 (−0.15, 0.17) p = 0.90 | 84 (75, 91) | 81 (68, 89) | 0.04 (−0.03, 0.12) p = 0.25 |
| T4 | 52 (33, 70) | 66 (46, 81) | −0.07 (−0.23, 0.09) p = 0.38 | 95 (87, 98) | 96 (91, 98) | −0.01 (−0.03,0.02) p = 0.59 |
| N0 vs. N1+ | 79 (64, 89) | 73 (61, 82) | 0.07 (0.01, 0.13) p = 0.02 | 64 (37, 84) | 68 (53, 80) | −0.04 (−0.07, −0.01) p = 0.02 |
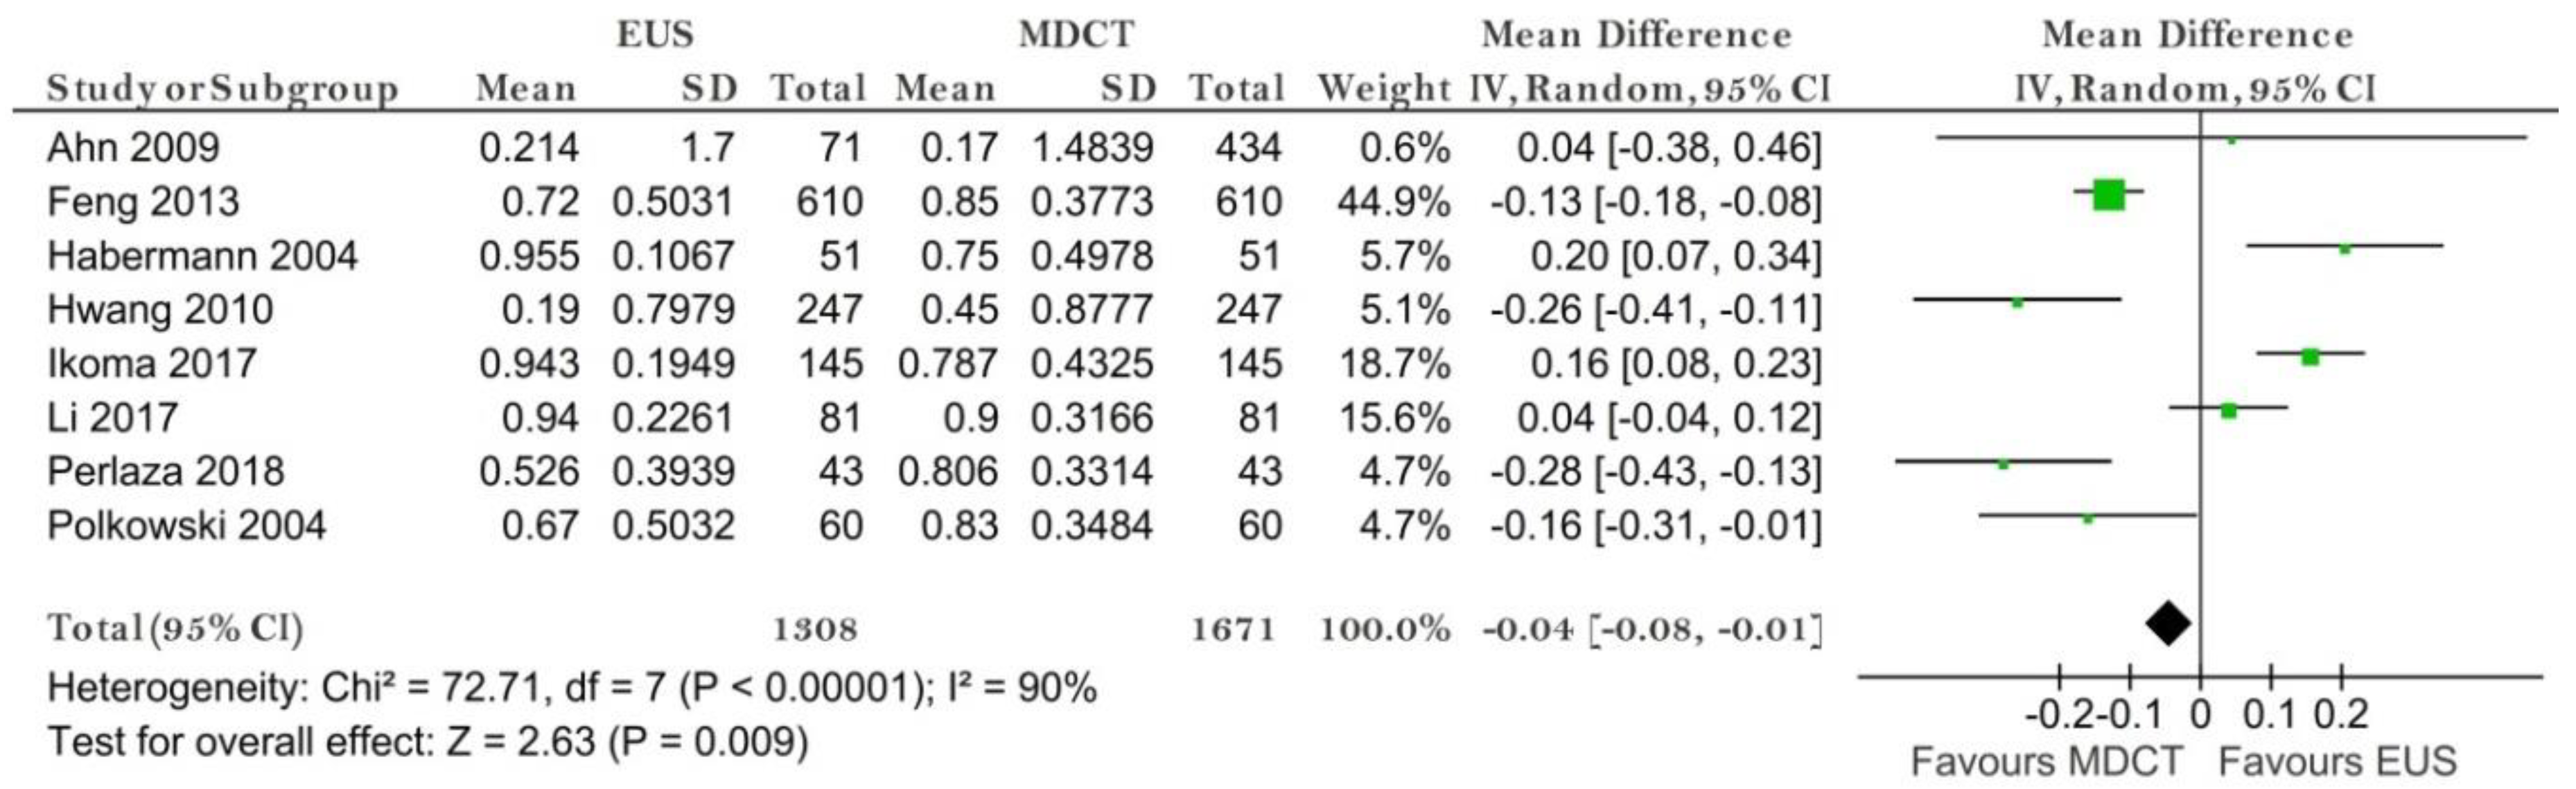
| N0 | 82 (62, 92) | 73 (60, 83) | 0.07 (0.02, 0.13) p = 0.01 | 70 (42, 88) | 71 (52, 85) | −0.04 (−0.08, −0.01) p = 0.009 |
| N1 | 45 (25, 66) | 49 (33, 65) | −0.05 (−0.26, 0.17) p = 0.68 | 80 (64, 91) | 75 (64, 83) | 0.00 (−0.07, 0.07) p = 0.98 |
| N2 | 30 (9, 66) | 56 (41, 71) | −0.21 (−0.39,−0.02) p = 0.03 | 90 (80, 95) | 87 (73, 94) | 0.05 (−0.04, 0.13) p = 0.31 |
| N3 | 16 (7, 34) | 21 (8, 46) | −0.02 (−0.12, 0.08) p = 0.74 | 99 (96, 99.9) | 97 (94, 98) | 0.02 (0.00, 0.03) p = 0.06 |
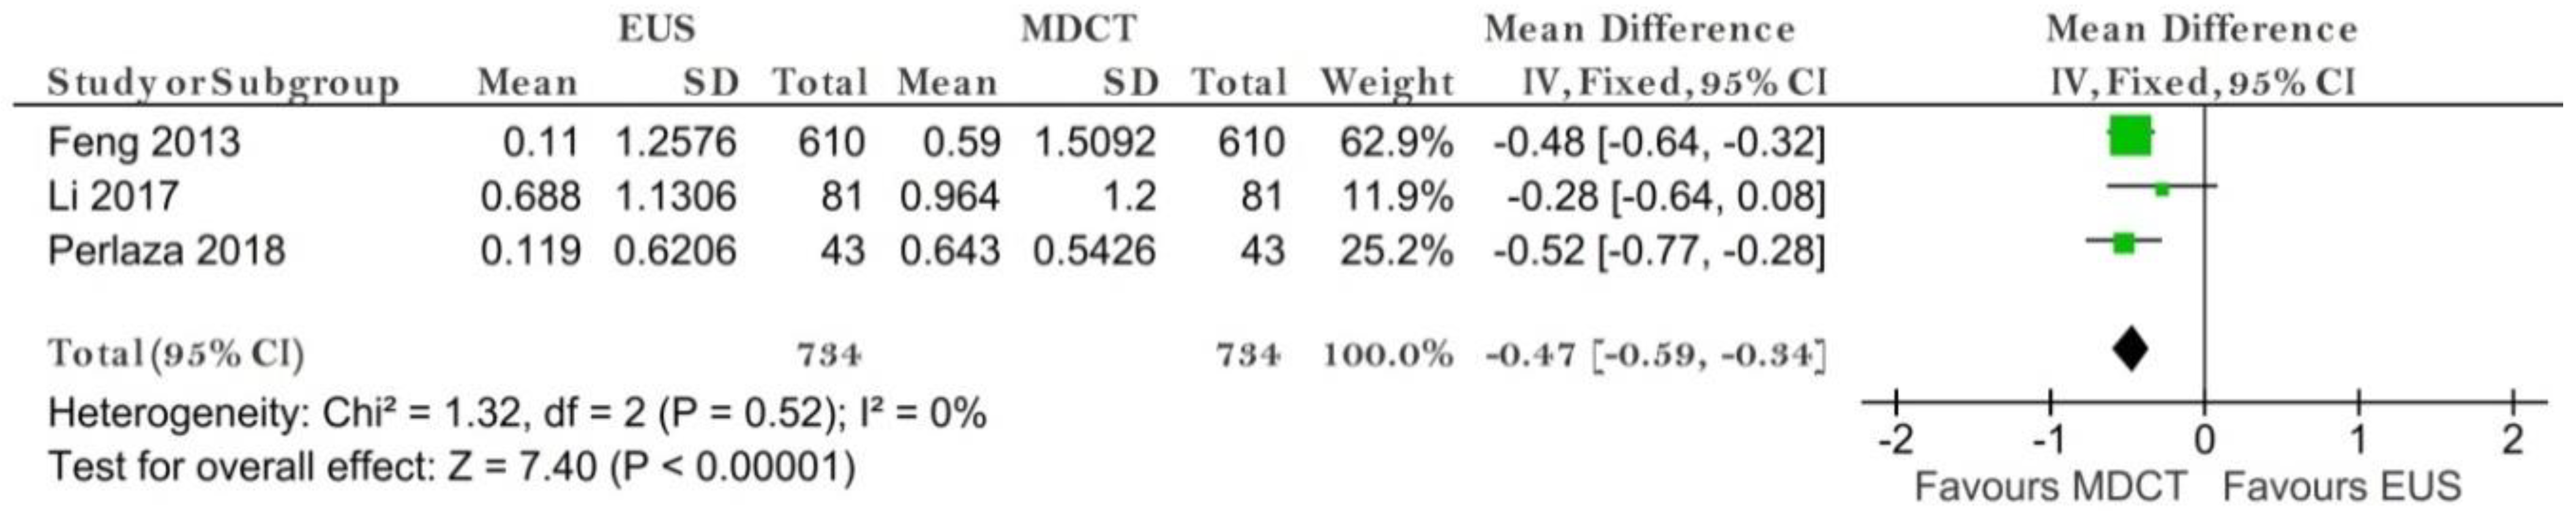
| M | 98 (85, 99) | 98 (85, 99.8) | −0.01 (−0.09, 0.07) p = 0.89 | 25 (5, 67) | 64 (52, 74) | −0.47 (−0.59,−0.34) p < 0.00001 |
| Sensitivity (%) | Specificity (%) | |||||
|---|---|---|---|---|---|---|
| EUS Mean (95%CI) | EUS + MDCT Mean (95%CI) | Mean Difference (95%CI) p-Value | EUS Mean (95%CI) | EUS + MDCT Mean (95%CI) | Mean Difference (95%CI) p-Value | |
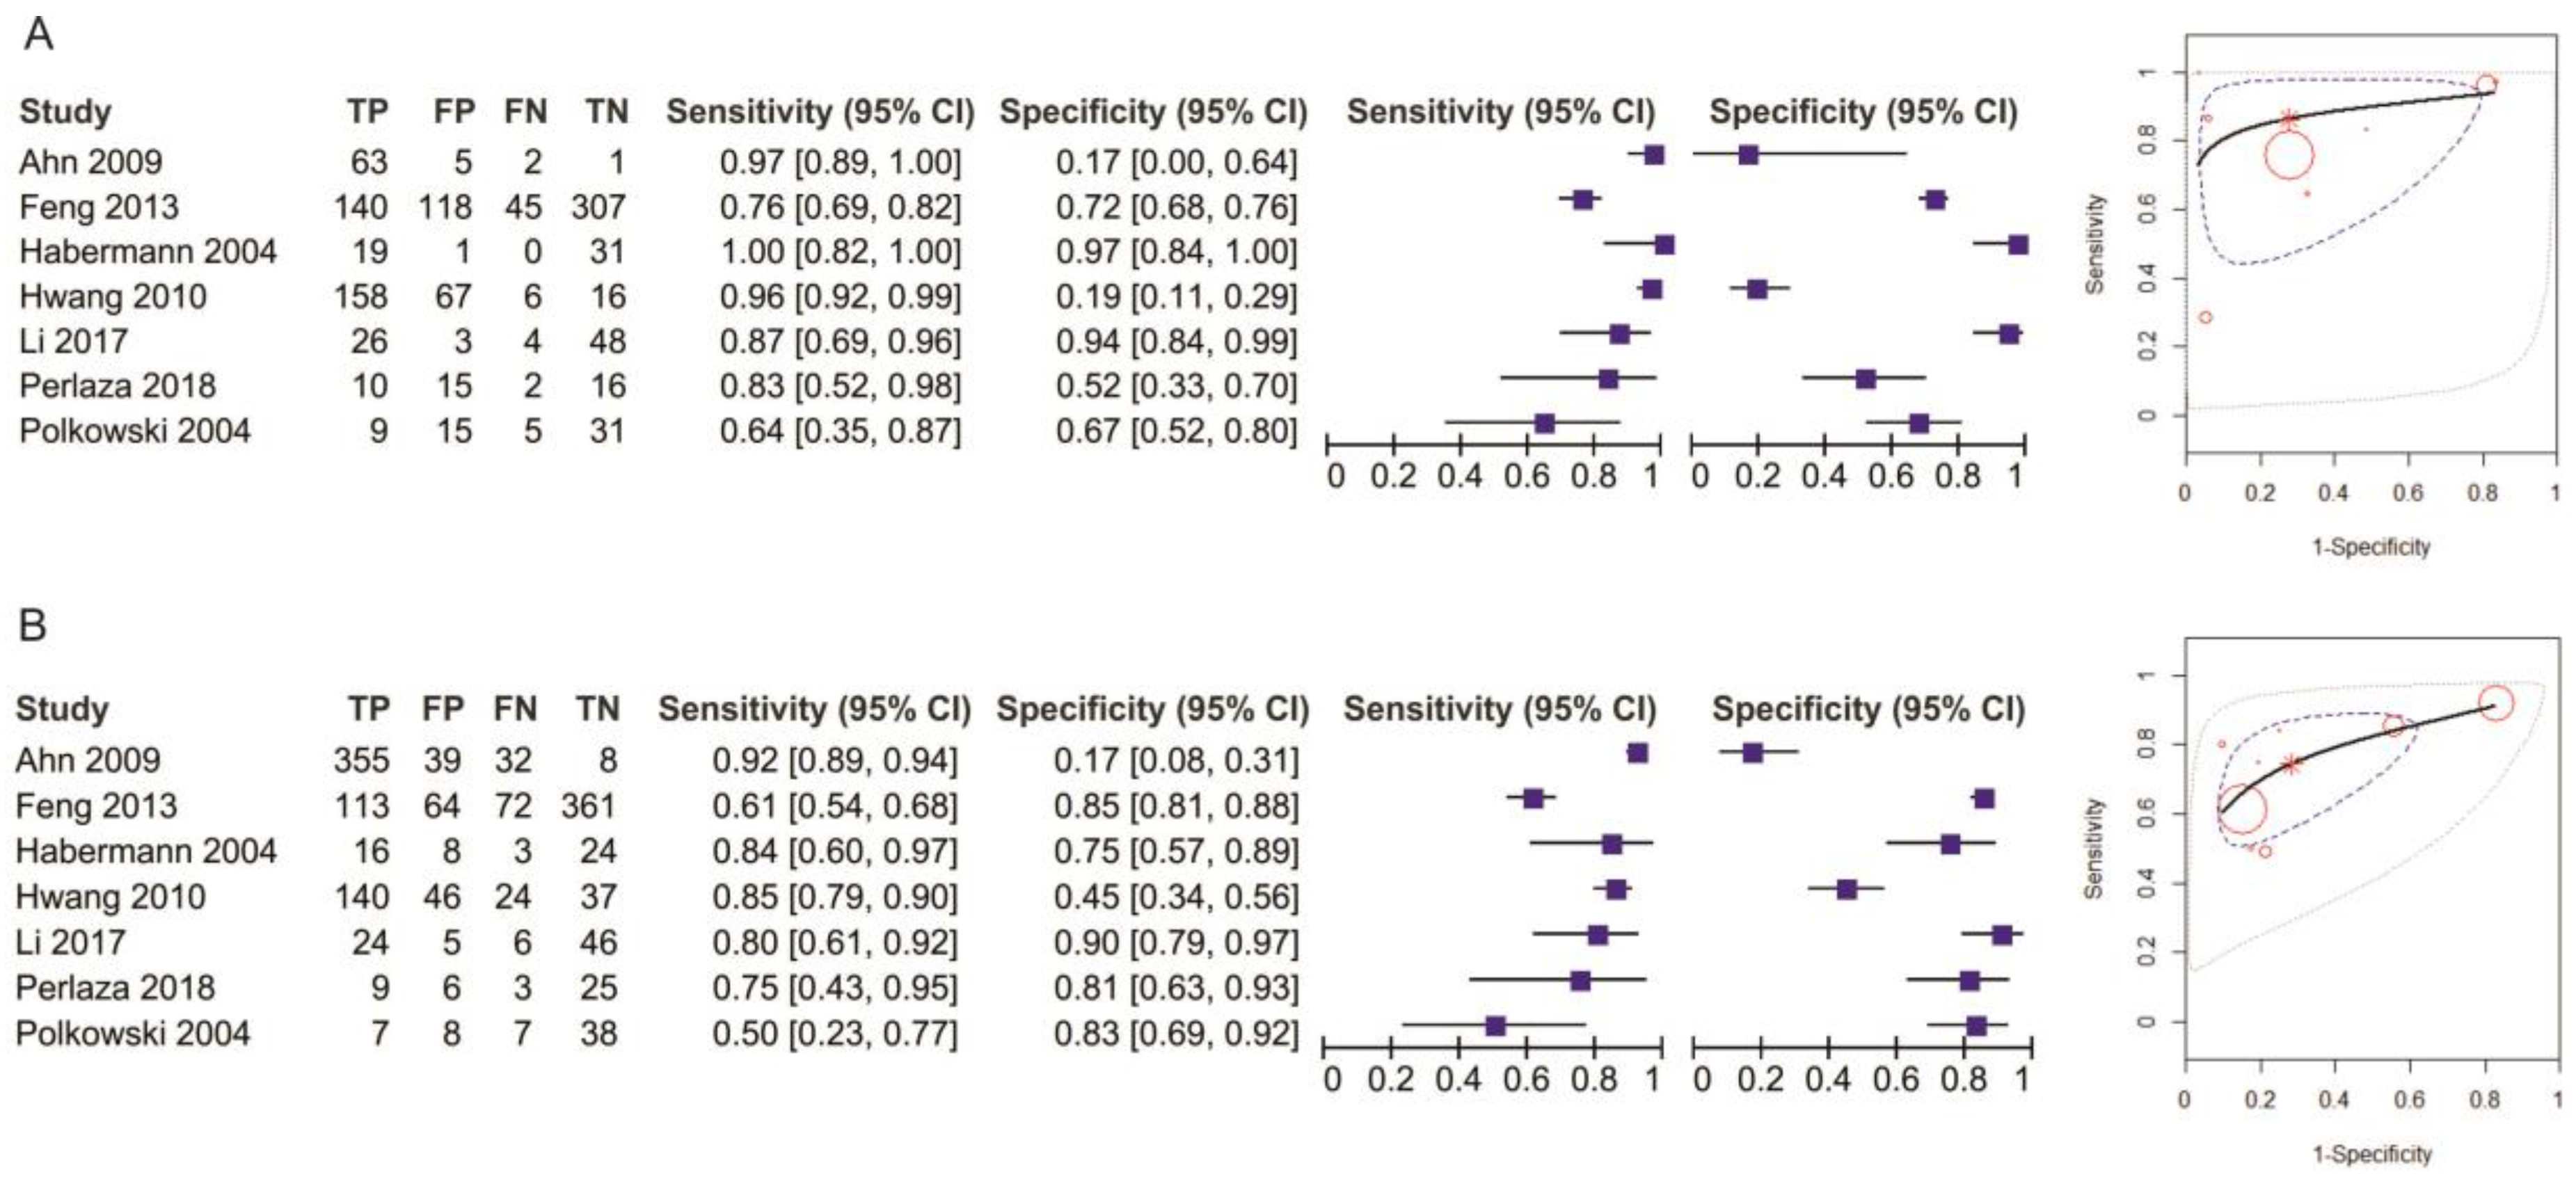
| T1 | 96 (88, 99) | 93 (74, 98) | 0.04 (−0.04, 0.12) p = 0.32 | 67 (1, 99) | 84 (18, 99) | 0.00 (−0.04, 0.04) p = 0.95 |
Publisher’s Note: MDPI stays neutral with regard to jurisdictional claims in published maps and institutional affiliations. |
© 2021 by the authors. Licensee MDPI, Basel, Switzerland. This article is an open access article distributed under the terms and conditions of the Creative Commons Attribution (CC BY) license (http://creativecommons.org/licenses/by/4.0/).
Share and Cite
Ungureanu, B.S.; Sacerdotianu, V.M.; Turcu-Stiolica, A.; Cazacu, I.M.; Saftoiu, A. Endoscopic Ultrasound vs. Computed Tomography for Gastric Cancer Staging: A Network Meta-Analysis. Diagnostics 2021, 11, 134. https://doi.org/10.3390/diagnostics11010134
Ungureanu BS, Sacerdotianu VM, Turcu-Stiolica A, Cazacu IM, Saftoiu A. Endoscopic Ultrasound vs. Computed Tomography for Gastric Cancer Staging: A Network Meta-Analysis. Diagnostics. 2021; 11(1):134. https://doi.org/10.3390/diagnostics11010134
Chicago/Turabian StyleUngureanu, Bogdan Silviu, Victor Mihai Sacerdotianu, Adina Turcu-Stiolica, Irina Mihaela Cazacu, and Adrian Saftoiu. 2021. "Endoscopic Ultrasound vs. Computed Tomography for Gastric Cancer Staging: A Network Meta-Analysis" Diagnostics 11, no. 1: 134. https://doi.org/10.3390/diagnostics11010134
APA StyleUngureanu, B. S., Sacerdotianu, V. M., Turcu-Stiolica, A., Cazacu, I. M., & Saftoiu, A. (2021). Endoscopic Ultrasound vs. Computed Tomography for Gastric Cancer Staging: A Network Meta-Analysis. Diagnostics, 11(1), 134. https://doi.org/10.3390/diagnostics11010134